a dissertation on crops discrimination researches...
TRANSCRIPT

A Dissertation on Crops Discrimination Researches using SAR Data
Erith .A. Munoz Ra
aHigh Spatial Studies Institute Mario Gulich, UNC/CONAE-ARGENTINA
Abstract
In this work a review of SAR imagery capability for crop discrimination is presented. It is very know that optical
images provided a suitable tool for crop discrimination since that results about classification overall reported are quite
satisfactory. However this kind of data set have shown disadvantages in some acquisition conditions, such as in cloudy
days where the penetration deep of optical instrument are seriously limited or in night condition where the absence of
sunlight make impossible the data acquisition. For this reason SAR imagery have relevant importance as a comple-
mented to optical data in order tu design a complete framework for crop discrimination. A brief dissertation about the
SAR properties and relevant results are also covered, and based on the research works cited some recommendations
for particular application are lodged.
Keywords: Remote Sensing, Synthetic Aperture Radar (SAR), Crop Discrimination
1. Introduction
1.1. Overview
Crop discrimination is usually an important step for
development and management of crop monitoring sys-
tems (Han et al., 2007). In the last two decades, has
been greatly increased the use of remote sensing tech-
niques for data assimilation to crop management and
crop yield forecasting models (Ding and Chen, 2012),
this is mainly due to, the use of remote sensing data
present many advantages over conventional methods, in
terms of economic investment and time, and spatial and
Email address: [email protected] (Erith .A. Munoz R)
temporal coverage of the analysis (Wardlow and Egbert,
2008).
Since remote sensing technology is used for crop dis-
crimination, both the theory and the technological tools
have been in constant development, this has led to a
remarkable increased in the range of applications and
scope of crop discrimination techniques. The most of
crop discrimination monitoring systems require as input
data associated with conditions of the plants and soil,
this data must not only be accurate and consistent, but
must also be available in appropriate spatial and tempo-
ral scales, which is quite feasible to reach from remote
platforms, such as via aircraft- and satellite-based sen-
sor systems (Pinter et al., 2003).
February 25, 2013

Crop discrimination types using remote sensing tech-
niques are based on the characterization and under-
standing of the electromagnetic behaviour of target.
This behaviour depends on the wavelength at which the
crop observation is performed, due to this, remote sen-
sors for Earth observation are designed to operate at
wavelengths in which the response of each target (crop
type) is characterized and known, facilitating on this
way the target identification in the scene.
It is important to note that the electromagnetic re-
sponse of the different parts of a crop cover not only
depend on the wavelength used for observation, it also
shows variations depending on the season, angle of inci-
dence of the sensor, crop’s features, illumination inten-
sity, weather phenomenon and topography among other
external factors. In this order of ideas, Pinter et al.
(2003) concluded that a significant challenge for agri-
cultural remote sensing applications is to be able to sep-
arate spectral signals originating with a plant response
to a specific stress from signals associated with normal
plant biomass or the background noise that is introduced
by exogenous non-plant factor.
1.2. Active and Pasive Microwave Sensors
Actually, there are various types of remote sensing
data available for identify crop types. In this context,
optical remote sensing data is between the most used,
some relevant application of this kind of data for sev-
eral sensors have been cited by Ding and Chen (2012),
and in the most of then have been reported remarkable
achievements due to the mature reached from the physi-
cal understanding about the response of crop for optical
bands. Nevertheless, under some whether conditions,
such as on cloudy days where multiple reflections gen-
erated by the presence of clouds prevent the sensor can
obtain relevant information about Earth’s surface, or for
night observation where the acquisition of useful opti-
cal data is seriously limited due to the sunlight absence
(Hsu et al., 2008), the ability of optical sensors for crop
monitoring is affected.
Other source of remote sensing data are the mi-
crowave sensors, whom have a great capability to pene-
trate clouds and to some extend rain, which mean a best
possibility of operate in a wider range of weather condi-
tions (Ulaby et al., 1981, Liu and Wu, 2001, Tian et al.,
2012), on the other hand microwave sensors are inde-
pendent of sun illumination, thereby having the capabil-
ity of operating both day and night. Another important
feature of microwave is that can penetrate deeper into
vegetation cover than optical waves, therefore it allows
a better description of the vegetation structure and in-
creases the references to discriminate crop types. this
features suggest that the information received by mi-
crowave sensors about the surface and structure of veg-
etation cover, varies from that obtained by optical, this
is the reason because some authors recommend the in-
tegrated use of both types of sensors to enhance the ca-
pabilities of crop types discrimination (Vincikova et al.,
2010).
There are two sources to get microwave remote sens-
ing data, active sensors and passive sensors. There is
some preference for the use of active sensors, perhaps
due to the fact that these have higher resolution than
passive sensors (Lu et al., 2008). The common active
sensor for microwave is the Synthetic Aperture Radar
(SAR), this sensor is called active because it uses its
own energy source to illuminate and measure the dif-
ference in power between the transmitted and received
electromagnetic radiation. The radar backscatter energy
depends on radar, target and external parameters. Fre-
2
quency or wavelength, polarization and angle of inci-
dence are primary parameters that define the features of
the radar backscattering, and everyone of these have an
important effect to be considered for evaluating the in-
teraction between the radar signal and the target.
When the effects of the target are considered, then the
effects associated with the radar take greater relevance.
For example, in the case of crops, the radar parameters
have variations on the influence on radar backscatter-
ing depending of the water content (Dielectric proper-
ties), orientation of leaves, or leaf shape and size (Geo-
metrical properties). Moreover, the external factors also
could alter the radar backscattering, as an example can
be mentioned the effect of seasons variability on crops
and also soil features under the crops cover (Herold,
2004).
1.3. Multichannel Characteristics of SAR data
Multichannel SAR data is required to provide mean-
ingful crop information. There are four general ways of
obtaining multichannel SAR data, a description about
the general features of these ways mentioned before
were given by Lopez-Sanchez and Ballester-Berman
(2009) in the next mode:
1. Multifrequency data: are acquired at different fre-
quency bands, generally combining low and high
microwave bands, thus becoming sensitive to dif-
ferent properties of the plants and different scales
of their components.
2. Multipolarization data: are acquired with differ-
ent combinations of transmit-receive polarizations.
This technique, generally named SAR polarimetry
(PolSAR), exploits the sensitivity of the wave po-
larization to the orientation, shape and dielectric
properties of the elements in the scene.
3. Multitemporal data: the scene is observed for a pe-
riod of time, providing time series of images cor-
responding to the temporal evolution of SAR data.
4. Multiangles data: are acquired over the same area
but from different incident angles, thus becom-
ing sensitive to different crop and soil proper-
ties. There exists a particular case of special in-
terest, named SAR interferometry (InSAR), which
consists in combining two complex images with
slightly different incidence angles. InSAR pro-
vides observables related to the vertical distribu-
tion of scattering centers
The use of multichannel data increases the set of pos-
sible observables to be related with the crop param-
eters, so many studies have analysed correlations be-
tween different observables and different physical pa-
rameters. Indeed, the use of multipolarized and mul-
tifrequency SAR data has yielded successful results in
a wide variety of applications, such as crop classifi-
cation and crop-type mapping, crop condition assess-
ment, plant pathology detection, biomass estimation,
soil moisture retrieval, soil tillage and crop residue map-
ping. Later, relevant works will be commented for each
of the multichannel modes explained before.
2. Texture Features of SAR data
Several investigations have been carried out in order
to develop tools for processing satellite data to improve
levels of discrimination of crop types of these sensors.
A methodology used in crop discrimination processes
using SAR imagery stems from the ability of these sen-
sors to identify texture features. It has been shown that
the inclusion of texture features in crop discrimination
3
with SAR imagery, when only one band and one po-
larization was used could produce kappa values higher
than 0.85 (Soares et al., 1997), however this value tends
to improve as more bands and polarizations are added
(Vincikova et al., 2010).
First order statistical methods are the simplest mea-
sures for the textural description of images. As a re-
sult, they are generally very poor at discriminating be-
tween different textures. Common features include mo-
ments such as mean, variance, dispersion, mean square
value or average energy, entropy, skewness and kurto-
sis (Srinivasan and G., 2008, Irons and Petersen, 1981,
Hsu, 1978).
In this context, it is useful to mention that the features
obtained from First Order Statistic provide information
about the grey-level distribution of the image, however
they do not give any information about the relative po-
sitions of the various gray levels within the image. In
other words, they describe the histogram of a greyscale
image and contain no spatial information about the im-
age they describe (Forbes, 2007). Due to this, there are
works in which have been implemented Second Order
Statistic methods in discrimination process added to the
First Order Statistic.
Second-order statistics operate on probability func-
tion, that measures the probability of a pair of pixel val-
ues occurring some vector ~d apart in the image. This
probability function is also called co-occurrence matrix,
since it measures the probability of co-occurrence of
two pixel values. Methods based on second-order statis-
tics (i.e. statistics given by pairs of pixels) have been
shown to achieve higher discrimination rates than the
power spectrum (transform-based) and structural meth-
ods (Weszka et al., 1976). Accordingly, the textures in
grey-level images are discriminated spontaneously only
if they differ in second order moments. It is important
to highlight that spatial gray level co-occurrence esti-
mates image properties related to second-order statis-
tics which considers the relationship among pixels or
groups of pixels (usually two). (Haralick et al., 1976)
suggested the use of gray level co-occurrence matri-
ces (GLCM) which have become one of the most well-
known and widely used texture features. This method
is based on the joint probability distributions of pairs of
pixels, GLCM show how often each gray level occurs at
a pixel located at a fixed geometric position relative to
each other pixel, as a function of the gray level.
GLCM has been commonly used for making crop
types description from texture measures of SAR im-
agery, its popularity could be attributed to the fact that
its definition can explicitly represent the relative fre-
quency between neighboring pixels, it means that the
different features derived from GLCM provides abun-
dant information about texture within an image. In
GLCM each element P(i, j)∆x,∆y of the gray-level cooc-
currence matrix represents the relative frequency with
which two neighboring pixels separated by a distance
of ∆x columns and ∆y lines occur, one with gray tone i
and the other with gray tone j.
In this vein, it is worth mentioning that an impor-
tant quality of the GLCM is the fact that from it can be
obtained 14 features on the texture of the image, even
when some of it have a high level of correlation with
others, either directly or indirectly. As it was mentioned
before, these texture parameters can be use for enhance
the crop types discrimination, due to some of them are
autocorrelated there are some techniques to select be-
tween theses parameters in order to have relevant mea-
sures of texture (Soares et al., 1997).
Therefore, the Gray-Level Difference Vector (GLDV)
4

approach is based on the absolute difference between
pairs of gray levels i and j at a distance ∆x columns
and ∆x lines apart at angle φ with a fixed direction. on
the other hand, another very relevant method is the Sum
and Difference Histogram (SADH) approach, which re-
places the second-order statistics probability function
of a co-occurrence matrix with estimates of the first-
order probability functions along the principal axes of
the co-occurrence matrix (Unser, 1986, Welch et al.,
1990). Among the main advantages provided SADH
stand; Nine of the GLCM textural features can be com-
puted directly from the SADH approach and also the
five other second-order features can be approximated by
assuming mutual independence be tween PS (k)∆x,∆y and
PD(l)∆x,∆y (Welch et al., 1990).
In this sense, Chen and Wang (1990) developed a
methodology called the texture spectrum (TS) approach
based in the concept of texture unit. A relevant re-
sult of this proposed method is that a texture unit is
represented by eight elements, which allows simultane-
ously, the mutidireccional extraction of the characteris-
tics of the texture of an image, unlike the Gray-Level
Co-ocurrence Matrix (GLCM) which permits it only in
the direction given by the vector displacement. For this
reason, this methodology has been the basis for various
applications reported (Umarani et al., 2008, Chang and
Chen, 2004)
In a later study, Al-Janobi (1999) reported results for
The co-occurrence features extracted from the cross-
diagonal texture matrix provide complete texture infor-
mation about an image incorporating the properties of
both the GLCM and TS methods.According with the
author the classification error was 2,4 % with features
from the cross-diagonal texture matrix, whereas the er-
rors were 18.9 and 38.7% with features from the GLCM
and TS, respectively.
3. Multichannel Capabilities of SAR data
3.1. Multi-Polarization and Multi-Frequency Features
Single channel SAR imagery have shown high perfor-
mance for crop discrimination, when is used with statis-
tical spectral or textural classifiers methods. However,
in several times have been suggested the use of multi-
channel SAR data in order to improve the overall classi-
fication accuracy (Lee et al., 2000). Because of the wide
range of information associated to the polarimetry and
frequency characteristics of SAR sensors, these param-
eters are between the most important to be considered in
the design of a radar mission. Although, it is desirable
to enable a multifrequency fully polarimetric SAR sys-
tem, there are some important factors that prevent this
possibility becomes reality.
Among the main factors that prevent the provision
of multifrequency fully polarimetric SAR space-borne
systems are: platform payload, data rate, mission bud-
get, require resolution, and area of coverage, others. In
this context, for a particular application is important to
know the optimum features required in order of design a
platform system that combines the needed basis for the
extraction of a complete information set. Some research
have reported relevant results in order to provide refer-
ences to select polarimetry and frequency features for
crop discrimination applications based in SAR imagery.
In order to investigate the benefit of polarimetric data
for crop type discrimination, Groot et al. (1993) deter-
mined useful polarimetric features to this purpose, and
also they inspected the co-polarized signatures for sev-
eral crop types.The investigation was based in the ex-
traction of the next polarimetric features:
5

1. The average backscattering coefficients: They
used the field average backscattering coeffiecients
γHH and the difference γVV − γHH and γHV − γHH
2. The average co-polarized phase difference: The
co-pol phase difference is the average difference
between the phase angles of the corresponding pix-
els 1 in the HH and the VV channels ¯φHH − ¯φVV
(Boerner et al., 1987), it was obtained together
with its standard deviation ∆( ¯φHH − ¯φVV ) from the
distribution of one look complex scattering matri-
ces withing the polygons .
3. The degree of polarization: Is given by the ratio
of the power in the polarized part of an electro-
magnetic wave to the total power in the electro-
magnetic wave. It was calculated from the Stokes
matrix data with vertically polarized incident radi-
ation (Born and Wolf, 1980).
4. The co-polarized signature: It was only shown
cross-cut along the χ = 0o axis for some cases.
For more information about this feature you can
see Van Zyl et al. (1987)
5. The orientation of the minimum linear polariza-
tion: They studied the distribution of orientation
angles of linearly polarized incidents waves for
which the backscattered power is a minimum. it
was denoted the mode of distribution as ψmin, this
is a useful feature since it let discriminate between
isotropic crop (as sugar beet) and anisotropic crop
types (as maize).
It was reported that is quite possible to discriminate
reliable bare soil fields from vegetation fields for the po-
larimetric data used. However, they were not able to
deduce statistically reliable and general results for the
1or group of pixels
crop discrimination between the differents crop types.
An exception was Lucerne which showed clear differ-
ences from the other crop types. Others remarkables
results reported by Groot et al. (1993) are that the scat-
tering by the underlying soil is dominant at P-band, also
flat signatures are specially found for potato and sugar
beet which have more isotropic backscattering proper-
ties. In the case of rough surface it was found that
σoHH < σo
VV which apparently indicates that vertically
polarized waves are better absorbed or scattered in other
directions than horizontally polarized waves.
Lee et al. (2000) adopted the supervised maximum
likelihood classification algorithm (MLC) based on the-
oretical speckle distributions of multi-polarization and
polarimetric SAR data to evaluate the classification ca-
pability of polarimetric P-, L- and C-band data from
JPL/AIRSAR. They shown that the phase difference be-
tween HH and VV co-polarization is an important factor
for crop classification (overall classification accuracy of
80,91%), due to the high correlation compared with the
cross-polarization case (see figure 1). In contrast, when
the phase difference is not included in the classification
the rate drops to 56,35%, this behaviour was attributed
tu the fact that the penetration deep of HH and VV po-
larizations are different for the crops under considera-
tion.
In this sense, Radionova (2009) highlighted the im-
portance of the interchannel phase information 2 in SAR
polarimetric data. The co-polar phase difference in an
important factor for crop classification specially in dual
polarization SAR data. He also found in histograms
of L-band phase difference for several crops class, that
2Compound by co-polar, cross-pol and the phase difference be-
tween HV and VH channel
6
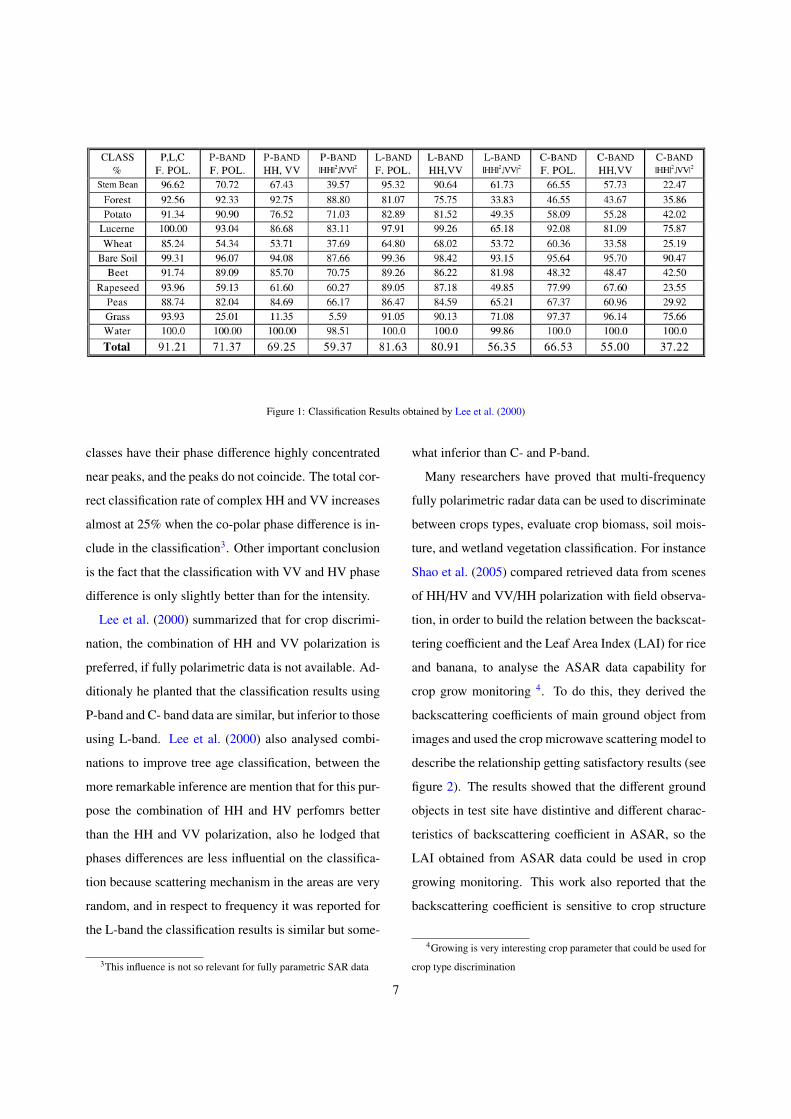
Figure 1: Classification Results obtained by Lee et al. (2000)
classes have their phase difference highly concentrated
near peaks, and the peaks do not coincide. The total cor-
rect classification rate of complex HH and VV increases
almost at 25% when the co-polar phase difference is in-
clude in the classification3. Other important conclusion
is the fact that the classification with VV and HV phase
difference is only slightly better than for the intensity.
Lee et al. (2000) summarized that for crop discrimi-
nation, the combination of HH and VV polarization is
preferred, if fully polarimetric data is not available. Ad-
ditionaly he planted that the classification results using
P-band and C- band data are similar, but inferior to those
using L-band. Lee et al. (2000) also analysed combi-
nations to improve tree age classification, between the
more remarkable inference are mention that for this pur-
pose the combination of HH and HV perfomrs better
than the HH and VV polarization, also he lodged that
phases differences are less influential on the classifica-
tion because scattering mechanism in the areas are very
random, and in respect to frequency it was reported for
the L-band the classification results is similar but some-
3This influence is not so relevant for fully parametric SAR data
what inferior than C- and P-band.
Many researchers have proved that multi-frequency
fully polarimetric radar data can be used to discriminate
between crops types, evaluate crop biomass, soil mois-
ture, and wetland vegetation classification. For instance
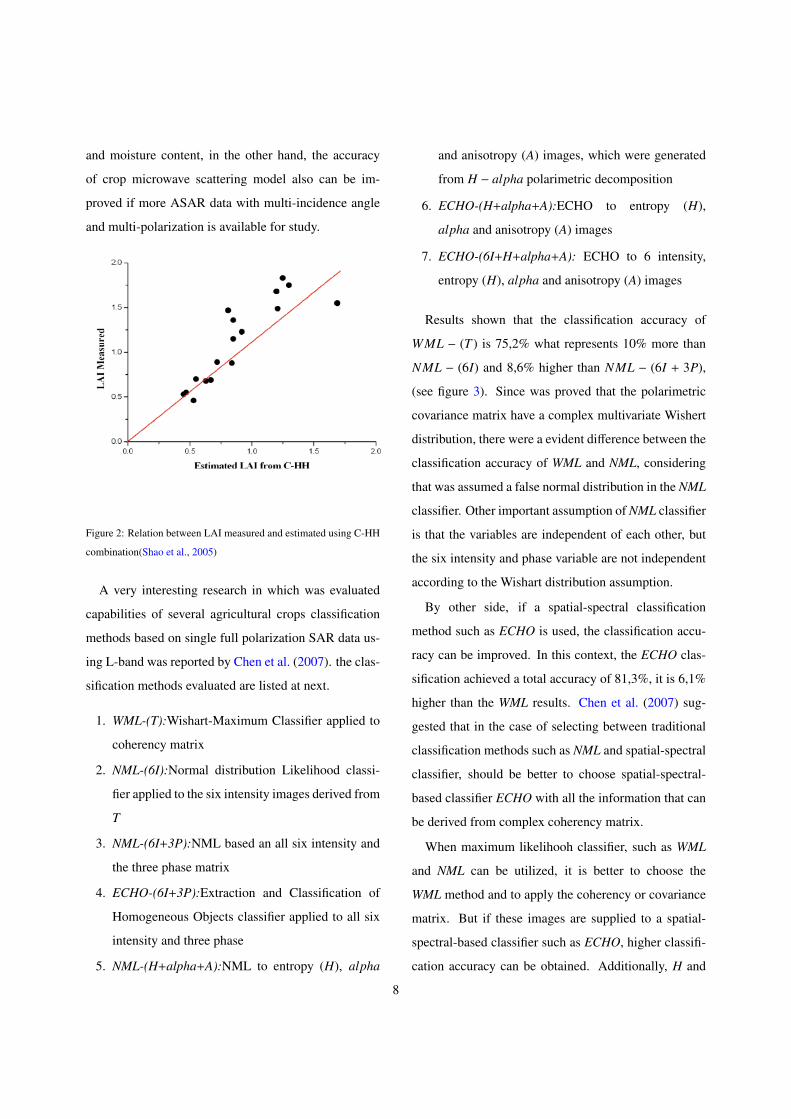
Shao et al. (2005) compared retrieved data from scenes
of HH/HV and VV/HH polarization with field observa-
tion, in order to build the relation between the backscat-
tering coefficient and the Leaf Area Index (LAI) for rice
and banana, to analyse the ASAR data capability for
crop grow monitoring 4. To do this, they derived the
backscattering coefficients of main ground object from
images and used the crop microwave scattering model to
describe the relationship getting satisfactory results (see
figure 2). The results showed that the different ground
objects in test site have distintive and different charac-
teristics of backscattering coefficient in ASAR, so the
LAI obtained from ASAR data could be used in crop
growing monitoring. This work also reported that the
backscattering coefficient is sensitive to crop structure
4Growing is very interesting crop parameter that could be used for
crop type discrimination
7
and moisture content, in the other hand, the accuracy
of crop microwave scattering model also can be im-
proved if more ASAR data with multi-incidence angle
and multi-polarization is available for study.
Figure 2: Relation between LAI measured and estimated using C-HH
combination(Shao et al., 2005)
A very interesting research in which was evaluated
capabilities of several agricultural crops classification
methods based on single full polarization SAR data us-
ing L-band was reported by Chen et al. (2007). the clas-
sification methods evaluated are listed at next.
1. WML-(T):Wishart-Maximum Classifier applied to
coherency matrix
2. NML-(6I):Normal distribution Likelihood classi-
fier applied to the six intensity images derived from
T
3. NML-(6I+3P):NML based an all six intensity and
the three phase matrix
4. ECHO-(6I+3P):Extraction and Classification of
Homogeneous Objects classifier applied to all six
intensity and three phase
5. NML-(H+alpha+A):NML to entropy (H), alpha
and anisotropy (A) images, which were generated
from H − alpha polarimetric decomposition
6. ECHO-(H+alpha+A):ECHO to entropy (H),
alpha and anisotropy (A) images
7. ECHO-(6I+H+alpha+A): ECHO to 6 intensity,
entropy (H), alpha and anisotropy (A) images
Results shown that the classification accuracy of
WML − (T ) is 75,2% what represents 10% more than
NML − (6I) and 8,6% higher than NML − (6I + 3P),
(see figure 3). Since was proved that the polarimetric
covariance matrix have a complex multivariate Wishert
distribution, there were a evident difference between the
classification accuracy of WML and NML, considering
that was assumed a false normal distribution in the NML
classifier. Other important assumption of NML classifier
is that the variables are independent of each other, but
the six intensity and phase variable are not independent
according to the Wishart distribution assumption.
By other side, if a spatial-spectral classification
method such as ECHO is used, the classification accu-
racy can be improved. In this context, the ECHO clas-
sification achieved a total accuracy of 81,3%, it is 6,1%
higher than the WML results. Chen et al. (2007) sug-
gested that in the case of selecting between traditional
classification methods such as NML and spatial-spectral
classifier, should be better to choose spatial-spectral-
based classifier ECHO with all the information that can
be derived from complex coherency matrix.
When maximum likelihooh classifier, such as WML
and NML can be utilized, it is better to choose the
WML method and to apply the coherency or covariance
matrix. But if these images are supplied to a spatial-
spectral-based classifier such as ECHO, higher classifi-
cation accuracy can be obtained. Additionally, H and
8
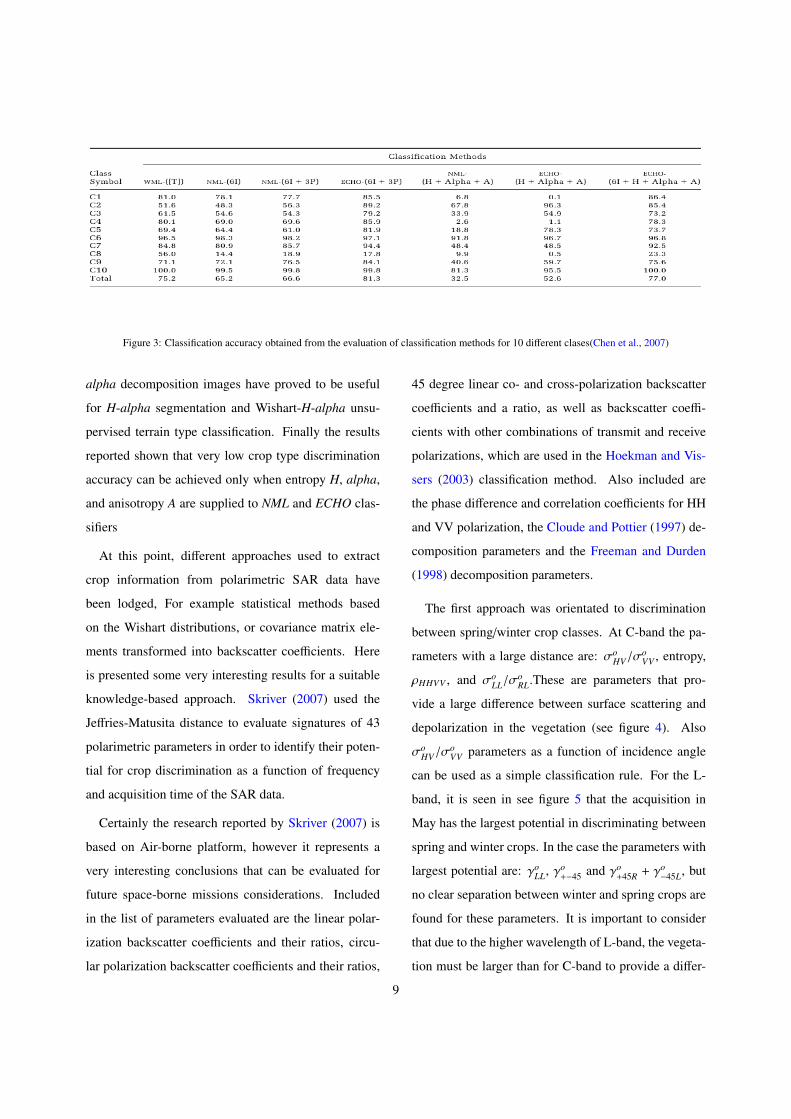
Figure 3: Classification accuracy obtained from the evaluation of classification methods for 10 different clases(Chen et al., 2007)
alpha decomposition images have proved to be useful
for H-alpha segmentation and Wishart-H-alpha unsu-
pervised terrain type classification. Finally the results
reported shown that very low crop type discrimination
accuracy can be achieved only when entropy H, alpha,
and anisotropy A are supplied to NML and ECHO clas-
sifiers
At this point, different approaches used to extract
crop information from polarimetric SAR data have
been lodged, For example statistical methods based
on the Wishart distributions, or covariance matrix ele-
ments transformed into backscatter coefficients. Here
is presented some very interesting results for a suitable
knowledge-based approach. Skriver (2007) used the
Jeffries-Matusita distance to evaluate signatures of 43
polarimetric parameters in order to identify their poten-
tial for crop discrimination as a function of frequency
and acquisition time of the SAR data.
Certainly the research reported by Skriver (2007) is
based on Air-borne platform, however it represents a
very interesting conclusions that can be evaluated for
future space-borne missions considerations. Included
in the list of parameters evaluated are the linear polar-
ization backscatter coefficients and their ratios, circu-
lar polarization backscatter coefficients and their ratios,
45 degree linear co- and cross-polarization backscatter
coefficients and a ratio, as well as backscatter coeffi-
cients with other combinations of transmit and receive
polarizations, which are used in the Hoekman and Vis-
sers (2003) classification method. Also included are
the phase difference and correlation coefficients for HH
and VV polarization, the Cloude and Pottier (1997) de-
composition parameters and the Freeman and Durden
(1998) decomposition parameters.
The first approach was orientated to discrimination
between spring/winter crop classes. At C-band the pa-
rameters with a large distance are: σoHV/σ
oVV , entropy,
ρHHVV , and σoLL/σ
oRL.These are parameters that pro-
vide a large difference between surface scattering and
depolarization in the vegetation (see figure 4). Also
σoHV/σ
oVV parameters as a function of incidence angle
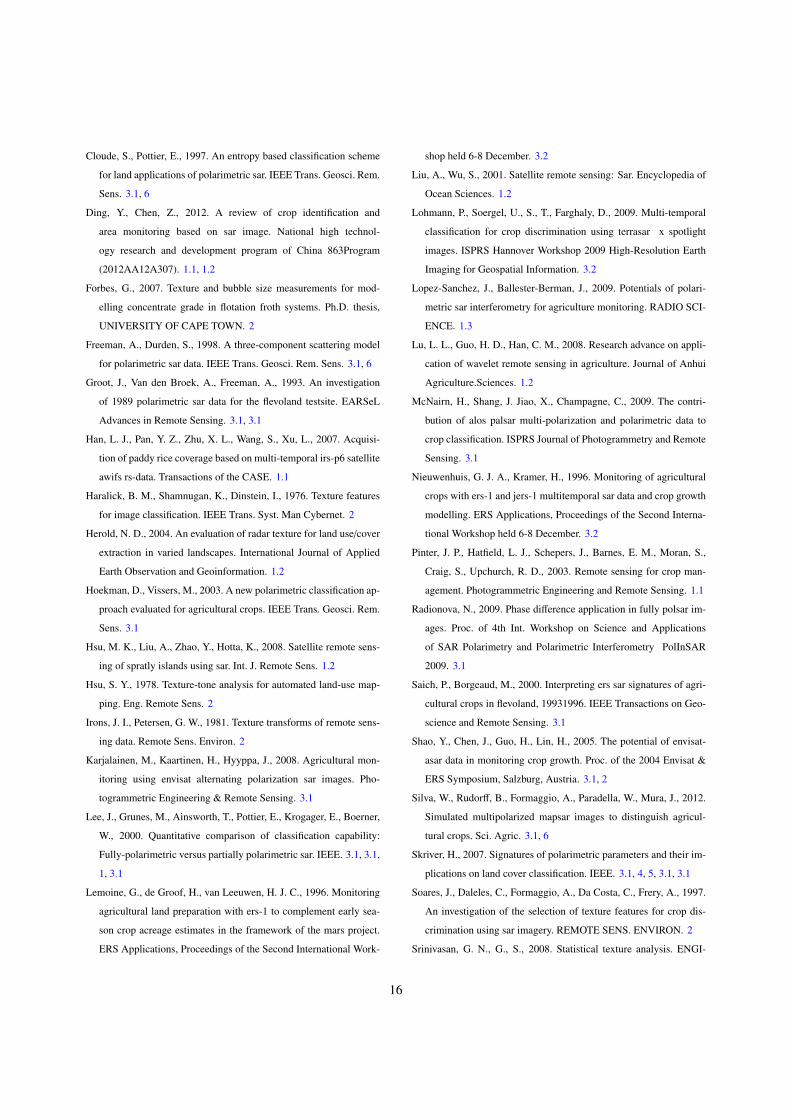
can be used as a simple classification rule. For the L-
band, it is seen in see figure 5 that the acquisition in
May has the largest potential in discriminating between
spring and winter crops. In the case the parameters with
largest potential are: γoLL, γo
+−45 and γo+45R + γ
o−45L, but
no clear separation between winter and spring crops are
found for these parameters. It is important to consider
that due to the higher wavelength of L-band, the vegeta-
tion must be larger than for C-band to provide a differ-
9
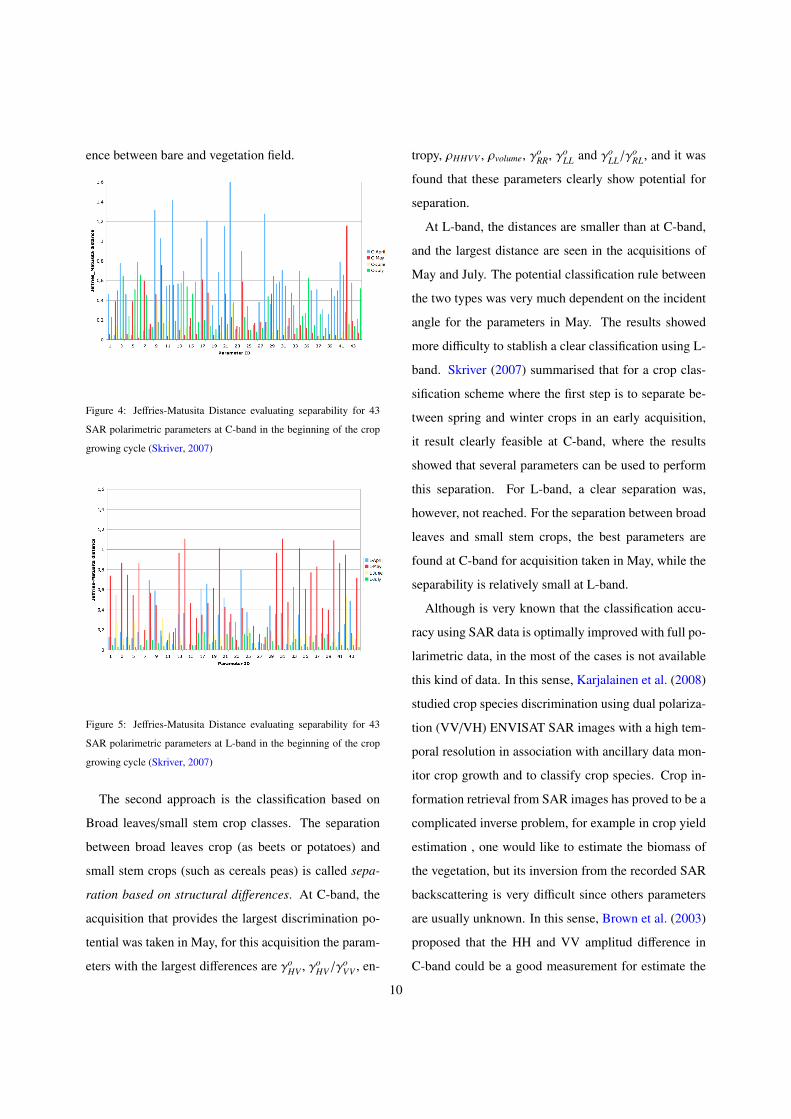
ence between bare and vegetation field.
Figure 4: Jeffries-Matusita Distance evaluating separability for 43
SAR polarimetric parameters at C-band in the beginning of the crop
growing cycle (Skriver, 2007)
Figure 5: Jeffries-Matusita Distance evaluating separability for 43
SAR polarimetric parameters at L-band in the beginning of the crop
growing cycle (Skriver, 2007)
The second approach is the classification based on
Broad leaves/small stem crop classes. The separation
between broad leaves crop (as beets or potatoes) and
small stem crops (such as cereals peas) is called sepa-
ration based on structural differences. At C-band, the
acquisition that provides the largest discrimination po-
tential was taken in May, for this acquisition the param-
eters with the largest differences are γoHV , γo
HV/γoVV , en-
tropy, ρHHVV , ρvolume, γoRR, γo
LL and γoLL/γ
oRL, and it was
found that these parameters clearly show potential for
separation.
At L-band, the distances are smaller than at C-band,
and the largest distance are seen in the acquisitions of
May and July. The potential classification rule between
the two types was very much dependent on the incident
angle for the parameters in May. The results showed
more difficulty to stablish a clear classification using L-
band. Skriver (2007) summarised that for a crop clas-
sification scheme where the first step is to separate be-
tween spring and winter crops in an early acquisition,
it result clearly feasible at C-band, where the results
showed that several parameters can be used to perform
this separation. For L-band, a clear separation was,
however, not reached. For the separation between broad
leaves and small stem crops, the best parameters are
found at C-band for acquisition taken in May, while the
separability is relatively small at L-band.
Although is very known that the classification accu-
racy using SAR data is optimally improved with full po-
larimetric data, in the most of the cases is not available
this kind of data. In this sense, Karjalainen et al. (2008)
studied crop species discrimination using dual polariza-
tion (VV/VH) ENVISAT SAR images with a high tem-
poral resolution in association with ancillary data mon-
itor crop growth and to classify crop species. Crop in-
formation retrieval from SAR images has proved to be a
complicated inverse problem, for example in crop yield
estimation , one would like to estimate the biomass of
the vegetation, but its inversion from the recorded SAR
backscattering is very difficult since others parameters
are usually unknown. In this sense, Brown et al. (2003)
proposed that the HH and VV amplitud difference in
C-band could be a good measurement for estimate the
10

biomass of crop.
Karjalainen et al. (2008) used altogether 12 EN-
VISAT alternating polarization SAR images5 colected
roughly at one-week intervals in the growing season
2003. The results of the VV polarization backscatter-
ing signatures of ENVISAT were similar to the results
obtained with EARS-1 satellite (Saich and Borgeaud,
2000). VH backscattering signatures showed an in-
crease of 3dB from bare soil to full crop cover, how-
ever, the problem of using VH polarization was that the
backscattering in the beginning of the growing season
was very close to the noise equivalent σo of ENVISAT
alternating polarization images. It is important to high-
light that the VH backscattering started to increase in
the middle of July, when crop height exceeded about
50cm on the average in our test parcels. In summary
Karjalainen et al. (2008) reported an overall classifica-
tion accuracy of 74,7%, when crop species classes of
grassland, potato, turnip rape, autumn rye, spring wheat,
barley, and oats were used. Furthermore lodged that the
30-meters spatial resolution of the ENVISAT SAR was
too low for detecting crop height variations within a par-
cel.
It have been shown the important influence that have
polarimetric and frecuency characteristics on crop dis-
crimination capabilities of SAR imagery. In this con-
text, an important application in order to evaluate the
monitoring of crop growth and rice-planted area was
reported by Suga and Konishi (2008) in which they
used multitemporal SAR data of TerraSAR-X(X-band),
ENVISAT-1/ASAR(C-band) and ALOS/PALSAR(L-
band) to investigate temporal change of SAR backscat-
tering coefficient during the rice growing cycle. Ad-
5VV and HH polarization
ditionally, ground truth data were measured simultane-
ously with satellite observation to analyse the correla-
tion between SAR backscattering and these parameters.
Such measurements included magnitudes as height of
plant, vegetation cover and LAI corresponding to SAR
observation.
Suga and Konishi (2008) found that the backscat-
tering coefficient of TerraSAR-X strip map mode data
changed from -40 to -10 dB in HH polarization and from
-45 to -32 dB in HV polarization and concluded that
TerraSAR-X was the best of the tree kinds of temporal
SAR data sets for rice crop monitoring using backscat-
tering coefficients of temporal change until 90 days af-
ter transplanting. By other side, ENVISAT-1/ASAR
showed that the backscattering coefficients with HH po-
larization indicate the highest value at -2 dB is these
SAR data. Furthermore, the backscattering coefficient
for HH polarization increase linearly until 90 days after
transplanting, which is very useful to monitor the rice
growing cycle. Respect to ALOS/PALSAR, the results
reported showed that the range of the backscattering co-
efficients in rice field is the smallest compared with C-
and C-band SAR for HH polarization.
The work reported by Suga and Konishi (2008) is a
clear example of the great importance that represents to
know about of the electromagnetic characteristics of the
target which is going to be analysed in order to choose
correct data or combination of data that provide more
capability of reaching the stated objective. As a refer-
ence table 1 shows, ordered by launch date, the main
operative space-borne platform at the present, there are
observed for each platform the center frequency, polar-
ization modes, and the maximum spatial resolution.
Continuing with this brief compilation of research
works orientated to crop discrimination techniques us-
11

Platform Freq./Pol.Spatial
Resol.(m)
TerraSAR-X X/dual-pol 1
RADARSAT-2 C/quad-pol 3
COSMO-SkyMed X/dual-pol 1
TecSAR X/quad-pol 1
RISAT C,X/dual-pol 3
TanDEM-X X/dual-pol 1
TerraSAR-L L/quad-pol 5
Table 1: Spaceborne SAR sensors
ing polarimetric data, it is cited the work of McNairn
et al. (2009), which tested the capability of PALSAR
multipolarization and polarimetric data for crop dis-
crimination. They used all L-band linear polarizations,
corn, soybeans, cereals, and hay-pasture were claasified
reporting an overall accuracy of 70%. After this, they
used a more temporally rich C-band data set achieving
an accuracy of 80%. By other side, they also used a mul-
tifrecuency data set, and an overall accuracy of 88,7%
was reached, and many individual crops where classi-
fied to accuracies better than 90%.
Although McNairn et al. (2009) found satisfactory re-
sults for linear polarization, they reported that L-band
parameters derived from decomposition approach6 pro-
duced superior crop classification accuracies relative to
those achieved using the linear polarization. As a com-
plementation, McNairn et al. (2009) compared classifi-
cation results obtained using L-HH and C-HH combina-
tions. They found that L-band provided slightly higher
overall classification accuracies, however, although the
6For example Cloude and Pottier (1997) and Freeman and Durden
(1998)
longer wavelenght L-band data were better at classify-
ing large biomass crops such as corn, while C-band pro-
vided better classifications for lower biomass crops such
as hay-pasture.
Since McNairn et al. (2009) work, it is feasible to
integrate multi-temporal SAR data from different plat-
form in order to improve the crop classification accu-
racy. It is important highlight that they suggested that
SAR images acquired early in the growing season pro-
duced the poorest accuracy, while late season SAR im-
ages were key to a successful classification. Based
on these results, a very interesting framework for crop
monitoring based on SAR imagery could be built inte-
grating methodologies of Skriver (2007) and McNairn
et al. (2009).
In a recent work, Silva et al. (2012) evaluated air-
borne data from MAPSAR sensor for make discrimi-
nation among crops through graphical and cluster anal-
ysis of mean backscatter values, considering single,
dual and triple polarizations. they reported that com-
bination of two polarizations could differentiate vari-
ous fields of crops, highlighting the combination VV-
HV that reached 78% overall accuracy. They also an-
nounced that the use of three polarization resulted in
85,4% overall accuracy, indicating that the classes pas-
ture and parallel coffee were fully discriminated from
the other classes (The results can be observed in fig-
ure 6).
Silva et al. (2012) showed that the use of only one po-
larization provide overall poor ability in crop discrimi-
nation, while using three single polarizations 7 signif-
icant variations and overlap could be observed among
classes. They analysed several classes in their work, for
7HH, VV, HV
12

example as coffee8. For VV polarization the coffee A
class presented greater values than the coffee B class,
while for HH polarization the coffee B had a higher
value than coffee A, this could be attributed to the differ-
ent number of plants that are exposed to the microwave
radiation depends on the row direction. It could be seen
in the way that when planting rows are perpendicular to
the sensor look direction, a higher number of plants and
less exposure of the soil are viewed, in comparison with
parallel rows. For HV polarization, pasture presented
the highest mean value.
Moreover, the use of two polarization provided par-
tial differentiation of the crops, for instance the VV-HV
polarization combination enabled the differentiation of
the greatest number of fields of the crops, with a kappa
coefficient of 0.701. In the HH-HV polarization combi-
nation, all pasture fields were separated from the other
classes, however the rest of the crop fields were highly
confused. For HH-VV polarization combination differ-
entiated coffee B well, and just one field of this crop was
confused with the other classes. Respect to the simulta-
neous use of the three polarization (VV-HH-HV) they
reported that improved discrimination among classes
raising the kappa coefficient to 0.804.
3.2. Multitemporal Approach
In the last section, were discussed some crop discrim-
ination approach based on multi-polarization and multi-
frequency SAR data. Also it was shown relevant results
and conclusions about how to combine these SAR data
features for some particulars applications. In this part, it
is lodged some research works in which have been inte-
grated different techniques for the extraction of crop dis-
crimination parameters and multi-temporal SAR data.
8Two different coffee species labelled as coffee A and coffee B
Between the range of applications of multitemporal
SAR data, crop growing monitoring has been studied by
many researchers. For instance, Lemoine et al. (1996)
used multitemporal ERS-1 data to analyse the backscat-
tering signature for early season crop discrimination.
This study, supported by numerous ancillary data sets,
showed that well-chosen early season imagery can sig-
nificantly improve crop class separation with ERS-1 im-
agery. Some results reported in this work show that
based in summer signatures only, it is not possible to
separate summer cereals from spring cereals, also they
found that the total backscattering variation associated
to bare soil is in the order of 6 dB which suggest and
sensitivity of ERS-1 instrument to soil moisture of 0.25
dB/vol%. It was also highlighted that the use of mete-
orological data allows to predict signal variation quite
accurately, except in summer season, due to soil wet-
ness induced signal variations, however, this is still ob-
vious in season summer even for fully developed crops
according to Lemoine et al. (1996).
The results reported by Lemoine et al. (1996) showed
classification accuracies up to 85% for the most of
the crop types, however this results sometimes were
hardly affected by misregistration, especially for small-
est fields and when ascending/descending combinations
were used. In other sense, it was also shown that spe-
cially signatures from the period February-May enhance
the possibility of separate classes due to the effect of
crop specific tillage on the backscattering coefficient.
In this context, Nieuwenhuis and Kramer (1996) found
that in the beginning of the crop growing season can be
observed large fluctuation on backscattering due to the
difference in soil preparation and change in soil mois-
ture conditions.
Multitemporal data have a lot of benefits, for exam-
13

Figure 6: Classification accuracy obtained from the evaluation of different polarimetric combinations for some classes(Silva et al., 2012)
ple it can be evaluated using statistical analysis texture
features to improve the classification accuracy. In this
context, Tso and Mather (1999) evaluated a variety of
dataset derived from multitemporal ERS-1 for crop dis-
crimination. They compared pixel-based classifications
with per-field classification, reaching the second a better
performance giving accuracies higher than 75%, respect
to 60% obtained by pixel-based method, if a suitable
classifier is used. It was also reported that this accuracy
can be enhance if the SAR datasets are combined with
optical imagery. They proved several classifiers to per-
form this comparative analysis finding that for both the
per-pixel and the per-field experiments the neural based
Kohonen’s self-organized feature map (SOM) classifier
produced a better result than any of the statistical clas-
sifiers as measured by overall classification accuracy.
Multitemporal data have been also useful to eval-
uate the potential of SAR in substituting optical im-
ages for early crop discrimination, for example Yakam-
Simen et al. (1999) analized the operational feasibil-
ity of very early RADARSAT based acreage estima-
tion of non-cultivated terrain and economically impor-
tant crops during spring and early early summer report-
ing a complete successful in achieving this goal based
on the statistical analysis of the data. Other relevant ad-
vantages from using multitenporal data is the possibility
of retrieving bio-physical parameters through different
extraction techniques. In this context, Verhoest et al.
(2000) based on the sensitivity of microwave backscat-
tering from bare soil surfaces to the moisture content of
the upper soil layer used a principal component analy-
sis on a winter time series of eight speckle filtered ERS
images to separate topography, soil moisture and vege-
tation effects within the signal implementing Wavelet-
Based filtering techniques.
The used of advanced processing techniques has im-
proved considerably the range of information extracted
from multitemporal SAR datasets. Waske and Schiefer
(2006) reported classification accuracy of 78,2% that
shows that multitemporal SAR daa from an area dom-
inated by agriculture can be successfully classified us-
ing Support Vector Machine (SVM). A recent and very
interesting research was carried out by Lohmann et al.
(2009), they applied a standard pixel-based Maximum
Likelihood classification techniques, to obtain multi-
temporal classification, of TerraSAR-X image pairs
(HH and VV) amended by the use of regional crop cal-
endar to account for seasonal variations of specific culti-
14

vations with respect to permanent crops. They reported
a considerable classification accuracy of more than 75%
and suggested that the improvement of the datasets pre-
processing can enhance the results.
Other results presented by Lohmann et al. (2009),
showed that based on three different strategies for super-
vised classification (pixel-based Maximum Likelihood)
listed as:
1. Based on entired set of dual-pol images (all)
2. Using images according to crop calendar (Cal)
3. Using images as indicated by factor analysis
(SPSS)
And taking an area of 176 hectares for the analysis.
They found for all strategy a classification overall accu-
racy of approximately 100% was achieved, for Cal 98%
while for SPSS 87%, when asparagus, pasture, winter
grains, sugar beets, pea beans, potatoes, and maize cops
are analysed. Furthermore, they suggested some com-
binations using VV and HH polarization to improve the
classification accuracy.
The work cited here are a brief sample of the mul-
titemporal SAR datasets capabilities for crop type dis-
crimination, this coupled with the multifrequency and
multipolarimetric features of SAR data and the use of
optical data are a powerful tool for improve crop classi-
fication methodologies.
4. Conclusion
In order to highlight the SAR data capability for crop
discrimination, in this work have been presented sev-
eral research work in which have been reported tech-
niques and results that justified the feasibility of SAR
imagery for crop discrimination. Furthermore, based on
such works was presented a dissertation about SAR pa-
rameters that can be used for particulars applications.
The high results observed, allows to conclude that
the use of SAR imagery can be operatively imple-
mented into crop monitoring. Although when the SAR
imagery demands more pre-processing and processing
techniques, this characteristics is due to intrinsic pro-
perties that complemented with optical images conform
a suitable satellite framework for agricultural manage-
ment. Properties such as multipolarization or multifre-
cuency escenes acquisition enhance the discriminative
potential of SAR imagery to crop discrimination. All
these factors, coupled with the constants technological
and theoretical progress in SAR imagery systems, make
of SAR instrument a promising way to find solutions for
a many difficulties that represents a challenge for agri-
cultural development systems in the near future.
References
Al-Janobi, A., 1999. Performance evaluation of cross-diagonal texture
matrix method of texture analysis. Elsevier Science Ltd. 2
Boerner, W. M., Foo, B.-Y., Eom, H., 1987. Interpretation of po-
larimetric copolarization phase term in the radar images obtained
by the jpl airborne l-band sar system. IEEE Transactions on Geo-
science and Remote Sensing. 2
Born, M., Wolf, E., 1980. Principles of optics. Pergamon Press, New
York. 3
Brown, S., Quegan, S., Morrison, K., Bennett, J., Cookmartin,
G., 2003. High-resolution measurements of scattering in wheat
canopies-implications for crop parameter retrieval. IEEE Transac-
tions on Geoscience and Remote Sensing. 3.1
Chang, C., Chen, Y., 2004. Gradient texture unit coding for texture
analysis. Opt. Eng. 2
Chen, C. H., Wang, L., 1990. Texture unit, texture spectrum, and tex-
ture analysis. IEEE Trans. Geosci. Remote Sens. 2
Chen, E., Li, Z., Pang, Y., Tian, X., 2007. Quantitative evalua-
tion of polarimetric classification for agricultural crop mapping.
PHOTOGRAMMETRIC ENGINEERING & REMOTE SENS-
ING. 3.1, 3.1, 3
15
Cloude, S., Pottier, E., 1997. An entropy based classification scheme
for land applications of polarimetric sar. IEEE Trans. Geosci. Rem.
Sens. 3.1, 6
Ding, Y., Chen, Z., 2012. A review of crop identification and
area monitoring based on sar image. National high technol-
ogy research and development program of China 863Program
(2012AA12A307). 1.1, 1.2
Forbes, G., 2007. Texture and bubble size measurements for mod-
elling concentrate grade in flotation froth systems. Ph.D. thesis,
UNIVERSITY OF CAPE TOWN. 2
Freeman, A., Durden, S., 1998. A three-component scattering model
for polarimetric sar data. IEEE Trans. Geosci. Rem. Sens. 3.1, 6
Groot, J., Van den Broek, A., Freeman, A., 1993. An investigation
of 1989 polarimetric sar data for the flevoland testsite. EARSeL
Advances in Remote Sensing. 3.1, 3.1
Han, L. J., Pan, Y. Z., Zhu, X. L., Wang, S., Xu, L., 2007. Acquisi-
tion of paddy rice coverage based on multi-temporal irs-p6 satellite
awifs rs-data. Transactions of the CASE. 1.1
Haralick, B. M., Shamnugan, K., Dinstein, I., 1976. Texture features
for image classification. IEEE Trans. Syst. Man Cybernet. 2
Herold, N. D., 2004. An evaluation of radar texture for land use/cover
extraction in varied landscapes. International Journal of Applied
Earth Observation and Geoinformation. 1.2
Hoekman, D., Vissers, M., 2003. A new polarimetric classification ap-
proach evaluated for agricultural crops. IEEE Trans. Geosci. Rem.
Sens. 3.1
Hsu, M. K., Liu, A., Zhao, Y., Hotta, K., 2008. Satellite remote sens-
ing of spratly islands using sar. Int. J. Remote Sens. 1.2
Hsu, S. Y., 1978. Texture-tone analysis for automated land-use map-
ping. Eng. Remote Sens. 2
Irons, J. I., Petersen, G. W., 1981. Texture transforms of remote sens-
ing data. Remote Sens. Environ. 2
Karjalainen, M., Kaartinen, H., Hyyppa, J., 2008. Agricultural mon-
itoring using envisat alternating polarization sar images. Pho-
togrammetric Engineering & Remote Sensing. 3.1
Lee, J., Grunes, M., Ainsworth, T., Pottier, E., Krogager, E., Boerner,
W., 2000. Quantitative comparison of classification capability:
Fully-polarimetric versus partially polarimetric sar. IEEE. 3.1, 3.1,
1, 3.1
Lemoine, G., de Groof, H., van Leeuwen, H. J. C., 1996. Monitoring
agricultural land preparation with ers-1 to complement early sea-
son crop acreage estimates in the framework of the mars project.
ERS Applications, Proceedings of the Second International Work-
shop held 6-8 December. 3.2
Liu, A., Wu, S., 2001. Satellite remote sensing: Sar. Encyclopedia of
Ocean Sciences. 1.2
Lohmann, P., Soergel, U., S., T., Farghaly, D., 2009. Multi-temporal
classification for crop discrimination using terrasar x spotlight
images. ISPRS Hannover Workshop 2009 High-Resolution Earth
Imaging for Geospatial Information. 3.2
Lopez-Sanchez, J., Ballester-Berman, J., 2009. Potentials of polari-
metric sar interferometry for agriculture monitoring. RADIO SCI-
ENCE. 1.3
Lu, L. L., Guo, H. D., Han, C. M., 2008. Research advance on appli-
cation of wavelet remote sensing in agriculture. Journal of Anhui
Agriculture.Sciences. 1.2
McNairn, H., Shang, J. Jiao, X., Champagne, C., 2009. The contri-
bution of alos palsar multi-polarization and polarimetric data to
crop classification. ISPRS Journal of Photogrammetry and Remote
Sensing. 3.1
Nieuwenhuis, G. J. A., Kramer, H., 1996. Monitoring of agricultural
crops with ers-1 and jers-1 multitemporal sar data and crop growth
modelling. ERS Applications, Proceedings of the Second Interna-
tional Workshop held 6-8 December. 3.2
Pinter, J. P., Hatfield, L. J., Schepers, J., Barnes, E. M., Moran, S.,
Craig, S., Upchurch, R. D., 2003. Remote sensing for crop man-
agement. Photogrammetric Engineering and Remote Sensing. 1.1
Radionova, N., 2009. Phase difference application in fully polsar im-
ages. Proc. of 4th Int. Workshop on Science and Applications
of SAR Polarimetry and Polarimetric Interferometry PolInSAR
2009. 3.1
Saich, P., Borgeaud, M., 2000. Interpreting ers sar signatures of agri-
cultural crops in flevoland, 19931996. IEEE Transactions on Geo-
science and Remote Sensing. 3.1
Shao, Y., Chen, J., Guo, H., Lin, H., 2005. The potential of envisat-
asar data in monitoring crop growth. Proc. of the 2004 Envisat &
ERS Symposium, Salzburg, Austria. 3.1, 2
Silva, W., Rudorff, B., Formaggio, A., Paradella, W., Mura, J., 2012.
Simulated multipolarized mapsar images to distinguish agricul-
tural crops. Sci. Agric. 3.1, 6
Skriver, H., 2007. Signatures of polarimetric parameters and their im-
plications on land cover classification. IEEE. 3.1, 4, 5, 3.1, 3.1
Soares, J., Daleles, C., Formaggio, A., Da Costa, C., Frery, A., 1997.
An investigation of the selection of texture features for crop dis-
crimination using sar imagery. REMOTE SENS. ENVIRON. 2
Srinivasan, G. N., G., S., 2008. Statistical texture analysis. ENGI-
16

NEERING AND TECHNOLOGY. 2
Suga, Y., Konishi, T., 2008. Rice crop monitoring using x, c and l
band sar data. Remote Sensing for Agriculture, Ecosystems, and
Hydrology. 3.1
Tian, X., Chen, E., Li, Z., Ling, F., Bai, L., Wang, F., 2012. Rice/dry-
land crop discrimination using multi-polarization satellite sar dataa
case study in haian county of jiangsu province. Remote Sensing
Technology and Application. 1.2
Tso, B., Mather, P. M., 1999. Crop discrimination using multi-
temporal sar imagery. Int. J. Remote Sens. 3.2
Ulaby, F., Moore, R., Fung, A., 1981. Microwave remote sensing.
Active and Passive. 1.2
Umarani, C., Ganesan, L., Radhakrishnan, S., 2008. Combined sta-
tistical and structural approach for unsupervised texture classifi-
cation. INTERNATIONAL JOURNAL OF IMAGING SCIENCE
AND ENGINEERING (IJISE). 2
Unser, M., 1986. Sum and difference histograms for texture classifi-
cation. IEEE Trans. Patter Anal. Math. Intell. 2
Van Zyl, J., Zebker, H., Elachi, C., 1987. Imaging radar polarization
signatures: Theory and observation. Radio Science. 4
Verhoest, N., Pizurica, A., Philips, W., De Troch, F., 2000. The ap-
plication of wavelet-based filtering techniques for retrieving bio-
physical parameters from multi-temporal ers-images. ESA ERS-
ENVISAT symposium: Looking down to earth in the new mille-
nium. Presented at the ESA ERS-ENVISAT Symposium: Looking
down to earth in the new millenium, Noordwijk, The Netherlands:
ESA Publications Division. 3.2
Vincikova, H., Hais, M., Brom, J., Prochazka, J. Pecharova, E.,
2010. Use of remote sensing methods in studying agricultural
landscapes-a review. Journal of Landscape Studies 3. 1.2, 2
Wardlow, B. D., Egbert, S. L., 2008. Large-area crop mapping using
time-series modis 250m ndvi data: An assessment for the u.s. cen-
tral great plains. Remote Sensing of Environment. 1.1
Waske, B., Schiefer, S., 2006. Classifying segmented multitemporal
sar data from agricultural areas using support vector machines.
Proceedings of the 2nd Workshop of the EARSeL SIG on Land
Use and Land Cover. 3.2
Welch, R. M., Kuo, K., Sengupta, S. K., 1990. Cloud and surface tex-
tural features in polar regions. IEEE Trans. Geose. Remote Sens.
2
Weszka, J., C., D., Rosenfeld, A., 1976. A comparative study of tex-
ture measures for terrain classification. IEEE Trans. System, Man
and Cybernetics. 2
Yakam-Simen, F., Nezry, E., Zagolski, F., 1999. Early estimation of
crop surfaces, and agriculture monitoring using radarsat data. Geo-
science and Remote Sensing Symposium, 1999. IGARSS ’99 Pro-
ceedings. IEEE 1999 International. 3.2
17