a discussion of statistical methods for matched data ... · pdf filea discussion of...
TRANSCRIPT

A Discussion of Statistical Methods for Matched Data Analysisfor Matched Data Analysis
Mingfu Liu. PhD, DCS Methodology Journal Club Presentation
Oct 5, 2010Oct 5, 2010
1

What Do Matched Data Look Like?
Like panel, growth curve and repeated measures data, matched data are clusteredare clustered.
However, matched data are not real longitudinal data. Observations of the man-made cluster don’t have temporal order.p
To a certain degree, “clustering” and “dependency/correlations” of observations within clusters exist and we have to deal with.
2

How to Handle Cluster (Nuisance Variable) ?Variables of no specific interestVariables of no specific interest• Unobservable but identifiable• Represent a collection of characteristics even we cannot describe them• Create a considerable problem• We want to remove the variation caused by them
Example:We want to compare two brands of cosmetic productsWe have a group of female volunteers of various agesRandomized assignments is not the best strategy as it puts systematic effects into the error term
We can randomly apply one product on left side of face and the other on the right sideThen we do either paired t test or two-way ANOVAWhat we just have done is to remove the nuisance effectsHere nuisance variable is subjects The unobservable individual heterogeneity (frailty)
3
Here nuisance variable is subjects. The unobservable individual heterogeneity (frailty). We have conditioned out the nuisance effects

How to Handle Correlation within a Cluster ?
6 patients with depression are given a drug that increases levels of a “happy chemical” in the brain (depression score and chemical measurement)
id time1 time2 time3 time4 chem1 chem2 chem3 chem4
1 20 18 15 20 1000 1100 1200 1300
2 22 24 18 22 1000 1000 1005 950
3 14 10 24 10 1000 1999 800 1700
4 38 34 32 34 1000 1100 1150 1100
5 25 29 25 29 1000 1000 1050 1010
6 30 28 26 14 1000 1100 1109 1500
4

Turn the data to long format
data long;set new;;time=0; score=time1; chem=chem1; output;time=2; score=time2; chem=chem2; output;time=3; score=time3; chem=chem3; output;time=3; score=time3; chem=chem3; output;time=6; score=time4; chem=chem4; output;run;
5

id time score chem
1 0 20 1000
1 2 18 1100
1 3 15 12001 3 15 1200
1 6 20 1300
2 0 22 1000
2 2 24 1000
2 3 18 1005
2 6 22 950
3 0 14 1000
3 2 10 1999
3 3 24 800
3 6 10 1700
4 0 38 1000
4 2 34 11004 2 34 1100
4 3 32 1150
4 6 34 1100
5 0 25 1000
5 2 29 1000
5 3 25 1050
5 6 29 1010
6 0 30 10006 0 30 1000
6 2 28 1100
6 3 26 1109
6 6 14 150

Define treatment group
data long;set long;set long;if id in (1,3,6) then group = "high";else group = “low"; run;run;
7

How do you analyze these data?
We need more complicated models to account for the correlation of measurements within individuals and the effect of cluster/frailty/block
GEE for analyzing the real longitudinal data.
Mixed model for analyzing the real longitudinal dataMixed model for analyzing the real longitudinal data.
8

Review of Fixed Model (GLM GENMOD)
itfixedtfixeditY εββ ++= )(1)(0
),0(~ 2/ tyit N σε
constant0 =βconstant=timeβ
9

Review of Random Model (GLM MIXED GLIMMIX VARCOMP)
itrandomtimeirandomiitY εββ ++= )(,)(0
),(~ 200 0βσββ populationi N
),(~ 2,, tpopulationtimetimei N βσββ
t
Rarely used in medical sciences and therefore the name has been stolen for mixed model !
10

Review of Mixed Models (MIXED GLIMMIX)
itfixedtrandomiitY εββ ++= )(1)(0
)( 2ββ
),0(~ 2/ tyit N σε
),(~ 200 0βσββ populationi N
t tβ constant=timeβThis model has been called Random Model in medical sciences, but recently some authors has started to use its original name
11
has started to use its original name.

Analysis of Longitudinal Data
We need more complicated models to account for the correlation of measurements within individuals and the effect of cluster/frailty/block
GEE for analyzing the real longitudinal data.
Mixed model for analyzing the real longitudinal dataMixed model for analyzing the real longitudinal data.
12

The GEE model (Fixed Model)
ErrorCORRtimeChChemChem
SScoreScore
+++⎥⎥⎥⎤
⎢⎢⎢⎡
+=⎥⎥⎥⎤
⎢⎢⎢⎡
)(321
321
210 βββ
ChemChem
ScoreScore
⎥⎥
⎦⎢⎢
⎣⎥⎥
⎦⎢⎢
⎣ 43
43 210
13

What does GEE Do?
GEE does the analysis on a within cluster/frailty/block basis and therefore the effects of cluster/frailty/block are conditioned out.
GEE takes into account the dependency of observations by specifying a “working correlation structure”.
GEE is robust to the specification of working correlation structure.
GEE also handle missing values
14
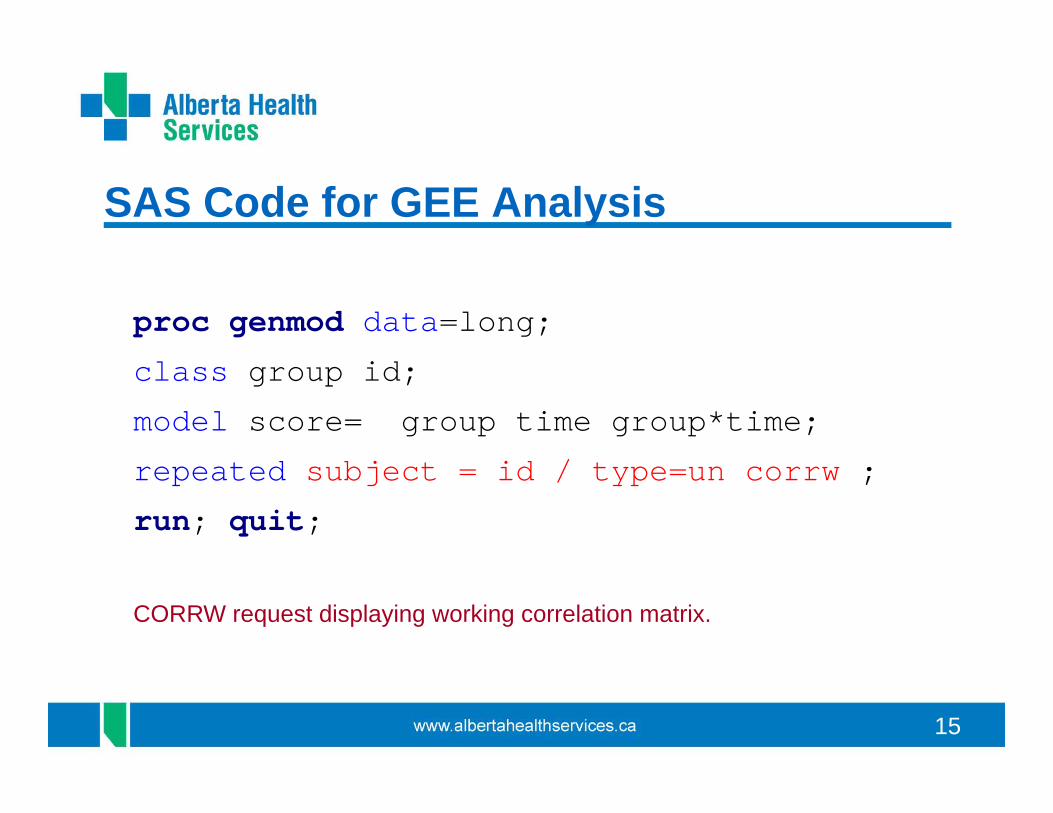
SAS Code for GEE Analysis
proc genmod data=long;
class group id;
model score= group time group*time;
repeated subject = id / type=un corrw ;
run; quit;
CORRW request displaying working correlation matrix.
15
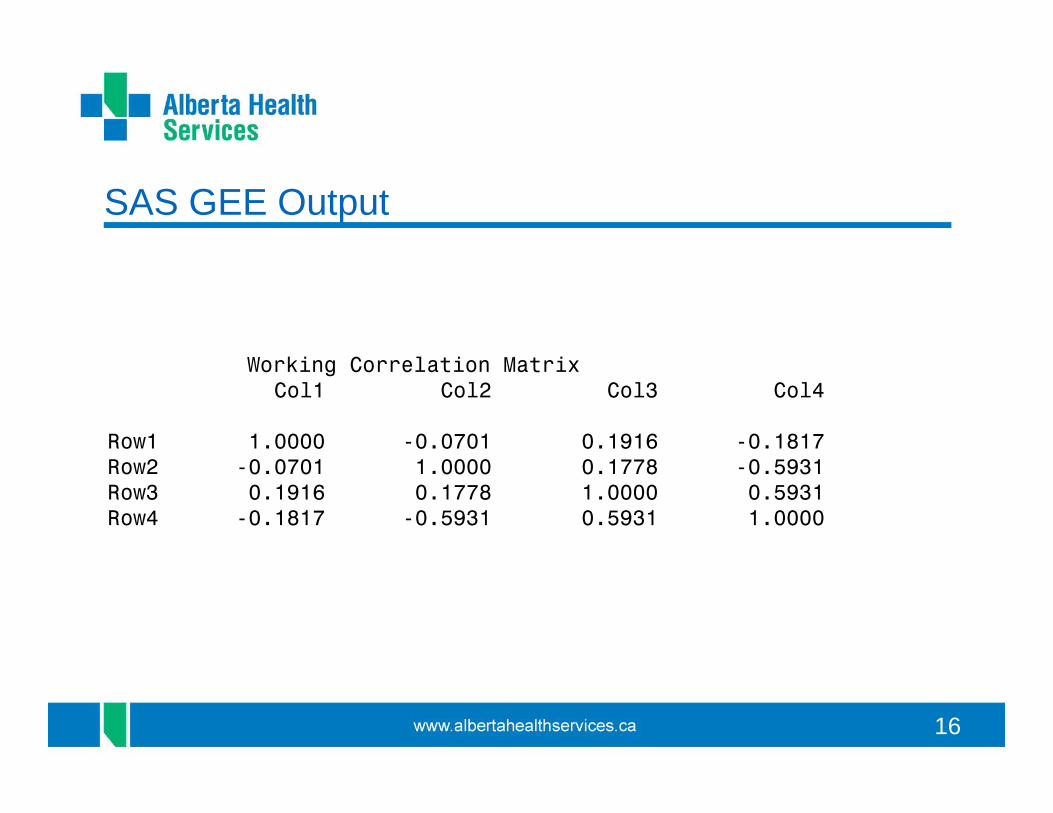
SAS GEE Output
Working Correlation MatrixCol1 Col2 Col3 Col4
Row1 1.0000 -0.0701 0.1916 -0.1817Row2 -0.0701 1.0000 0.1778 -0.5931Row3 0.1916 0.1778 1.0000 0.5931Row4 -0.1817 -0.5931 0.5931 1.0000
16

SAS GEE Output (Cont’d)
Analysis Of GEE Parameter EstimatesEmpirical Standard Error EstimatesEmpirical Standard Error Estimates
Standard 95% ConfidenceParameter Estimate Error Limits Z Pr > |Z|
Intercept 42.1433 6.2281 29.9365 54.3501 6.77 <.0001group A 7.8957 6.6850 -5.2065 20.9980 1.18 0.2376group B 0.0000 0.0000 0.0000 0.0000 . .time -4.9184 2.0931 -9.0209 -0.8160 -2.35 0.0188time 4.9184 2.0931 9.0209 0.8160 2.35 0.0188time*group A -4.3198 2.1693 -8.5716 -0.0680 -1.99 0.0464
17

What does Mixed Model Do?
Cluster/frailty/block is treated as random variable so that the variance due to the nuisance variable is estimated and adjusted for.
Correlation of observations within a cluster/frailty/block is adjusted.
Handle missing values.
Theoretically sound as cluster/frailty/block are random in nature.
(Mixed model is often called Random Model in medical sciences)
18
(Mixed model is often called Random Model in medical sciences)

Mixed Models
itfixedtrandomiitY εββ ++= )(1)(0 f )()(
),0(~ 2/ tyit N σε
),(~ 200 0βσββ populationi N
0βp p
constant=timeβ19

SAS Code for Mixed Model
proc mixed data=long ; l idclass id group;
model score = time group time*group /s corrb;random int /subject=id type=un VCORR;
run; quit;
VCORR request displaying working correlation matrix
20

GEE and MIXED have similar results !
SAS Mixed Model ResultsFit Statistics
-2 Res Log Likelihood 138.4
AIC (smaller is better) 142.4
AICC (smaller is better) 143.1
BIC (smaller is better) 142 0BIC (smaller is better) 142.0
Solution for Fixed Effects
Standard
Effect group Estimate Error DF t Value Pr > |t|
Intercept 40.8333 4.1934 4 9.74 0.0006
time -5.1667 1.5250 16 -3.39 0.0038time 5.1667 1.5250 16 3.39 0.0038
group A 7.1667 5.9303 16 1.21 0.2444
group B 0 . . . .
time*group A -3.5000 2.1567 16 -1.62 0.1242
21
time*group B 0 . . . .

How do we do when the outcome is not a continuous variable?
PROC GENMOD and GLIMMIX are based on generalized linear model
PROC LOGISTIC handles general logistic regression
GENMOD, GLIMMIX and PHREG can be used for conditional logistic regression t diti t l t /f ilt /bl kto condition out cluster/frailty/block
These procedures shared core or overlap machinery and complement each anotherp p y p
22

Power of GENMOD and GLIMMIX•Since these methods are based on generalized linear models these methods can easily be•Since these methods are based on generalized linear models, these methods can easily be extended to repeated measures with a dependent variable that is binary, categorical, or counts…
•These methods are not just for repeated measures. They are appropriate for any situation where dependencies arise in the data. For example,
•Studies across families (dependency within families)•Prevention trials where randomization is by school, practice, clinic, geographical area, t (d d ithi it f d i ti )etc. (dependency within unit of randomization)
•Matched case-control studies (dependency within matched pair/cluster)•In general, anywhere you have “clusters” of observations (statisticians say that observations are “nested” within these clusters.)observations are nested within these clusters.)•For repeated measures, our “cluster” was the subject.•In the long form of the data, you have a variable that identifies which cluster the observation belongs too (for us, this was the variable “id”)
23

SAS Code for GEE and Mixed Models for Binary Outcome
proc genmod data=matched descending;p oc ge od data atc ed desce d g;class id;model outcome = lung vaccine lung_vac/dist=bin link=logit;repeated subject = id / type=un corrw ;estimate ‘Yes vs. No' vaccine 1 -1 / exp;run;
proc glimmix data=matched;p g ;class id;model outcome= lung vaccine lung vac/dist=bin link=logit;random _residual_ / sub=id TYPE=un vcorr;run;
In the absence of random effects, the GLIMMIX procedure fits generalized linear models(fit by the GENMOD procedure).
24

Do Matched Data Really Form a Cluster/Block?
25
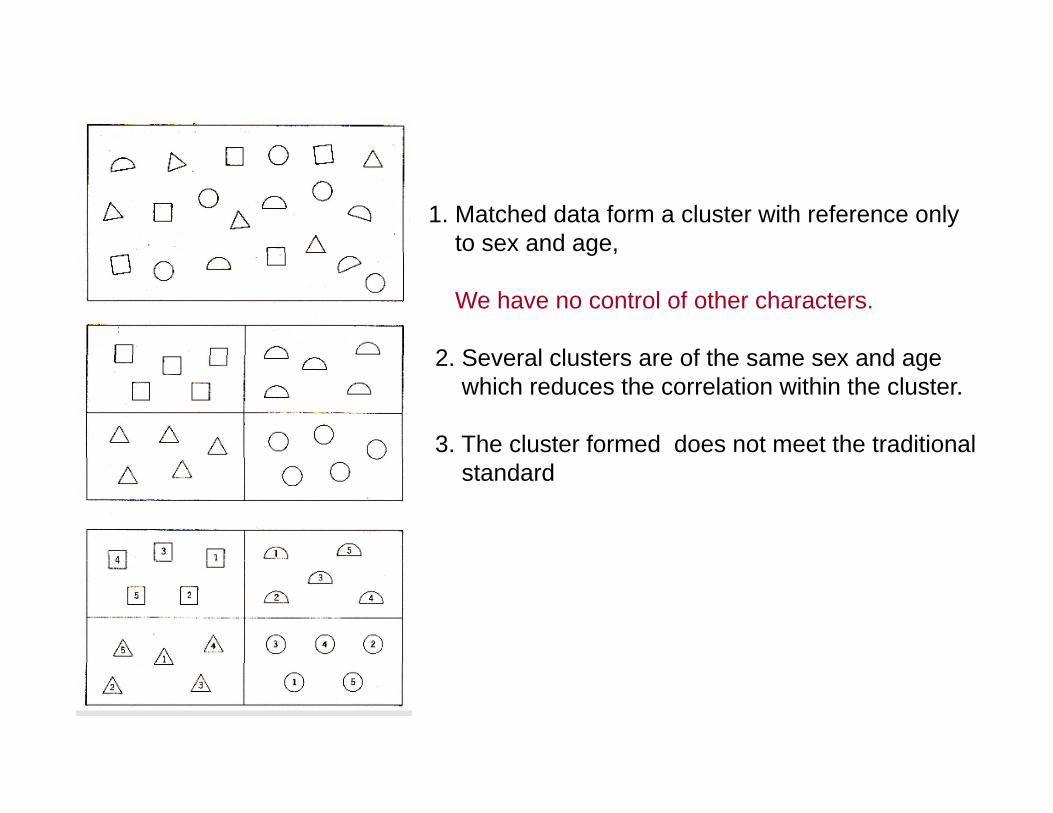
1. Matched data form a cluster with reference onlyto sex and age, g ,
We have no control of other characters.
2 Several clusters are of the same sex and age2. Several clusters are of the same sex and agewhich reduces the correlation within the cluster.
3. The cluster formed does not meet the traditionalstandard

Conditional or Not?
To a certain degree, what matching does is to select a control cohort which is similar to the case cohort with respect to sex and age, for example. As far as other characters are concerned, they are randomly selected.
When we model an outcome to compare case vs control groups etc (caseWhen we model an outcome to compare case vs. control groups, etc (case is an independent variable or called treatment-control matching), we usually don’t need to adjust for the “cluster” effects as the coorelation within clusters is usually low.
LOGISTIC, GENMOD, CATMOD, GLIMMIX and PHREG can be used for logistic analysis. LOGISTIC is the easiest to use.
27
LOGISTIC is the easiest to use.
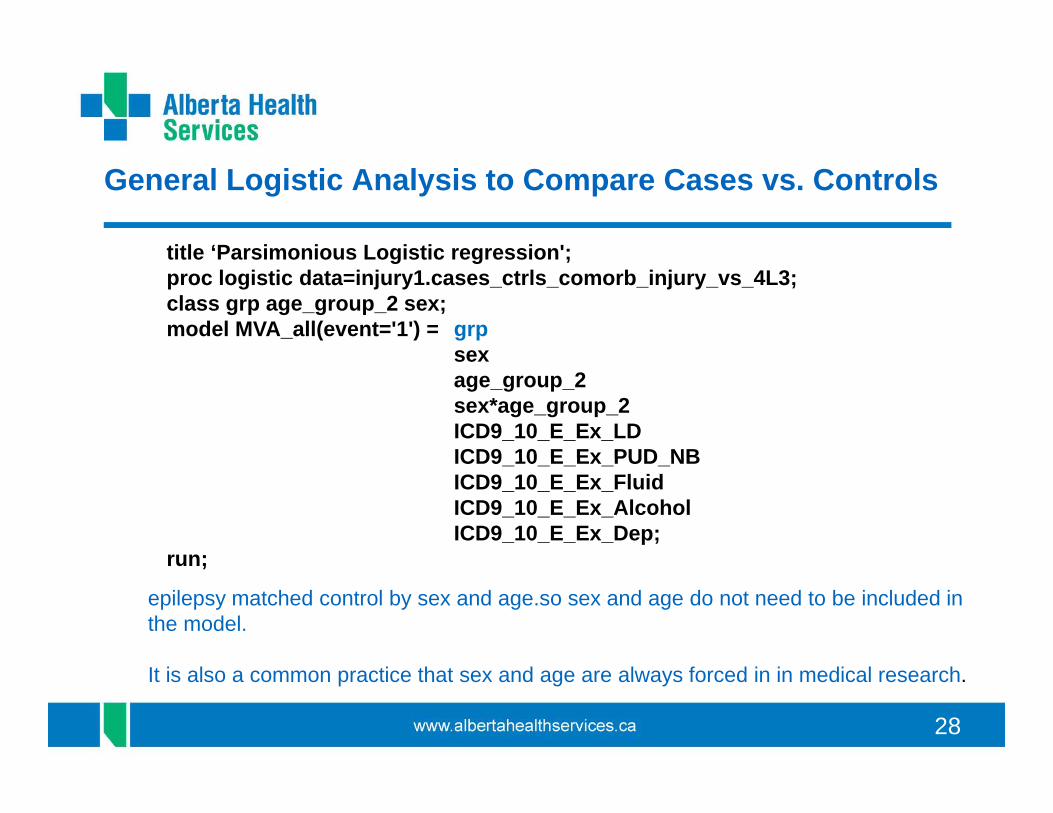
General Logistic Analysis to Compare Cases vs. Controls
title ‘Parsimonious Logistic regression';title Parsimonious Logistic regression ;proc logistic data=injury1.cases_ctrls_comorb_injury_vs_4L3;class grp age_group_2 sex;model MVA_all(event='1') = grp
sexsexage_group_2sex*age_group_2ICD9_10_E_Ex_LD ICD9 10 E Ex PUD NBICD9_10_E_Ex_PUD_NBICD9_10_E_Ex_FluidICD9_10_E_Ex_AlcoholICD9_10_E_Ex_Dep;
run;run;
epilepsy matched control by sex and age.so sex and age do not need to be included in the model.
28
It is also a common practice that sex and age are always forced in in medical research.

General Logistic Analysis
29

General Logistic Analysis
PROC GENMOD DATA=my.casecont DESCENDING;MODEL pubhouse=staybaby black kids doubleup age days / D=B;
RUN;
30
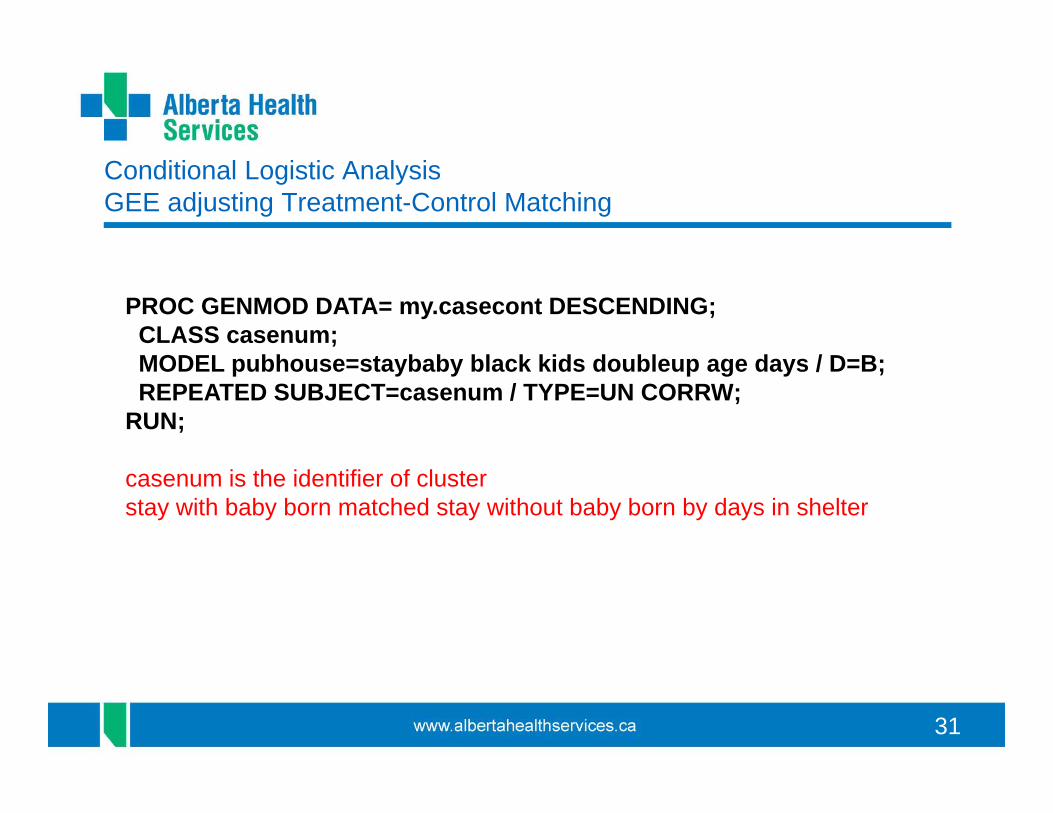
Conditional Logistic Analysis GEE adjusting Treatment-Control Matching
PROC GENMOD DATA= my.casecont DESCENDING;CLASS casenum;MODEL bh t b b bl k kid d bl d / D BMODEL pubhouse=staybaby black kids doubleup age days / D=B;REPEATED SUBJECT=casenum / TYPE=UN CORRW;
RUN;
casenum is the identifier of clusterstay with baby born matched stay without baby born by days in shelter
31

working correlation is only 0.07
results are similar with general logistic regression

Conditional Logistic Analysis PHREG adjusting Treatment-Control Matching
DATA b;SET my.casecont;Time = 2 - pubhouse;
RUN;PROC PHREG DATA=b NOSUMMARY;MODEL Time*pubhouse(0) = staybaby black kids doubleup age /
TIES=DISCRETE;TIES DISCRETE;STRATA casenum;RUN;
working correlation from this is 0.2 when DAYS is excluded from the model
33
working correlation from this is 0.2 when DAYS is excluded from the model

Conditional Logistic Analysis PHREG adjusting Treatment-Control Matching
with working correlation = 0 2 the results are still similarwith working correlation = 0.2, the results are still similar
Rule of Thumb: Use GEE CORRW (or GLIMMIX VCORR) as a guide to decide the need for Adjusting matching. Usually no need for
34
adjustment

Again, Conditional or Not?
On the other hand, people may argue that each case and their matched controls form a unique cluster that is different from any other clusters. This is q yphilosophically right and it is also useful.
When we model the probability of a case per se (case is dependent variable or called case control matching) we usually need to adjust matching so that thecalled case-control matching), we usually need to adjust matching so that the bias in the estimation of the parameters is reduced.
GENMOD, GLIMMIX and PHREG can be used for conditional logistic analysis. GENMOD seems to be the easiest to use, and its computational algorithm is robust.
Remember we now have matched outcome !
35
Remember we now have matched outcome !

General Logistic AnalysisNo Adjusting for Case-Control Matching
proc logistic data=my casecont;proc logistic data=my.casecont;model staybaby(event=‘1’) = black kids doubleup age daysrun;
Keep matching variable DAYS in to demonstrate that matching on this variable eliminates its effect on
36
Keep matching variable DAYS in to demonstrate that matching on this variable eliminates its effect on the dependent variable

Conditional Logistic AnalysisPHREG Adjusting Case-Control Matching
DATA c;SET my.casecont;Time = 2 staybaby;Time = 2 - staybaby;
RUN;PROC PHREG DATA=c NOSUMMARY;MODEL Time*staybaby(0)=black kids doubleup age;STRATA casenum;
RUN;RUN;
37

LOGISTIC and PHREG have similar results !
Conditional Logistic AnalysisPHREG Adjusting Case-Control Matching
38
Rule of Thumb: Suggest to adjust case-control matching

Additional Consideration and FindingsConditional logit method essentially discards all matched pairs in which bothConditional logit method essentially discards all matched pairs in which both members have the same value of the dependent variable.
As a result, the standard errors of the parameter estimates become larger.
i.e. an increase in unbiasedness is at the cost of a decrease in efficiency.
Therefore, there is a balance between the potential decrease in bias and the , ploss of information
Using a sample data, Mingfu Liu (2010) found that when correlation within clusters reached 0 25 in case control matched data the parameter estimatesclusters reached 0.25 in case-control matched data, the parameter estimates differed after adjusting the cluster effects; while with treatment-control matched data, the correlation within clusters was close to zero, and adjusting the cluster effects had no impact on the parameter estimates (see attached
39
sample data, SAS programs and SAS output).

Suggestions
When we model an outcome to compare case vs. control groups, etc (case is an independent variable or called treatment-control matching), we usually don’t need to adjust for the “cluster” effects as the correlation within clusters is usually lowis usually low.
PROC LOGISTIC is the easiest to use.
When we model the probability of a case per se (case is dependent variable or called case-control matching), we usually need to adjust matching so that the bias in the estimation of the parameters is reduced. In this case the correlation with pclusters is usually high (for example,0.25 or higher).
GENMOD, GLIMMIX and PHREG can be used for conditional logistic analysis. GENMOD seems to be the easiest and its computational algorithm is robust
40
GENMOD seems to be the easiest, and its computational algorithm is robust

Thank You !Thank You !
Q ?Questions?
41