a different approach to non-interest-bearing …
TRANSCRIPT

1
Master Thesis
LLM Law & Finance
A DIFFERENT APPROACH TO NON-INTEREST-BEARING
LIABILITIES FROM VALUATION PERSPECTIVE
SAKIP ALTUN
12472603
Date: 6/1/2020 – Monday
Supervisor: dhr. Prof. Dr. Rolef de Weijs
2
Abstract: Applying corporate finance principles might cause some problems in certain cases. This
thesis discusses one of the problems. It is related to the equity holders and the suppliers of
companies. When we do not subtract non-interest-bearing liabilities from enterprise value to reach
equity value, the equity holders or the management of companies are able to increase the
company’s equity value and goodwill value. They can do that by delaying the payments to their
suppliers. This delay will create a non-interest-bearing liability on the balance sheet and it affects
the valuation of companies. Most of the time the suppliers of companies are small and medium
sized enterprises. When the counterparties of SMEs delay the payments, it might affect the
financial situation of SMEs negatively. It is a systemic problem because SMEs are important for
the economies of countries and regions. While this study tries to address the issue, it uses a certain
database. It analyzes 10 European and 10 American companies from 5 different industries by using
a financial model. It finds that there are important and interesting differences between the EU and
the US regions. There are significant working capital differences between the industries as well.
Also, this study, analyzes and evaluates the Late Payment Directive of the European Union. It is a
legal act that tries to combat late payments in commercial transactions. It gives a right to trade
creditors to claim an interest if the trade debtor does not make the payment in time. It is a very
interesting treatment from valuation perspective because after the trade creditor exercises its right
to claim an interest, non-interest-bearing debts become interest-bearing debts. The study argues
that the Directive is not effective to protect SMEs even though the numbers show the opposite.

3
Contents
1. INTRODUCTION .................................................................................................................................4 2. VALUATION OF A COMPANY .........................................................................................................9
2.1. Valuation Methods .......................................................................................................................9 2.1.1. Multiples Valuation Method ....................................................................................................9 2.1.2. Discounted Cash Flow Valuation ..........................................................................................11
2.2. Enterprise Value and Equity Value ............................................................................................12 2.3. The Concept of Goodwill ...........................................................................................................14
3. LIABILITIES AND THE CLASSIFICATION PROBLEM ...............................................................17 3.1. Interest-Bearing Liabilities .........................................................................................................17 3.2. Non-Interest-Bearing Liabilities .................................................................................................18 3.3. Cash and Cash Equivalents ........................................................................................................19
4. THE PROBLEM WITH NON-INTEREST-BEARING LIABILITIES ..............................................20 4.1. The Problems for Suppliers ........................................................................................................22 4.2. Non-Interest-Bearing Liabilities: Operational or Financial? ......................................................25 4.3. Possible Solutions .......................................................................................................................26
5. APPLICATIONS ON THE SAMPLE COMPANIES .........................................................................29 5.1. Explanation of Visuals ...............................................................................................................29 5.2. Semiconductor Industry .............................................................................................................31 5.3. Telecom Industry ........................................................................................................................32 5.4. Brewing Industry ........................................................................................................................34 5.5. Foods Industry ............................................................................................................................35 5.6. Retail Industry ............................................................................................................................36 5.7. Results ........................................................................................................................................37
6. LATE PAYMENT DIRECTIVE .........................................................................................................38 7. CONCLUSION ....................................................................................................................................42 8. BIBLIOGRAPHY ................................................................................................................................45

4
1. INTRODUCTION In the modern business world, companies always want to be valued as high as possible. When the
companies or their shares are sold, the shareholders and the management strive to reach higher
valuations to sell the company at a higher price. Even if there is no transaction regarding the shares
of a company, higher valuations still provide some benefits for companies.
Companies, normally, increase their valuations by increasing the values of their assets. However,
companies can increase their valuations by misusing some accounting or corporate finance tools
as well. If that is the case, regulatory bodies should intervene to prevent these unfair treatments.
Enterprise value and equity value are the most common ways to determine the worth of a company.
Enterprise value is the market value of a company’s operational assets with future economic
expectations.1 Equity value shows how much of the enterprise value belongs to the equity holders
of the company.2 The other interest holders are the difference between enterprise value and equity
value and they establish the bridge between them. These interest holders can be seen on the balance
sheets of companies.
Corporate finance principles state that net debt is the bridge between enterprise value and equity
value. Net debt equals to the interest-bearing debts of the company minus the cash amount of the
company. The bridge between enterprise value and equity value is related to the main argument of
the thesis. Therefore, the analysis of this bridge is crucial. Also, the concept of net debt is
disregarded by the corporate finance world even though there are lots of studies about enterprise
values and equity values. Some academics point out the gap in the area as Lambrecht and Pawlina
state that3:
“Although there is an extensive literature in corporate finance on theories of capital
structure…
1 Thomas, Rawley, and Benton E. Gup. The Valuation Handbook : Valuation Techniques from Today's Top Practitioners, John Wiley & Sons, Incorporated, 2009. ProQuest Ebook Central, https://ebookcentral.proquest.com/lib/uvtilburg-ebooks/detail.action?docID=468905. Accessed on 10/11/2019 2 Paul Pignataro, Leveraged Buyouts: A Practical Guide to Investment Banking and Private Equity (John Wiley & Sons, Incorporated, 2013) 3 Bart M. Lambrecht, Grzegorz ‘A Theory of Net Debt and Transferable Human Capital’ [2013] Review of Finance, European Finance Association, vol 17(1), pages 321-368 http://ssrn.com/abstract=1323855 accessed on ’13 October 2019’

5
… Rather surprisingly, the terms “net debt” and “net leverage” barely feature in the
finance literature and little significance has been attached to these measures. There are
theories of debt, and theories of cash (or liquidity) but very few papers analyze how both
are jointly determined.4”
Edward Bodmer states that the rationale behind net debt is not truly understood by finance
professionals in his book5:
“Many ideas about valuation such as the definitions of the weighted average cost of
capital, free cash flow, and net debt are taken for granted by finance professionals,
students, and academics without working through the underlying valuation logic.”
Even International Valuation Standards Council does not comment on how to calculate net debt
properly while it concerns about enterprise and equity valuations. Therefore, a proper study about
how to reach equity value from enterprise value is necessary.
This thesis studies the concept of net debt because the corporate finance principles about the net
debt is able to be misused. Companies can increase their equity values and goodwill values because
of this calculation. Corporate finance principles state that we have to subtract interest-bearing debt
from enterprise value to reach equity value. We do not subtract non-interest-bearing debts.
So, if two different companies have the same enterprise value, the one with higher non-interest-
bearing debt levels will have a higher equity value. The issue is that companies are able to change
their interest-bearing debt and non-interest-bearing debt levels. Companies can prefer to have
higher non-interest-bearing levels to increase their equity values.
The most common non-interest-bearing liabilities are trade liabilities. Therefore, a company can
increase its non-interest-bearing liabilities by creating trade debts. The way to create trade debts is
to delay the payments in commercial transactions. When the company receives the goods and the
invoice from its supplier and it delays the payment then the company will have some burden. This
4 The few contributions that simultaneously analyze financing and cash holding decisions include Hennessy and Whited (2005), Acharya et al. (2007) and Gamba and Triantis (2008) according to Lambrecht and Pawlina 5 Bodmer, Edward. Corporate and Project Finance Modeling: Theory and Practice, Wiley, 2014. ProQuest Ebook Central, http://ebookcentral.proquest.com/lib/uvtilburg-ebooks/detail.action?docID=1813673

6
burden will be seen on the balance sheet as a non-interest-bearing liability item and non-interest-
bearing liabilities are not subtracted from enterprise value to reach equity value.
If a company delays the payment what does this delay mean? It means the money had to be paid
to the supplier is now kept inside the company. The purchaser is financially advantaged because
now it can use this excessive money for its own benefit and the supplier is financially
disadvantaged because now it could not get its money and might suffer from this lack of money.
The purchaser company can do many things with this abundant cash and one of the examples is
explained in this study. However, the supplier’s case is more important.
Suppliers are disadvantaged because of their positions against bigger corporations. They need to
sell their goods like every company but they have limited facilities. They are less likely to reach
capital markets and other funding sources. They can cover their costs harder. But most importantly,
when they establish a good business relationships with bigger purchaser companies they need to
keep this relationship as good as possible. Therefore, bigger companies can delay their payments
to their suppliers more easily.
Most of the suppliers are SMEs and they important for the economies of countries and regions.
They should be protected to establish a solid economic system. What can we do about the issue
explained above? We cannot prohibit late payments completely because they are inevitable part of
the modern business. Then, we should subtract non-interest-bearing liabilities from enterprise vale
to reach equity value. However, the corporate finance principles state the opposite.
Therefore, the research question of this thesis is that “why and when from valuation perspective
should we subtract non-interest-bearing liabilities from enterprise value to reach equity value?” It
is an important legal challenge. The conditions of these treatment should be drawn up carefully.
This thesis discusses these conditions. Duration of the delay and the conditions of misuse are the
topics analyzed in this thesis.
The levels of non-interest-bearing debts of companies should be analyzed in the context of this
thesis. This study uses a methodology that includes a financial dataset. It analyzes the balance
sheets of companies. A financial model has been used to analyze and to visualize balance sheets.
10 European and 10 American companies from 5 different industries will be analyzed. All the 20
companies are public companies. Public companies will be analyzed because they are big

7
corporations that have the power to delay the payments to their suppliers. Also, equity values are
very important for public companies because of their stock prices. The EU and the US regions are
selected because they are very active regions in terms of M&A deals. Therefore, their enterprise
values and equity values are significant for their businesses. The balance sheets as of 2018 and
2017 will be analyzed because they are the recent balance sheets of the companies.
The five different industries are selected because of their different attributes. The semiconductor
industry is selected to represent manufacturing companies. Semiconductor companies have high
levels of current assets because they are manufacturing some materials to sell and they are called
inventory. Telecommunications companies have high levels of fixed assets due to their base
stations. The brewing industry is selected because they have large amounts of cash and goodwill
values. Goodwill is a very important concept in the context of this study. Dairy foods companies
are heavily depended on their suppliers and their suppliers are mostly SMEs. The retail industry is
a very interesting industry to be analyzed in this study because they have highly negative working
capital positions.
In corporate finance studies when balance sheets are analyzed, non-interest-bearing debts are
mostly disregarded. This study is different from this aspect as well because it mainly focuses on
the non-interest-bearing debt levels of companies. This thesis argues that if a company has too
much non-interest-bearing debt it might be causing some problems to its suppliers. Then, another
question arises “how much is too much?” This study discusses this question as well. It changes
from region to region and from industry to industry but the general answer is “non-interest-bearing
debt levels should be proportional to current assets levels.” Because if a company has too much
non-interest-bearing debt and too little current assets it means the company keeps the money inside
the firm instead of paying off its liabilities.
Therefore, this study compares non-interest-bearing levels and current assets levels of 20
companies from 5 different industries by using a financial model. The study finds that for some
industries European companies have higher levels of non-interest-bearing debts than their
American peers and might be causing some problems to their suppliers. For the other industries
the case is opposite, American companies have higher levels of non-interest-bearing debt than their
European peers. This study discusses the reasons why there are differences between the regions.

8
The thesis, finally, analyzes the Late Payment Directive. It is a legal act of the European Union to
combat late payments. Mainly; if the trade debtor is too late in its payment, it gives a right to the
trade creditor to claim an interest from the trade debtor. If the trade creditor exercises its right the
non-interest-bearing debt of the trade debtor becomes an interest-bearing debt and it changes the
valuation of the company. This study discusses the effectiveness of the Directive as well,
especially about the protection of SMEs.

9
2. VALUATION OF A COMPANY There are many studies about valuation methods of companies and how they should be exercised
properly. This study focuses on calculation of the bridge between enterprise value and equity value
where there is an academic gap. However, one should understand the logic behind company
valuations before the rationale of net debt. Therefore, this chapter will explain most popular
company valuation methods and some related terms.
2.1.Valuation Methods
2.1.1. Multiples Valuation Method
A company can be valued by looking at how other similar companies are valued. A similar
example for this kind of valuation is valuing a house by looking at how the other similar houses
are valued.6 When this valuation is applied to companies it is called “multiples valuation methods”.
The definition includes “multiples” because this valuation is applied by using some certain
financial ratios.
Companies can be valued by looking at how other comparable companies are valued. In order to
do that some financial multiples are being used such as Enterprise Value (EV)/EBITDA multiple
Other common multiples are Enterprise Value/ EBIT, Enterprise Value/Sales, Price-Earnings ratio
and Price/Book ratio. EV/ EBITDA, EV/EBIT AND EV/Sales ratios are being used to calculate
enterprise value of companies. Equity value of companies can be calculated by using
Price/Earnings ratio or Price to Book ratio.
This thesis will provide a fictional scenario includes two companies. It will help to explain basic
valuation methods and the main idea of the thesis. There are two companies “Company A” and
“Company B”. They are operating in the same industry. They have similar sizes and business
models.
In the first scenario, enterprise values of Company A and Company B will be measured by using
EV/EBITDA multiple valuation method which is one of the most common multiples valuation
methods. In order to do that, the profit and loss statements of the companies should be analyzed:
6 Aswath Damodaran, Damodaran on Valuation, (2nd Edition, John Wiley & Sons, Incorporated, 2006) 233

10
Figure 2.1: P&L Statements of Company A and Company B
When we look at the profit and loss statements of Company A and Company B, we can see that
they generate close amounts of cash but the essential item that has to be looked at is EBITDA
because we will apply EBITDA/EV multiples valuation methods. EBITDA represents earnings
before interest, tax, depreciation and amortization expenses. If we look at our example we can see
that both Company A and Company B generates same EBITDA values.
In order to calculate enterprise values of Company A and Company B we have to find or calculate
EV/EBITDA multiple of the companies. As it is stated earlier Company A and Company B are
operating in the same industry, in the same geography. They have similar sizes and business
models. Therefore, the same EV/EBITDA ratio can be applied to both Company A and Company
B. We assume EV/EBITDA ratio for Company A and Company B is 10x. It can be calculated by
taking average of EV/EBITDA ratios of other comparable companies in practice. In our case, we
can calculate enterprise values of Company A and Company B. The formula is for the calculation
is “Enterprise Vale= EBITDA x EV/EBITDA multiple:
Figure 2.2: Calculating enterprise values of companies by using EV/EBITDA multiples valuation
We can conclude that if companies generate same amount of EBITDA and they have same
EV/EBITDA multiples, they have same enterprise value. This statement is very important for the
main idea of this thesis.

11
Another multiples valuation method is precedent transaction analysis. An investor can look at past
M&A deals and value a certain company by this way. The same multiples in comparable company
multiples method can be used to value companies in precedent transaction analysis as well.
The advantages of multiples methods include valuations include these methods are based on real
market values. Some of the disadvantages of multiples methods include these valuations are based
on past events rather than future expectations and the historical data is limited.
2.1.2. Discounted Cash Flow Valuation
Discounted Cash Flow (DCF) method is based on the idea that the value of a company is about its
ability to generate cash flows. The sum of the present value of future cash flows is the value of a
company according to this method. IVS states7:
“Under the DCF method the forecasted cash flow is discounted back to the valuation date,
resulting in a present value of the asset.”
According to the IVS the key steps for the DCF8 are choosing the most convenient free cash flow
type, determining the optimum time period, estimating future cash flows, applying a terminal value
is suitable and discounting futures cash flows and the terminal value at an appropriate discount
rate.
The advantages of this method include it is based on future projections rather than past events and
it gives “intrinsic value of a company.” Some disadvantages of this method are it is sensitive to
particular rates such as terminal value or discount rate.
Company valuation professionals prefer to use this method because it gives us the intrinsic value
of a company. It is because this method is solely based on the company itself rather than similar
companies in the same industry with the similar sizes. However, it should be noted that intrinsic
value is not same as market value. Financial professionals consider the result of their DCF analysis
as the true value of a company however there is no certain value for any asset.
DCF methods can be used both calculate enterprise value and equity value. If free cash flows to
the firm are discounting at the weighted average cost of capital, the value of a firm to all the
7 International Valuation Standards 2017 (International Valuation Standards Council, 2017) 8 Ibid

12
stakeholders -both equity holders and debt holders- can be calculated which gives us enterprise
value.9 If free cash flows to the equity holders are discounting at the cost of equity, the value of a
firm to only the equityholders can be calculated which gives us equity value.
Enterprise value and equity value of a company can be calculated with the mentioned methods and
one can get one from another by adding or subtracting the net debt. As Aswath Damodaran states10:
“In theory, the value for equity obtained from the firm valuation and equity valuation
approaches should be the same if you make consistent assumptions about financial
leverage.”
In order to do that net debt should be calculated properly as well.
2.2.Enterprise Value and Equity Value
In the previous chapter, we calculated values of Company A and Company B. But what kind of
value did we actually calculate? There are many ways to express the value of a business or a
company. Enterprise value and equity value are two different ways to calculate the worth of
companies. This chapter intends to explain these two concepts and the difference between them.
Also, the bridge between enterprise value and equity value will be explained in this chapter since
it constitutes an important part for the thesis.
There are many different descriptions about what enterprise value is. However, the main idea
behind enterprise value is that it is the total value of its all operating assets with the expectation of
estimated economic profit11. Paul Pignataro12 defines Enterprise value as:
“Enterprise value (also known as firm value) is defined as the value of the entire business,
including debt lenders and other obligations.”
We found the enterprise values of Company A and Company B in the previous chapter because
we used EV(Enterprise value)/EBITDA multiple which is based on the enterprise values of other
9 Aswath Damodaran, Damodaran on Valuation, (2nd Edition, John Wiley & Sons, Incorporated, 2006) 193 10 Ibid 210 11 Thomas, Rawley, and Benton E. Gup. The Valuation Handbook : Valuation Techniques from Today's Top Practitioners, John Wiley & Sons, Incorporated, 2009. ProQuest Ebook Central, https://ebookcentral.proquest.com/lib/uvtilburg-ebooks/detail.action?docID=468905. Accessed on 10/11/2019 12 Paul Pignataro, Leveraged Buyouts: A Practical Guide to Investment Banking and Private Equity (John Wiley & Sons, Incorporated, 2013)

13
comparable companies. Companies can value their enterprise values by using DCF valuation.
After doing that, EV/EBITDA multiple can be calculated by dividing it to EBITDA values. This
is how EV/EBITDA multiples are found. After that, other companies can calculate their enterprise
values by using these multiples of comparable companies.
The other value shows the worth of a company is equity value. Equity value is different from
enterprise value. Equity value is described by Paul Pignataro as13:
“The equity value of a business is the value of the business attributable to just equity
holders - that is, the value of the business excluding debt lenders, noncontrolling interest
holders, and other obligations.”
The difference between enterprise value and equity value is about debt lenders and other
obligations. The value attributed to debt lenders, noncontrolling interest holders and other
obligations establish the bridge between enterprise value and equity value. Therefore, in order to
analyze the bridge between enterprise and equity values we have to analyze the balance sheet of a
company. The general rule is that if a balance sheet item is not related to the company’s operational
activities we have to exclude these items to reach equity value from enterprise value. The main
non-operational items are interest-bearing debt on the liabilities side and cash on the assets side.
Also, interest-bearing debt minus cash gives us net debt. So, the general formula is that “enterprise
value=equity value – net debt”. This formula can be applied to our fictional companies as follows.
Figure 2.3: Enterprise value, cash, book value of equity and debts of the companies
Company A and Company B are operating in the same industry, they have similar sizes and
business models. However, the main difference between Company A and Company B is their
capital structure. Also, this difference constitutes the most important for the main argument of this
thesis.
Company A and Company B have the same enterprise value of 1800 as we calculated previously.
They have the same equity amount on their balance sheet. The equity on the balance sheet is called
13 Ibid

14
book value of equity and different from the market value of equity. This will be explained more
detailed in the next chapter. Company A has interest-bearing debt of 400. Interest-bearing debt is
a non-operational item and should be subtracted from enterprise value to reach equity value.
However, Company B has a different capital structure. It has interest-bearing debt of 100 and non-
interest-bearing debt of 300. We have to suctract only interest-bearing debt amount to calculate
equity value for Company B. We do not subtract non-interest-bearing items because they are
operational items. Neither of the companies has no cash. If we apply the formula we can find
equity values for Company A and Company B as follows.
Figure 2.4: Reaching equity value of companies from enterprise value
We applied the general formula between enterprise value and equity value as the corporate finance
principles say. We found that Company A and Company B have different equity values even
though they have the same enterprise value. The difference comes from their different capital
structures. Their capital structures are different because they have different amount of interest-
bearing debt and non-interest-bearing debt.
If an investor wants to buy a company it has to pay the equity value of the company. Because the
equity value shows the worth of the total shares of the company. So, if someone buys all the shares
of a company by paying the equity value it will own all the shares and controlling rights. In our
example, if a buyer wants to buy Company A, it has to pay 1400 but if it wants to buy Company
B it has to pay 1700. The difference again comes from the amount of different non-interest-bearing
debts.
2.3.The Concept of Goodwill
The goodwill is an important concept in the context of this study. We calculate enterprise values
and equity values of companies to use in transactions such as acquisitions of private companies
or stock trades. Goodwill occurs when the buyer pays more than the target company’s book
value. Before discussing the goodwill, what the meaning of book value need to be explained.

15
Book value shows the amount that was actually paid in the past for a balance sheet item. Book
value of an item can be seen simply by looking at the related financial statement. Book value of
an equity is important for this study and it can found on the balance sheet of a company. Book
value of equity is different from market value of equity. Book value is more useful for
accounting purposes while market value is more useful for valuation purposes.
Goodwill is described by Nicolas Schmidlin in his book as14:
“Goodwill is the premium paid over the book value of the target company.”
If we calculate goodwill in our case for Company A and Company B first we have to look at
book value of equity of both companies. The figure 2.5 shows that the balance sheets of
Company A and Company B state that both companies have equity of 500. This amount is what
the shareholders paid in the past and is different from market value of equity. We calculated
market value of equity for Company A and Company B earlier and the figure 2.4 states that
Company A has 1400 and Company B has 1700. If we calculate the goodwill values of Company
A and Company B we find that Company A has 900 of goodwill and Company B has 1200 of
goodwill.
Figure 2.5: Goodwill values of Companies
Company A and Company B are almost the same in the physical world. They have similar assets
and similar business model; they generate the same amount of EBITDA; they are operating in
the same industry in the same region. However, we found that Company A and Company B have
different goodwill. It is an interesting outcome because goodwill represents, also, the following
values15:
14 Nicholas Schimidlin, Art of Company Valuation and Financial Statement Analysis: A Value Investor’s Guide with Real-Life Case Studies (John Wiley & Sons, Incorporated, 2014) 15 Eddie McLaney, Peter Atrill, Accounting and Finance: An Introduction (9th Edition, Pearson Education Limited, 2017)
16
“The term ‘goodwill’ is often used to cover various attributes such as quality of the
products, the skill of employees and the relationship with customers.”
We assume Company A and Company B are almost similar and they similar products,
employees and relationships with customers. However, they have different goodwill values and
this difference comes from their different capital structures. Their amount of non-interest-bearing
liabilities are not the same. The following questions come to mind “why is the case?”, “should
not these companies have same goodwill values?” This study intends to answer these questions
and this study also analyzes how this treatment affects suppliers in the following chapters.

17
3. LIABILITIES AND THE CLASSIFICATION PROBLEM Analysis of balance sheet items is crucial to understand the difference between enterprise value
and equity value because certain balance sheet items establish the bridge between them. Therefore,
this chapter intends to analyze and explain some particular balance sheet items.
Liabilities show the debts of a company to be paid on the balance sheet. IFRS, IAS 1 foresees that
liabilities are classified as current and non-current liabilities and show how to do that. This
classification is mostly useful for accounting or treasury professionals. A treasury manager can
easily see the liquidity position of a company by looking at current liabilities and cash balances.
However, finance professionals that value companies should look at liabilities as interest bearing
and non-interest bearings.
The research question of this thesis is “why from a valuation perspective should non-interest-
bearing liabilities be excluded from enterprise value to reach equity value?” Therefore, firstly
which items are considered as non-interest-bearing liabilities should be identified.
3.1.Interest-Bearing Liabilities
A company can finance its capital with equity, debt or their combination. Companies that choose
to use debt financing has to pay an interest because banks that give loans or investors issue bonds
charge an interest in exchange
As discussed earlier the aim of debt is to finance the company for long-term purposes, therefore
they are not a part of a company’s operating activities and should be included in the bridge between
enterprise value and equity value.
Almost every company distinguishes its long-term debt obligations as “current portion of the long-
term debt” and “long-term debt, less current portion”. However, this study aims to add up both
short-term and long-term interest-bearing liabilities for valuation purposes.
Bank loans and issued bonds are basic examples of interest bearing debt liabilities and they are
explained on the financial statements of companies with detailed information such as interest rates
or duration of the debt. Financial leases are also a common type of interest bearing debt that can
be seen on the balance sheets of companies.

18
3.2.Non-Interest-Bearing Liabilities
Non-interest-bearing liabilities occur when a company postpones its liabilities that do not require
interest payments. They are considered as “free-money” 16 because the company keeps the money
that has to be paid without any burden. It creates an artificial value for the company due to “the
block” that is created on the balance sheet.17 This is the main issue of this thesis and will be
discussed largely in Chapter 4. Some major non-interest-bearing liability items are as follows:
Accounts payables are balance sheet items that show how much a company owes to its suppliers.18
They consist of invoices that has not been paid yet.19 They do not carry interest burden because
suppliers do not charge interest in commercial transactions. They are mostly seen as “accounts
payable”, “trade payables”, “trade creditors”, “debt to suppliers” on the balance sheets of Dutch
companies. They are shown as “accounts payable” or “trade accounts payable” on the balance
sheets of US companies most of the time.
Corporate taxes or value-added taxes that are occurred but not paid yet constitute non-interest-
bearing liabilities as well. They are different from deferred tax liabilities which are not certain in
terms of time or the amount. “Income taxes payable”, “deferred income tax” are examples for
Dutch or US balance sheets. Some companies report tax liabilities with social security
contributions.
Accrued liabilities represent a company’s certain expenses that has not been paid yet. They are
different from accounts payables that are mostly caused by costs of goods sold.20 European and
US companies show them as “accrued liabilities” or “accrued benefits”.
Non-interest-bearing liabilities is the most important balance sheet category in the context of this
study. When a company receives the goods from its supplier but postpones the payment, it keeps
that amount of cash in the company instead of giving it to the supplier. Therefore, the purchaser
company benefits the extra cash until it pays it to the supplier. The main problem in this situation
16 Financial Mindmap, financial-mindmap.com 17 Ibid 18 Pignarato, Paul Financial Modeling and Valuation: A Practical Guide to Investment Banking and Private Equity John Wiley & Sons, Incorporated, 2013. ProQuest Ebook Central Accessed on 12/10/2019 19 Financial Mindmap 20 Ibid

19
is that the supplier will suffer financially from this delay and this issue will be analyzed broadly in
Chapter 4.
This study also examines the relationship between accounts payable items and the Late Payment
Directive of the European Union. They will be analyzed in the context of the Directive. It will be
held in Chapter 5.
3.3.Cash and Cash Equivalents
This chapter has discussed only liability items so far. However, an asset item called “cash and cash
equivalents” should be discussed in the analysis of the bridge between enterprise and equity value
as well. Also, short-term investments that can be converted into cash in a short time are also
considered as cash and cash equivalents from valuation perspective.
For assets, the same principle that if an item is related to company’s operating activities should not
be included in net debt should be applied. Cash and cash equivalents is not an operational item and
therefore it should be a part of the bridge between enterprise value and equity value and should be
added up to enterprise value to reach equity value.

20
4. THE PROBLEM WITH NON-INTEREST-BEARING
LIABILITIES Valuation methods and their applications are analyzed in Chapter 2. The main corporate finance
principles about enterprise value, equity value and the bridge between them are applied to
Company A and Company B. These two companies are very similar. They are in the same industry.
They are operating in the same region. They have the same business model and they generate same
amount of EBITDA. The only significant difference between the companies is their different
capital structures. Company A only has interest-bearing liabilities while Company B has both
interest-bearing and non-interest-bearing liabilities. This difference in non-interest-bearing debts
also affects the equity values and the goodwill values of the companies. Here is a snapshot of what
is analyzed in the Chapter 2:
Figure 4.1: The Snapshot of the Chapter 2
There is another company called “Company X” in our scenario. Company X wants to acquire a
company for investing purposes. It has two options: acquiring Company A or acquiring Company
B. When evaluating these two options Company X will look at the equity values of Company A
and Company B, because Company X has to buy all the shares of the target company and the
equity value equals to all the shares of a company.
The Company X will see that both Company A and Company B generate same EBITDA. It will
use the same EV/EBITDA multiple for both companies to calculate enterprise value. It will find
that Company A and Company B have the same enterprise value of 1800. Then, Company X will
subtract the net debt from enterprise value of companies to reach equity value as the corporate

21
finance principles state. It will find that Company A has equity value of 1400 and Company B has
equity value of 1700. Company B will be more valuable. Company A will look cheaper. Therefore,
the shareholders of Company B have more valuable assets than the shareholders of Company A.
If Company X buys Company B, the shareholders of Company B will be paid more than the
shareholders of Company A in case Company X acquires Company A.
Company X, also, will analyze the balance sheet and the assets of both Company A and Company
B. It will look at the value of the goodwill because it represents the brand reputation.21 Company
X will subtract the amount of equity that is shown on the balance sheet from the market equity
value to calculate the goodwill. Since both companies have 500 of the book value of equity it will
find that Company A has goodwill of 900 and Company B has goodwill of 1200. Again, Company
B will look more valuable because of its higher goodwill value.
Figure 4.2: Company X evaluates Company A and Company B
Even though two companies are very similar, it looks like one is worth more than the other. This
situation is an interest situation to be studied. However, the most important issue has to be
addressed is that the difference comes from the level of non-interest-bearing liabilities. In other
words, the company is more valuable when it has more non-interest-bearing debts.
The most common way to increase non-interest-bearing liabilities is to delay the payments to the
suppliers. It means a company is more valuable as much as it postpones the liabilities to its
suppliers. Also, when a company has more non-interest-bearing liabilities the shareholders will
21 Eddie McLaney, Peter Atrill, Accounting and Finance: An Introduction (9th Edition, Pearson Education Limited, 2017)

22
have more valuable assets. This conflict is the main motivation behind this study and will be
analyzed in this chapter.
4.1.The Problems for Suppliers
The shareholders or the management of companies can change the company’s interest-bearing
debt levels and non-interest-bearing debt levels. They can intentionally or unintentionally can
increase the equity value and the goodwill value of the company for their own benefit. However,
when they do that, these activities might cause some problems for the suppliers. It is easy to explain
and understand with a hypothetical example.
The example includes Company C. Company C has enterprise value of 1800. It has 0 cash. Its
book value of equity is 500. That’s what the shareholders paid in the past and is different from
market value of equity. It has 400 of bank loan which is an interest-bearing liability. Most
importantly pays off its liabilities to the suppliers immediately. Therefore, it has 0 non-interest-
bearing debt.
Figure 4.3: Company C pays off its suppliers immediately
In position 2, Company C changes its payment behavior and delays the payments to the suppliers.
It receives invoices from the supplier but decides to pay off later. This situation increases non-
interest liabilities because now Company C has an obligation that has to be fulfilled. This situation,
also, increases the amount of cash because the company still generates cash flow and it keeps the
cash in the company instead of giving to the suppliers.
Figure 4.4: Company C delays the payments to its suppliers and keeps the cash

23
In position 2, Company C realizes that it has abundant cash. Company C can use this cash for its
advantage in many ways. It can pay off its other liabilities, it can buy some inventory or it can even
invest this money on non-operational assets. However, it should be always kept in mind that this
ease has come only because Company C postpones its liability. In other words, Company C takes
an advantage while the supplier waits for the money. It is likely that the supplier suffers financially
while it waits for the payment.
In our case, Company C decides to pay off its bank loan with the abundant cash. This payment
will decrease the cash and the interest-bearing-liability on the balance sheet, because the company
has no longer an obligation to the bank and it has no cash since it has been paid to the bank.
Company C has still non-interest-bearing liability because it still has debt that has to be paid to the
supplier.
Figure 4.5: Company C pays off the bank loan with the abundant cash
If we compare the position 1 and the position 3 we can see that equity value and the goodwill value
of the company have been increased. Now, Company C has more equity value and more goodwill.
The shareholders of Company C have more valuable assets. Enterprise value of the company does
not change because Company C still generates the same amount of EBITDA and the same
EV/EBITDA multiple.
Figure 4.6: Equity value and goodwill value of Company C before and after the delay in payments to suppliers

24
Company C was able to increase the equity value and the goodwill value of the company with a
series of moves. Postponing the payments to the suppliers was the main step, because Company C
keeps the cash that it can use for its own benefits instead of giving to the supplier.
When the supplier is not paid, the situation might cause some financial problems. The supplier
produces the goods and distributes them to the purchaser companies. It spends some amount to
make these operational activities. These costs mainly include costs of goods sold. The supplier
makes some expenditures but cannot receive their return. If the delay is too long it might cause
some problems to the supplier and the Late Payment Directive of the European Union indicates
those problems22:
“…Although the goods are delivered or the services performed, many corresponding
invoices are paid well after the deadline. Such late payment negatively affects liquidity and
complicates the financial management of undertakings. It also affects their competitiveness
and profitability when the creditor needs to obtain external financing because of late
payment. The risk of such negative effects strongly increases in periods of economic
downturn when access to financing is more difficult”
A study about the Late Payment Directive adds more possible problems as23:
“Indeed, late payment can lead to insolvency and job losses, and it can negatively affect
public procurement and cross-border trade.”
Delays in payments are inevitable in businesses. However, delays might be causing some problems
when they are too long. They provide some benefits to the purchaser company at the expense of
the supplier. It is a systemic problem if we consider the fact that most of the suppliers are small
and medium enterprises.
In conclusion, when we apply the current corporate finance principles about enterprise value,
equity value and the bridge between them; they give an option to the shareholders or the
management of companies to take advantage in some situations at the expense of suppliers.
22 DIRECTIVE 2011/7/EU OF THE EUROPEAN PARLIAMENT AND OF THE COUNCIL 23 Valdani Vicari Associati, Technopolis Group, Ernst & Young, Ex-post Evaluation of Late Payment Directive, ENTR/172/PP/2012/FC – LOT 4 [November 2015] European Commission https://op.europa.eu/en/publication-detail/-/publication/400ecc74-9a54-11e5-b3b7-01aa75ed71a1 accessed ‘1 January 2020’

25
4.2.Non-Interest-Bearing Liabilities: Operational or Financial?
The corporate finance principles say that we have to exclude net debt to reach equity value from
enterprise value. The reason why we are excluding net debt is that net debt items are “financing
items” or “non-operational items”. Net debt equals interest-bearing debt minus cash. Therefore,
interest-bearing debt and cash are financing items and they are not related to the company’s
operational activities. On the other hand, we do not exclude operational balance sheet items from
enterprise value to reach equity value. This is why we are not subtracting non-interest-bearing debt
from enterprise value to calculate equity value.
However, the situation of non-interest-bearing liabilities can be evaluated differently in particular
cases. This evaluation can be explained with the following example.
Figure 4.7: A company that makes commercial transactions, buys supplies from its suppliers each year
Figure 4.7 shows a company that makes some commercial transactions. The company buys goods
from its supplier but delays the payment instead of paying off immediately.

26
In year 1, the supplier delivers the goods but the purchaser does not pay for them. This situation
creates a debt for the purchaser company. This debt can be seen as a non-interest-bearing liability
on the balance sheet of the purchaser company in year 1.
Then, in year 2, the purchaser pays off the debt and gets rid of the non-interest-bearing liability.
However, the purchaser company will need goods to continue its operations and will order new
suppliers from the supplier. The purchaser takes the goods and postpones the payment again in
year 2. The liability will occur on the balance sheet in year 2 as well. This circle will continue
forever because companies are assumed to operate forever unlike human beings.
Therefore, the related non-interest-bearing liability starts to look like a financial item rather than
an operational item. Because when the company delays the payment it keeps the cash and the
company can use this cash for its own benefit. When the duration of the delay is longer, it is more
like a financial item. It is like going to the bank and borrowing some money. However, the good
thing for the purchaser, it does not pay any interest either. So, this delay provides a cash that can
be considered “free money”24 to the company.
Non-interest-bearing liabilities are operational items and they should not be subtracted while
calculating equity value from enterprise value. However; when the purchaser delays the payment
too long the related non-interest-bearing liability starts to look like a financing item rather than an
operational item. The purchaser company can use this excessive cash for its own benefit and most
of the time these beneficial treatments increase the equity value and the goodwill value of the
company as it is shown earlier in this chapter. Fundamentally, non-interest-bearing liabilities are
operational items but this argument is a supporting argument why non-interest-bearing liabilities
can look like financing items and they can be subtracted from the enterprise value to reach equity
value in particular cases.
4.3.Possible Solutions
The corporate finance principles about enterprise value, equity value and the bridge between them
state that interest-bearing debts should be subtracted from the enterprise value to reach equity value.
They, also, say non-interest-bearing debts should not be subtracted from the enterprise value. So,
24 Financial Mindmap, financial-mindmap.com

27
if a company has more non-interest-bearing debts the company will have a higher equity value.
This situation, also, increases the goodwill value of the company as well.
The most common way to increase non-interest-bearing liabilities is to delay the payments of
commercial transactions because commercial debts do not carry an interest burden. So, when a
company delays the payments to the suppliers it will have a higher equity value and a higher
goodwill value.
So, what is the problem? The problem is that if a company is able to increase its non-interest-
bearing debt levels, the company can increase the equity value and the goodwill value. Also, it can
use the excessive cash that is explained earlier for its operational activities. The, what is the
solution?
Firstly, delays in payments are inevitable in business environments. Delays cannot be prohibited
because it makes the financial and economic system much more complex and the legal systems
cannot provide sufficient sources for this kind of treatment.
Secondly, the rationale behind the calculation of the bridge between enterprise value and equity
value is in line with the corporate finance principles. We should subtract interest-bearing debts
from enterprise value to reach equity value because they are financing items and we should not
subtract non-interest-bearing debts because they are operational items. However, it may give an
incentive to companies to increase their non-interest-bearing debts to increase the company’s
equity value. Therefore, we need to treat differently when there is a misuse.
It is now important to determine when there is a misuse. It is hard to draw a line but the most
logical solution would be about the duration of the delay. Because late payments are not problem,
the problem occurs when the delay is too long. The Late Payment Directive of the European Union
combats25 late payments in a similar way. It can will analyzed in this study in next chapters.
The next question is that “how long is too long?” The Late Payment Directive states 60 days.26
Under the Dutch law this period is 30 days in business transactions but the parties can extent it to
25 DIRECTIVE 2011/7/EU OF THE EUROPEAN PARLIAMENT AND OF THE COUNCIL 26 Ibid

28
60 days.27 The period can change according to the region or the features of industries. All in all, it
is an important legal challenge. National and international regulatory bodies should take
precautions about the issue because solid economic systems require solid small and medium sized
enterprises. Regulators also should take some other measures about the safety and financial health
of the SMEs.
27 Valdani Vicari Associati, Technopolis Group, Ernst & Young, Ex-post Evaluation of Late Payment Directive, ENTR/172/PP/2012/FC – LOT 4 [November 2015] European Commission https://op.europa.eu/en/publication-detail/-/publication/400ecc74-9a54-11e5-b3b7-01aa75ed71a1 accessed ‘1 January 2020’

29
5. APPLICATIONS ON THE SAMPLE COMPANIES This thesis is about legal protection of suppliers. It argues that applying the current corporate
finance principles creates some problems for suppliers, because the amount of non-interest-bearing
liabilities are not excluded from the enterprise value to reach equity value. This situation increases
equity value and goodwill of the company. If the amount of non-interest-bearing liabilities increase
it means more value for equity shareholders. On the other hand, non-interest-bearing liabilities
mean delay of the payments to suppliers. It makes harder to arrange their financial positions for
suppliers.
Therefore, analyzing the amount of non-interest-bearing liabilities is crucial. If a company has too
much non-interest-bearing liabilities it is likely a problem for its suppliers. The question is that
“how much non-interest-bearing liabilities are too much?” This study argues that the amount of
non-interest-bearing liabilities should be in line with the amount of current assets. It means if a
company has more non-interest-bearing liabilities than its current assets, it is likely a problem for
its suppliers. It can be explained with accounts payable and accounts receivable balance sheet items
easily. If a company has more accounts payables than its accounts receivables, it means the
company has excessive cash because of this imbalance. Also, this situation might cause some
financial problems for the suppliers who are counterparties for the accounts payable liabilities.
This study will look at the amounts of non-interest-bearing liabilities and current assets of the
companies on their balance sheets. This analysis will be done for 10 European and 10 US
companies from 5 different industries. Therefore, this thesis will look at the differences between
region and the differences between industries.
5.1.Explanation of Visuals
This study analyzes balance sheets of companies. It does that by converting balance sheets into
visualizations. In order to do that the financial model of Financial Mindmap28 has been used. There
are different colors that represent each balance sheet category. All the 20 companies are public
companies and the balance sheets data are from 2017 and 2018.
28 Financial Mindmap, financial-mindmap.com

30
Figure 5.1: Explanation of the Dataset for the Balance Sheets of AMSL and Lam Research
Figure 5.1 shows a visualization of the balance sheets of ASML and Lam Research. Firstly, the
first two columns for each company show the balance sheets in 2018 and the last two columns
show the balance sheets in 2017.
Secondly, for each year the left column represents assets and the right column represents liabilities
and equity.
Thirdly, on the assets side; the dark green block represents fixed assets, the green block represents
current assets and the light green block represents cash position of the company. On the liabilities
side, the blue block represents equity, the light blue block represents provisions of companies, the
red block represents interest-bearing liabilities and the orange block represents non-interest-
bearing liabilities.
In this study, we have to compare the amount of non-interest-bearing liabilities with the amount
of current assets. Therefore, we have to compare the level of orange blocks (non-interest-bearing
liabilities) and the level of green blocks (current assets).
If the Figure 3.1 is interpreted in the context of this study, it can be stated that both companies
have more non-interest-bearing liabilities than their current assets in 2018 and 2017. It means both
companies might be causing problems to their suppliers. However, Lam Research is in a better
position since the gap between non-interest-bearing liabilities and current assets is lower when
compared to ASML.

31
This analysis will be applied to the 20 companies from five different sectors in the following
sections.
5.2.Semiconductor Industry
The semiconductor industry is selected to represent the manufacturing industries. Manufacturing
companies need high amounts of fixed assets to generate goods. These fixed assets are mostly
factory buildings and machines. The importance of the semiconductor industry is because of the
nature of the business. The business requires high amounts of current assets and current non-
interest-bearing liabilities. The semiconductor manufacturing companies order high amounts of
supplies from its suppliers and have large amounts of inventory. Also, both European Union and
the United States have global players in the industry.

32
Figure 5.2: Balance Sheets of Semiconductor Manufacturing Companies
ASML is a Dutch supplier company for the semiconductor industry. It is a listed company. Lam
Research is a US company and it is similar to ASML in terms of their business operations. Lam
Research has a lot of cash. They both have decent levels of non-interest-bearing when compared
to their current assets levels.
A Dutch company NXP and an American company ON Semiconductors are both Semiconductor
manufacturers. When their balance sheets are analyzed, it can be found that ON Semiconductor
has a better position in terms of non-interest-bearing liabilities. It has more current assets than non-
interest-bearing liabilities and the difference is larger than NXP’s difference.
5.3.Telecom Industry
Telecom companies have large amounts of fixed assets due to the nature of their businesses.
They own many base stations and other fixed tangible assets. It is worth to look at that industry
for the purpose of this study.
33
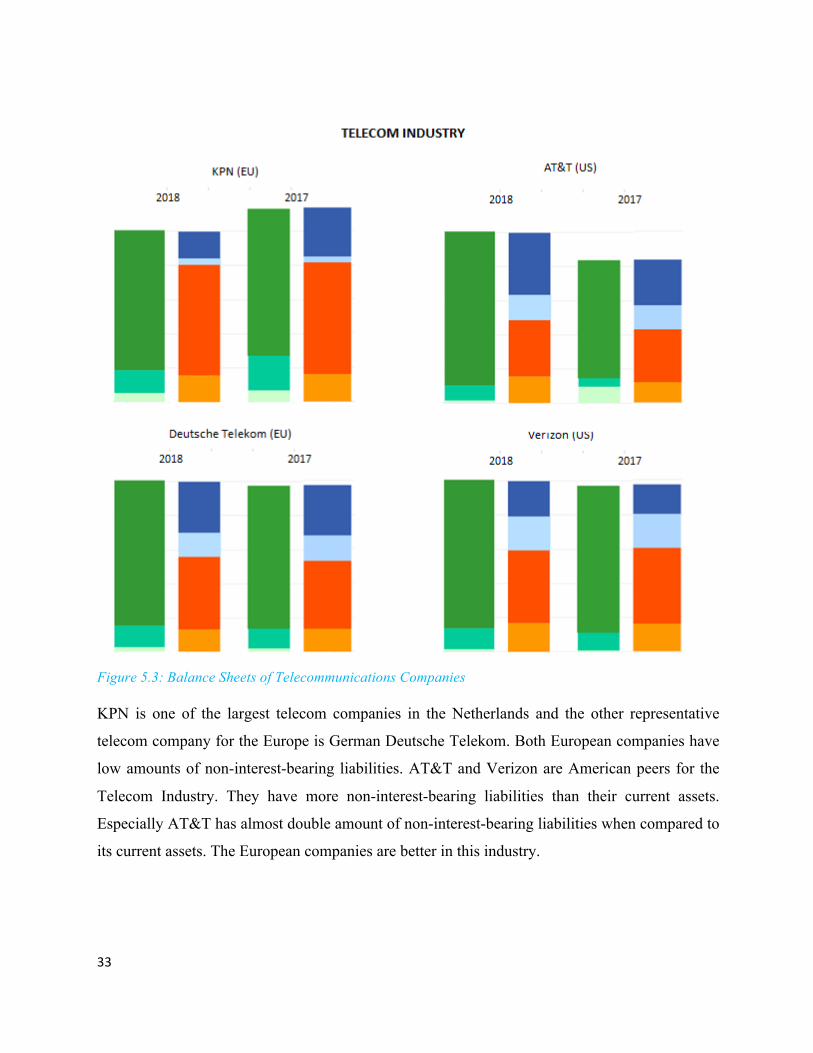
Figure 5.3: Balance Sheets of Telecommunications Companies
KPN is one of the largest telecom companies in the Netherlands and the other representative
telecom company for the Europe is German Deutsche Telekom. Both European companies have
low amounts of non-interest-bearing liabilities. AT&T and Verizon are American peers for the
Telecom Industry. They have more non-interest-bearing liabilities than their current assets.
Especially AT&T has almost double amount of non-interest-bearing liabilities when compared to
its current assets. The European companies are better in this industry.

34
5.4.Brewing Industry
Brewing companies have huge amounts of intangible fixed assets such as goodwill. They also
have large cash amounts. It is interesting to look at companies in this kind of industry.
Figure 5.4: Balance Sheets of Brewing Companies
InBev is a Belgium drink company. Heineken is a Dutch beer producer. Both European companies
have more non-interest-bearing liabilities than their current assets in 2018 and 2017. Constellation
Brands and Craft Brew Alliance are American peers of InBev and Heineken. These US companies
have more current assets than their non-interest-bearing liabilities. In particular, Constellation
Brands is at a decent position with a large amount of current assets. It can be said that US brewers
are better than EU brewers in terms of taking care of their suppliers.

35
5.5.Foods Industry
Consumer goods companies have large amounts of currents assets and non-current liabilities.
The selected companies are dairy products companies who depend on small and medium-sized
suppliers.
Figure 5.5: Balance Sheets of Dairy Foods Companies
FrieslandCampina is a Dutch multinational dairy products company. Danone is a French
multinational food company. Dean Foods and Kraft Heinz are the American competitors of
FrieslandCampina and Danone. FrieslandCampina (EU) and Dean Foods (US) have more current
assets than their non-interest-bearing liabilities in 2018 and 2017. However, the situation is

36
opposite for Danone (EU) and Kraft Heinz (US) in both years. Even it is very close, it can be said
that European companies are slightly better than their US competitors when it comes to the amount
of non-interest-bearing liabilities.
5.6.Retail Industry
Retail companies are known with their highly negative net working capitals. They have huge
amounts of non-interest-bearing liabilities due to their business model. It is one of the most
useful industries to be analyzed in this study.
Figure 5.6: Balance Sheets of Retail Companies
Ahold Delhaize is the owner company of the largest retail brand in the Netherlands. Jumbo is
another supermarket chain in the Netherlands. Walmart is one of the largest companies in the world

37
and represent the retail industry in the US alongside Kroger. It can be instantly seen that all the
four companies have more non-interest-bearing liabilities than their current assets. It means
suppliers of retail companies might face some financial problems due to these payment behaviors
of their purchasers. The gap between non-interest-bearing liabilities and current assets are larger
in the European companies especially when the balance sheet of Jumbo is analyzed.
5.7.Results
This study analyzes the balance sheets of 10 European and 10 American companies from 5
different sectors. The main analysis is to compare the current assets levels and the non-interest-
bearing liabilities levels of the companies. If a company has more non-interest-bearing liabilities
than its current assets, it is likely that the company uses non-interest-bearing liabilities as a funding
source for its assets while it creates some problems for its suppliers. If the gap increases on the
side of non-interest-bearing liability levels, it means bigger problems for suppliers.
If the 20 companies analyzed in this context the followings can be concluded. The European
companies in the telecom and consumer foods industries have lower levels of non-interest-bearing
liabilities than their American peers when compared to the current assets levels. It means in these
industries American companies might create bigger problems for their suppliers. For the
semiconductor, brewing and retail industries the American companies have lower levels of non-
interest-bearing liabilities than their European peers when compared to the current assets levels.
For these industries, European companies have a worse position and they might cause some
problems for their suppliers.
It is clear that there are differences between regions and one of the most important differences is
the regulatory difference. Thus, the next chapter will analyze the Late Payment Directive of the
European Union.

38
6. LATE PAYMENT DIRECTIVE Companies can take many advantages by delaying the payments to their suppliers. These
advantages are explained in the earlier chapters in this study. Therefore, it is important to protect
suppliers while purchaser companies try to take advantage. One of the important ways to protect
suppliers is fighting with late payments. The European Union tries to do that with the Late Payment
Directive and this chapter is about analysis of this legal act.
Directive 2011/7/EU of the European Parliament and of the Council is a directive to combat late
payments in commercial transactions. Directive 2011/7/EU is called the Late Payment Directive.
It is a directive in European Law. So, the Member States can choose the form and method of the
Directive. Directives are softer legal tools than regulations which are binding and applicable
immediately. Late Payment Directive is a replacement of Directive/2000/35/EC which used to
combat late payment as well.
The directive points out some possible problems due to late payments29 as it is discussed in this
thesis as well:
“Many payments in commercial transactions between economic operators or between
economic operators and public authorities are made later than agreed in the contract or
laid down in the general commercial conditions. Although the goods are delivered or the
services performed, many corresponding invoices are paid well after the deadline. Such
late payment negatively affects liquidity and complicates the financial management of
undertakings. It also affects their competitiveness and profitability when the creditor needs
to obtain external financing because of late payment. The risk of such negative effects
strongly increases in periods of economic downturn when access to financing is more
difficult.”
The directive is about late payments in commercial transactions. Commercial transactions are the
most common source for non-interest-bearing liabilities and they what purchaser companies can
take advantage of. The Directive describes commercial transactions in Article 230:
29 Ibid 30 Ibid

39
“‘commercial transactions’ means transactions between undertakings or between
undertakings and public authorities which lead to the delivery of goods or the provision of
services for remuneration”
The most important idea behind the Directive is the rights that are given to trade creditors. They
are mostly suppliers in commercial transactions and they are often SMEs. It gives some particular
rights to trade creditors but at the same time it changes valuation of trade debtors. This is where
the Directive and the purpose of this study intersects. The right of trade creditors in case of late
payment are as follows31:
“Late payment constitutes a breach of contract which has been made financially attractive
to debtors in most Member States by low or no interest rates charged on late payments
and/or slow procedures for redress. A decisive shift to a culture of prompt payment,
including one in which the exclusion of the right to charge interest should always be
considered to be a grossly unfair contractual term or practice, is necessary to reverse this
trend and to discourage late payment. Such a shift should also include the introduction of
specific provisions on payment periods and on the compensation of creditors for the costs
incurred, and, inter alia, that the exclusion of the right to compensation for recovery costs
should be presumed to be grossly unfair.”
So, when a credit debtor does not make the payment to the trade creditor in time, the creditor can
claim a certain amount of interest. The Directive tries to protect the creditor by imposing some
burden on the debtor. The debtor has to pay more in case the creditor exercises its right. However,
the Directive also affects the valuation of the debtor. The liability occurs from the commercial
transaction is a non-interest-bearing liability. If the creditor claim interest on the commercial debt,
the liability becomes an interest-bearing liability and we have to exclude interest-bearing liabilities
from enterprise value to reach equity value. Therefore, when the creditor claims interest the equity
value and the goodwill value of the debtor will decrease. The Directive gives another reason to the
debtor to pay its commercial debt in time. Also, trade debtors are no longer able to increase their
equity value and goodwill value at the expense of financial health of trade creditors because even
if they delay the payments they cannot raise their equity value and goodwill value.
31 Ibid

40
Figure 6.1: How equity value and goodwill of the trade debtor change if the trade creditor exercises its right to claim
interest32
The European Commission has published a study33 about the evaluation of the Late Payment
Directive. This study analyzes effectiveness, relevance, efficiency, coherence and
complementarity of the Directive.34 It states that 78% of companies in Europe encountered with
late payment.35 Studying late payment is very important when this fact is considered.
More importantly, the evaluation study says that SMEs can encounter late payment events much
more than bigger businesses36 because of their disadvantaged positions. Again, the study shows
that SMEs are less aware than bigger businesses about the late payment and the rights it gives
them.37
Also, the study shows that even though SMEs know their rights they do not exercise them.38
Because suppliers are afraid of ruining their business relationships with purchaser companies.39
The suppliers are SMEs and often at a disadvantaged position. They have to sell their goods to
maintain their business. On the other hand, purchaser companies have many more options and they
can easily change their suppliers. It is an important issue that needs more attention. Regulatory
bodies can find new ways to encourage SMEs. For example, they can make the purchaser company
to buy from the same supplier for the next few times if the payment is too late.
32 Ibid 33Valdani Vicari Associati, Technopolis Group, Ernst & Young, Ex-post Evaluation of Late Payment Directive, ENTR/172/PP/2012/FC – LOT 4 [November 2015] European Commission https://op.europa.eu/en/publication-detail/-/publication/400ecc74-9a54-11e5-b3b7-01aa75ed71a1 accessed ‘1 January 2020’ 34 Ibid 35 Ibid 36 Ibid 37 Ibid 38 Ibid 39 Ibid

41
The Directive is insufficient in terms of reducing payment durations as well as the evaluation study
states40:
“Payment duration has decreased by a small extent in recent years… While it is difficult
to isolate the reasons for this progress, there is little evidence that the Directive has had
an impact on payment behaviour and the practice of late payment.”
In conclusion, the Late Payment Directive is effective overall. However, it does not provide
sufficient benefits for SMEs. SMEs are the most important group of businesses that has to be
protected from the adverse effects of late payments. Therefore, even the numbers show that the
Directive is effective; it does not meet the expectations about the main issue. Counterparties of
SMEs, who are often bigger corporations, are still able to increase their equity value and goodwill
value by delaying commercial payments at the expense of financial health of SMEs. However,
regardless of the effectiveness the main idea behind the Directive is decent. When the payment is
late non-interest-bearing debts become interest-bearing debts and interest-bearing debts are
subtracted from enterprise value to reach equity value. Therefore, the Directive is able to restrain
companies to increase their equity value and goodwill values at the expense of suppliers.
40 Ibid

42
7. CONCLUSION The main idea of this thesis is that when corporate finance principles about enterprise value, equity
value and the bridge between them are applied they might cause some problems. The problem is
between the equity holders and the suppliers of companies. The problem occurs when the company
delays its commercial payments. The company keeps the money inside the firm instead of giving
it to the supplier. It can take advantage from this situation in many ways. It is easy to anticipate
that this situation might cause some financial problems to the supplier since it could not take its
money on time.
The main solution to the issue is subtracting non-interest-bearing liabilities from enterprise value
to reach equity value. However, corporate finance principles state the opposite. Therefore, the
research question of this thesis is “why and when from valuation perspective should we subtract
non-interest-bearing liabilities from enterprise value to reach equity value?” The answers are “to
protect suppliers” and “when the delay is too long”. This study is about “how we can protect
suppliers” and “when we can say that the delay is too long”.
In order to understand how current corporate finance principles about enterprise value, equity
value and the bridge between them might be harmful for suppliers we should understand these
concepts. Therefore, Chapter 2 firstly explains common valuation methods for companies. It uses
multiples valuation method for the examples. Then, the concepts of enterprise value and equity
value are explained. The difference between them is very important for the study because it gives
an idea about what items should be in the bridge between enterprise value and equity value. The
difference between enterprise value and equity value comes from the value attributable to debt
holders and any other interest holders. Finally, chapter 2 explains the concept of goodwill and how
it is related to the study. We need to analyze debt holders and other interest holders to establish
the bridge between enterprise value and equity value. They can be found on the balance sheets of
companies. Therefore, Chapter 3 makes the classification of balance sheet items.
Chapter 4 shows how trade debtors can take advantages from late payments. It gives an example
about paying off the bank loan. Other scenarios that a company benefits from the late payment can
be discussed in another study. For example, what happens if the trade debtor buys new physical
asset or invests on some assets unrelated to the company’s operations by using the excessive

43
money. Chapter 4, also, shows that non-interest-bearing balance sheet items start to turn out be
financing items as the payment duration increases. Chapter 4 suggests a solution that is imposing
some other burdens on the trade debtor when the delays is too long. This study briefly discusses
of the concept of “too long” and it can be the main topic for another study.
Chapter 5 is the data analysis part of this thesis. It analyzes balance sheets of 10 American and 10
European public companies from 5 different industries. It uses a financial model to visualize the
balance sheets. The main idea is to compare non-interest-bearing liability levels and current assets
levels of companies because if a company has too much non-interest-bearing liabilities compared
to current assets, in other words if a company has a negative working capital, it is likely to cause
financial problems to its suppliers. The study finds that in the telecom industry and the consumer
goods industry European companies have lower levels of non-interest-bearing debts and in the
semiconductor industry, the brewing industry and the retail industry American companies have
lower levels of non-interest-bearing debts.
Chapter 6 discusses the purpose and implications of Late Payment Directive of the European
Union. It is a directive to combat late payments in commercial transactions. It gives a right to trade
creditors to claim an interest if the debtor does not make the payment in time. If the trade creditor
exercises its right to claim an interest; non-interest-bearing debt becomes an interest-bearing debt
and it should be evaluated differently from valuation perspective.
The directive is effective in general with 86% awareness rate41 . However, even though the
companies are aware of their rights they do not exercise them because they want to maintain their
good business connections. More importantly, SMEs are very disadvantaged in this directive. They
face more late payments. They are not aware of their rights. Even though they know their rights
they do not exercise those because they want to keep their relationships with the purchaser
companies as good as possible. Therefore, it can be said that the Late Payment Directive is not
effective to protect SMEs.
SMEs are systematically important for the economy. Therefore, their financial health is crucial.
Applying corporate finance principles might be harmful for the financial health of SMEs. If we
41 Valdani Vicari Associati, Technopolis Group, Ernst & Young, Ex-post Evaluation of Late Payment Directive, ENTR/172/PP/2012/FC – LOT 4 [November 2015] European Commission https://op.europa.eu/en/publication-detail/-/publication/400ecc74-9a54-11e5-b3b7-01aa75ed71a1 accessed ‘1 January 2020’

44
want to protect SMEs, we need to combat commercial late payments and one of the easiest ways
to do that is imposing interest burden when the delay is too long. After that, bigger enterprises
cannot take advantages about their valuations. In this way, we are able to protect SMEs financially
and to value companies properly.

45
8. BIBLIOGRAPHY Literature & Books
• Aswath Damodaran, Damodaran on Valuation, (2nd Edition, John Wiley & Sons,
Incorporated, 2006)
• Bart M. Lambrecht, Grzegorz ‘A Theory of Net Debt and Transferable Human Capital’
[2013] Review of Finance, European Finance Association, vol 17(1), pages 321-368
http://ssrn.com/abstract=1323855 accessed on ’13 October 2019’
• Edward Bodmer, Corporate and Project Finance Modeling: Theory and Practice, Wiley,
2014. ProQuest Ebook Central, http://ebookcentral.proquest.com/lib/uvtilburg-
ebooks/detail.action?docID=1813673
• Eddie McLaney, Peter Atrill, Accounting and Finance: An Introduction (9th Edition,
Pearson Education Limited, 2017)
• Nicholas Schimidlin, Art of Company Valuation and Financial Statement Analysis: A
Value Investor’s Guide with Real-Life Case Studies (John Wiley & Sons, Incorporated,
2014)
• Paul Pignataro, Leveraged Buyouts: A Practical Guide to Investment Banking and
Private Equity (John Wiley & Sons, Incorporated, 2013)
• Paul Pignataro, Financial Modeling and Valuation: A Practical Guide to Investment
Banking and Private Equity John Wiley & Sons, Incorporated, 2013. ProQuest Ebook
Central Accessed on 12/10/2019
• Thomas, Rawley, and Benton E. Gup. The Valuation Handbook : Valuation Techniques
from Today's Top Practitioners, John Wiley & Sons, Incorporated, 2009. ProQuest
Ebook Central, https://ebookcentral.proquest.com/lib/uvtilburg-
ebooks/detail.action?docID=468905. Accessed on 10/11/2019
• Others include Hennessy and Whited (2005), Acharya et al. (2007) and Gamba and
Triantis (2008) according to Lambrecht and Pawlina

46
Official Publications
• DIRECTIVE 2011/7/EU OF THE EUROPEAN PARLIAMENT AND OF THE
COUNCIL
• International Valuation Standards 2017 (International Valuation Standards Council,
2017)
• Late Payment Directive, the European Commission
https://ec.europa.eu/growth/smes/support/late-payment_en
• Valdani Vicari Associati, Technopolis Group, Ernst & Young, Ex-post Evaluation of
Late Payment Directive, ENTR/172/PP/2012/FC – LOT 4 [November 2015] European
Commission https://op.europa.eu/en/publication-detail/-/publication/400ecc74-9a54-
11e5-b3b7-01aa75ed71a1 accessed on ‘1 January 2020’
Internet Sources
• Financial mindmap, financial-mindmap.com
• http://aswathdamodaran.blogspot.com/2013/06/a-tangled-web-of-values-enterprise.html
• Mergers & Inquisitions / Breaking Into Wall Street. Online Video Clips. YouTube 15
May 2012