a design pattern for observational investigation assessment tasks
TRANSCRIPT
Robert Mislevy University of Maryland
Report Series Published by SRI International
P A D IProject: Application of Evidence-Centered Design to State Large-Scale Science Assessment
A Design Pattern for Observational Investigation Assessment Tasks
Robert J. Mislevy, Min Liu, & Youngmi Cho University of Maryland; Dennis Fulkerson & Paul Nichols, Pearson; Daniel Zalles, Ron Fried, Geneva Haertel, Britte Cheng, Angela DeBarger, & Serena Villalba , SRI International; Alexis Mitman Colker, Consultant; Kathleen Haynie, Kathleen Haynie Consulting; Larry Hamel, Codeguild, Inc.
Large-Scale Assessment Technical Report 2| May 2009

SRI InternationalCenter for Technology in Learning333 Ravenswood AvenueMenlo Park, CA 94025-3493650.859.2000http://ecd.sri.com
Technical Report Series EditorsAlexis Mitman Colker, Ph.D., Project ConsultantGeneva D. Haertel, Ph.D., Principal InvestigatorRobert Mislevy, Ph.D., Co-Principal InvestigatorRon Fried, Documentation Designer
Copyright © 2009 SRI International. All Rights Reserved.

I
A P P L I C A T I O N O F E V I D E N C E - C E N T E R E D D E S I G N F O R L A R G E -
S C A L E S T A T E S C I E N C E A S S E S S M E N T
T E C H N I C A L R E P O R T 2
A Design Pattern for Observational InvestigationAssessment Tasks
Prepared by:
Robert J. Mislevy, Min Liu, and Youngmi Cho
University of Maryland
Dennis Fulkerson and Paul Nichols
Pearson
Daniel Zalles, Ron Fried, Geneva Haertel, Britte Cheng, Angela DeBarger, and Serena Villalba
SRI International
Alexis Mitman Colker
Consultant
Kathleen Haynie
Kathleen Haynie Consulting
Larry Hamel
Codeguild, Inc.

II
Contents
Abstract ......................................................................................................................... 11.0 Introduction........................................................................................................ 22.0 Evidence-Centered Design and Assessment Argument .................................. 4
2.1 Evidence-Centered Design............................................................................... 42.2 Assessment Argument ..................................................................................... 62.3 Attributes of a Design Pattern........................................................................... 8
3.0 Observational Investigation............................................................................. 113.1 Observational Investigation in the Inquiry Process .......................................... 113.2 Minnesota Science Standard and National Science Standard ......................... 14
4.0 Design Patterns for Observational Investigation............................................ 174.1 Overview and Use.......................................................................................... 204.2 Focal KSAs, Supported Benchmarks and Characteristic Task Features .......... 214.3 Additional KSAs ............................................................................................. 314.4 Variable Task Features .................................................................................. 344.5 Narrative Structure Considerations for larger investigations ............................ 374.6 Work Products and Potential Observations..................................................... 38
5.0 Discussion ....................................................................................................... 41References................................................................................................................... 43

III
Tables
Table 1: Attributes of a Design Pattern............................................................................. 9
Table 2: Writer-friendly Version of Design Pattern for Observational Investigation .......... 18
Table 3: Minnesota Benchmarks Related to Observational Investigations....................... 22

IV
Figures
Figure 1: Layers of Evidence-Centered Design for Educational Assessment ..................... 6
Figure 2: A Toulmin argument diagram for assessment arguments .................................. 7
Figure 3: Minnesota Item Sample ‘Weather’ ...................................................................26
1
Abstract
The significance of inquiry skills is widely acknowledged in science practice
across many areas. Unlike experimentation, another form of inquiry skill,
observational investigation, has been much ignored in science education and
thus science assessment. Drawing on research development in assessment
design, this paper provides a design pattern to help assessment designers create
tasks assessing students’ complex scientific reasoning skills in observational
investigation. This design pattern lays out considerations regarding targeted
knowledge and skills in this inquiry process, characteristics of situations in which
student can evidence that skill, and ways of evaluating their work with specific
examples.

2
1.0 Introduction
Recent reform efforts in American science education emphasize inquiry skills that
are vital in scientific practice4. Students need to be able to conduct investigations
in order to deeply understand scientific models and theories, as well as the
terms, concepts, and procedures they are grounded on (Smith & Reiser, 2005).
Much science education research has been done on teaching and assessing
students’ skills in experimentation, which is considered as the primary means of
inquiry in science. However, another form of inquiry, observational investigation
that is more appropriate in other situations frequently arising in many areas of
science such as astronomy and geology, has received far less attention (Smith &
Reiser, 2005; Tomkins & Tunnicliffe, 2001). Consequently, exploring how to
assess students’ capabilities in observational investigation validly and efficiently
is a topic of some importance.
This report addresses the topic of designing tasks that provide evidence about
students’ capabilities in observational investigation, in a way that supports such
efforts across science areas and levels of education. It draws on research on
assessment design carried out under the evidence-centered design approach
(ECD; Mislevy, Steinberg, & Almond, 2003; Mislevy & Haertel, 2006).
Specifically, it presents an assessment design pattern (Mislevy, et al., 2003) for
assessing scientific reasoning skills in observational investigation. Design
patterns are a tool developed in the Principled Assessment Design for Inquiry
(PADI) project, supported by the National Science Foundation (NSF). The
particular design pattern was constructed for the project “Application of Evidence-
Centered Design to State Large-Scale Science Assessment,” also supported by
NSF to apply ECD in the context of a state-level large-scale accountability
assessment in science. It was developed collaboratively by researchers, test
developers, and content experts from SRI International, the University of
Maryland, Pearson, and the State of Minnesota. It is being applied in operational
4 Inquiry and the National Science Education Standards at www.nap.edu
3
work by the committees of Minnesota item-writers (mostly current or retired
Minnesota science teachers) who, with coordination, training, and support from
Pearson and the staff of the Minnesota Department of Education, create the
Minnesota Comprehensive Assessment (MCA-II) in science.
The following section sets the stage for the Observational Investigation design
patterns with background on ECD and PADI, then on observational investigation.
The attributes of the design pattern are then discussed in detail and illustrated
with example tasks.

4
2.0 Evidence Centered Design and Assessment Arguments
In order to show how design patterns support the authoring of tasks that assess
students’ capabilities in observational investigation, we briefly review the ECD
framework and Toulmin’s (1958) structure for evidentiary argument and its
relation to the design pattern.
2.1 Evidence–Centered Assessment Design
Evidence-centered assessment design (ECD) provides principles, patterns, and
examples to guide the task designers through articulating the theoretical
foundation to the operational work of assessment development (e.g., item writing,
directions, test administration, scoring procedures) (Mislevy, Almond, & Lukas,
2004). This structured framework explicates, and thus enables designers to more
efficiently control the elements and underlying processes of assessment design.
ECD lays out the structure/process of an assessment design in terms of five
layers, which conceptualize different work being carried out by different experts
or parties at different stages of design process. Figure 1 summarizes the ECD
layers in a way that reflects successive refinement and reorganization of
knowledge about the content domain and the purpose of the assessment, from a
substantive argument to the specific elements and processes needed in its
operation.
As the first stage in assessment design, Domain analysis concerns marshaling
substantive information about the domain and it leads us to understand the
knowledge, skills, and abilities people use in a domain of interest, the
representational forms of them, characteristics of good work, and features of
situations. All of this information has important implications for assessment
design, but most of them are neither originally created nor presented in the
structure of argument. The cognitive research on observational investigation

5
discussed below and the identification of relevant Minnesota Academic
Standards in Science5 are examples of work in Domain Analysis.
In the Domain Modeling layer, information identified in Domain Analysis is
organized along the lines of assessment arguments. Without getting tangled in
the technical details of assessment design and psychometric models, this layer
directs researchers to clarify what is meant to be assessed and how and why to
do so. A tool for supporting work in Domain Modeling, design patterns (DP),
helps the assessment designer think through the key elements of an assessment
argument in narrative form. Details of design patterns will be given later in a
section that reviews the attributes of a design pattern and in a section that
discusses in detail the contents of the design pattern for assessing students’
proficiencies with regard to observational investigations.
While the other three remaining layers of the ECD framework are less directly
related to the purpose of this design pattern, they are introduced for the sake of
completeness. The reader is referred to Almond, Steinberg, and Mislevy (2003)
and Mislevy and Riconscente (2006) for further discussion on these layers.
The Conceptual Assessment Framework (CAF) concerns technical specifications
for operational elements. An assessment argument laid out in narrative form at
the Domain Modeling layer is here expressed in terms of coordinated pieces of
machinery such as measurement models, scoring methods, and delivery
requirements. The commonality of data structures and reusability of the central
CAF models offer opportunities to bring down the costs of task design, which is
especially important for computer-based tasks.
The fourth layer, the Assessment Implementation includes activities carried out to
prepare for the operational administration for testing examinees, such as
5
http://education.state.mn.us/mdeprod/idcplg?IdcService=GET_FILE&dDocName=000282&RevisionSelectionMethod=latestReleased&Rendition=primary

6
authoring tasks, calibrating items into psychometric models, piloting and finalizing
scoring rubrics, producing assessment materials and presentation environments,
and training interviewers and scorers, all in accordance with the assessment
arguments and test specifications created in previous stages.
The final layer, Assessment Delivery, includes activities in presenting tasks to
examinees, evaluating performances to assign scores, and reporting the results
to provide feedback or support decision making.
Figure 1. Layers of Evidence-Centered Design for Educational Assessment
2.2 Assessment Arguments
An educational assessment can be viewed as an evidentiary argument that make
inference from what student say, do or make in task settings, to claims that what
they can know, can do, or accomplish more generally (Messick, 1994). Toulmin
(1958) provides a useful schema for the general structure of argument. Figure 2
adapts his terminology and representations to educational assessment

7
arguments (Mislevy, 2003, 2006). In this diagram, a series of logically connected
claims are supported by data via warrants, subject to alternative explanations.
The claims concern aspects of proficiency that students possess, i.e., what they
know or can do in various situations. Data are required to support claims. In the
case of assessment, data consist of students’ behaviors in particular task
situations, the features of task situations, and other relevant information about
the relationship between the student and the task situation (e.g., personal or
instructional experience; in the case of the MCA-II, science content from
benchmarks at grades at the level lower than the assessment at hand, such as
presuming Grade 5 benchmarks for the Grade 8 test). The arrow going to the
claim represents a logically reasoned inference by means of a warrant. The
warrant posits how responses in situations with the noted features depend on
proficiency. The primary source of the warrants is the underlying psychological
conceptualization of knowledge and its acquisition, i.e., a psychological
perspective, which shapes the nature of claims that assessments aim to make
and of the data that are needed to evidence them. Alternative explanations for
poor performance are deficits in the knowledge or skills that are needed to carry
out a task but are not focal to the claims.
Figure 2. A Toulmin argument diagram for assessment arguments
8
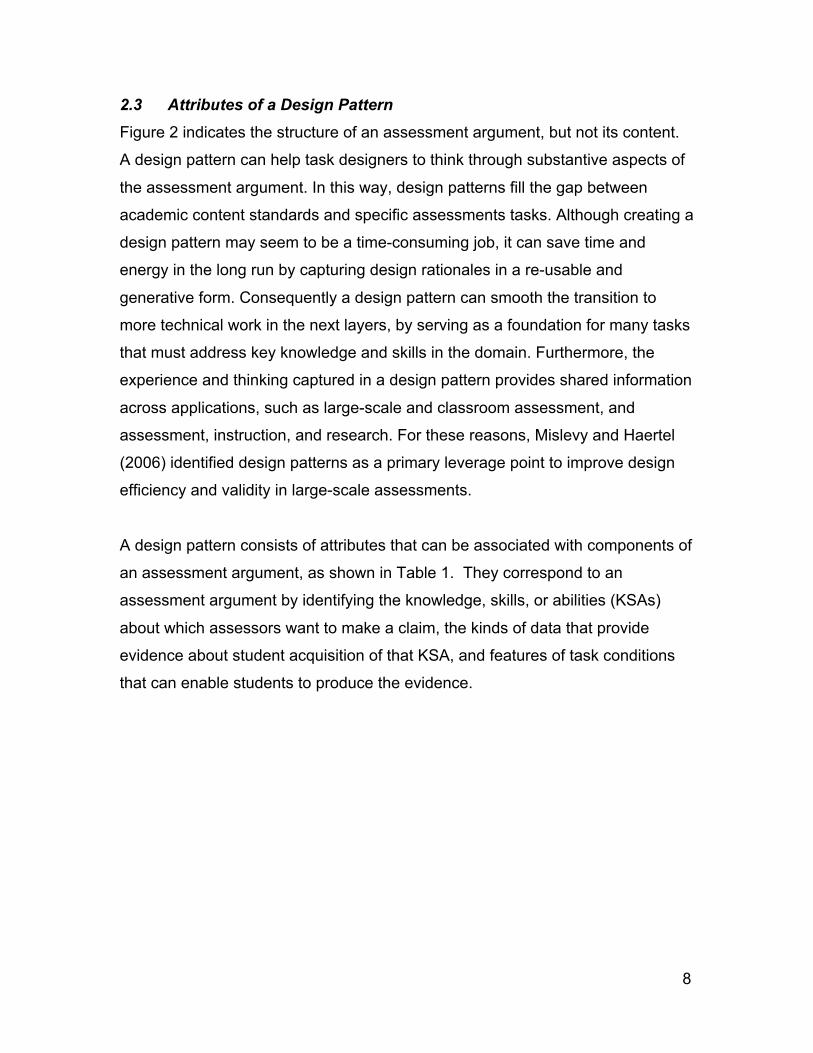
2.3 Attributes of a Design Pattern
Figure 2 indicates the structure of an assessment argument, but not its content.
A design pattern can help task designers to think through substantive aspects of
the assessment argument. In this way, design patterns fill the gap between
academic content standards and specific assessments tasks. Although creating a
design pattern may seem to be a time-consuming job, it can save time and
energy in the long run by capturing design rationales in a re-usable and
generative form. Consequently a design pattern can smooth the transition to
more technical work in the next layers, by serving as a foundation for many tasks
that must address key knowledge and skills in the domain. Furthermore, the
experience and thinking captured in a design pattern provides shared information
across applications, such as large-scale and classroom assessment, and
assessment, instruction, and research. For these reasons, Mislevy and Haertel
(2006) identified design patterns as a primary leverage point to improve design
efficiency and validity in large-scale assessments.
A design pattern consists of attributes that can be associated with components of
an assessment argument, as shown in Table 1. They correspond to an
assessment argument by identifying the knowledge, skills, or abilities (KSAs)
about which assessors want to make a claim, the kinds of data that provide
evidence about student acquisition of that KSA, and features of task conditions
that can enable students to produce the evidence.

9
Table 1: Attributes of a Design Pattern6
Attribute Definition Assessment
Argument
Component
Name Short name for the design pattern
Summary Brief description of the family of tasksimplied by the design pattern
Rationale Nature of the KSA of interest andhow it is manifest
Warrant
Focal KSAs The primary knowledge/skill/abilitiestargeted by this design pattern
Claim
SupportedBenchmarks
Benchmarks in the MCA-II testspecifications corresponding toMinnesota Standards that this designpattern supports (specific to theMCA-II context)
Claim
AdditionalKSAs
Other knowledge/skills/abilities thatmay be required by tasks motivatedby this design pattern
Claim, if relevant;AlternativeExplanation, ifirrelevant
Potential WorkProducts
Features of work products thatencapsulate evidence about FocalKSAs
Data concerningstudents’ actions
PotentialObservations
Things students say, do, or makethat can provide evidence about theFocal KSAs
Data concerningstudents’ actions
6 The design pattern attributes shown here differ slightly from the presentation in Mislevy et al.(2003). First, this table omits some less central attributes that appear in the extended version ofthe design pattern structure discussed there. Second, two additional attributes have been addedspecifically to support task design for the MCA-II: Science Assessment.
• Supported Benchmarks indicates those benchmarks from the MCA-II testspecifications that correspond to standards that this design pattern supports.
• Narrative Structures has been added in view of the particular structure of tasks inthe MCA-II: Science Assessments. MCA-II science tasks are multi-item clusters thatrevolve around an incident, investigation, data set, or some other unifying context.These are called storyboards. Narrative structures are story frameworks that areanalogous to basic plotlines for movies. Examples are Experiments, General-to-Specific, and Cause-and-Effect relationships
10
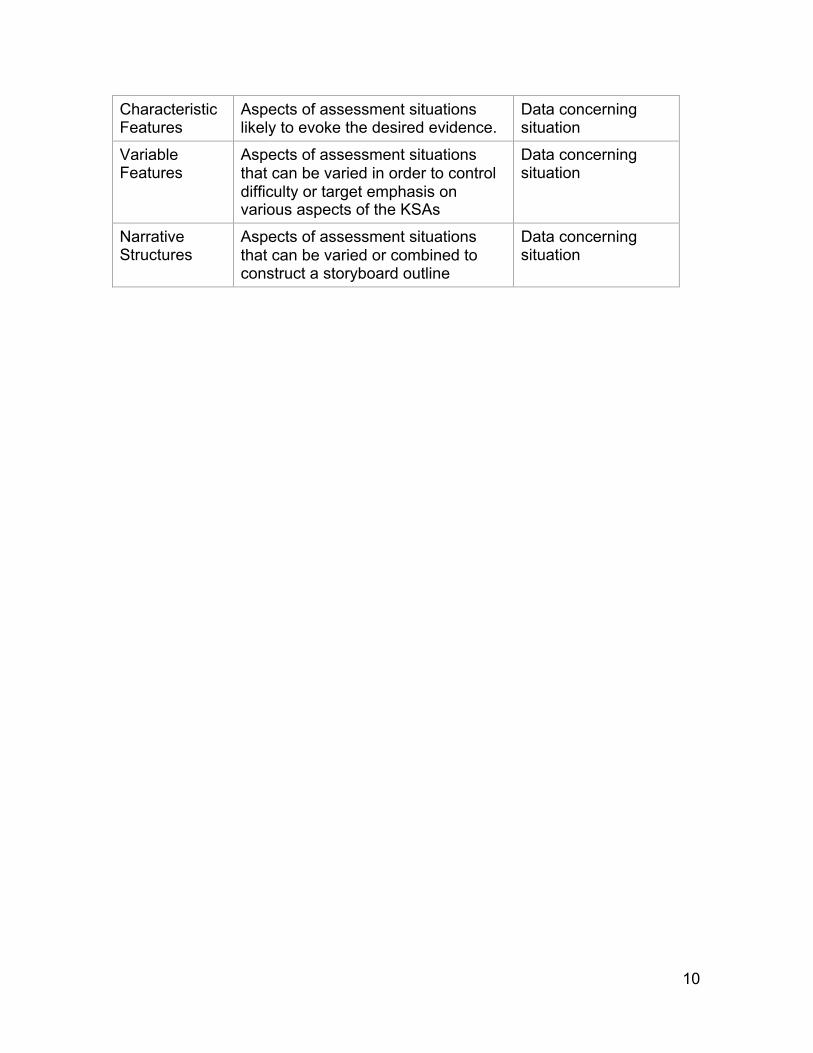
CharacteristicFeatures
Aspects of assessment situationslikely to evoke the desired evidence.
Data concerningsituation
VariableFeatures
Aspects of assessment situationsthat can be varied in order to controldifficulty or target emphasis onvarious aspects of the KSAs
Data concerningsituation
NarrativeStructures
Aspects of assessment situationsthat can be varied or combined toconstruct a storyboard outline
Data concerningsituation
11
3.0 Observational Investigation
This section reviews the importance of observational investigation in science and
defines the process of observational investigation. The outcomes of an alignment
study are noted, which indicate that a design pattern to support authoring tasks
on observational investigation can help bridge Minnesota and national content
standards with the creation of tasks to assess these capabilities.
3.1 Observational Investigation in the Inquiry Process
No matter how one outlines the basic methods shared by all scientific disciplines,
observation is a fundamental and indispensable cognitive skill in science (Millar,
1994; Tomkins & Tunnicliffe, 2001; Haury, 2002). Both the National Science
Education Standard ((NSES); National Research Council, 1996) and the
Minnesota Science benchmarks indicate that observation constitutes a method of
scientific inquiry that is primary in certain scientific disciplines and at least
present in other scientific disciplines, even when not primary.
Observation plays a vital role in investigations. In the hypothetico-deductive
method that predominates in many natural sciences, observation constitutes the
primary activity in the first step in a typical research cycle, followed by
characterizations, hypotheses, predictions, and experiments (Popper, 1972). In
many scientific areas, the primary means for systematic pursuit of knowledge
come directly from observing and analyzing phenomena as the world presents
them rather than experimentation, for in those cases it is difficult, if not
impossible, to sample, control and manipulate variables as experimentation
requires (Smith & Reiser, 2005). Such kinds of phenomena present one or more
of the following characteristics.
It may not be possible for researchers to experimentally replicate the
investigations due to the fact that the interacting variables are too

12
complex to be reproduced under controlled conditions (e.g., the origin of
the universe).
It may be impossible to randomly sample with enough statistical power to
enable statistical hypothesis testing due to temporal or spatial constraints
on sampling.
It may be unethical to manipulate the variables of interest.
Examples from different science domains serve to illustrate the necessity of
observational investigation in the inquiry process. The earth as a dynamic and
evolving system is characterized by multiple interacting causal factors, non-linear
relationships among subsystems and variables within those subsystems, partial
historical records, and integral cyclical relationships among the underlying
phenomena. It is often impossible either to control those variables due to the
limitations of geologic time and space. Astronomy, one of the oldest nature
sciences, uses the observations of the universe to confirm or refute existing
theories of celestial bodies. It is unrealistic to manipulate the behaviors or
natures of celestial bodies and geological phenomena such as volcanoes and
earthquakes.
For the purpose of clarifying the above definition of observational investigation,
we mention three things. Firstly, theory articulation is defined as people
incorporating new evidence from observation to support or refute existing
theories (Smith & Reiser, 2005). In K-12 education, the process of articulating a
theory/model is more important than the application of the theory/model since
articulation is an integral part of understanding the theory/model (Ohlsson, 1992).
More specifically, students need to make sense of their observations by tying the
observations to other aspects of the inquiry process, such as posing a question,
collecting supporting data, developing appropriate explanations. Taking
evolutionary theory as an example, although it is well known that animal
populations change in order to adapt to the environment, often students will not

13
know how the mechanism of natural selection operates in certain groups under
particular conditions. Through observation of new behaviors or features of
animals, students can articulate and elaborate this theory by comparing what
they observe with what they know from the theory (Smith & Reiser, 2005).
Secondly, knowledge about some content domain is requisite for students
conducting observational investigation. Familiarity with the relevant scientific
knowledge can facilitate a student raising an appropriate question to be
investigated, identifying relevant features of observations from irrelevant ones,
collecting and displaying supporting or refuting data, and formulating an
appropriate explanation. None of these things can be done without knowledge of
the content domain. However, being familiar with content when the knowledge is
biased, can have its own adverse impact since observation can be altered by
belief (Fleck, 1935/1979). People tend to look for evidence that reinforces the
thoughts they already possess. In this way, false views can lead students to seek
one-sided evidence or distort their observations to confirm prior assumptions.
Therefore investigators should be cautious when they encounter contradictory
outcomes to their belief; it is always beneficial to double check the explanations
being made for observations. We will see, in one of the variable task features,
that one approach to assessing observational investigation capabilities is to pose
a problem concerning the adequacy of observational data in a context in which
the student already knows the answer—the point is whether the student can
recognize inadequacies in the data or pose alternative explanations from the
standpoint of the observations at hand. In this and similar ways, this design
pattern aims to provide a general design space across different disciplines to
generate tasks addressing aspects of reasoning skills in observational
investigation, and can support the design of tasks to assess observation inquiry
in different content domains.
Thirdly and most importantly, the biggest challenge of observational investigation
comes from how to carry out the reasoning processes in context. Without

14
training, students lack the tacit strategies with which experts design
investigations, select and analyze relevant data, and develop observations into
hypotheses and explanations (Smith & Reiser, 2005). Since the systematic,
careful observation is often the defender of true science against pseudoscience,
it is absolutely essential to make this underlying process in experts’ minds as
explicit as possible. Smith & Reiser (2005) propose an observational
investigation model which introduces several strategies for observation and
interpretation of animal behaviors: decomposing, comparing, identifying causes,
and relating. Utilizing this idea, observational investigation can be summarized as
Identification of aspects of phenomena to be investigated.
Organizing and representing observations accordingly
Developing hypotheses or explanations based on what is observed
Determining ways of validating or falsifying the explanations, and revising
them as unfolding information indicates.
3.2 Minnesota Science Standards and National Science Standards
A goal of the present project was to illustrate the use of ECD in the MCA-II:
Science Assessment in ways that not only benefit the MCA-II but hold value in
the larger science education and assessment communities more broadly. Ideally,
the design pattern we create would support aspects of science learning reflected
both in national standards and in Minnesota standards and benchmarks. To this
end, we carried out a systematic alignment study among existing model-based-
reasoning design patterns developed in the PADI project (Mislevy, Riconscente,
& Rutstein, in press), Minnesota middle school science benchmarks, and the
NSES (NRC, 1996). Unsurprisingly, science inquiry skills are highlighted in both
science education standards.
The NSES (NRC, 1996) emphasizes the importance of unifying concepts and
processes being shared by different scientific disciplines because they provide
schemas that help students understand natural phenomena both within and
across areas (p. 105). This unifying theme is also implied in Strand I of the
Minnesota Academic Standards for Science, “Nature and History of Science.”

15
More specifically, NSES stresses the ability to conduct scientific inquiry and
understanding about it across contents and grades (p. 106). The role of
observation in inquiry is underscored. In the earliest grades K-4, students are
required to use simple instruments to observe evidence and then develop
explanations (NSES, pp. 122-123). In middle grades 5-8, students should be able
to conduct systematic observation by using appropriate tools and techniques,
including computers, in order to base and differentiate their explanations from
what they observed (NSES, p. 145). In high school, students are expected to be
able to design and conduct an investigation in which students can organize and
display data by means of various technologies and mathematics, and then
formulate and revise scientific explanations and models based on observed
evidence and logic (NSES, pp. 175).
Our alignment study showed that the Minnesota Academic Standards for Science
also emphasize inquiry skills. They too expect that students be capable of
observing at different levels for different grades. In grades 3-5, students should
be able to raise a question to be investigated scientifically, make observations
through simple tools, and collect and present data to support scientific
understanding. In grades 6-8, students are supposed to be able to conduct
observational investigations with systematic observations, to carefully collect
relevant evidence, and to develop logical hypotheses and explanations. In high
school, students are required to differentiate between observational and.
experimental methods, to determine a testable question, to plan an investigation,
to apply mathematics and models to analyze data, and to make evidence-based
conclusions. The Minnesota requirements for observational investigations differ
across content areas and grade levels even as they embody the same theme, by
incorporating increasingly technical and sophisticated knowledge and skills. At
the same time, the models and processes in the content strands (Physical
Science, Earth and Space Science, and Life Science) that would be involved in
investigations become correspondingly more complex.

16
Another finding from the alignment study is that the Narrative Structure attribute
of design patterns noted above is reflected in the test specifications document7
that is derived from the Minnesota Standards, in the form of “content limits.” The
test specifications go beyond the statements of standards themselves, by further
suggesting the kinds of reasoning and some of the features of tasks that are
appropriate to include on the MCA-II to assess students at the given grade
levels. Some narrative structures are implied in the content limits, and others are
explicitly articulated. For example, a content limit for Grade 8 benchmark 8.I.B.1
in the History and Nature of Science strand states that gathering evidence to
prove that continents move constitutes a demonstration of the knowledge that
scientific investigations involve the common elements of systematic observation,
careful collection of relevant evidence, logical reasoning, and innovation in
developing hypotheses and explanations. Thus this content limit and its
relationship to its benchmark indicate two narrative structures: “topic with
examples” and “change over time.” To take another example, the narrative
structure “specific to general” is clearly specified in Grade 8 benchmark 8.I.B.2,
which requires students describe how scientists can conduct investigation in a
simple system and make generalizations to more complex systems. Two more
specific examples are used in its content limits: observations of the impact of
penicillin on bacteria can lead to the generalization that penicillin can cure certain
illnesses and observations of convection can help students study weather
patterns. These examples support the project’s decision to include a special kind
of variable task feature, narrative structures, as an attribute in its own right in the
new design patterns in order to support task developers particularly as they
create the ‘storyboards’ within which tasks are contextualized.
7 Minnesota Comprehensive Assessments Series II (MCA-II): Test Specifications for Science.http://education.state.mn.us/mdeprod/groups/Assessment/documents/Report/006366.pdf

17
4.0 Design Pattern for Observational Investigation
This section presents the Observational Investigation design pattern and
illustrates some of its attributes with exemplar tasks. The primary users of the
design pattern are the storyboard and item writers who create the MCA II and
would directly use the design pattern to support their work. Other users within the
MCA-II context will be the Pearson professional test development team that
structures the authoring and assembly of the MCA-II, trains the storyboard and
item writers, and edits and refines their products as needed, and the Minnesota
expert review panels who examine storyboards and items for content and
appropriateness. Secondary user groups in Minnesota would be classroom
teachers and curriculum developers, who would be able to use the design
patterns to create classroom tasks and curriculum-embedded tasks that address
the same standards that the MCA-II addresses, but in less constrained contexts.
These uses lie outside the current project, but they constitute an opportunity to
improve the alignment of instruction and large-scale accountability assessment at
the level of the targeted science standards rather than at the level of specific test
items. More broadly, educators and researchers in the science education
community can also use it as a source of reference to understand how a design
pattern helps writers produce tasks validly and efficiently for assessing students’
scientific reasoning skills, such as those in observational investigations.
Table 2 presents a print-based “writer-friendly” version of the design pattern. It is
intended to be brief so that storyboard and item writers find it easy to reference
the central ideas. In its electronic form, many of these summarized points are
accompanied by links to examples or more detailed discussion, for the user who
wants to follow them up. In the table, D indicates the availability of further detail
for an entry, and E indicates a hyperlink to an example. In this way, the user has
a brief form of the design pattern immediately at hand, but has access to further
detail should he or she want to use it. This feature is meant to offer further
support particularly to storyboard and item writers who are new to the MCA, or be
18
available for more experienced writers if they occasionally want to refresh their
memories or see examples for inspiration.8 The following discussion includes
some of the additional material in those links.
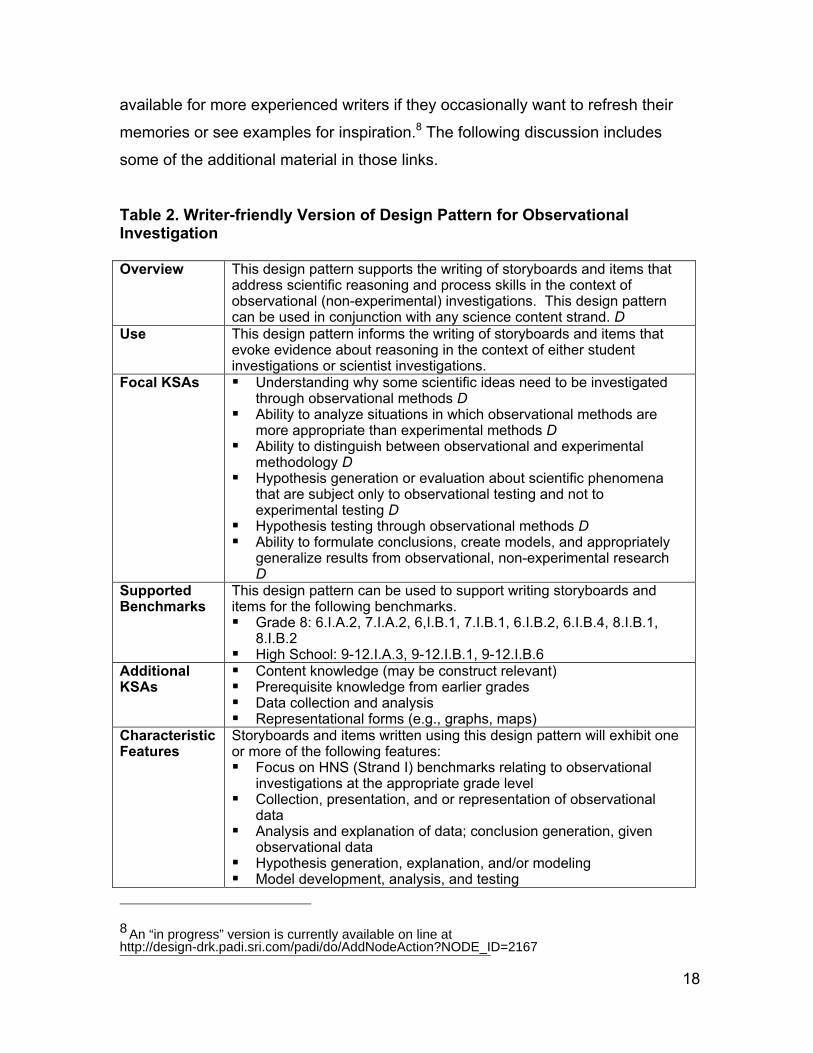
Table 2. Writer-friendly Version of Design Pattern for ObservationalInvestigation
Overview This design pattern supports the writing of storyboards and items thataddress scientific reasoning and process skills in the context ofobservational (non-experimental) investigations. This design patterncan be used in conjunction with any science content strand. D
Use This design pattern informs the writing of storyboards and items thatevoke evidence about reasoning in the context of either studentinvestigations or scientist investigations.
Focal KSAs Understanding why some scientific ideas need to be investigatedthrough observational methods D
Ability to analyze situations in which observational methods aremore appropriate than experimental methods D
Ability to distinguish between observational and experimentalmethodology D
Hypothesis generation or evaluation about scientific phenomenathat are subject only to observational testing and not toexperimental testing D
Hypothesis testing through observational methods D Ability to formulate conclusions, create models, and appropriately
generalize results from observational, non-experimental researchD
SupportedBenchmarks
This design pattern can be used to support writing storyboards anditems for the following benchmarks. Grade 8: 6.I.A.2, 7.I.A.2, 6,I.B.1, 7.I.B.1, 6.I.B.2, 6.I.B.4, 8.I.B.1,
8.I.B.2 High School: 9-12.I.A.3, 9-12.I.B.1, 9-12.I.B.6
AdditionalKSAs
Content knowledge (may be construct relevant) Prerequisite knowledge from earlier grades Data collection and analysis Representational forms (e.g., graphs, maps)
CharacteristicFeatures
Storyboards and items written using this design pattern will exhibit oneor more of the following features: Focus on HNS (Strand I) benchmarks relating to observational
investigations at the appropriate grade level Collection, presentation, and or representation of observational
data Analysis and explanation of data; conclusion generation, given
observational data Hypothesis generation, explanation, and/or modeling Model development, analysis, and testing
8 An “in progress” version is currently available on line athttp://design-drk.padi.sri.com/padi/do/AddNodeAction?NODE_ID=2167

19
VariableFeatures
The following features are variable depending on the storyboard anditems: Content (strand) context E Qualitative or quantitative investigations Number of variables and complexity of their interrelationships Simple or complex investigations Data representation (e.g., patterns in geographically distributed
phenomena via geospatial visualizations; patterns in data;similarities in specialized representations appropriate to thescientific phenomenon) E
Student asked to interpret insufficient data about a fact alreadyknown?
PotentialWorkProducts(MCquestions,open-endedresponses,figuralresponses)
Generate or identify an explanation for observed findings E Modify or criticize problematic explanations. Identify or generate different observational settings that would help
confirm or disconfirm hypotheses Identify or suggest other data that confirm or disconfirm a
hypothesis for which evidence has already been identified from adifferent data source
Identify or suggest potentially disconfirming observations that arestronger in being disconfirming that confirming
Identify or suggest a process that may be occurring over time oracross locations to produce observations (connected with acontent-area)
Fill in representation form (such as a graph, chart, or map) toexpress a hypothesis about what would be expected under ahypothesis E
Critiques of peers (hypothetical in a standard assessment, real inclassroom work) on their evaluations, explanations, orconfirmation/disconfirmation procedures.
PotentialObservations
Plausibility / correctness of explanation for observed findings E Appropriateness of other potential observations for confirming or
disconfirming hypothesis Accuracy in identifying the effects of an observed active
phenomenon and how they may be a sign of a cause and effectrelationship
Strength of evidence of a suggested or identified situation whereobservation could help confirm or disconfirm a hypothesis
Correctness or aptness of recognized patterns that ground ahypothesis E
Accuracy in critiques of others (hypothetical in a standardassessment, real in classroom work) on the accuracy of what theyidentify in any of the above potential observations
NarrativeStructures
Investigation Specific to general E Parts to whole Topic with examples Change over time Cause and effect
Note: D indicates a hyperlink to extended detail or discussion of the entry, and Eindicates a hyperlink to an example task that illustrates the point.
20
Another feature of the online version of the design pattern that cannot be fully
demonstrated in this print version is associations among entries in different
attributes. For example, the Additional KSA “Representational forms (e.g.,
graphs, maps)” is linked to the Variable Task Feature “Data representation” and
the Potential Work Product “Fill in representation form to express a hypothesis
about what would be expected under a hypothesis.” This means that the writer
should be aware that the design choice of using a representational form as a
work product induces a requirement for familiarity with that form on the part of the
student—knowledge which, if the student lacked it, could lead to poor
performance even if the science knowledge would have been sufficient. This
may be perfectly appropriate, perhaps because the use of the representational
form also satisfies the requirement of assessing another benchmark a storyboard
must address. Or it may be the case that confounding a particular item with this
additional skill demand is not desired, so a simpler form of work product would be
preferable. The point is that the design pattern has made this design decision
explicit to the writer, and support has been made available to help think it
through.
4.1 Overview and Use
The Overview and Use attributes of this design pattern explain briefly that it is
meant to support writing assessment storyboards and items that address aspects
of reasoning in observational investigation in science. It is a content-neutral
design pattern in the sense that it can be used in conjunction with any content in
which such investigations can be carried out. Therefore, it supports writing tasks
that address the nature and concepts of this aspect of scientific reasoning or
assessing the skills in the context of a particular content-specific investigation.
The icon D in the Overview attribute indicates that a hyperlink in the electronic
version provides further detail. The additional detail in this case is a discussion of
the nature of observable investigations. This material corresponds to the warrant

21
in Toulmin’s argument structure, and provides the scientific educational and
psychological principles behind the design pattern.
4.2 Focal KSAs, Supported Benchmarks, and Characteristic Task
Features
The primary attribute of a design pattern is the Focal KSA. The Focal KSAs are
the targets of inferences that assessors aim to make in an assessment,
concerning some aspect(s) of proficiencies. A design pattern sometimes
designates a group of related KSAs, as does this one. A task designer needs to
decide whether to test all these KSAs as a composite or emphasize different
aspects of them. The following section of variable task features discusses further
how to implement this decision-making process. Focal KSAs are precursors to, in
the sense of providing the educational meaning, the latent variable(s) in the
measurement model in the CAF layer, be it as simple as a total score (what mix
of KSAs is a set of tasks intended to evidence?) or a multivariate psychometric
model (what aspects of knowledge or skill are intended to be evidenced in a
collection of tasks that may require them jointly in various mixes?). A design
pattern focuses on how to construct tasks that evoke evidence about the focal
KSAs, and the determination of the nature and grain size of the analytic model is
not determined at this phase of the design process.
Based on the analysis for observational investigation and motivated by the
benchmarks in the MCA-II Test Specifications, this design pattern specifies as
Focal KSAs a broad set of cross-disciplinary knowledge, skills, and abilities that
students need to exercise when pursuing an observational investigation. As
noted earlier, however, delineating these Focal KSAs is not meant to imply that
these are skills that students possess in isolation of actual scientific content.
Rather, they are aspects of the scientific activity that are pursued and are integral
to the content being investigated. The KSAs encompass the indicated
benchmarks shown in the design pattern at a more overarching level than the
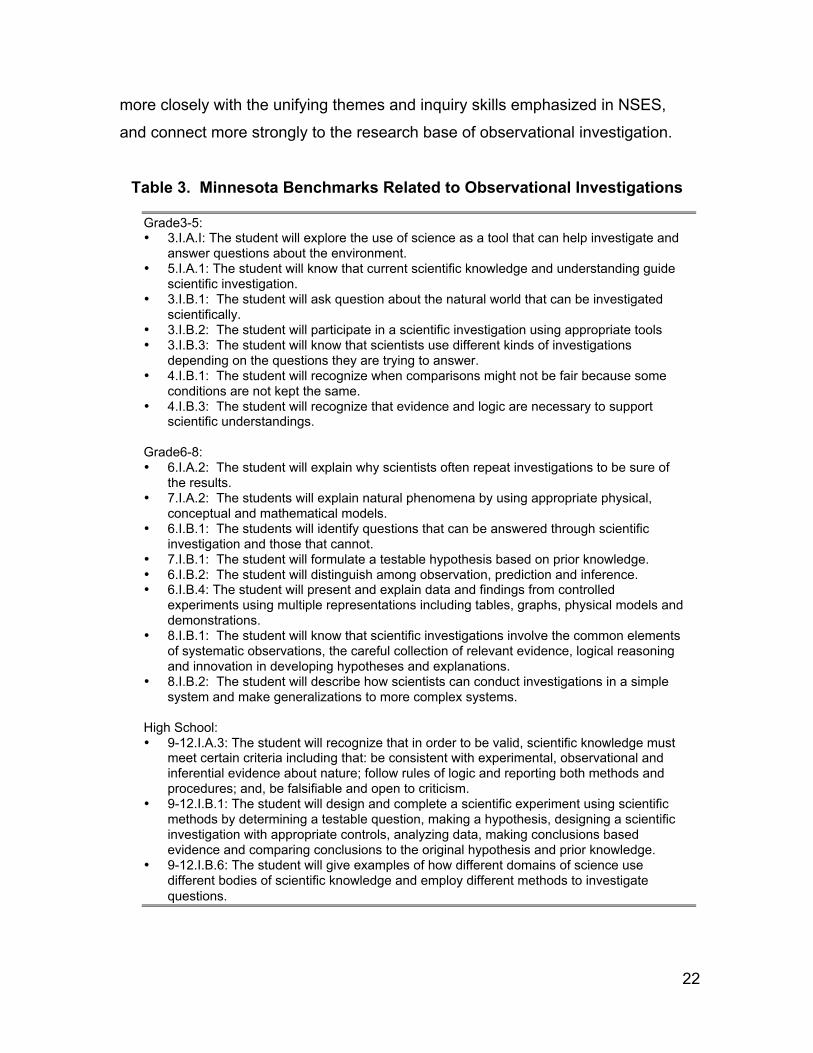
benchmarks or standards themselves (see Table 3), so that they are in accord
22
more closely with the unifying themes and inquiry skills emphasized in NSES,
and connect more strongly to the research base of observational investigation.
Table 3. Minnesota Benchmarks Related to Observational Investigations
Grade3-5:• 3.I.A.I: The student will explore the use of science as a tool that can help investigate and
answer questions about the environment.• 5.I.A.1: The student will know that current scientific knowledge and understanding guide
scientific investigation.• 3.I.B.1: The student will ask question about the natural world that can be investigated
scientifically.• 3.I.B.2: The student will participate in a scientific investigation using appropriate tools• 3.I.B.3: The student will know that scientists use different kinds of investigations
depending on the questions they are trying to answer.• 4.I.B.1: The student will recognize when comparisons might not be fair because some
conditions are not kept the same.• 4.I.B.3: The student will recognize that evidence and logic are necessary to support
scientific understandings.
Grade6-8:• 6.I.A.2: The student will explain why scientists often repeat investigations to be sure of
the results.• 7.I.A.2: The students will explain natural phenomena by using appropriate physical,
conceptual and mathematical models.• 6.I.B.1: The students will identify questions that can be answered through scientific
investigation and those that cannot.• 7.I.B.1: The student will formulate a testable hypothesis based on prior knowledge.• 6.I.B.2: The student will distinguish among observation, prediction and inference.• 6.I.B.4: The student will present and explain data and findings from controlled
experiments using multiple representations including tables, graphs, physical models anddemonstrations.
• 8.I.B.1: The student will know that scientific investigations involve the common elementsof systematic observations, the careful collection of relevant evidence, logical reasoningand innovation in developing hypotheses and explanations.
• 8.I.B.2: The student will describe how scientists can conduct investigations in a simplesystem and make generalizations to more complex systems.
High School:• 9-12.I.A.3: The student will recognize that in order to be valid, scientific knowledge must
meet certain criteria including that: be consistent with experimental, observational andinferential evidence about nature; follow rules of logic and reporting both methods andprocedures; and, be falsifiable and open to criticism.
• 9-12.I.B.1: The student will design and complete a scientific experiment using scientificmethods by determining a testable question, making a hypothesis, designing a scientificinvestigation with appropriate controls, analyzing data, making conclusions basedevidence and comparing conclusions to the original hypothesis and prior knowledge.
• 9-12.I.B.6: The student will give examples of how different domains of science usedifferent bodies of scientific knowledge and employ different methods to investigatequestions.
23
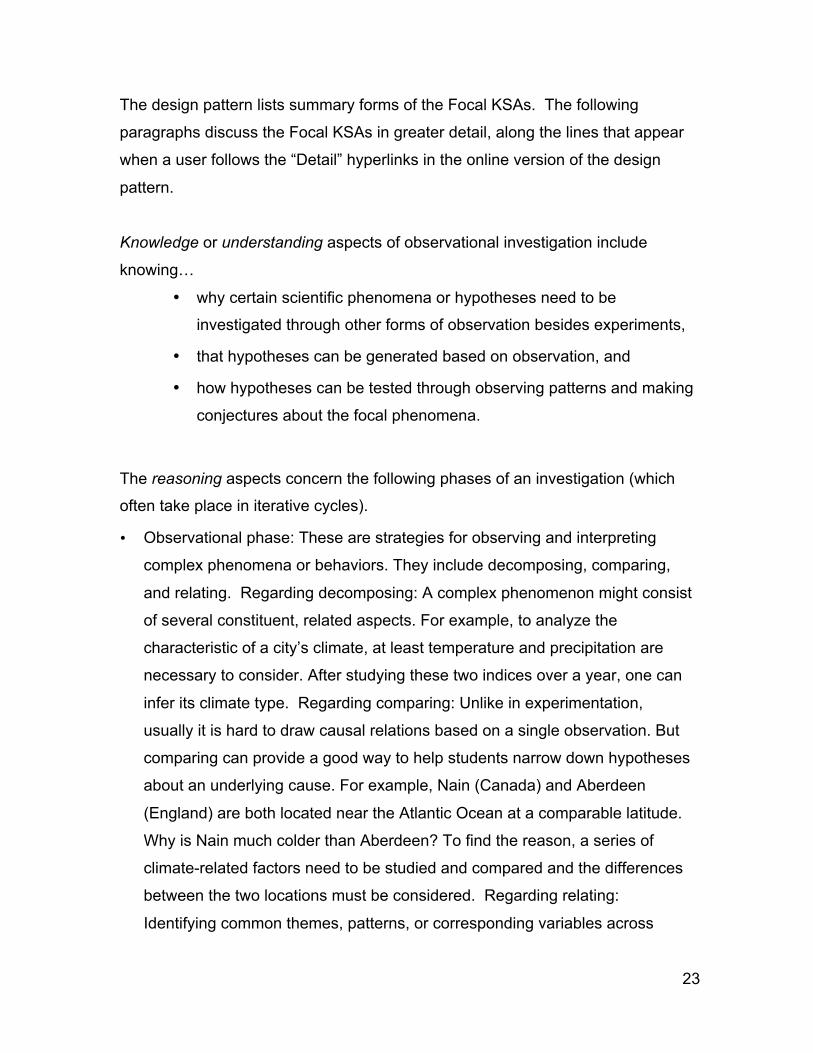
The design pattern lists summary forms of the Focal KSAs. The following
paragraphs discuss the Focal KSAs in greater detail, along the lines that appear
when a user follows the “Detail” hyperlinks in the online version of the design
pattern.
Knowledge or understanding aspects of observational investigation include
knowing…
• why certain scientific phenomena or hypotheses need to be
investigated through other forms of observation besides experiments,
• that hypotheses can be generated based on observation, and
• how hypotheses can be tested through observing patterns and making
conjectures about the focal phenomena.
The reasoning aspects concern the following phases of an investigation (which
often take place in iterative cycles).
• Observational phase: These are strategies for observing and interpreting
complex phenomena or behaviors. They include decomposing, comparing,
and relating. Regarding decomposing: A complex phenomenon might consist
of several constituent, related aspects. For example, to analyze the
characteristic of a city’s climate, at least temperature and precipitation are
necessary to consider. After studying these two indices over a year, one can
infer its climate type. Regarding comparing: Unlike in experimentation,
usually it is hard to draw causal relations based on a single observation. But
comparing can provide a good way to help students narrow down hypotheses
about an underlying cause. For example, Nain (Canada) and Aberdeen
(England) are both located near the Atlantic Ocean at a comparable latitude.
Why is Nain much colder than Aberdeen? To find the reason, a series of
climate-related factors need to be studied and compared and the differences
between the two locations must be considered. Regarding relating:
Identifying common themes, patterns, or corresponding variables across

24
multiple time points, locations, or examples is a step toward reasoning about
underlying patterns and processes.
• Organizational phase: Building, comparing, and analyzing patterns in
representational forms such as graphs, tables, maps etc. These aspects of an
observational study are essentially the same as those used in experimental
studies. Continuing the above example, to study a city’s climate, temperature
graphs and precipitation histograms are typical representational forms that
are used to show climate patterns and can be compared with those of other
cities.
• Hypothesis generation/explanation/modeling phase: After posing a question
that guides the observation and analysis of relevant data, an explanation or
hypothesis is developed to support or refute provisional theories about the
underlying situation. Investigators need to be cautious about making causal
explanations, because observational investigations highlight the key
distinction between correlation and causation. In the context of observational
studies, the correlation between two variables does not imply one causes the
other. Unlike experimental studies, other possible factors that might influence
the dependent variable can not be controlled or ruled out by design or
randomization. A high correlation between two variables can actually be the
coincident effect of a common cause, rather than a cause-effect relationship.
• Model testing phase: Here lies the major difference between observational
and experimental investigations. Approaches in observational investigation
include: reasoning from the proposed explanation to other situations and
seeing if predictions are consistent with the model, developing alternative
explanations, seeking predictions that would differ from those of the
hypothesis, and looking for that evidence; controlling variables not by
experiment but by comparisons; and building simulation models based on the
hypothesis and seeing if the outcomes match observations. For example, to
determine the accuracy of the summary for a city’s climate in a year, one can
check whether the prediction made for monthly-average temperature and
precipitation in the next year are consistent with current findings. In contrast,

25
in an experimental investigation a researcher can generally repeat the
experiment under essentially the same conditions many times to test a
hypothesis or model.
After Focal KSAs are clarified as above, we need identify what kinds of tasks can
evoke students’ demonstration of the kind of knowledge skills and abilities
necessary for observational investigations. Then we turn to another key attribute
of design patterns, namely Characteristic Features of tasks. All assessment tasks
motivated by this design pattern need to incorporate aspects of these
characteristics in some form in order to evoke evidence about the Focal KSAs.
Since this design pattern is about observation instead of experimentation, the
fundamental characteristic of the assessment tasks is that reasoning must be
carried out without recourse to experimental methods (e.g., random assignment,
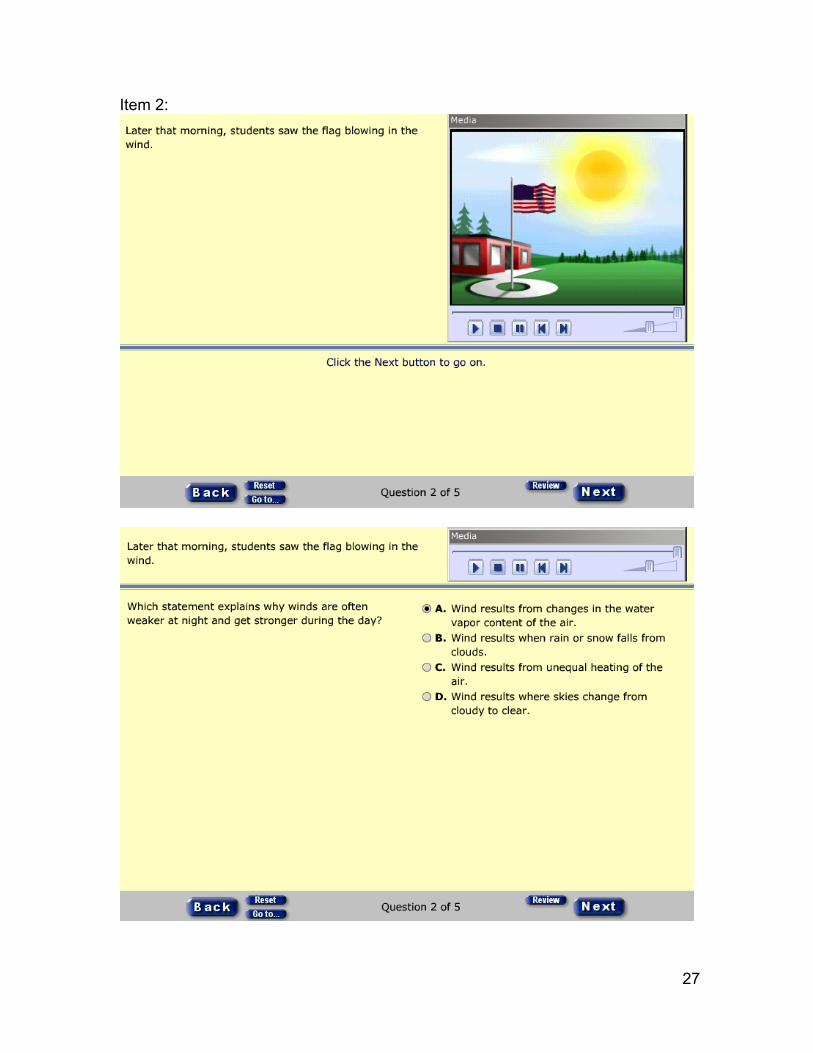
control of variables, replicability). As an illustration, consider a Minnesota sample
task on “Weather” (see Figure 3). In items 1-3 for this task, students are asked
to explain the formulation of fog, wind, and moist convection, and
observation—not experimentation—is the primary means to explore the
phenomenon in these items (although laboratory experiments can in fact be
carried out to test hypotheses about the underlying phenomenon in simplified
settings). The “Weather” task will be referred several times in the rest of this
report as a means of illustration.

26
Figure 3. Minnesota Item Sample ‘Weather’(For interactive version of this task and many others, seehttp://etest.pearson.com/customers/Minnesota/mn/mca2scienceitem.htm)
Item 1:
27
Item 2:

28
Item 3:

29
Item 4:
Item 5:
30
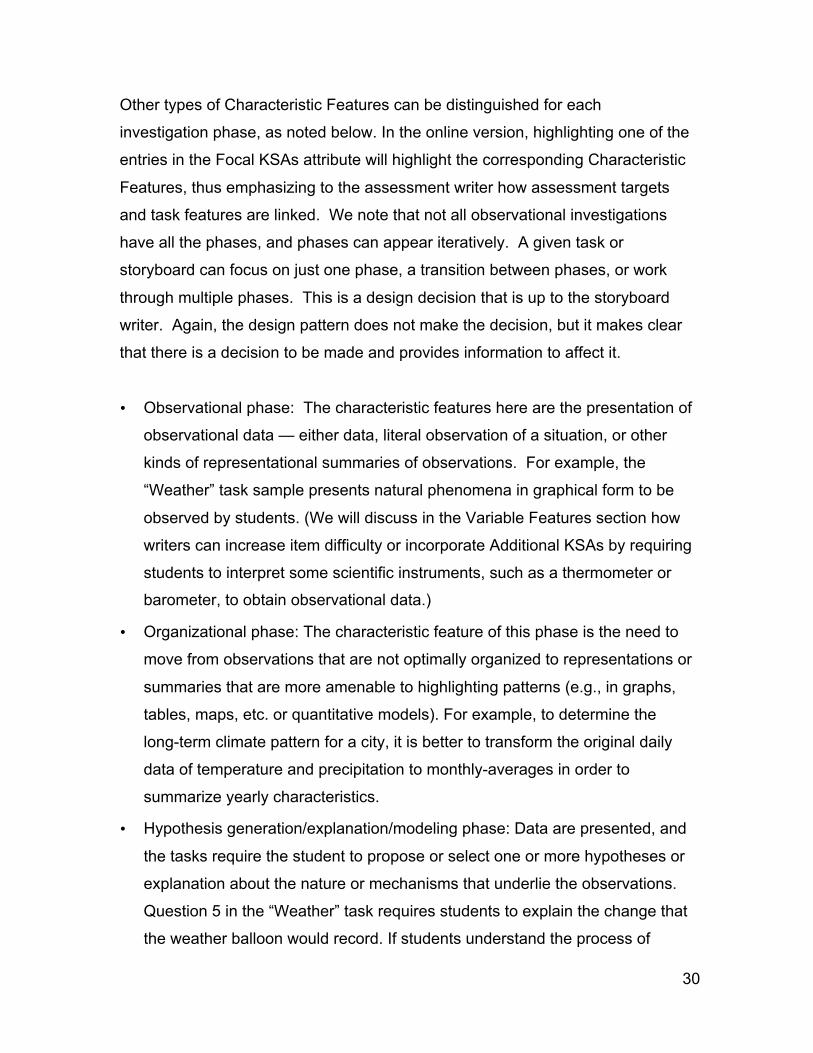
Other types of Characteristic Features can be distinguished for each
investigation phase, as noted below. In the online version, highlighting one of the
entries in the Focal KSAs attribute will highlight the corresponding Characteristic
Features, thus emphasizing to the assessment writer how assessment targets
and task features are linked. We note that not all observational investigations
have all the phases, and phases can appear iteratively. A given task or
storyboard can focus on just one phase, a transition between phases, or work
through multiple phases. This is a design decision that is up to the storyboard
writer. Again, the design pattern does not make the decision, but it makes clear
that there is a decision to be made and provides information to affect it.
• Observational phase: The characteristic features here are the presentation of
observational data — either data, literal observation of a situation, or other
kinds of representational summaries of observations. For example, the
“Weather” task sample presents natural phenomena in graphical form to be
observed by students. (We will discuss in the Variable Features section how
writers can increase item difficulty or incorporate Additional KSAs by requiring
students to interpret some scientific instruments, such as a thermometer or
barometer, to obtain observational data.)
• Organizational phase: The characteristic feature of this phase is the need to
move from observations that are not optimally organized to representations or
summaries that are more amenable to highlighting patterns (e.g., in graphs,
tables, maps, etc. or quantitative models). For example, to determine the
long-term climate pattern for a city, it is better to transform the original daily
data of temperature and precipitation to monthly-averages in order to
summarize yearly characteristics.
• Hypothesis generation/explanation/modeling phase: Data are presented, and
the tasks require the student to propose or select one or more hypotheses or
explanation about the nature or mechanisms that underlie the observations.
Question 5 in the “Weather” task requires students to explain the change that
the weather balloon would record. If students understand the process of

31
energy transport in the atmosphere, they can anticipate the data trajectories
inferred from the record of the thermometer and barometer and provide an
appropriate explanation about the data changes.
• Model testing phase: Observations and a hypothesis are given. The student
must reason about evidence to confirm/disconfirm the hypothesis, such as
making predictions to other potential situations, relating it to another set of
observations, determining a situation that would be consistent or inconsistent
with the hypothesis, or proposing or selecting other phenomena that would
tend to occur if the hypothesis were true.
4.3 Additional KSAs
Additional KSAs of a design pattern are the other knowledge, skills, and abilities
that, at the writer’s discretion, might be involved in a task that assesses the Focal
KSAs. Categories of Additional KSAs include: prerequisite knowledge; content
knowledge; familiarity with task tools, task expectations and formats; and
cognitive and physical capabilities needed to apprehend, interact with, and
respond to a task. This section discusses important Additional KSAs associated
with creating tasks about Observational Investigation. Whether or not these
KSAs are demanded by a task, and to what degree, will be affected by the
writer’s choice of Variable Task Features, which will be discussed in the following
section. In the online version of the design pattern, a writer can use the
highlighted linking option to bring out which Variable Task Features are involved
in determining the demand for particular Additional KSAs.
Task developers need to make decisions about certain Variable Task Features
as to how particular Additional KSAs will be or not be involved in a given task.
Accommodations for students with special needs, for example, such as large
print, or spoken rather than written response modes, circumvent Additional KSAs
that most students have but that would act as irrelevant sources of difficulty to
students with limited vision or mobility.

32
As we described previously, familiarity with content knowledge is necessary for
students to reason about specific observational investigations. Potential content
areas include Earth Science (including geology), Biology, Ecology, Chemistry,
Astronomy, Anthropology, and other areas addressed in the Minnesota
Academic Standards in Science in the ways they are reflected in the benchmarks
in the test specifications document. The presence of content knowledge as an
Additional KSA in the Observational Investigation design pattern emphasizes that
the task designer must decide what content knowledge is involved and how
much demand to place on it in the task. To assess inquiry capabilities, a task
designer can choose to have low demand for content knowledge by embedding
the inquiry item in a familiar everyday context or a scientific context from earlier
grade levels. Alternatively, if the objective is to jointly obtain evidence about
content (as specified by a targeted benchmark), then the demand for content
knowledge can be appropriately high, and both the inquiry process and content
knowledge are tested. In this approach, evidence about inquiry capabilities is
conditional on content knowledge.
Additional KSAs can thus have positive, negative, or evidence-conditional effects
on the validity of the assessment argument. They are included in the design
pattern to alert the task developer to possible validity threats involving Additional
KSAs.
In the case of the MCA-II, storyboards and items that are written by using this
design pattern can require content-related KSAs that students should have
gained in prior grades before they entered the grades that are covered on this
test. Thus, all Grade 5 benchmarks in Minnesota Assessment Science
Standards, as shown in Table 3, can be considered as Additional KSAs that are
appropriate to include when task writers generate storyboards or items for
students in middle or high school. The presumption is that they are not a primary
33
source of difficulty to the student. That is, these are indeed skills or knowledge
needed to solve the tasks, but they are not expected to be the source of poor
performance among students who actually are proficient in the Focal KSAs.
Understanding how and where phenomena can be investigated experimentally is
another kind of Additional KSAs in this design pattern since it can help students
understand why they should use observation instead of experimentation. Even if
students do not explicitly know the criteria of observational studies, the
infeasibility of experimentation would drive them to seek another way to study
phenomena. For example, the significance of temporal and spatial scale
constraints on collecting data related to geological phenomena can make
students aware of the difficulty of manipulating variables as required in
experimentation.
Use of quantitative tools, such as modeling and statistical methods, can be
helpful to conduct observational investigation. Students with good abstract
thinking are able to map a real world situation into a symbolic model to be
studied. Cummins, Ritger, & Myers (1999) provide a good example by using
pumpkins, a flashlight, and acorn squash to represent the earth-sun-moon
model, and a map and a flag as frames of reference on a rotating earth to study
the relationship of objects in the solar system. Proficiency with quantitative tools
(e.g., level of mathematics required) in a task is also an Additional KSA that a
test developer needs to reason through when creating observational investigation
tasks. These are Additional KSAs that, if a student does not have them, can lead
to poor performance. In a classroom assessment, a teacher can include the use
of levels of mathematics that he or she knows the students are familiar with,
without threatening the validity of inference about their proficiencies with
investigations. In a state-wide assessment, however, it may be necessary to
target the level of mathematics lower – unless a given skill, such as reading a bar
graph, is also one of the KSAs meant to be assessed. This example shows that
different design decisions can be made for assessing the same Focal KSAs in

34
different contexts, for different purposes, or in light of different background
knowledge about students.
Use of measurement or data-collection methodology, such as observational
protocols, instruments, and procedures related to observation in a particular
domain, are also included as Additional KSAs. These can also be manipulated in
the Variable Features attribute by task writers.
Familiarity with representational forms and their conventions of data can also
affect the validity of the claims made for Focal KSAs.
4.4 Variable Task Features
Variable Features of tasks are a primary tool of task developers. They can take
different values in order to adjust the difficulty of tasks, to shift the task emphasis
on different aspects of Focal KSAs, or to incorporate different Additional KSAs.
The following types of Variable Features, but not limited to these, can be
manipulated by task writers:
• Cognitive skill level. There are many ways used to describe the level of
cognitive demand of tasks. The test specifications for the MCA-II employ
Bloom’s taxonomy levels (Bloom, Hastings, & Madaus, 1971). Their use of
this feature includes three cognitive levels: A consists of knowledge, B of
understanding, and C of application, analysis, synthesis and evaluation. The
test specifications for the MCA-II indicate the range of cognitive levels that
should be targeted for each benchmark.
• Content for the context of the investigation. As discussed in connection with
Additional KSAs above, observational investigations involve some content.
What content will be involved—everyday knowledge, content from earlier
grades’ standards presumed to be familiar, or content that is also at issue at
35
the grade level being assessed? Different content domains can be varied or
combined as a context for tasks. In the MCA-II, content can be described in
terms of the Minnesota Standards content classifications or test specification
benchmarks.
• Qualitative or quantitative investigations. Qualitative research involves
analysis of data such as verbal statements, pictures, videos, or objects. For
example, in behavioral ecology, teachers use videos to study animals.
Quantitative research deals with numerical data. For example, numerical
data are required to test whether the ozone layer is being depleted. When
quantitative data are used, it is possible to assess students' proficiency with
data representations and concepts and with measurement techniques. Note
that when forms of data or ways of working with them are involved, Additional
KSAs are introduced if students need to apprehend or manipulate them.
Either of these demands should be minimal so as not to introduce alternative,
construct-irrelevant explanations for poor performance. Alternatively, the
forms should be intended as targets of the assessment through benchmarks
that the task is meant to address.
• The number of variables investigated and the complexity of their
interrelationships. Complexity features in a situation include the number and
variety of elements in the real-world situation, the complexity of their
interrelations, the presence of extraneous information, and the degree to
which elements have been stylized in order to make their identification
easier. For example, in a regression analysis, the number of variables used
for prediction can be varied. The students also can be asked to use graphical
displays to explain why they believe the model fits or does not fit, or they can
be asked to use statistical methods or graphical methods to justify their
conclusions. For another example that is closer to K-12 education, task
developers can increase the complexity of tasks by adding more celestial
bodies of solar system into a study. Students can be required to study the
Sun, the Earth, or the moon individually or jointly.
36
• Simple or complex investigations. A storyboard or task can focus on one
phase or transition between phases or multiple phases of observational
investigation as listed in the Characteristic Task Features section. A
storyboard or task can focus on a particular content domain or involve
multiple content areas, such as the use of chemistry to understand patterns in
geology. Simple investigations have observations that are more closely and
obviously aligned with the content models/principles/facts. More complex
investigations are open to more alternative explanations, have outlier data,
ambiguous observations, and so on. Students can be provided a clear initial
question that makes their observation more purposeful. Or they can be asked
to define their own questions from the observations. Students may be
provided specific structured guidance in different phases of an investigation or
allowed the freedom to investigate the problem in their own way. An on-
demand accountability test such as the MCA-II usually uses a clearly
specified problem, but more open-ended problem definition and ways of
tackling the problem can be better suited to learning assessments in the
classroom.
• The representational forms being used for data in the task. Does the initial
presentation of observations involve literal observations or data
summaries? If literal data are used, are measurements needed? Taking Item
5 in the “Weather” task (see Figure 3) as an example, if data collected by
balloons are given, no matter what the verbal description of the change of
temperature or atmospheric pressure or raw data from the measurement
instrument may be additionally given, students should be able to develop
explanations based on data provided if they understand the energy
transformation in the atmosphere. Task writers can vary this feature to test
different aspects of scientific skills or incorporate targeted Additional KSAs.
For example, students may be required to read a measurement instrument in
a graphical form to obtain raw data. For the organizational phase of an
investigation, task writers also need to consider what form of data summary
students can generate to display the observed pattern more clearly and thus

37
support their following explanation or hypothesis development. (This Variable
Task Feature is thus linked to a corresponding Potential Work Product.)
When students make an inference, they might need to consider the evidence
across representational forms. Data transformation can also be used across
different phases in the observational study if that is related to the intent of a
task.
4.5 Narrative Structures
Narrative structures for the MCA-II storyboards are actually a Variable Task
Feature, but one of sufficient importance to merit their own attribute in the design
pattern. As noted earlier, narrative structures are recurring structures for
organizing the flow of information and items in the contextualized sets of items
that constitute an MCA-II Science task. For tasks that address Observational
Investigation, five narrative structures were identified that lend themselves
particularly well:
• Investigation. Investigation itself is a narrative structure, and of course it is a
natural structure for storyboards and tasks that are required to assess
students’ knowledge of and capabilities with observational investigations.
• Specific–to–general and parts–to–whole. Specific characteristics of a
phenomenon are presented, culminating in a description of the system or
phenomenon as a whole. For example, students generalize about the effects
of the damming of rivers by studying cases of specific rivers that have been
dammed.
• Topic with examples. A given topic is presented using various examples to
highlight the topic. For example, students are required to know some
observed evidence that supports the Earth processes, such as the movement
of tectonic plates, weathering, continental glaciation, and volcanic activity.
(See benchmark 8.III.A.5 in test specifications document9). Or students can
9 Minnesota Comprehensive Assessments Series II (MCA-II): Test Specifications for Science.http://education.state.mn.us/mdeprod/groups/Assessment/documents/Report/006366.pdf
38
compare and contrast data about earthquakes that have occurred during a
specific range of years on different types of crustal plate boundaries in order
to detect relationships between the characteristics of the earthquakes and the
crustal plate boundary types.
• Change over time. A sequence of events is presented to highlight sequential
or cyclical change in a system. Students might be required to discover the
geological history of a landscape by observing the rock layers.
• Cause and effect. An event, phenomenon, or system is altered by internal or
external factors. The task developer should be cautious in requiring students
to make causal explanations in observational investigation. Only after ruling
out other possible confounding factors that might affect the outcomes of
phenomenon, can investigators draw inferences about observed evidence.
For example, take a geologist’s successful inquiry process as an example
(NSES, pp. 1-5). The researcher proposed a possible hypothesis to explain
the death of the forest near the shore of the state of Washington by excluding
several alternative possibilities. Then he collected more sediment data to
support his hypothesis.
4.6 Work Products and Potential Observations
The attributes of Work Products and Potential Observations in a design pattern
concern how to capture students’ thinking in terms of something they do or make,
and identify the information that constitutes evidence about targeted aspects of
Focal KSAs. In the online version of the design pattern, there are links between
particular Work Products and observations because certain Work Products
support identifying certain observations. (For example, when the National Board
of Medical Examiners wants to assess how well a licensure candidate can
palpitate an abdomen, the Work Product is the student’s actual action sequence.
When they want to know if the candidate can interpret the results of a palpitation,
Work Products in the form of verbal statements or choices among alternatives
can suffice.)

39
In the MCA-II, computer-based tasks are generated in three formats: multiple
choice, open-ended response, and figural response. This is the structure of the
Work Product. What is listed below and in the design patterns is the semantic
content of the Work Product that can be considered as evidence of their
reasoning skills in observation. They may be implemented in more than one of
the structural forms available to the MCA-II.
• Generate or identify an explanation for observed findings.
• Modify or criticize problematic explanations.
• Identify or generate different observational settings that would help confirm or
disconfirm hypotheses.
• Identify or suggest other data that confirm or disconfirm a hypothesis for
which evidence already has been identified from a different data source.
• Identify or suggest potentially disconfirming observations that are stronger in
being disconfirming that confirming.
• Identify or suggest a process that may be occurring over time or across
locations to produce observations (connected with a content-area).
As an example in a particular domain, if tasks are designed to test students’
understanding of plate tectonics in an observational investigation, possible Work
Products can be: a model or simulation showing different types of crustal plate
movements on different types of crustal plate boundaries; a model showing how
different plates once fit together; drawings to show the edges of plate
boundaries; and a puzzle showing how all the plates fit together.
Potential Observations are features of students’ Work Products that constitute
evidence of the Focal KSAs. They describe qualities, strengths, or the extent of
work that tends to distinguish more or less capability on the whole or in selected
aspects. Potential Observations for tasks addressing observational investigations
include the following:
40
• Plausibility/correctness of an explanation for observed findings.
• Appropriateness of other potential observations for confirming or
disconfirming an hypothesis.
• Accuracy in identifying the effects of an observed active phenomenon and
how they may be a sign of a cause and effect relationship.
• Strength of evidence of a suggested or identified situation where observation
could help confirm or disconfirm a hypothesis.
• Correctness or aptness of recognized patterns that ground a hypothesis.
• Accuracy in the critiques of others (hypothetical in a standard assessment,
real in classroom work) on the accuracy of what they identify in any of the
above Potential Observations.
Continuing the example of plate tectonics, Potential Observations could include
the following:
• Accurate identification of earthquake-related effects and how they may be a
sign of crustal movement.
• Identification of different types of volcanoes and where they typically occur on
earth.
• Identification of sea-floor spreading areas.
• Identification of the “Ring of Fire” in the Pacific Ocean.
• Identification of plate boundaries.
• Description of the different types of faults and their motion.
• Identification of land masses that were formerly connected (Africa and South
America).
• Accurate critiquing of “peers” on the quality of their observations of earth
phenomena related to plate tectonics.

41
5.0 Discussion
Assessment tasks are situations constructed to elicit evidence about certain
knowledge, skills, or abilities on the part of students. Just why the situations
should do that, reasons why they might not, options for tuning them, and what to
look for in performances and how to evaluate them, are all elements of an
evidentiary argument. The best test developers reason in this way and produce
tasks that ground arguments that are coherent and appropriate to their intended
purposes. Evidence-centered design was developed as a way to make more
explicit the different work that is being carried out in good assessment practices;
to lay out the principles, provide language, and offer representational forms that
can scaffold the work of the many parties involved in the development and use of
assessments (Mislevy, et al., 2003).
Design patterns are one such tool. They are meant to support the long and
somewhat mysterious step from a statement of standards or benchmarks to the
production of specific tasks that elicit evidence about students’ proficiencies with
respect to those standards. It is at just this step that the talents of gifted test
developers come into play and where novice test developers (including most
classroom teachers and even many curriculum developers) have the hardest
time. This is particularly true when the intended tasks are innovative as to format
or use of technology, or address traditionally hard-to-assess proficiencies such
as inquiry and model-based reasoning in science.
These, then, are the areas we are targeting in the present project in order to build
design patterns that meet several characteristics:
• They address aspects of science that are at once hard–to–assess and central
to the Minnesota Academic Standards in Science and MCA-II test
specifications.
• They address aspects of science that are of broader interest to the science
education and assessment communities, as reflected in current research and
42
in authoritative statements by groups such as the National Science Education
Standards (NRC, 1996). In particular, we are looking toward inquiry in
science and the unifying themes that include model-based reasoning and
systems.
• They will immediately support the work of the task development teams for the
MCA-II as they create storyboards and items for new versions of the
assessment.
• In addition to supporting MCA-II test development, they will be broad enough
to be useful for other purposes both within Minnesota (e.g., as support to
classroom teachers for developing learning tasks) and beyond (e.g., for use
by other states or entities, curriculum developers, and researchers).
Innovations to the original design pattern structure that have been developed in
this project are a writer-friendly format to provide concise lists of attributes with
links for additional discussion or examples (suggested in the textual form printed
here, and available in the online illustration) and the highlighting of related entries
across different attributes. Current work includes trying out the Observational
Investigation design pattern with Minnesota test developers in offline talk-aloud
studies, followed by actual use in operational test development work for the
MCA-II, and the creation of additional design patterns similar to the model of the
one discussed here.

43
References
Bloom, B. S., Hastings, J. T., & Madaus, G. (Eds.). (1971) Taxonomy of
educational objectives, handbook I: Cognitive domain. New York: McKay.
Cummins, R. H., Ritger, S. D., Myers, C. A. (1992). Using the moon as a tool for
discovery-oriented learning. Journal of Geological Education. 40, 142-146.
Fleck, L. (1935) The genesis and development of a scientific fact (trans.
Thaddeus Trenn,1979). Chicago: University of Chicago Press.
Haury, D. L. (2002). Fundamental skills in science: Observation (ERIC Digest
EDO–SE–02–05). Columbus, OH: Educational Resources Information
Center.
Messick, S. (1994). The interplay of evidence and consequences in the validation
of performance assessments. Educational Researcher, 23, 13-23.
Millar, R. (1994). What is scientific method? In R. Levinson (Ed.), Teaching
science (pp. 41–48). London: Routledge.
Mislevy, R. J., & Haertel, G. D. (2006). Implications of evidence-centered design
for educational testing. Educational Measurement: Issues and Practice,
25(4), 6–20.
Mislevy, R. J., Steinberg, L. S., & Almond, R. G. (2003). On the structure of
educational assessments. Measurement: Interdisciplinary Research and
Perspectives, 1, 3-67.
Mislevy, R. J., Almond, R. G., & Lukas, J. F. (2004). A brief introduction to
Evidence-Centered Design (CSE Technical Report 722). Los Angeles: The
National Center for Research on Evaluation, Standards, Student Testing
(CRESST), Center for Studies in Education, UCLA.
Mislevy, R. J., & Riconscente, M. M. (2006). Evidence-centered assessment
design: Layers, concepts, and terminology. In S. Downing & T. Haladyna
(Eds.), Handbook of Test Development (pp. 61-90). Mahwah, NJ: Erlbaum.
44
Mislevy, R. J., Riconscente, M. M., & Rutstein, D. W. (in press). Design patterns
for assessing model-based reasoning (PADI Technical Report). Menlo Park,
CA: SRI International.
National Science Education Standards (1996). National Committee on Science
Education Standards and Assessment, National Research Council.
Washington, DC: National Academy Press.
Ohlsson, S. (1992). The cognitive skill of theory articulation: A neglected aspect
of science education? Science & Education, 1, 181–192.
Popper, K. (1972). Objective knowledge: An evolutionary approach. Oxford,
England: Oxford University Press.
Smith, B. K, & Reiser, B. J (2005). Explaining behavior through observational
investigation and theory articulation. The Journal of the Learning Sciences,
14, 315-360.
Toulmin, S. E. (1958). The uses of argument. Cambridge: Cambridge University
Press.
Tomkins, S. P., & Tunnicliffe, S. D. (2001). Looking for ideas: Observation,
interpretation and hypothesis-making by 12-year-old pupils undertaking
scientific investigations. International Journal of Science Education, 23,
791–813.


SponsorThe National Science Foundation, Grant DRL - 0733172
Prime GranteeSRI International. Center for Technology in Learning
SubgranteesUniversity of MarylandPearson