a description of glimpce, 1986, large offset seismic ...a description of glimpce, 1986, large offset...
TRANSCRIPT

A DESCRIPTION OF GLIMPCE, 1986, LARGE OFFSET
SEISMIC EXPERIMENT FROM THE GREAT LAKES
D.R. Hutchinson - U.S. Geological Survey, Woods Hole, MAP. Morel-a-1'Huissier - Geological Survey of Canada, Ottawa, OntarioH. Meyer - University of Wisconsin, Madison, WII. Asudeh - Geological Survey of Canada, Ottawa, OntarioP. Ervin - Northern Illinois University, Dekalb, ILZ. Hajnal - University of Saskatchewan, Saskatoon, SaskatchewanJ. Karl - University of Wisconsin, Oshkosh, WIR. Mereu - University of Western Ontario, London, OntarioR. Meyer - University of Wisconsin, Madison, WIJ. Sexton - Southern Illinois University, Carbondale, ILC. Spencer - Geological Survey of Canada, Ottawa, OntarioA. Trehu - U.S. Geological Survey, Woods Hole, MA
U. S. Geological Survey Open-file Report 88-431
This report is preliminary and has not been reviewed for conformity with U.S. Geological Survey editorial standards and stratigraphic nomenclature. Any use of trade names is for descriptive purposes only and does not imply endorsement by the U. S. Geological Survey, by the Geological Survey of Canada, or by any of the participating universities.
Present address: Oregon State University, Corvallis, OR
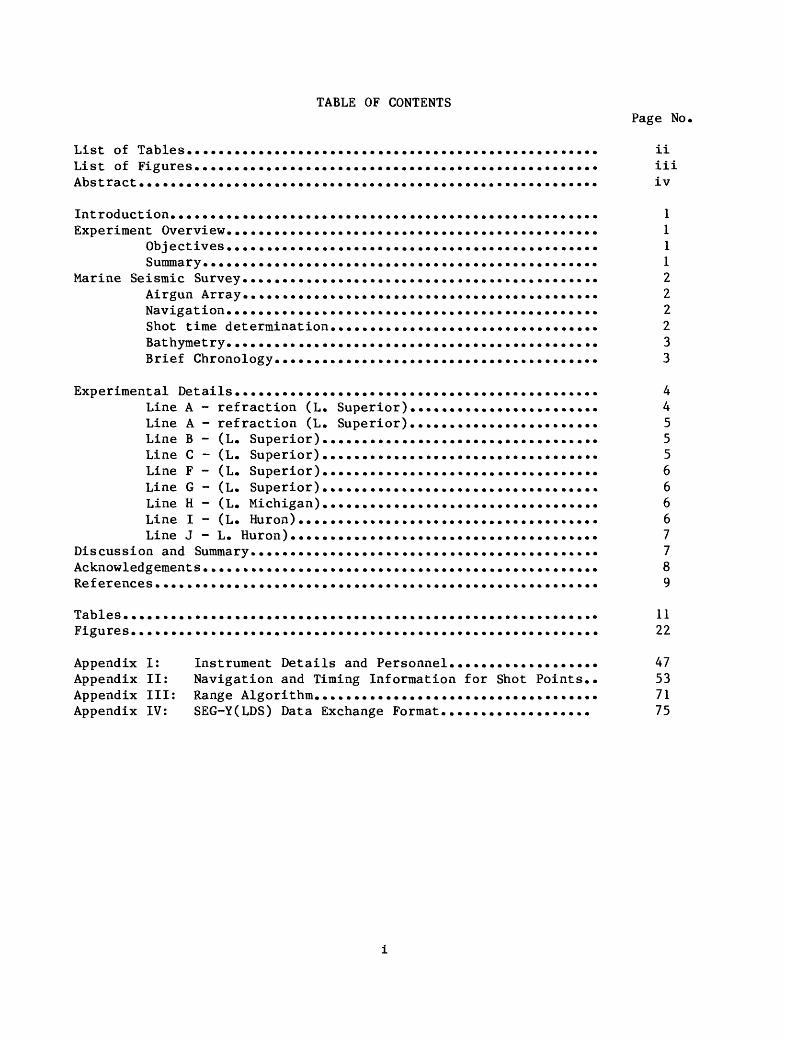
TABLE OF CONTENTSPage No,
List of Tables.................................................... iiList of Figures................................................... iiiAbstract.......................................................... iv
Introduction...................................................... 1Experiment Overview............................................... 1
Obj ectives............................................... 1Summary.................................................. 1
Marine Seismic Survey............................................. 2Airgun Array............................................. 2Navigation............................................... 2Shot time determination.................................. 2Bathymetry............................................... 3Brief Chronology......................................... 3
Experimental Details.............................................. 4Line A - refraction (L. Superior)........................ 4Line A - refraction (L. Superior)........................ 5Line B - (L. Superior)................................... 5Line C - (L. Superior)................................... 5Line F - (L. Superior)................................... 6Line G - (L. Superior)................................... 6Line H - (L. Michigan)................................... 6Line I - (L. Huron)...................................... 6Line J - L. Huron)....................................... 7
Discussion and Summary............................................ 7Acknowledgements.................................................. 8References........................................................ 9
Tables............................................................ 11Figures........................................................... 22
Appendix I: Instrument Details and Personnel................... 47Appendix II: Navigation and Timing Information for Shot Points.. 53Appendix III: Range Algorithm.................................... 71Appendix IV: SEG-Y(LDS) Data Exchange Format................... 75

List of Tables
Page No,
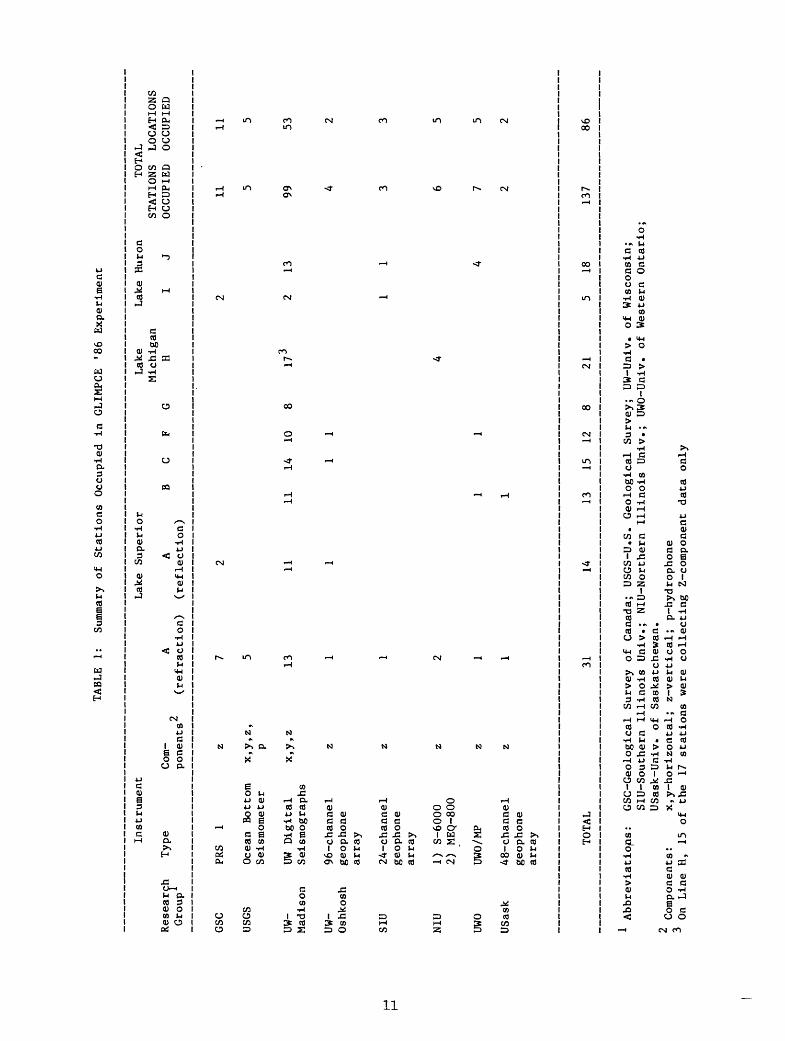
Table 1: Summary of Stations occupied in GLIMPCE'86 Experiment.... 11
Table 2: Start and End Information for Marine Seismic Lines....... 12
Table 3: Summary of stations occupied for Line A - refraction..... 13
Table 4: Summary of stations occupied for Line A - reflection..... 14
Table 5: Summary of stations occupied for Line B.................. 15
Table 6: Summary of stations occupied for Line C.................. 16
Table 7: Summary of stations occupied for Line F.................. 17
Table 8: Summary of stations occupied for Line G.................. 18
Table 9: Summary of stations occupied for Line H.................. 19
Table 10: Summary of stations occupied for Line I.................. 20
Table 11: Summary of stations occupied for Line J.................. 21
11

List of Figures
Page No.
Figure 1: Location of GLIMPCE multichannel seismic reflection lines and stations used to record wide-angle and large-offset data....................................... 23
Figure 2: Source and streamer configuration for GLIMPCE marinemultichannel profiles.................................. 25
Figure 3: Bathymetric profiles associated with each GLIMPCEshot line............................................... 27
Figure 4: Shot and station locations for line A - refraction...... 29
Figure 5: Shot and station locations for line A - reflection...... 31
Figure 6: Shot and station locations for line B................... 33
Figure 7: Shot and station locations for line C................... 35
Figure 8: Shot and station locations for line F................... 37
Figure 9: Shot and station locations for line G................... 39
Figure 10: Shot and station locations for line H................... 41
Figure 11: Shot and station locations for line I................... 43
Figure 12: Shot and station locations for line J................... 45
iii

ABSTRACT
In late summer of 1986, eight U.S. and Canadian academic and government
groups deployed 137 seismometers and land geophone arrays at 86 locations in
and around the upper Great Lakes to passively record airgun shots fired as
part of a deep-penetration marine multichannel seismic reflection program of
the Great Lakes International Multidisciplinary Program on Crustal Evolution
(GLIMPCE). Vertical components were recorded in all locations; horizontal
components were recorded in 43 locations. The primary objective of recording
the refracted, wide-angle reflected, and fan arrivals was to provide
information on crustal velocity structure to supplement images recorded on the
eight deep-penetration marine reflection profiles (five in Lake Superior, one
in Lake Michigan, and two in Lake Huron). One of the Lake Superior lines was
reshot to optimize recording of the large offset data. This report gives a
data summary of the field operations related to the large-offset data.
iv

INTRODUCTION
The Great Lakes International Multidisciplinary Program on Crustal Evolution (GLIMPCE), comprises United States and Canadian government, academic and industry geoscientists interested in the evolution of the midcontinent region of North America. GLIMPCE was formed in late 1985 to direct and coordinate future research around the Great Lakes. The first major experiment (August-September, 1986) was funded by the U.S. Geological Survey (USGS) and the Geological Survey of Canada (GSC) and utilized a large marine seismic airgun source for simultaneous acquisition of nine normal-incidence multichannel reflection and wide-angle reflection/refraction profiles in Lakes Superior, Michigan, and Huron (fig. 1). Passive recording of large offset information from all lines was done by eight academic and government groups. Together, the multichannel reflection data and the wide-angle reflection/refraction data provide an impressive and unprecedented data set for studying the deep crust and velocity structure of the midcontinent region.
This report describes the details of the field operations in which the large-offset reflection/refraction data were collected. Details of the near- vertical deep-penetration multichannel reflection profiles are included where relevant to the acquisition of the wide-angle data. A summary of the acquisition and processing parameters used for the contract multichannel seismic survey is given in Lee and others (1988) and Milkereit and others (1988). No effort is made to judge data quality or present interpretations.
EXPERIMENT OVERVIEW
Objectives: This first major seismic experiment was designed to investigate the tectonic framework and regional velocity structure of the crust in the Great Lakes region. Specific targets were the midcontinental geophysical anomaly, the Keweenawan rift, the Grenville Front, the Penokean and Huronian fold belts, and the Hemlo and Michipicoten greenstone belts.
Summary; The experiment is most easily divided into two parts: a normal incidence, deep-penetration multichannel reflection survey and a large-offset refraction/wide-angle reflection survey. The vertical reflection data comprise eight lines that were shot using a state-of-the-art marine multichannel acquisition system (lines A-C, F-I, fig. 1).
The large-offset data, consisting of wide-angle reflection, refraction and fan (i.e., off-line) arrivals, were recorded by seismometers located around the lakes during shooting of the eight offshore profiles. A ninth line was shot on equally spaced firing times and recorded by seismometers located within and around Lake Superior. This refraction line, Line A-refraction, essentially overlies line A-reflection, and is not plotted as a separate line on Figure 1.
In total, 1350 km of multichannel reflection data were collected; shots for the refraction profile covered an additional 214 km. Throughout the survey, large-offset data were recorded at 137 stations in 86 locations (table 1), including five ocean-bottom seismometers within Lake Superior and three multichannel arrays positioned around the lakes. Vertical components were recorded in all locations; horizontal components were recorded in 43locations. Recording stations for individual lines ranged from 5 (line I) to 31 (line A-Refraction).

The research groups who provided instruments for acquisition of the large-offset data included two federal surveys (USGS and GSC), two Canadian universities (U. of Western Ontario and U« of Saskatchewan), and four U.S. universities (U, of Wisconsin-Madison, U, of Wisconsin-Oshkosh, Southern Illinois U., and Northern Illinois U.). Additional personnel who participated in the field work were from U.S. Department of Energy, U.S. Coast Guard, Geological Survey of Ontario, University of Toronto, and University of Manitoba. Appendix I gives information about participants and instrumental details not covered elsewhere in the report.
MARINE SEISMIC SURVEY
All data were shot using M/V Fred J. Agnich, a seismic vessel operated by Geophoto Services, Ltd. (GSI, Calgary, Alberta). Five lines were shot in Lake Superior (lines A,B,C,F,G), one in Lake Michigan (line H) and two in Lake Huron (lines I, J). Line A in Lake Superior was also shot separately as a refraction line, utilizing the marine airgun array without the multichannel streamer array. Missing line numbers (D, E) have been reserved for speculation lines shot by GSI in Lake Superior that have not been purchased by GLIMPCE. Table 2 summarizes relevant statistical information about the marine lines. All digital navigation, shot instant, and bathymetry data as well as detailed reports from GSI are archived at GSC (Ottawa, Ont) and USGS (Denver, CO, and Woods Hole, MA).
Airgun Array: The source array (fig. 2) consisted of 76 guns, with 60 guns supplying the operating volume of 7780 inj (127.49L) and 16 guns providing spare volume of 2110 in (34.58L). Guns were strung on six linear subarrays, each 9.9 m long, with a total array width of 80 m. Gun sizes ranged from 80 in (1.31L) to 160 in (2.62 L). Operating pressure was maintained at 1900-2000 psi (12.8 - 13.8 MPa). Air gun synchronization was provided by GSI TIGER II controller. Array depths were 12 ± 1 m in Lake Superior, and 6 ± 1 m in Lakes Michigan and Huron. The shallower array depth was used because of shallow water in northern Lake Michigan and in the channel between Georgian Bay and Lake Huron.
Navigation; Primary navigation for all lines was by GEONAV, which utilized doppler sonar velocities to interpolate fixes between transit- satellite updates.
LORAN C provided secondary navigation and a Global Positioning System receiver provided backup (satellite) navigation. All navigation positions refer to the position of the transit satellite antenna, which was located 74 m in front of the center of the airgun array (fig. 2). Details of the navigation system are given in Appendix II.
Shot time determination; In order to utilize a common time base between the normal incidence reflection data acquired by the contract vessel and the large-offset reflection/refraction data acquired independently during shooting, all times were synchronized to the time of the eastern Geostationary Operational Environmental Satellite (GOES). The shot instant was calculated by adding known internal system delays to the time recorded for the command to fire the guns which was always initiated on a whole second. System delays totalled .90796 s for reflection lines and 1.90796 s for line A-refraction, with additional delays of .31062 s for shots coinciding with the change of
tape of the DPS V acquisition computer, 24.5 s for all of line A-reflection, and 23.1 s for SP 970-1880 for line C. Determination of these delays is given in Appendix II.
Bathymetry: Digital bathymetry was acquired by a 38-kHz fathometer assuming a water velocity of 1470 m/s. This assumed velocity is valid for Lakes Michigan and Huron, where the average water temperature during the survey was 12°C (corresponding to a theoretical fresh water velocity of 1465 m/s). Because the colder water in Lake Superior would lower the velocity (5°C corresponds to a theoretical fresh water velocity of 1432 m/s), water depths there may be slightly overestimated. The fathometer was located 33.5 m in front of the ship's antenna, or 107.5 m in front of the center of the airgun array.
The original digital bathymetry provided by the contractor contained frequent gaps and noise of 10 to 50 m compared to the fathometer strip-chart profile. Final bathymetry was obtained (fig. 3) by (1) plotting the bathymetry at the same scale as the original fathometer strip-charts, (2) adjusting line segments that were reading a constant offset, (3) redigitizing those parts of lines that were either absent or missed the character of the bottom, and (4) applying a 3-point running average to smooth the noisy signal. Because no fathometer record was kept for line A-refraction (although digital bathymetry were recorded), this line was divided into 50-shot increments and smoothed and redigitized in accordance with its agreement to the relevant portions of line A-reflection. No 3-point running average was used for these relatively widely spaced shots.
The smoothed bathymetry is considered to be accurate to within 5 m of the depth given on the fathometer strip chart, and should be more than accurate enough for topographic corrections to the large-offset data.
Brief Chronology; The experiment began in Lake Superior with shooting of line A-refraction on 31 August - 1 September 1986. After five days of down time to resolve a navigation problem, multichannel reflection acquisition began with line B on 6 September. Maintaining the ship's speed so as to fire the guns every 50 m (about every 23 s) while recording long records (every 20 s) and keeping the streamer from sinking in the fresh water of the lake proved to be impossible. The shot spacing was therefore adjusted from 50 m (30-fold data) to 62.5 m (24-fold data). The change between 50-m and 62.5-m shots on lines F (7-8 September) and A (9-10 September) reflects unsuccessful efforts to reballast the streamer for 50-m (30-fold) data. Line G was shot on 11 September. Line C was shot in 2 parts on 12-13 September because of poor weather conditions and on-board computer problems.
After a port stop in Sault Ste. Marie to exchange personnel, replenish supplies, and reconfigure the source and streamer arrays for shallow water, the reflection shooting resumed in Lake Michigan with line H (18-19 September). Parts of the streamer damaged in the ship's propeller during retrieval were replaced in transit between Lakes Michigan and Huron. The final lines collected were lines I (21 September) and J (22-23 September) in Lake Huron.

EXPERIMENTAL DETAILS
This section provides a line-by-line description of the large offset data, including a brief summary of the stations occupied, type of data recorded, and maximum offsets. (Appendix I gives additional instrumental details, a list of participants for each group that supplied field instruments, and archive information on the field data).
During the field work, coordination between the shooting ship and land- based groups was critical to the success of the operation. A.G. Green and C. Spencer (both with GSC, Ottawa) provided this support out of Sault Ste. Marie (Lake Superior lines) and Ottawa (Lakes Michigan and Huron lines).
Line A-Refraction; Line A-Refraction in Lake Superior was shot specifically as a refraction line along the same position as line A- reflection. The primary objective of this line was to determine the velocity structure of the crust and upper mantle across the Keweenaw rift where earlier refraction studies yielded crustal thicknesses in excess of 50 km (Halls, 1982). Figure 4 shows shot and receiver locations, table 3 lists relevant information about the receiving stations.
This line was shot by time, rather than by distance, so that receiving seismographs could be synchronized to record discrete shots. The airgun array was fired every two minutes for a total of 640 shots, which averaged about 333 m apart. This shot spacing was chosen so that, at the longest ranges, arrivals from previous shots would not overlap.
A total of 31 stations recorded data along this line (fig. 4). Although no multichannel streamer array was towed from the ship, three multichannel geophone arrays were positioned on land: WISCORP south of the line, CH in the Keweenaw Peninsula, and AA north of the line. Five four-component ocean- bottom seismometers (A8, A2, C4, C9, C3 of USGS) were spaced along the line within the lake. Seven vertical component seismometers were located in a linear array north of the line (SUP1, SUP3-SUP8). Five 3-component seismometers (Cl, C2, C3, C4, C5, C6 of UW, Madison) and two vertical- component seismometers (2N, 5S) were located south of the lake. Three 3- component seismometers were located slightly offline on the Keweenaw Peninsula
A special problem exists regarding the OBS locations. The initial locations were chosen based on LORAN C fixes of the Coast Guard vessel from which the instruments were deployed. These locations were incompatible with locations determined by arrival times of shots from the shooting ship (which used Satellite/Doppler sonar navigation). Hence, either the navigation of the deploying ship or the shooting ship or both was in error. OBS locations were calculated (as described in Appendix I) as though all of the error originated from the deploying ship. (This is reasonable because most commercial LORAN C units fail to include overland-propagation and secondary factor corrections to final latitude/longitude calculations). If, however, the error was in the navigation of the shooting ship, this implies that all ranges calculated for the onshore instruments may be biased. Relative range from shot to shot (and therefore observed apparent velocities) should not be significantly affected. This possible source of error would affect intercept times and may affect correlation of the large-offset data to the near-vertical data.

(CP1-CP3). Fan recordings were made at five locations: Michipicoten Island (A), Isle Royale (IR1, IR2), Brule River (Bl), Bayfield Peninsula (BF1) and Ontanagon (ON1).
For shots along the profile, maximum ranges recorded are 256 km (SP 109 to station SUPS) and 231 km (SP 748 to station C4).
Line A-Reflection: Line A-Reflection was shot in two parts with different shot spacings (50 m and 62.5 m) because of problems in balancing ship's speed against streamer buoyancy. The overlap begins at SP 2290, with SP 2290-2326 (50 m shots) overlapping with SP 2290-2320 (62.5 m shots). As with line A-Refraction, the primary objective of this line was to image the crust and upper mantle structure at the position of the thickest crust associated with the midcontinent rift. Because this line was also shot separately as a refraction profile, collection of large-offset data was not a high priority.
Fourteen stations recorded large offset data (fig. 5; table 4). Two stations (SUP2A, SUP7A) were occupied north of the lake to record data where instruments had failed during the recording of line A-refraction. Two 3- component stations recorded data on the Keweenaw Peninsula and south of the line, respectively. Six stations recorded fan arrivals, including one 96- channel geophone array (WISCORP).
Line B; Line B, along the northeast shore of Lake Superior (fig. 6), was shot with a 50-m shot interval over a distance of 98 km. The primary objective of this line was to profile the structure of a granite-greenstone belt along the edge of the Keweenaw rift. The offline recorders also received ray paths directly through and beneath the main part of the Keweenaw rift.
A total of 13 stations (fig. 6, table 5) recorded large offset information from shots fired on line B. No station was located exactly along the axis of the profile, although BB (a 48-channel geophone array north of the lake) and A (a vertical-component seismometer on Michipicoten Island) are reasonably close to the axis. The remaining 11 stations recorded fan arrivals on 3-component instruments.
Line C; Line C in Lake Superior, 109 km long, was shot in two parts because of shipboard computer malfunction. Both parts were shot with 62.5 m shots. The objective of this line was to image the structure of the western limb of the Keweenaw rift. Its location roughly coincides with a refraction line shot in 1967 (Luetgert and Meyer, 1982).
A total of 15 stations recorded data from shots on this line (fig. 7, table 6). One 96-channel geophone array was positioned south of the line (WISCORP). The remaining fourteen stations were 3-component instruments located northwest of the line (6 stations, B1-B6), south of the line (4 stations, ON1-ON4) and offline at Isle Royal (2 stations, IR1, IR2), Keeweenaw Peninsula (1 station, CP3) and Big Bay (1 station, C6). Maximum offsets recorded were 131 km (SP 156 to station ON3 and SP 1880 to station B3).
The overlap between the two parts of line C occurs between SP 741 and SP 771. A special timing problem occurred on the start of the second part of the line. At SP 741, the GSI clock was synchronized to the satellite clock

for shot instant determination. However, by SP 1057, the two clocks read 23.1 s apart. When the discrepancy occurred was not logged, and hence the exact shot instants for SP 741-1057 remains uncertain. The 23.1s correction has been applied to all shots after SP 970.
Line F; Line F, located in Lake Superior, was shot in 6 parts alternating between 50 m and 62.5 m shot intervals (see table 2), This variation reflects buoyancy problems with the streamer, A 2,2 km gap occurs between SP 455 and SP 457; and a major change in the orientation of the line occurs at SP 1579, The primary objective of this line was to image the eastern limb of the Keweenawan rift in a region of relative gravity low and two positive magnetic anomales.
Twelve stations (fig, 8, table 7) recorded data from line F. A vertical- component seismometer on Michipicoten Island (A, Fig. 8) is the closest instrument to the axis of the north-northeast segment of the line (SP 101- 1579); four three-component instruments (C6, ON1-3) and a 96-channel geophone array (WISCORP) are approximately along the axis of the east-north-east segment of the line (SP 1580-1843), The remaining six stations (CP3, IR1, IR2, B1-B3) are three component seismometers that recorded fan arrivals through and beneath the rift basin,
Line G: Line G, 54 km long in Lake Superior, was shot with 62,5-m shot intervals and is the shortest of all lines. It was positioned to give a line crossing with line A in the region where continental crust was assumed to be thickest.
Eight stations, all three-component seismometers deployed by University of Wisconsin-Madison, recorded fan shots for this line (figure 9, table 8). There were no stations positioned along the axis of the line.
Line H; Line H, the only line in Lake Michigan, was shot with 62,5-m shot intervals for a total length of 283 km. A major bend in the line occurs at SP 3565. The primary objective of this line was to image the structure of the Penokean fold belt buried beneath Paleozoic sediments of the Michigan Basin.
A total of 21 stations were deployed along Line H (figure 10, table 9). Seventeen stations, containing a combination of fifteen vertical-component instruments (MCla-MC5c) amd two 3-component instruments (MC6, MC7), were positioned north of the lake along the axis of the north-northeast trending segment of the line (SP 101-3565). The remaining four stations were vertical- component seismometers (IS, 2N, 3S, 5S) located northwest of the lake and slighly off the axis of the east-northeast trending segment of the line (SP 3565 - SP 4636). The maximum range recorded for this line was 256 km (SP 101 to station MC6),
Line I: Line I in Lake Huron, was a north-south line (108-km long) positioned so as to image the structure of Proterozic Huronian platform deposits exposed north of the lake but buried beneath the lake by Phanerozoic sediments. Shots were spaced 62.5 m apart.
Five stations were occupied during the shooting of line I (figure 11, table 10). One vertical component seismometer was positioned along the north

shore of the lake (IRON). A second vertical-component instrument (MAN) was located slightly offline on the western end of Manitoulin Island. The remaining three stations, all south of the line in Michigan, comprised 2 three-component seismometers (HE1, HE2) and a 24-channel geophone array (AL). The largest offsets recorded were 116 km (SP 102 to station IRON) and 118 km (SP 1823 to station HE2). No fan arrivals were recorded for this line.
Line J; Line J, located in Georgian Bay and Lake Huron, is the longest of all lines in the GLIMPCE experiment (323 km). All shots were fired at 62.5-m spacings. Several kinks occur where the vessel adjusted course to stay within the channel separating Georgian Bay and Lake Huron (SP 1800-2300). The primary objective of this line was to profile the Grenville front and the buried igneous terrane to the west.
Eighteen stations were occupied during the acquisition of this line (figure 11, table 10). Three vertical-component seismometers were positioned east of the line on the coast of Georgian Bay (stations C, D, E). A fourth vertical-component instrument was located on the Bruce Peninsula midway down the line (station B). The rest of the stations were located just west of the end of the line and consisted of one 24-channel geophone array (SH) and thirteen three-component seismometers, ten of which were in a linear array less than 2 km long. Maximum offsets for this line are 336 km (SP 101 to station Fll) and 346 km (SP 5264 to station D).
DISCUSSION AND SUMMARY
In order to insure consistency in data preparation and distribution, all participants agreed to use the same algorithm for range calculation to display and interpret the large offset data. This algorithm uses the geodetic inverse formula with geodesy by A. R. Clarke (1880) and is listed in Appendix III. Final data exchange format is a superset of SEG-Y, with header definitions for refraction data given in Appendix IV.
In summary, this first GLIMPCE experiment has provided an impressive amount of seismic information for studying crustal structure and tectonics of the mid-continent. Eight academic and government groups "piggybacked" on a major marine multichannel reflection survey and were able to record vertical and three-component data for all seismic lines shot in the Great Lakes. The success of this effort rests with the careful coordination between the shooting ship and the land-based groups. The experiment demonstrates that large offset information can be acquired simultaneously with deep crustal reflection profiling at a fairly modest expenditure of dollars, time and effort.

ACKNOWLEDGEMENTS
An experiment of this size and cost would not have been possible without the dedication and cooperation of numerous individuals. Bill Cannon of USGS and Alan Green of GSC provided the driving force behind the organization of GLIMPCE and the 1986 seismic experiment and were instrumental in securing the USGS and GSC funding that made the experiment possible. Alan Green, with help from Carl Spencer, also impressively coordinated efficient communications between the shooting ship and the often remotly located field parties deploying seismometers and geophone arrays. J.C. Behrendt (USGS) and L.D. McGinnis (U.S.-DOE) were GLIMPCE representatives aboard M/V Fred J. Agnich during the Lake Superior lines; A.G. Green (GSC) and D.R. Hutchinson (USGS) were on-board representatives during the Lake Michigan and Lake Huron lines. We thank John Clink (GSI) and the captain and crew of the Fred J. Agnich for their cooperation during the contracting and shooting. We thank the Captain and crew of the U.S. Coast Guard vessel Katmai Bay for their cooperation during deployment and recovery of the OBS's in Lake Superior, and the Geological Survey of Ontario for helicopter logistics into Michipicoten Island. Much of the field logistics would not have been possible without the dedicaton of the many researchers, technicians, and students who operated the field instrumentation, most who are listed in Appendix I. Finally, we thank K. Ruffin, M.C. Mons-Wengler, E. Winget, P. Forrestel, J. Zwinakis and D. Blackwood for technical assistance in preparing the manuscript and J. Luetgert and W. Agena for critical reviews.

REFERENCES
Barry, K.M., Cavers, D.A., and Kneale, C.W., 1975, Recommended standards for digital tape formats: Geophysics, v. 40, p. 334-352.
Clarke, A.R., 1880, Geodesy, Oxford, Clarendon Press, 356p.
Creager, K.C., and Dorman, L.M., 1982, Location of instruments on the seafloor by joint adjustment of instrument and ship positions: Journal of Geophysical Research, v. 87, p. 8379-8388.
Halls, B.C., 1982, Crustal thickness in the Lake Superior region, in Wold, R.J., and Hinze, W.J., eds, Geology and tectonics of the Lake Superior Basin: Geological Society of America Memoir 156, p. 239-243.
Lee, M.W., Agena, W.F., and Hutchinson, D.R., 1988, Processing of GLIMPCE multichannel seismic data: U.S. Geological Survey Open-file Report 88- 225, 46p.
Luetgert, J.H., and Meyer, R.P., 1982, Structure of the western basin of Lake Superior from cross structure refraction profiles, in Wold, R.J., and Hinze, W.J., eds., Geology and tectonics of the Lake Superior basin: geological Society of America Memoir 156, p. 245-255.
Milkereit, B. , Green, A.G., Morel'a-l,Huissier, P., Lee, M.W., and Agena, W.F., 1988, 1986 Great Lakes seismic reflection survey-migrated data: Geological Survey of Canada Open file report/Dossiers Publics no. 1592. 35p.

10
TABL
E 1:
Su
mmar
y of Stations Occupied in
GLIMPCE '86
Experiment
Res
earc
h
Gro
up
GSC uses
UW-
Mad
ison
UW-
Osh
kosh
SIU
NIU
UWO
USa
sk
Inst
rum
ent
Typ
e C
om
ponen
ts
PRS
1 z
Oce
an
Bot
tom
x,y
,z,
Sei
smom
eter
p
UW D
igit
al
x,y
,z
Sei
smo
gra
ph
s
96-c
han
nel
z
geop
hone
arr
ay
24-c
han
nel
z
geop
hone
arr
ay
1)
S-6
000
z 2)
M
EQ-8
00
UWO/
MP
z
48-c
han
nel
z
geop
hone
arr
ay TO
TAL
Lak
e S
uper
ior
Lak
e L
ake
Hur
on
TOTA
L M
ichi
gan
STA
TIO
NS
LOC
ATI
ON
S A
A B
CF
GH
IJ
OC
CU
PIED
O
CC
UPI
ED
(refr
acti
on)
(refl
ecti
on)
72
2 11
11
5 55
13
11
11
14
10
8 17
3 2
13
99
53
1111
42
1 1133
2 4
65
1 11
47
5
11
22
31
14
13
15
12
8 21
5
18
137
86
Abbr
eviati
ons:
GSC-Geological Su
rvey
of
Canada;
USGS
-U.S
. Geological Survey;
UW-Univ. of
Wisconsin;
SlU-
Sout
hern
Il
lino
is Un
iv.;
NIU-Northern Il
lino
is Un
iv.;
UW
O-Un
iv.
of We
ster
n On
tari
o;US
ask-
Univ
. of
Saskatchewan.
Comp
onen
ts:
x,y-horizontal;
z-ve
rtic
al;
p-hy
drop
hone
On
Li
ne H,
15
of th
e 17
stations we
re collecting Z-
comp
onen
t da
ta on
ly

TABL
E 2: Start
and
End
Info
rmat
ion
for
Marine Se
ismi
c Lines
Glimpce
Line
ID
A-refraction
A-reflection
B C F G H I J
GSI
ID1
AA-
A'A
A"A
BB'
CC1
CC'A
BFLINK
FF'
F'F"
G'G
3 1 2A
Leng
th
(KM)
214
111
103
98 38 71 18 26 2 42 26 47 54 283
108
323
Shot
Int 2
50 62.5
50 62.5
62.5
50 62.5
50 62.5
50 62.5
62.5
62.5
62.5
62.5
Fold
(m)
min
30 24 30 24 24 30 24 30 24 30 24 24 24 24 24
Start
Time
2 JD/GMT
243/1600
252/
0950
253/
0327
249/1345
255/
1320
255/2250
250/
1732
250/
1959
250/2246
250/
2300
251/
0656
251/1016
254/
0312
261/1306
263/1943
265/
0649
End
Time
2 JD/GMT
244/
1318
253/
0012
253/1428
250/
0216
255/
1715
256/0609
250/
1946
250/
2246
250/2300
251/
0330
251/
1016
251/1541
254/
0849
262/
1840
264/0701
266/
1631
Start
SP
109
101
2290
111
156
741
101
457
867
903
1580
2096
101
101
102
101
End
SP
748
2326
3944
2063
771
1880
455
866
902
1579
2095
2843
969
4636
1823
5264
TOTAL
9 li
nes
1564
km
Line
ID used by the
contractor in
co
llec
ting
the
multichannel
processing
navigation
JD-Julian Day; GMT-Greenwich Me
an Time.
All
time
s ro
unde
d to
wh
ole
minutes,

TABLE
3: Su
mmar
y of
Stations Occupied for
Line A
- refraction
OJ
Research
I Group
U.S.G.S.
G.S.C
U. Wi
scon
sin
(Madison)
U. Western
Onta
rio
Northern
Illi
nois
U.
1U.
Saskatchewan
U. Wisconsin
(Oshkosh)
Southern
Illinois U.
Station
ID A8 A2 C3 C4 C9 SUP1
SUPS
SUP4
SUPS
SUP6
SUP7
SUPS
Bl BF1
Cl C2 C3 C4 C6 CP1
CP2
CP3
IR1
IR2
ON1
A 5S 2N AA WISCORP
CH
LAT
48.54810
48.26583
47.14079
47.95688
47.71128
48.77233
48.90250
48.9
4567
48.9
9717
49.04100
49.09283
49.14400
47.9
0127
46.80583
46.80610
46.78452
46.76120
46.71639
46.78597
47.45694
47.41778
47.41194
48.0
9617
48.09250
46.8
2167
47.7
2004
5
45.73383
45.92033
48.85033
46.80167
47.4
2639
LON
-87.
1610
9-8
7.27
365
-87.59501
-87.
3675
2-87.43908
-87.
1145
0-8
7.06
650
-87.
0798
3-8
7.10
017
-87.
0741
7-8
7.06
217
-87.05467
-90.
0608
4-9
1.03
833
-87.64292
-87.
6414
0-8
7.64
594
-87.63824
-87.
7286
7-8
7.79
222
-87.
7583
3-8
7.79
722
-88.
5945
0-8
8.60
083
-89.
3583
3
-85.
7986
67
-88.
1888
3-8
8.15
667
-87.
0986
7
-87.
6433
3
-87.
7627
8
Elev
1
(masl)
38-47 62 -24 23 190
305
320
335
302
338
325
451
347
198
201
201
259
305
305
247
222
207
207
221
230
387
384
317
204
242
o Components
z,p
x,y,z,p
x,y,z,p
x,y,
zx.
y.z
z z z z z z z
x,y,z
x.y.z
x,y,z
x.y.
zx,y,z
x,y,z
x,y,z
x.y.
zx,y,z
x,y,z
x.y.z
x,y,z
x.y.z
z z z
48 *
z
96 *
z
24 *
z
Record Time
(JD/GMT)
start
end
243/
1600
24
3/21
5424
3/16
00
244/1628
243/
1600
244/1618
243/
1600
244/1512
243/
1600
244/1450
243/
1600
244/1520
ii ii
ii U
"
i. .1
n M
i ii
243/
1523
24
4/18
1624
2/13
02
244/1600
243/
1518
24
4/14
4424
2/20
36
244/
1411
243/1521
244/0903
242/2343
244/1640
243/1517
244/
1516
243/
1316
244/1500
243/
1506
244/1600
243/
1415
244/1546
243/
1518
244/1536
243/
1553
244/1612
243/
1508
244/1540
243/
1550
244/1314
243/
1555
243/2230
243/
1600
24
4/08
12
243/
1600
24
4/13
19
243/
1600
24
4/14
22
All
OBS
elev
atio
ns co
rrecte
d for
lake le
vel
(183 ma
sl).
x,y-horizontal;
z-vertical
; p-
pres
sure
(hydrophone)

TABL
E 4: Su
mmar
y of St
atio
ns Occupied fo
r Li
ne A -
reflection
Research
Stat
ion
Grou
p ID
G.S.
C.
SUP2
ASUP7A
U. Wisconsin
Bl(M
adis
on)
B2 B3 B4 B5 C6 CP3
IR1
IR2
ON2
ON3
LAT
48.84033
49.09250
47.9
0127
47.84592
47.9
5893
47.91972
47.93963
46.78597
47.41194
48.0
9617
48.09250
46.7
1833
46.6
7917
LON
-87.10017
-87.06233
-90.06084
-90.04132
-90.12148
-90.09130
-90.09724
-87.
7286
7-87.79722
-88.59450
-88.60083
-89.38250
-89.35417
Elev
(m
asl)
314
332
451
338
552
527
546
305
222
207
207
347
348
Comp
onen
ts
z z
x,y,z
x,y,
zx.
y.z
x,y,
zx,
y,z
x,y,
zx,
y,z
x,y,
zx,
y,z
x,y,
zx,y,z
Reco
rd
Time
(J
D/GM
T)
star
t end
253/0400
253/
0400
252/0115
252/0200
253/0037
251/
2130
251/2345
252/0252
251/0146
251/
2339
252/
0040
251/
1900
251/
1941
253/1430
253/1430
253/1939
254/1400
253/0119
252/2100
252/2330
253/
0505
253/0849
253/
2259
253/
2345
256/1235
254/
1700
U. Wisconsin
(Oshkosh)
WISCORP
46.6
8667
-89.38750
337
96 *
z25
2/10
10
253/
0009

TABLE
5: Su
mmar
y of
Stations Occupi
ed for
Line B
f-1
Ui
Research
Grou
p
U. Wi
scon
sin
(Mad
ison
)
Stat
ion
ID Bl B2 B3 IR1
IR2
ON1
ON2
ON3
ON4
C6 CP3
LAT
47.90127
47.8
4592
47.95893
48.0
9617
48.09250
46.8
2167
46.71833
46.67917
46.69833
46.7
8597
47.41194
LON
-90.
0608
4-9
0.04
132
-90.12148
-88.59450
-88.
6008
3-89.35833
-89.
3825
0-8
9.35
417
-89.
3716
7-8
7.72
867
-87.79722
Elev
(masl)
451
338
552
207
207
221
347
348
366
305
222
Components
x,y,z
x,y,
zx,
y,z
x,y,
zx,y,z
x,y,
zx,y,z
x,y,z
x,y,
zx,y,z
x,y,z
Reco
rd
Time
(JD/GMT)
star
t end
249/
0000
250/1919
249/
0000
251/0145
249/2137
250/2319
249/0000
250/2325
249/
0000
25
1/00
0524
9/13
00
250/
1201
247/
0830
250/1330
248/
2120
251/1926
249/
2145
250/1400
249/
1200
250/0452
248/
2134
25
0/12
11
U. Western
B 47.720045
-85.798667
230
(Ontario)
U. Saskatchewan
BB
49.0
2916
7 -87.211167
445
48 *
z
249/
1220
25
0/03
37
249/
1345
250/0223

TABL
E 6:
Su
mm
ary
of
Sta
tions
Occ
upie
d fo
r L
ine
C
Research
Stat
ion
Group
ID
U. Wisconsin
Bl(M
adis
on)
B2 B3 B4 B5 B6 IR1
IR2
ON1
ON2
ON3
ON 4
C6 CP3
LAT
47.90127
47.84592
47.95893
47.91972
47.93963
47.8
5279
48.0
9617
48.09250
46.8
2167
46.7
1833
46.6
7917
46.69883
46.78597
47.4
1194
LON
-90.06084
-90.04132
-90.12148
-90.09130
-90.09724
-90.05097
-88.59450
-88.60083
-89.35833
-89.38250
-89.
3541
7-89.37167
-87.72867
-87.79722
Elev
(masl)
451
338
552
527
546
402
207
207
221
347
348
366
305
222
Compon
ents
x,y,z
x,y,
zx,
y,z
x,y,
zx,y,
zx,
y,z
x,y,
zx,
y,z
x,y,
zx,
y,z
x,y,z
x,y,z
x,y,
zx,
y,z
Reco
rd
Time
(JD/GMT)
star
t end
255/1051
255/
2351
255/
0945
25
6/00
47255/1200
255/2302
255/1122
255/
2332
255/1137
255/2314
255/1550
256/
0022
255/
1202
255/2320
255/1230
255/2352
255/
1138
25
6/03
23255/1213
256/
0016
255/
1312
256/0106
255/1229
256/0036
255/
1259
25
5/13
09255/1235
255/1909
U. Wisconsin
(Osh
kosh
)WISCORP 46.68667
-89.38750
337
255/
1335
25
6/06
41

TABLE
7: Su
mmar
y of Stations Occupied fo
r Li
ne F
Research
Group
U. Wisconsin
(Mad
ison
)
U. Wisconsin
(Osh
kosh
)
U. Western
(Ont
ario
)
Station
ID
Bl B2 B3 IR1
IR2
ON1
ON2
ON3
C6 CP3
WISCORP
A
LAT
47.9
0127
47.84592
47.95893
48.0
9617
48.09250
46.8
2167
46.71833
46.67917
46.78597
47.4
1194
46.6
8667
47.720045
LON
-90.06084
-90.04132
-90.12148
-88.59450
-88.60083
-89.
3583
3-89.38250
-89.35417
-87.72867
-87.
7972
2
-89.38750
-85.
7986
67
Elev
(masl)
451
338
552
207
207
221
347
348
305
222
337
230
Components
x,y,z
x,y,
zx,y,z
x,y,z
x,y,
zx,y,z
x,y,z
x,y,
zx,
y,z
x,y,z
96 *
z
z
Record
Time
(JD/GMT)
start
end
249/2320
250/
0020
249/
2137
249/2318
250/0000
250/
1252
250/1330
249/2330
250/0520
250/
1227
251/0717
250/1000
252/
0108
252/0200
251/
2359
251/
2321
252/0040
250/
1900
251/1830
251/1926
250/2359
252/0239
251/
1440
251/
0400

TABL
E 8: Su
mmar
y of St
atio
ns Oc
cupi
ed fo
r Li
ne G
Research
Group
U. Wisconsin
(Mad
ison
)
Station
ID Bl B2 IR1
IR2
ON2
ON3
C6 CP3
LAT
47.9
0127
47.8
4592
48.09617
48.09250
46.7
1833
46.6
7917
46.7
8597
47.4
1194
LON
-90.06084
-90.04132
-88.59450
-88.60083
-89.38250
-89.35417
-87.72867
-87.79722
Elev
(mas
l)
451
338
207
207
347
348
305
222
Components
x,y,
zx,
y,z
x,y,
zx,y,z
x,y,
zx,y,z
x,y,
zx,y,z
Record
Time
(JD/
GMT)
star
t en
d
254/
0230
255/0200
254/0230
254/
0845
253/
2339
254/2219
254/
0000
25
5/00
0525
3/21
50
254/1700
253/2230
254/1700
254/
0220
254/1034
253/2210
254/0924
00

TABLE
9: Summary
of St
atio
ns Oc
cupi
ed for
Line
H
Research
Stat
ion
Grou
p ID
U. Wisconsin
MCla
(Madison)
MClb
MClc
MC2a
MC2b
MC2c
MC3a
MC3b
MC3c
MC4a
MC4b
MC4c
MC5a
MC5b
MC5c
MC6
MC7
Northern
INIllinois U.
IS 3S 5S
LAT
46.05033
46.0
4953
46.0
4793
46.0
4873
46.04712
46.04553
46.0
4632
46.04472
46.0
4311
46.0
4391
46.0
4231
46.0
4150
46.0
4070
46.0
3990
46.0
3910
46.09363
46.01237
45.90917
45.6
9683
45.72133
45.7
3383
LON
-86.07704
-86.07764
-86.07884
-86.07824
-86.07945
-86.08065
-86.08004
-86.08124
-86.08245
-86.08185
-86.08305
-86.08365
-86.08425
-86.08485
-86.08545
-86.07319
-86.11105
-88.09217
-87.90033
-88.03533
-88.18883
Elev
(masl)
221
221
219
219
218
215
216
213
210
213
209
207
207
207
207
197
207
380
290
329
387
Comp
onen
ts
z z z z z z z z z z z z z z zx,
y,z
x,y,z
x,y,z
zx,
y,z
z
Reco
rd
Time
(J
D/GM
T)
star
t en
d
261/0800
11 11
261/
0800
" "
261/0840
261/0830
" "
261/
0900
11 "
261/1600
261/
1700
262/
0253
261/2222
262/0300
262/
0300
262/
2015
262/
2020
"
262/
1424
262/2030
262/
1917
"
262/1957
262/
2045
262/
1230
262/0920
262/0700
262/0739

TABL
E 10
: Su
mmar
y of St
atio
ns Oc
cupi
ed fo
r Li
ne I
Research
Grou
p
G. S .C.
U. Wisconsin
(Mad
ison
)
Southern
Illi
nois
U.
Stat
ion
LAT
ID
IRON
MAN
HE1
HE2
AL
46.2
4067
45.91350
45.1
5621
45.10619
45.07917
LON
-83.23833
-83.17917
-83.39214
-83.39413
-83.39583
Elev
(m
asl)
204
207
201
158
Comp
onen
ts
Reco
rd Ti
me
(JD/GMT)
star
t end
z 26
3/14
00
z 26
3/14
00
x,y,
z 26
3/12
44
263/1500
24 *
z 263/1930
264/1100
264/
1000
264/1200
264/
1120
264/0736
to
o

TABLE 11
: Summary
of St
atio
ns Oc
cupi
ed fo
r Li
ne J
Research
Stat
ion
LAT
Grou
p ID
U. Wisconsin
Fl(M
adis
on)
F10
Fll
F12
F13
F2 F3 F4 F5 F6 F7 F8 F9
U. Western
BOntario
C D E
Sout
hern
SH
Illi
nois
U.
45.59559
45.5
9939
45.61227
45.5
7724
45.58297
45.59612
45.5
9621
45.5
9628
45.59643
45.59679
45.59689
45.5
9746
45.59818
45.200548
45.0
8608
145.070883
45.1
6568
1
45.62638
LON
-84.35345
-84.37473
-84.38957
-84.33746
-84.38998
-84.35585
-84.35826
-84.36082
-84.36338
-84.36577
-84.36833
-84.37056
-84.37284
-81.
5551
28-80.029875
-79.
8517
81-79.880952
-84.21250
Elev
(m
asl)
220
220
220
220
215
220
220
220
220
220
220
220
220
207
197
230
230
188
Components
x,y,z
x,y,
zx,y,z
x.y.z
x,y,z
x.y.z
x.y.
zx,y,z
x.y.
zx,y,z
x.y.
zx,
y,z
x.y.z
z z z z
24 *
z
Reco
rd Ti
me
(JD/
GMT)
st
art
end
265/
0600
265/
1200
265/
1655
265/
1700
265/
2300
265/
0600
265/0600
265/
0600
265/
0600
265/
0600
265/0600
265/
0600
265/0600
265/0651
"
265/
1451
266/
1733
266/1755
266/1801
266/1730
266/
1054
266/
1744
266/
1654
266/
1204
266/1745
266/
1750
266/1750
266/1750
266/1755
266/
1800
" "
266/1755

Figure Captions
Figure 1: Location of GLIMPCE multichannel seismic reflection lines and stations used to record wide-angle and large-offset data. Line A-refraction overlies line A-reflection and is not plotted. Individual station names associated with each line are shown in figures 4 to 12.
22

50°N
49°
48°
47«
46°
GLIMPCE 1986 REFLECTION / REFRACTION
* EXPERIMENT +
REFRACTION STATIONSGEOLOGICAL SURVEY of CANADA U.S. GEOLOGICAL SURVEY UNIV. WISCONSIN-MADISON UNIV. WISCONSIN-OSHKOSH
o SOUTHERN ILLINOIS UNIV.o NORTHERN ILLINOIS UNIV. UNIV. WESTERN ONTARIO +X UNIV. SASKATCHEWAN
45°
Polyconic Projection
23

Figure 2: Source and streamer configuration for GLIMPCE marine multichannel profiles. A) Streamer geometry and relative positions of fathometer, satellite antenna, airgun array and streamer. B) Geometry and size of the airgun array. Whereas the total array contained 76 guns, only 60 guns were operational at any one time.
24

A. GLIMPCE 19S6 CONTRACT VESSELv Satellite Antenna
~~rr~Sr*-*~^r*~*&ry
Fathometer Airgun Array 120- Channel Streamer
-33.5m - -74.0m*- 107.5m
_228_ -236m
-3024m -(center near trace to center far trace)
B. AIRGUN AKKAY
STBD / OUTER
STBD ^^ MIDDLE
STBDINNER
' 4x|60(2.62L)
^ o-o-o-o -s 4x|60(2.62L)
O-O-O-O-S 4x|60(2.62L)
3x125 (2.05L)
O-O-O-S 3x|25(2.05L)
O-O-O-O-S4xl25(2.05L)
2xlOO(l.64L)
O-O-S2xlOO(l.64L)
O-O-O-O4x80(l.3IL)
PORT INNER
PORT MIDDLE
PORT OUTER
-O-O-O-O-s- 4x|60(2.62L)
-O-O-O-O-S- 4x|25(2.05L)
O-O-O-O4X80(I.3IL)
O-O-O-O-S-4x|60(2.62L)
o-o-o-o-s-4xl60(2.62L)
O-O-O-S 3x|25(2.05L)
O-O-O-S 3x125(2.051)
O-O-S 2xlOO(l.64L)
O-O-S2xlOO(l.64L)
ACTIVE GUNS: 24x|60(2.62L) 20M25(2.05L) 8xlOO(l.64L) 8»80(I.3IL)
Total 7780 in3 (127.48L)
SPARE GUNS: 6x|60(2.62L) 6x|25(2.05L) 4»IOO(I.64L)
Total 2IIOin3 (34.58L)
ARRAY WIDTH : 80m STRING LENGTH: 9.9m
O-OPERATING GUN S- SPARE GUN
25
Figure 3: Bathymetric profiles associated with each GLIMPCE shot line. See text for a description of processing and smoothing of the digital data.
26

GLIMPCE 1986 BATHYMETRY PROFILES
200-
400 LINE A-REFRACTION700 600 500 400 300 200
200-
400 LINE A-REFLECTION3500 3000 2500 2000 1500 1000 500
200-
400
0
LINEB500 1000 1500 2000
200-
400
0
LINEC500 1000 1500
CLLJo
200-1
400
0
LINE F500 1000 1500 2000 2500
200-
400
0
LINES
500 101
200-
400LINE H
50 Km _i
4500 4000 3500 3000 2500 2000 1500 1000 500
200-
400
0
LINE I1500 1000 500
200-
400LINEJ
5000 4500 4000 3500 3000 2500 2000SHOTPOINT
1500 1000 500
27

Figure 4: Shot and station locations for line A-refraction. Symbols are the same as those used in Figure 1. Additional information is listed in Table 3.
28

50°N
LAKE SUPERIOR LINE A-REFRACTION
Polyconic Projection
29

Figure 5: Shot and station locations for line A-reflection. Symbols are the same as those used in Figure 1. Additional information is listed in Table 4.
30

50°N
+ B3 +s*s*r' JS^S**
LAKE SUPERIOR LINE A-RE FLECTION
*" 91° 90° 89°
Polyconic Projection
88° 87°
0 i
86° 85° 8-
IOOKM i
45°
31

Figure 6: Shot and station locations for line B. Symbols are the same as those used in Figure 1. Additional information is listed in Table 5.
32

50°N
49°
48°
LAKE SUPERIOR LINE B
47e
91° 90° 89
Polyconic Projection IOOKM
33

Figure 7: Shot and station locations for line C. Symbols are the same as those used in Figure 1. Additional information is listed in Table 6.
34

3NH dOld3dflS 3WI
NoOS

Figure 8: Shot and station locations for line F. Symbols are the same as those used in Figure 1. Additional information is listed in Table 7.
36

50°N
49*
48e
LAKE SUPERIOR LINE F
91° 90° 89
Polyconic Projection
86° 85°
IOOKM
37

Figure 9: Shot and station locations for line G. Symbols are the same as those used in Figure 1. Additional information is listed in Table 8.
38

50°N
LAKE SUPERIOR LINE G
92° <-n« ' ""'o90" 89°
Polyconic Projection
39

Figure 10: Shot and station locations for line H, Symbols are the same as those used in Figure 1. Additional information is listed in Table 9.
40

47°N
LAKE MICHIGAN LINE HJ_______I______l4|o87° 86° 85°W
0 IOOKM
89 <
Pdlyconic Projection
41

Figure 11: Shot and station locations for line I. Symbols are the same as those used in Figure 1. Additional information is listed in Table 10.
42

47°N
LAKE HURON LINE I
84° 83°
Polyconic Projection 0
80°
IOOKM
79°W
I________I
43

Figure 12: Shot and station locations for line J. Symbols are the same as those used in Figure 1. Additional information is listed in Table 11.
44

47°N
LAKE HURON LINE J
84° 83°
Polyconic Projection 0
80°
IOOKM
79°W
45

46

APPENDIX I
INSTRUMENT DETAILS AND PERSONNEL
This Appendix lists the people participating in the field effort and appropriate instrumental details and archive information not covered elsewhere in the report.
47

I. U.S. GEOLOGICAL SURVEY (USGS)
Anne M. Trehu: USGS, Principal Investigator G. Miller: USGSJ.F. Boyd: U.S. Coast Guard, Captain Crew of vessel U.S.C.G. Katmai Bay
Instrument: USGS Ocean Bottom SeismometerSample rate: 7.813 ms, reformatted to 8 ms.Record length: 32 sFrequency of recording: 2 minFilters: 0-30 HzField tape ID: GL86-A2,-A8,-C9,-C4,-C3Field tape format: TIP (USGS/OBS internal format)Archived at: U.S. Geological Survey
Data LibraryBranch of Atlantic Marine GeologyWoods Hole, MA 02543
Comment: - Instruments C3, C4, C9: no hydrophone data.- Instrument A8: recorded only far ranges.- Locations for A2, C3, C4, C9 calculated by water wave inversion
technique, as described below.- Location for A8 taken as the LORAN C position calculated by
ranging to the instruments from USCG Katmai Bay.- Horizontal components recorded for only a portion of the line
because of data storage limitations.
Note on Instrument locatons:
Instrument locations in field were determined by acoustically ranging to the OBS on the lake floor from 4-6 surface locatons and inverting the travel- times thus obtained (Creager and Dorman, 1982). Ranges calculated from these locations were not consistent with the positions of the closest shots plotted on the record sections, indicating that the navigation of the Coast Guard Ship (LORAN C) was incompatible with that of the shooting ship (Satellite and Doppler Sonar).
Instrument locatons for A2, C3, C4, and C9 were recalculated based on the locations of the shots provided by the shooting ship using water-wave inversion solutions, which invert the travel times of the water waves from the closest shots. Because the cross-over distance between the direct water-wave arrival and first refracted arrival occurred within 2-3 shots of the closest approach, locating the instruments with this technique required information on the near-surface sediment velocity in the vicinity of the instrument. This velocity was not well known; however, varying the assumed velocity should yield a solution for both instrument position and velocity that gives minimum travel-time variance. This was not done because of program limitations and the probable poor resolution of the final result. The simplified water-wave inversion solutions were in good agreement with the plotted intersections of allowable range circle drawn for the three closest shots based on direct water wave arrival times and an assumed velocity of 1.45 km/s. The water-wave inversion technique also calculates water depths (given in Table 3) which were essentially identical to those recorded on the ship's fathometer during OBS deployment.
48

Because the water-wave inversion technique utilizes the closest shots, none of which were recorded for instrument A-8, its location is based on inversion of travel-time ranging obtained on the Coast Guard ship
II. GEOLOGICAL SURVEY OF CANADA (GSC)
Patrick Morel-a-1'Huissier: GSC, Principal InvestigatorC.P. Spencer: GSCI. Asudeh: GSCW, Moon: University of ManitobaP. Burchat: GSCJ. Craven: GSCF. Larue: GSCH. Lau: GSCP. Shyre: GSCR. Stevens: GSCC, Samson: University of TorontoD, Epili: University of Western OntarioT. Shortt: University of Western Ontario
Instrument: PRS 1 digital recorderSample rate: 120 Hz (8 ms)Record length: 30, 40, 50 s, 3 minFrequency of recording: 2 min and continuousFilters: 0.5 - 60 HzField tapes: floppies and/or cassettes (transcribed to 9T)Field tape format: SEGY (9T)Archived at: P, Morel-a-1' Huissier
Lithosphere and Canadian Shield Division Geological Survey of Canada 1 Observatory Crescent Ottawa, Ontario KIAOY3
Comment: - SUP1, SUP7: data sets incomplete because of instrument malfunction
- SUPS: hole in middle of section because of instrument malfunction
- SUP2A: completes data that were not recorded by Univ, of Saskatchewan because of poor weather
- SUP7A: completes data not recorded for SUP7.- Locations and elevations from TOPO sheets
49

III. UNIVERSITY OF WISCONSIN - MADISON (UWM)
Robert P. Meyer: UWM, Principal InvestigatorH. Meyer: UWMR. Meyer: UWMV. Green: UWMS. Shih: UWMB. Unger: UWM
Instrument: UW Digital SeismographsSample rate: 10 msRecord length: variableFrequency of recording: variableFilters: 0.27 - 24 HzField tape 10: 275 field tapesField tape format: UW Digital Seismograph StandardArchived at: Dept. of Geology and Geophysics
University of Wisconsin1215 W. Dayton St.Madison, Wisconsin 53706
Comment: - Stations MCI, MC2, MC3, MC4, MC5 are 3 vertical geophones in a linear array: all others are 1 vertical, 2 horizontals (north and east).
- Locations and elevations from TOPO sheets
IV. UNIVERSITY OF WESTERN ONTARIO (UWO)
Robert F. Mereu: UWO, Principal InvestigatorT. Cox: UWOJ. Wu: UWOT. Shortt: UWOC. Faust: UWOD. Epili: UWOR. Secco: UWOB. Lenson: UWOC. Spindler: UWOJ. Brunet: UWOB. Dunn: UWOB. Price: UWO
Instrument: U. Western Ontario Portable FM recordersSample rate: 8 ms (125 Hz)Record length: 45 minFrequency of recording: continuousFilters: 0.1 - 35 HzField tapes: analog transcribed to digitalField tape format: SEGY (digital tapes)Archived at: R.F. Mereu
Department of Geophysics University of Western Ontario London, Ontario N6A 5B7
Comment: - Locations and elevations from TOPO sheets
50

V. NORTHERN ILLINOIS UNIVERSITY (NIU)
Patrick Ervin: NIU, Principal InvestigatorP. Carpenter: NIUG. Frantti: Michigan Tech.B. Morrow: NIUT. Salihoglu: NIUM. Thompson: NIUC.L. Ervin: NIUStudents from Michigan Tech University
Instrument: PDR-2 and MEQ-800Sample rate: 10 msRecord length: 6258 bytesFrequency of recording: continuousFilters: 0-50 HzField tapes: 20 tapes and paper recordsField tape format: Kinemetrics hi-density, Terra-Tec internal formatArchived at: Department of Geology
Northern Illinois UniversityDekalb, Illinois 60115
Comment: - Instrumental problems and large noise made data recovery onall instruments minimal
- Locations and elevations from TOPO sheets
VI. UNIVERSITY OF SASKATCHEWAN (U SASK.)
Zoltan Hajnal: U. Sask, Principal InvestigatorW. Chan: U. Sask.D. Wilkinson: U. Sask.M. Johnson: U. Sask.G. Wood: U. Sask.
Instrument: multichannel geophone arrayTotal groups: 48Group Interval: 67 mArray geometry: linear (N45°W-BB), (N30°E-AA)Recording Instrument: DFS VSample rate: 2 msRecord length: 20 s, 30 sFrequency of recording: 40 s, 2 min.Filters: 0-128 HzField tapes: 2 - 102 (9T, 1600 BPI)Field tape format: SEG BArchived at: Department of Geological Sciences
University of SaskatchewanSaskatoon, Saskatchewan S7N OWO
Comment: - Instrument failure 31 Aug: 1756 - 1916 and no recording because of storm after 1 Sept 0759
- Locations and elevations from TOPO sheets- Locations are given for the center of the array. Locations written in to the SEG-Y tape header are for the best trace of the array and are slightly different.
51

VII. SOUTHERN ILLINOIS UNIVERSITY (SIU)
John L. Sexton: SIU, Principal Investigator S. Wendling: SIU J. Bowden: SIU H. Henson: SIU
Instrument: multichannel geophone arrayTotal Groups: 24Group Interval: 25 ft.Array Geometry: linear (E/W)Recording Instrument: DFS VSample Rate: 2 msRecord Length: 60 s, 44 sFrequency of recording: continuousFilters: 0 - 64 HzField tapes: 186 (9T, 1600 BPI) tapesField tape format: SEG BArchived at: Department of Geology
Southern Illinois UniversityCarbondale, Illinois 62901
Comment: - Some 60 Hz problems on lines I, J- Locations and elevations from TOPO sheets
VIII. UNIVERSITY OF WISCONSIN - OSHKOSH (UWOSH)
John H. Karl: UWOSH, Principal InvestigatorT. Jefferson: UWOSHS. Bouc: UWOSHJ. Colletta: UWOSHD. Kowalkowski: UWOSHP. Meyer: UWOSH
Instrument: multichannel geophone arrayTotal Groups: 96Group Interval: 100 m, 50 mArray Geometry: L-shape, X-shapeRecording Instrument: DFS - IVSample Rate: 8 msRecord length: 295 s, 80sFrequency of recording: continuous, 2 minFilters: 0-31 HzField tapes: 87 (9T, 1600 BPI) tapesField tape format: SEGBArchived at: Department of Physics and Astronomy
University of Wisconsin, OshkoshOshkosh, Wisconsin 54901414-424-4432/4431
Comment: - Locations and elevations from TOPO sheets- Reel changes cause 10-minute gaps in recording, approximately
every hour- Instrument failure on Line A-reflection caused loss of E-W
arm of x-shaped array on 7 September, 0420-1400 GMT.
52
APPENDIX II:
NAVIGATION AND TIMING DETAILS FOR SHOT POINTS
This appendix consists of the final report submitted by the contractor on the navigation and shot instants. Note that the navigation for each shot point is taken to be the position of the satellite antenna, which was located 74 m in front of the center of the airgun array. These data are archived at USGS (Denver, CO, and Woods Hole, MA) and are available from National Geophysical Data Center, NOAA, Code E64, 325 Broadway, Boulder, CO, 80303 (telephone: 303-497-6338)
53

NAVIGATION REPORT
ON
SATELLITE AND TIMING CORRECTIONS FOR THE 1986 GREAT LAKES REFRACTION
AND REFLECTION SEISMIC SURVEY
FOR
THE GEODETIC SURVEY OF CANADA (SIC)AND
THE UNITED STATES GEOLOGICAL SURVEY
by
GEOPHOTO SERVICES, LTD CALGARY, ALBERTA
1987 12 07
55

CONTENTS PAGE
Introduct i on .......................... 1
L i st of Se i smi c L i nes ................ 2
Map of Survey Area ................... 3
Summary of Events During Survey ...... 4
Satellite Antenna Height Error ....... 6
Sketch of Hei ght Effects ............. 8
He i ght Correct i on D i agram ............ 9
Errors in the Timing System .......... 10
Recommendat i ons ...................... 12
56

INTRODUCTION
A marine geophysical survey was conducted for the Geodetic Survey of Canada in conjunction with the United States Geological Survey between 1986 08 29 and 1986 09 23 In the Great Lakes. The M/V Fred J.. Agnich shot two lines of refraction data and 1343 km of reflection data in Lake Superior, Lake Huron and Lake Michigan.
Geonav was used as the navigation system to shoot the entire Great Lakes prospect. The integrated navigation was a configuration of a Magnavox 1107 TRANSIT satellite receiver, doppler sonar and a gyrocompass. An Internav 400 LORAN C receiver was available with additional velocity and position information and a TI4100 GPS receiver was on board for most of the survey as backup and an additional QC system and for updates to the LORAN C.
For the purposes of the GLIMPCE experiment some special modifications were made to the M/V Agnich's control/navigation system (CMS). These include interfacing to a GOES satellite receiver/chronometer, interfacing to a modified CMS chronometer and modifying the system coordinator to allow predetermined delays to be set into the recording sequence.
The CMS was synchronized to WWV time through the GOES satellite receiver and the CMS chronometer. After the initial passing of time to the CMS chronometer and simultaneous CMS start and WWV synchronization, the chronometer supplied the CMS with a 100 ms interrupt by which the CMS kept time. If the CMS chronometer missed its interrupt from the WWV chronometer the two would be out of synchronization and a LED indicated the error unless the CMS was stopped and restarted.
During the course of the project several problems affected the data collection. One serious problem was unexplained large satellite updates occurring with otherwise good navigation data. After completion of the first line on 09 01 several days were spent investigating all aspects of the satellite system and on 09 05 it was discovered that the update problems were a result of loading an erroneous antenna height into the
57

CMS (neglecting to account for 183 metre difference of Lake Superior to sea level). Another problem affecting the data was the time as recorded on tape was not in synchronization with the WWV satellite time. This was due to some delays not being accounted for and interruptions in the system.
The errors introduced by the above incidents were corrected. This report gives an explanation of the corrections and how they were applied.
LIST OF SEISMIC LINES
Julian JulianLine Day_ JFSP. Day LSPAA- 243 109 244 748BB' 249 111 250 2063BFLINK 250 101 250 455FF' 250 457 251 1579F'F" 251 1580 251 2843A'A 252 101 253 2326A"A 253 2290 253 3944G'G 254 101 254 969CC' 255 156 255 771CC'A 255 741 256 18803 261 101 262 46361 263 102 264 18232A 265 101 266 5264
58

AREA OF SURVEY
59
SUMMARY OF EVENTS DURING SURVEY
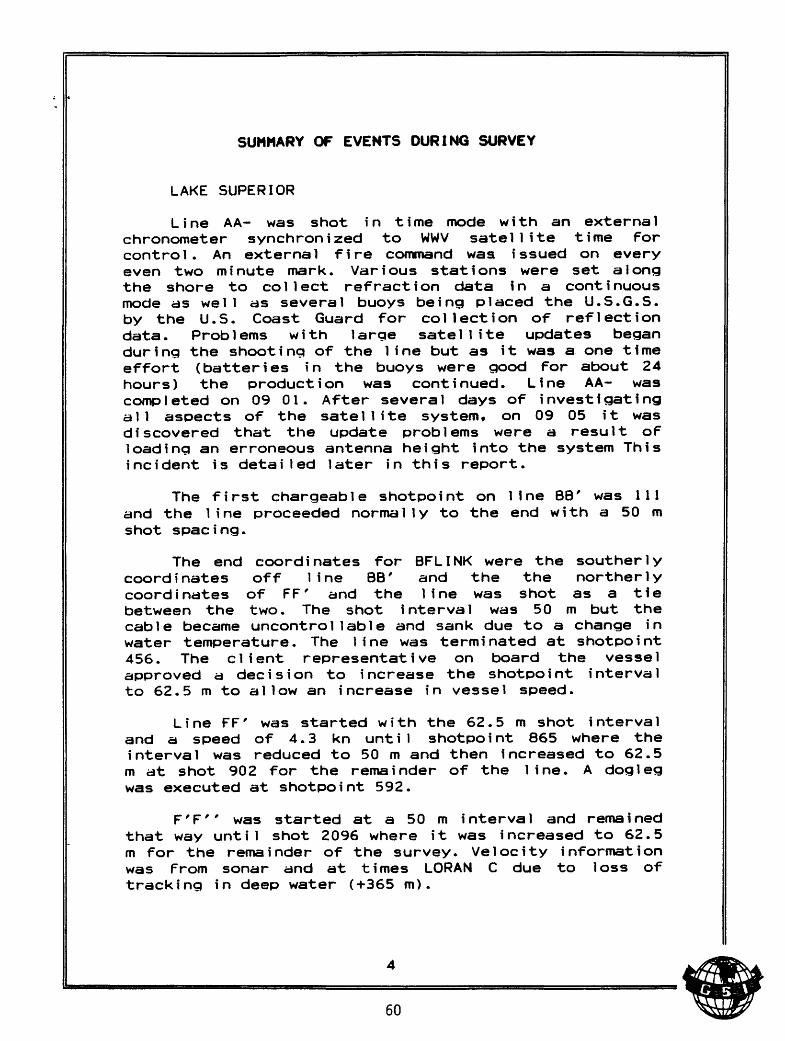
LAKE SUPERIOR
Line AA- was shot in time mode with an external chronometer synchronized to WWV satellite time for control. An external fire command was issued on every even two minute mark. Various stations were set along the shore to collect refraction data in a continuous mode as well as several buoys being placed the U.S.G.S. by the U.S. Coast Guard for collection of reflection data. Problems with large satellite updates began during the shooting of the line but as it was a one time effort (batteries in the buoys were good for about 24 hours) the production was continued. Line AA- was completed on 09 01. After several days of investigating all aspects of the satellite system, on 09 05 it was discovered that the update problems were a result of loading an erroneous antenna height into the system This incident is detailed later in this report.
The first chargeable shotpoint on line BB' was 111 and the line proceeded normally to the end with a 50 m shot spacing.
The end coordinates for BFLINK were the southerly coordinates off line BB' and the the northerly coordinates of FF' and the line was shot as a tie between the two. The shot interval was 50 m but the cable became uncontrollable and sank due to a change in water temperature. The line was terminated at shotpoint 456. The client representative on board the vessel approved a decision to increase the shotpoint interval to 62.5 m to allow an increase in vessel speed.
Line FF' was started with the 62.5 m shot interval and a speed of 4.3 kn until shotpoint 865 where the interval was reduced to 50 m and then increased to 62.5 m at shot 902 for the remainder of the line. A dogleg was executed at shotpoint 592.
F'F" was started at a 50 m interval and remained that way until shot 2096 where it was increased to 62.5 m for the remainder of the survey. Velocity information was from sonar and at times LORAN C due to loss of tracking in deep water (+365 m).
60C 5= V

The 980B NAV computer was halted temporarily to replace a circuit board before the beginning of Line A'A. The system was restarted before the first chargeable shotpoint. The synchronization between the CMS and WWV time were lost because of this and the CMS time had a 24.5 s offset (slow) that remained until the end of A"A.
On line A"A the sonar velocities gave some problems due to a rising and falling water bottom.
Before commencing Line G'G the CMS/GOES timing system was resynchronized.
On Line CC' the compasses in the streamer began spiking and were unusable due to a very strong magnetic anomaly in the area. By shotpoint 356 the anomaly was sufficiently far enough away for the Streamer Tracking System (STS) to accept the compass data and they remained settled for the remainder of the line. There were time loss problems at the end of this line due to a loose connector for the 100 KHz signal thus affecting the count-up for the CMS 0.1 s clock interrupt and causing it to lose time. It was terminated for this reason and restarted at the last known good time.
Line CC'A was started with the CMS synchronized to WWV but a 23.1 s shift occurred was discovered to have occurred sometime after shotpoint 970.
LAKE MICHIGAN
The CMS was reinitialized with the new antenna height to include the elevation of Lake Michigan (176.5 m above sea level). Line 3 had a dogleg initiated at shotpoint 3556.
LAKE HURON
The elevation of Lake Huron (& Georgian Bay) is the same as Lake Michigan so the antenna heights remained unchanged. Line 1 was shot South to North through Mississagi Strait in Lake Huron. The beginning of the line was shot at a slower speed to avoid a barge. It was no longer obstructing the path by shot 166. The line was terminated 3.8 km from the prep lotted E.O.L. due to impending shallow water endangering the streamer.
61

Line 2A was shot from East to West from Georgian Bay into Lake Huron through the Main Channel via a series of dogleg segments. Deviations of up to 485 m to the north of the intended line had to be initiated through the channel to avoid rocks, ferry boats and shallow water. The doglegs were executed at shotpoints 1841, 2033 and 2487. At the second dogleg the vessel was steered off line to starboard to avoid a shallow water area. They were back on line at shot 2281 and performed another dogleg at shot 2487. The line terminated normally.
SATELLITE ANTENNA HEIGHT ERROR
It was discovered after completion of line AA- that the update problems were due to the wrong satellite antenna elevation being input into the CMS. Lake Superior is 183 m above mean sea level which was not originally accounted for during system initialization. The errors introduced by this omission are predictable and were corrected in post processing. The magnitude of shift introduced by the error in height initialization ranged from 42 to 392 m with the greatest movement in a longitudinal direction. The table below summarizes the corrections computed. Figure 2 gives a graphical representation of the situation and Figure 3 shows the magnitudes of the displacement (corrections) versus the satellite elevation angles.
62

The following is a list of the corrections applied to the individual satellite fixes on line AA- in the post processing:
FIX#
15
16
17
18
19
20
21
22
23
24
25
26
27
28
29
Elev.
25
65
13
54
1 1
41
13
55
27
26
26
57
54
56
20
Az.
85.2
272.6
95.7
285.6
89.7
259.9
101 .4
91 .7
265.7
75.4
75.4
238.4
87.5
281 .2
73.5
CORR(M)
85.3
392.5
42.2
251.9
33.0
158.2
42.2
261.4
93.2
89.2
89.2
281.7
251 .9
271 .3
66.6
dN(M)
85.0
-392. 1
42.0
-242.4
35.6
-156.6
41.4
261.2
- 93.0
86.4
86.4
-240.0
251.7
-266. I
63.8
dE(M)
6.7
17.8
- 4.2
67.7
0.2
- 27.9
- 8.3
- 7.8
- 7.0
22.5
22.5
-147.7
1 1.0
52.7
18.9
Subsequent lines were shot with the proper antenna he i ght app1i ed.
63

ELEV
Satell ite
Lake Superior
tdEL
Sea Level
CORR= TAN (ELEV) dEL
dN=COS(AZ) CORR
= SIN(AZ) -CORR
The elevation (ELEV) of the satellite is the vertical angle from the horizon to the satellite and should be between 12 and 75 degrees to be acceptable.
The azimuth (AZ) of the. satellite is from the vessel with respect to north.
its direction
The correction (CORR) metres that the particular
is the absolute distance fix must be adjusted by.
in
The correction in Northing (dN) and Easting (dE) is the computed value in metres to be added to the coordinates to compensate for the error in antenna height.
FIGURE 2
8
64

a. a o g S 4
DO
PP
LE
R
SA
TE
LL
ITE
H
EIG
HT
C
OR
RE
CT
ION
SFO
R L
AKE
SUFK
BIO
B <
163
M A
BO
VE
MSL
)700
£0
0
-
500
-
40
0 -
30
0
-
200
-
100
-
0 - 10
30 SA
TE
LL
ITE
EL
EVA
TIO
N (
DE
GR
EE
S)

ERRORS IN THE TIMING SYSTEM
A variety of different timing delays affected the the data collected for the prospect.
The firing sequence for all lines except the first (AA-) was accomplished with the DPS V in distance mode. The CMS issued the firing command to start the sequence. Additional circuitry to delay the start by 200 ms was added to avoid CMS shot-to-shot jitter of the start pulse (1 - 20 ms) . A delay off 0.65536 swas present to allow the DPS tape transports to ramp up to speed and write the header data. A wire blast was issued to the TIGER II which issued a time break (1.4 ms delay). There was a 51.2 ms delay from the issue of the field time break to the firing of the guns. There was a further 1.31072 second delay at the first shot after each DPS tape change due to the DPS taking longer writing Its ID burst to tape and detection of the wire blast missing the first normal "window" latch and catching the next rising clock cycle.
Line AA- was shot for refraction data in a time fired mode. The DPS V was fired on a two minute interval controlled by the time from the WWV satellite. To accomplish this additional circuitry was installed in the chronometer to synchronize it with the WWV clock to within 1 ms. The interval was set to fire on even two minute marks with the external start issued from this clock circuitry to the system coordinator which passed it to the CMS and immediately issued a start. All of the above mentioned delays were also present during this mode of shooting except that an additional 1 s delay was introduced into the time as recorded on the CMS (ex: 5m 59 s would be recorded on tape for a shot at 6 m 00 s) since it used presently latched time to store on tape (gets updated 50 - 150 ms later).
The navigation data were processed without due regard for the original field time and in cases of missed shotpoints and deletions of data anomalies the time was interpolated. Under reflection seismic processing circumstances this would not cause any problems but in the case of the refraction lines it is not acceptable. The time as recorded in the field was stripped from the CMS data and used for the final data.
10
"eeT

The final navigation data with original CMS times were corrected to remove the effects of the delays and time offsets.
The following is a summary of the various system delay corrections (all are positive values) used for the final post processed Navigation Tape:
Distance & External Mode ....
delay from fire issue to DPS receiving start 0.20000 s start issue to wire blast to TIGER 0.65536 s wire blast at TIGER to field time break 0.00140 s internal gun delay 0.05120 s
TOTAL 0.90796 s
Total Delay in Distance Mode:
Total of the above delays 0.90796 s First shot at every BOT 2.21868 s
Total delay in External Mode:
Total of the above delays 0.90796 sExternal Mode delay L-_QO_000 s
1.90796 s
1 1
67

RECOMMENDATIONS
On any future jobs of this nature it is recommended that the time from the reference source (WWV satellite receiver in this project) be input from a parallel output into a display with an accuracy of milliseconds. In addition to this a similar output from the CMS clock should be sent to the same display and the time difference computed and displayed as well. These times should be recorded for every shotpoint (to 5 significant digits) in a spare or unused position on the CMS tape. An alarm associated with the display should be in place so that a defined limit could be set and any differences outside the chosen range would be flagged and the alarm tripped. A hardcopy of al1 times and differences should be recorded in the ADL printer output.
In addition to displaying both CMS start time and WWV clock time we should also log the true firing time of the airguns by using the sum shuttle pulse to load the clock time. This could be output to the line printer and stored to tape at the next (SP 4-1) shotpoint. We would always have to shoot 1 extra shot at the end of the line but this would be easy to do with existing CMS software. Every shot would have a three-way check (time) with all delays being known. This would also show any wire-blast to time break jitter which exists in the present TIGER II software if the TIGER II is not synchronized to a 1 millisecond interrupt.
As well as the proper recording and QC display of the timing there should be the opportunity to make corrections to the CMS recorded time for the known delays including those due to BOT headers at DPS tape changes so that the WWV and CMS time difference is zero. The proper time to be recorded on tape is the correct one (no changes or corrections in post processing). If an offset does occur due to a system idle or a loose connection and can't be corrected immediately, then the corrections will have to be made during the post process ing.
12
~~68~

Respectfully submitted by Geophoto Services, Ltd.
"Andrew Brebner, P.Eng Navigation Dept. Manager
D i str i but i on:
Dr. Alan Green 8 Copies G.S.C. Ottawa, Ont.
Geophoto Ca1gary, A1 ta Geophoto Calgary, Alta,
John C1i nkMatt K i rnba 1 1 VJCWM* \\j\~\j v_.a ^ai / , ^ . «.* Dave Ridyard G.S.I. Houston, Tex John Rollans G.S.I. Dallas, Tax. Jim Spackman G.S.I. Dallas,
13
< &69

APPENDIX III:
RANGE ALGORITHM
The attached listing gives the FORTRAN code for the algorithm used by all participants in calculating ranges from the shots to the instruments.
71

SUBROUTINE GEODIST (SLAT,SLON,ELAT,ELON,D,AZ1,AZ2) C
IMPLICIT REAL*8 (a-h,o-z) CC uses geodetic inverse formula (geodesy by A.R. Clarke) C SLAT, SLON - station latitude and longitude in radians C ELAT, ELON - shot latitude and longitude in radians C D - distance in kilometersC AZ1 - azimuth of station from the shot in radians C AZ2 - azimuth of the shot from the station in radians C
DIMENSION C(4)ABLE = 6378.2064dOBAKE = 6356.5838dOEASY = 0.006768658dORAT = BAKE*BAKE/(ABLE*ABLE)CSLAT = COS(SLAT)SSLAT = SIN (SLAT)CELAT = COS (ELAT)SELAT = SIN (ELAT)CD = COS (SLON - ELON)SD = SIN (SLON - ELON)ENS = ABLE/SORT (l.dO-EASY*SSLAT*SSLAT)ENE = ABLE/SORT (l.dO-EASY*SELAT*SELAT)ENE = ENE/ENSA = -CSLAT*SDB = RAT*CELAT*SSLAT-CSLAT*SELAT*CD+EASY*CELAT*SELAT*ENEAZ1 = ATANG(A,B)A = CELAT*SDB = RAT*CSLAT*SELAT-CELAT*SSLAT*CD+EASY*CSLAT*SSLAT/ENEAZ2 = ATANG (A,B)FKON = CELAT*CD*ENE-CSLATA = CELAT*SD*ENEB = SELAT*ENE-SSLATB = B*RATFKON = FKON*FKON+A*A+B*BFKON - SORT (FKON)B = SORT (EASY/(1.-EASY))A = B*SSLATB = B*CSLAT*COS (AZ2)BEFF = l.dO+B*BFKOR = FKON*BEFFBEFF = l.dO/BEFFBACH = (A*A-B*B)*BEFFBEFF = A*B*BEFFC(l) = -0.1875dO*BEFF*BACH-0.3333333333dO*BEFF*BEFF*BEFFC(2) = 0.0046875dO+.0375dO*BACH+0.25dO*BEFF*BEFFC(3) = -0.125dO*BEFFC(4) = 0.04166666667dOD = C(l)DO 1 K = 2,4D = D*FKOR+C(K)
1 CONTINUED = D*FKOR*FKOR+1D = FKON*ENS*DRETURNEND
C************************************************************************FUNCTION ATANG(A,B)
CIMPLICIT REAL*8 (A-H,0-Z)
CC Computes ATAN(A/B) for all values of A and B from 0 to 2*PI C
IF (B) 1,3,5
72

I ATANG = ATAN (A/B) + 3.14159265dORETURN
3 IF (A) 7,9,11 7 ATANG=4.71238897dO
RETURN 9 ATANG = 0.
RETURNII ATANG = +1.57079632dO
RETURN5 IF (A) 13,15,15 13 ATANG = ATAN (A/B) + 6.2831853dO
RETURN 15 ATANG = ATAN (A/B)
RETURNEND
73

APPENDIX IV:
SEG-Y(LDS) EXCHANGE FORMAT
This appendix lists the FORTRAN code used for the exchange of all refraction and wide-angle data. This code is a series of FORTRAN EQUIVALENCE statements which define file and trace header information for programs used to read the data. This code was developed by C. Spencer and I. Asudeh at GSC for use with Lithoprobe refraction data.
The exchange format, called SEG-Y(LDS) (SEG: Society of Exploration Geophysicists; LDS: Lithoprobe data storage), is a superset of SEG-Y format. Whereas SEG-Y provides an industry standard for the exchange of seismic- reflection data (Barry et al., 1975), SEG-Y(LDS) provides a suitable format for the storage and exchange of seismic refraction data. Any existing SEG-Y program is capable of reading the data. However, SEG-Y(LDS) goes beyond SEG-Y in three ways: (1) it utilizes unused portions of SEG-Y headers for informaton unique to refraction data; (2) it extends the definition to organization within a disk file; and (3) it allows (but does not require) that data be stored with word formats other than the IBM real and integer formats defined in the industry standard.
Header definition; SEG-Y(LDS) maintains the two part file organization of standard SEG-Y in which a file header (3600 bytes long) is followed by seismic trace data blocks, each containing a 240-byte trace header. The last 340 bytes of the file header and the last 60 bytes of the trace header, which were undefined in original SEG-Y standard, are used in SEG-Y(LDS) for information relative to refraction data, such as shot times. The main additions are allowing storage of (1) flexible shot, receiver and line names, (2) more shot and receiver information, (3) more data word formats, and (4) different seismic sttributes. Comments within the code clearly indicate which items are unique to SEG-Y(LDS).
Disk storage; SEG-Y(LDS) has been adapted to disk storage primarily by GSC. The SEG-Y file contains a number of traces, each trace containing a number of data samples. File organizaton, as on tapes, consists of a single line header followed by data blocks containing trace headers. The file is a series of bytes with no logical record structure, and the bytes are defined as for tapes. A file structure without logical record structure allows easy access by most machines (all files must have a machine dependent physical record length, but on most machines this can be transparent to the user). For instance, on the PC, the bytes may easily be read in the C-language. Using the IBM PROFORT compiler the file must be opened for direct access with a chosen record length, then data must be read into a buffer in chunks with that record length. Because most sophisticated processing needs direct access to a particular trace, it is convenient to pad out all traces to the same length (and a minimum of 3600 bytes). When this is done easy direct access to bytes from FORTRAN is possible. Other institutions and users of other languages may ignore this restriction.
Data word formats; SEG-Y defines four data word formats. The actual format used is indicated by the contents of bytes 25-26 in the line header. For SEG-Y(LDS) we have chosen a fifth format to be the gain-ranged LUNCHBOX format utilized by GSC, and a sixth format to be VAX FORTRAN R*4. Note that SEG-Y defines the byte organization within a 2-byte integer on a tape. This is opposite to that on the VAX and the P.C. Yet to be decided is which would
75

be the most sensible ordering on disk. Currently, GSC is using the natural way for the VAX and PC, i.e., least significant byte is the first in a two byte integer.
76

cc LDS INCLUDE FILE VERSION 1.0cc this file is an implicit definition of SEGY format with additionsc for refraction work. It is the SEGY standard of Barry et alc Geophysics (1975) with extensions labelled LDS USE for refractionc work. When used as an INCLUDE file for a FORTRAN programme, allc vaiables will be set after reading arrays SEGY1A, SEGY1B, and SEGYDBcc Character code is EBCDIC unless using IEEE (see variable 'icode')cc modifications c Carl Spencer and Isa Asudeh 4/2/86 original specification
c Isa Asudeh , may 31, 1986c Carl Spencer 3/9/86c update:ccc Isa Asudehc Claire Smith;c Carl Spencer
July 15, 1986 July 26, 1986 oct 16, 1986 nov 16, 1986 feb 16, nov 19
19871987 FINAL VERSION marked with CPSNOV87
*****
, Parameter definitions -
integer*4 maxlen,maxsam
maxlen maximum data file size in bytes (including a 240 bytes header)
parameter (maxlen = 131068) c maxsam maximum number of samples parameter (maxsam = 32767)
c SEGY REEL IDENTIFICATION HEADER PART 1character*! segyla(3200)
c SEGY REEL IDENTIFICATION HEADER PART 2character*! segylb(400)
c SEGY TRACE DATA BLOCK - System dependent maximum record size character*! segydb dimension segydb(MAXLEN)
cequivalence(segydb(1),thead(1))
c c c DATA WORDS
integer*2 idata(maxsam) real*4 rdata(maxsam) equivalence(segydb(241),idata(l),rdata(l))
77

c SEGY VARIABLEScc -
c Binary area of file (or Reel) Identification Header Starts here
SEGY STANDARDc Job Identification numberinteger*4 jobidequivalence (segylb(l),jobid)
c Line Numberinteger*4 linenoequivalence (segylb(5),lineno)
c reel Numberinteger*4 reelnoequivalence (segylb(9),reelno)
c c Number of data traces per record
integer*2 ntraceequivalence (segylb(13),ntrace)
cc Number of auxilliary traces per record c
integer*2 nauxtequivalence (segylb(15),nauxt)
c c Sample interval in microseconds - this data
integer*2 sintequivalence (segylb(17),sint)
cc Sample interval in microseconds (in field) c
integer*2 sint2equivalence (segylb(19),sint2)
c c No of samples per trace this data
integer*2 nsamequivalence (segylb(21),nsam)
cinteger*2 nsamfequivalence (segylb(23),nsamf)
c NO of samples per trace in the field
c Data sample format code SEGY STANDARDc the ordering of bytes within this field indicates whether datac is stored in SEGY standard or IEEE standard. SEGY has mostsignificantc byte first, IEEE (as on PC, or VAX) has least significant byte first
SEGY STANDARD
SEGY STANDARD
SEGY STANDARD
SEGY STANDARD
SEGY STANDARD
SEGY STANDARD
SEGY STANDARD
78

icode=0001 icode=0002 icode=0003 icode=0004
icode=0100
FLOATING POINT FIXED POINT (4 bytes) FIXED POINT (2 bytes) FIXED POINT WITH GAIN
FLOATING POINT - IEEE
SEGY STANDARD SEGY STANDARD SEGY STANDARD SEGY STANDARD
VERITASSTANDARD
icode=0200 icode=0300
FIXED FIXED
POINT (4 POINT (2
bytes) bytes)
IEEE IEEE
icode=0500 LUNCHBOX FORMAT LDS USE *** icode=0600 VAX R*4 FORMAT LDS USE ***
Note that the swapped bytes of codes 0100 - 0600 will indicate that all other header and data words also have their bytes swapped. In this case, character information is ASCII.
integer*2 icodeequivalence (segylb(25),icode)
No of traces per CDP ensemble
integer*2 ncdpequivalence (segylb(27),ncdp)
Trace sorting codeitsort=l as recordeditsort=2 CDP ensembleitsort=3 Single fold continuousitsort=4 Horizontal stack
integer*2 itsortequivalence (segylb(29),itsort)
Vertical sum codevcode=n sum on n traces
integer*2 vcode equivalence (segylb(31),vcode)
Start sweep frequency (HZ)
integer*2 ssweepequivalence (segylb(33),ssweep)
End sweep frequency (HZ)
integer*2 esweep equivalence (segylb(35),esweep)
Sweep Length in milliseconds
CPSNOV87integer*2 sleng
SEGY STANDARD
SEGY STANDARD SEGY STANDARD SEGY STANDARD SEGY STANDARD SEGY STANDARD NO LDS USE
SEGY STANDARD SEGY STANDARD
SEGY STANDARD
SEGY STANDARD
SEGY STANDARD
79

equivalence (segylb(37),sleng)
SWEEP TYPE stype-l stype=2 stype=3 stype=4 stype=5 stype=6 stype=7 integer*2
LINEAR PARABOLIC EXPONENTIAL OTHERBOREHOLE SOURCE WATER EXPLOSIVE SOURCE AIRGUN SOURCE
stypeequivalence (segylb(39),stype)
Trace no of sweep channel
integer*2 equivalence
nts(segylb(41),nts)
Sweep trace taper in milliseconds at start
integer*2 equivalence
stts(segylb(43),stts)
Sweep trace taper length in milliseconds at end
integer*2 stteequivalence (segylb(45),stte)
Taper typettype=l LINEAR ttype=2 COS**2 ttype=3 OTHER
integer*2 ttypeequivalence (segylb(47),ttype)
Correlated data traces cort=l no 2 yes
integer*2 cort equivalence (segylb(49),cort)
Binary Gain recovered arm=l yes 2 no
integer*2 bgr equivalence (segylb(51),bgr)
Amplitude recovery methodsarm=l none 2 spherical 3 AGC 4 OTHER
SEGY STANDARD SEGY STANDARD SEGY STANDARD SEGY STANDARD SEGY STANDARD LDS USE LDS USE LDS USE
SEGY STANDARD
SEGY STANDARD
SEGY STANDARD
SEGY STANDARD SEGY STANDARD SEGY STANDARD SEGY STANDARD
SEGY STANDARD
SEGY STANDARD
SEGY STANDARD
integer*2 equivalence
arm(segylb(53),arm)
80.

cc Measurement system SEGY STANDARDc l=meters 2=feet SEGY STANDARD
integer*2 isysequivalence (segylb(55),isys)
cc Polarity SEGY STANDARD c ipol=l upward case movement gives negative number SEGY STANDARD c ipol=2 upward case movement gives positive number SEGY STANDARD
integer*2 ipolequivalence (segylb(57),ipol)
cc Vibrator polarity code SEGY STANDARD c
integer*2 vpcequivalence (segylb(59),vpc)
cc number of traces in the file SEGY UNASSIGNED c used for disk files LDS USE ****
integer*2 notifequivalence (segylb(61),notif)
CCPSNOV87c attribute informationc attri=0 velocity/displacement data c attri=l instantaneous amplitude c attri=2 instantaneous frequency c attri=3 instantaneous phase c attri=4 slowness (m/ms) c attri=5 semblance (0-1000)
integer*2 attri equivalence (segylb(63),attri)
c LDS USE *** cc mean amplitude of all samples in all traces in the file, c used for disk files CCPSNOV87 c SEGY UNASSIGNED
real*4 meanasequivalence (segylb(65),meanas)
c domain of data LDS USE c domain=0 time/distance c =1 fk c =2 tau-p
integer*2 domain equivalence (segylb(69),domain)
cc 71,72 unused to allign four byte boundaries, c reduction velocity meters/second if data is reduced CCPSNOV87 integer*4 vred equivalence (segylb(73),vred)
81

CCPSNOV87c minimum of all samples in the file.
real*4 minassequivalence (minass,segylb(77))
CCPSNOV87 c maximum of all traces in the file
real*4 maxassequivalence (maxass,segylb(81))
c cc n.b. bytes 85-400 of File Id. Header are not used, cC ___________________________
c Binary area of file (or Reel) Identification Header Ends here
c Trace Identification Header (total of 240 bytes) starts here
cc Trace sequence number within line SEGY STANDARD
integer*4 tsnlequivalence (thead(1),tsnl)
cc Trace sequence number within tape SEGY STANDARD c
integer*4 tsntequivalence (thead(5),tsnt)
cc Original field record number SEGY STANDARD c for LDS this will be sequential shot number LDS USE c
integer*4 ofrnequivalence (thead(9),ofrn)
c c Trace number withint original field record SEGY STANDARD
integer*4 tnofrequivalence (thead(13),tnofr)
cc ENERGY source point number SEGY STANDARD c
integer*4 espnequivalence (thead(17),espn)
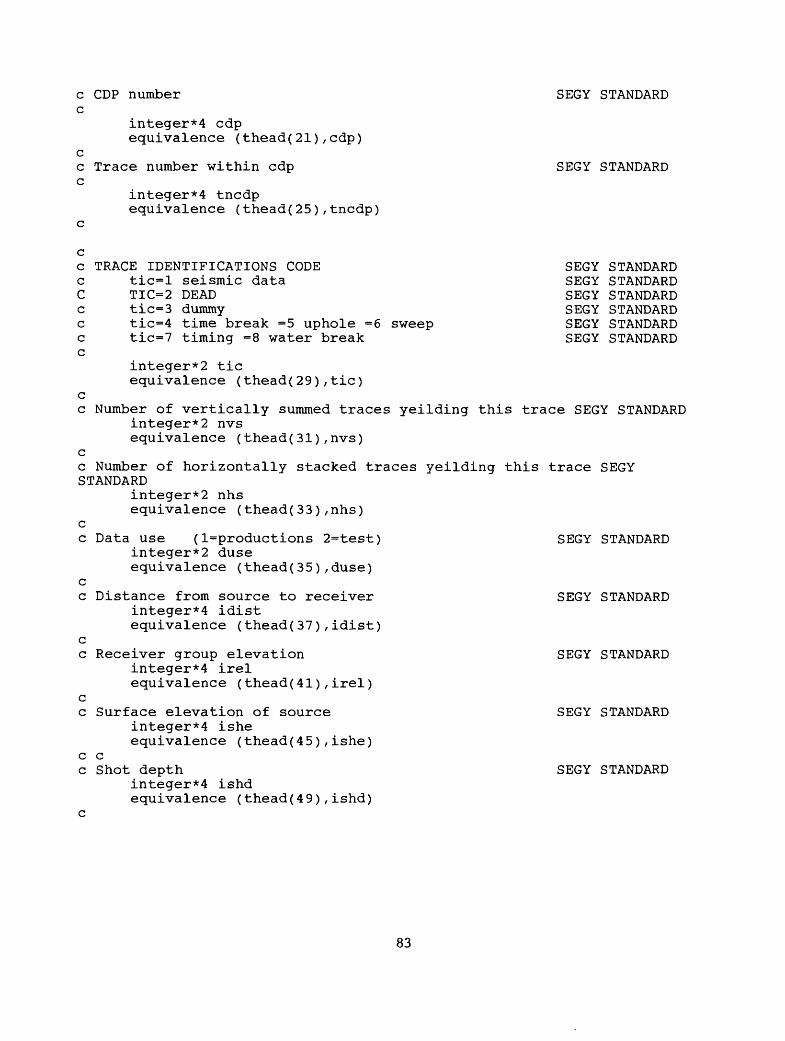
c CDP number SEGY STANDARD c
integer*4 cdpequivalence (thead(21),cdp)
cc Trace number within cdp SEGY STANDARD c
integer*4 tncdpequivalence (thead(25),tncdp)
c
cc TRACE IDENTIFICATIONS CODE SEGY STANDARD c tic=l seismic data SEGY STANDARD C TIC=2 DEAD SEGY STANDARD c tic=3 dummy SEGY STANDARD c tic=4 time break =5 uphole =6 sweep SEGY STANDARD c tic=7 timing =8 water break SEGY STANDARD c
integer*2 ticequivalence (thead(29),tic)
c c Number of vertically summed traces yeilding this trace SEGY STANDARD
integer*2 nvsequivalence (thead(31),nvs)
cc Number of horizontally stacked traces yeilding this trace SEGY STANDARD
integer*2 nhsequivalence (thead(33),nhs)
c c Data use (l=productions 2=test) SEGY STANDARD
integer*2 duseequivalence (thead(35),duse)
c c Distance from source to receiver SEGY STANDARD
integer*4 idistequivalence (thead(37),idist)
c c Receiver group elevation SEGY STANDARD
integer*4 irelequivalence (thead(41),irel)
c c Surface elevation of source SEGY STANDARD
integer*4 isheequivalence (thead(45),ishe)
c c c Shot depth SEGY STANDARD
integer*4 ishdequivalence (thead(49),ishd)
c
83
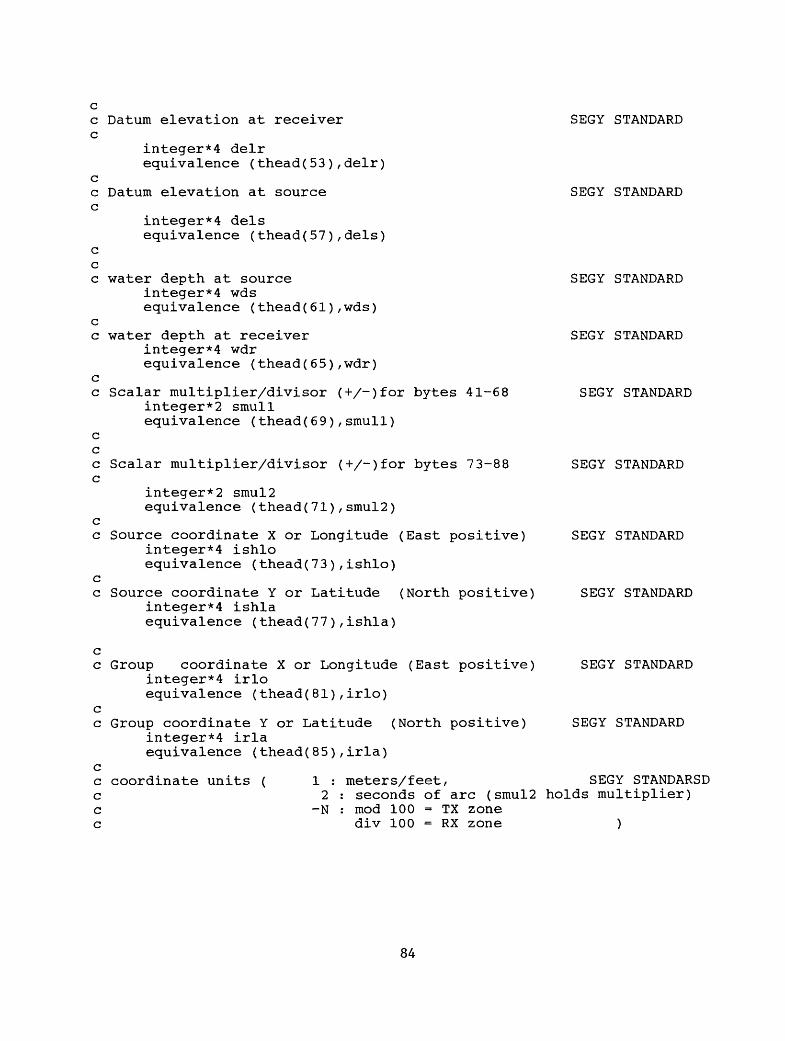
Datum elevation at receiver
integer*4 delrequivalence (thead(53),delr)
Datum elevation at source
integer*4 delsequivalence (thead(57),dels)
water depth at source integer*4 wds equivalence (thead(61),wds)
water depth at receiver integer*4 wdr equivalence (thead(65),wdr)
Scalar multiplier/divisor (+/-)for bytes 41-68 integer*2 smull equivalence (thead(69),smull)
Scalar multiplier/divisor (+/-)for bytes 73-88
integer*2 smu!2equivalence (thead(71),smu!2)
Source coordinate X or Longitude (East positive) integer*4 ishlo equivalence (thead(73),ishlo)
Source coordinate Y or Latitude (North positive) integer*4 ishla equivalence (thead(77),ishla)
SEGY STANDARD
SEGY STANDARD
SEGY STANDARD
SEGY STANDARD
SEGY STANDARD
SEGY STANDARD
SEGY STANDARD
SEGY STANDARD
Group coordinate X or Longitude (East positive) integer*4 irlo equivalence (thead(81),irlo)
Group coordinate Y or Latitude (North positive) integer*4 irla equivalence (thead(85),irla)
coordinate units ( 1 : meters/feet,2 : seconds of arc (smu!2
-N : mod 100 = TX zone div 100 = RX zone
SEGY STANDARD
SEGY STANDARD
SEGY STANDARSD holds multiplier)
84

integer*2 cunitsequivalence (thead(89),cunits)
cc Weathering velocity (m/s?) SEGY STANDARD
integer*2 wvelequivalence (thead(91),wvel)
c cc SUBWeathering velocity (m/s?) SEGY STANDARD
integer*2 swvelequivalence (thead(93),swvel)
cc Uphole time at source SEGY STANDARD
integer*2 utimesequivalence (thead(95),utimes)
c Uphole time at group SEGY STANDARD
integer*2 utimegequivalence (thead(97),utimeg)
c Source static correction (ms?) SEGY STANDARD
integer*2 sstatiequivalence (thead(99),sstati)
c Group static SEGY STANDARD
integer*2 gstatiequivalence (thead(101),gstati)
cc Total static SEGY STANDARD
integer*2 tstatiequivalence (thead(103),tstati)
cc Lag time A SEGY STANDARD cc LDS USE definition:c Time in millisec between end of 240 byte trace Identification Header andc time bread (time zero). Positive if time break occurs after end of header,c negative if time break occurs before end of header, c This value is the negative of the start time of the trace, c i.e. if the trace ranges from -50 to + 75 millisec then this entry willc be +50. c
integer*2 istime
85

equivalence (thead(105),istime) c cc Lag time B SEGY STANDARD c
integer*2 ibtimeequivalence (thead(107),ibtime)
cc Delay recording time SEGY STANDARD
integer*2 ictimeequivalence (thead(109),ictime)
cc Mute time start SEGY STANDARD c
integer*2 mtimesequivalence (thead(111),mtimes)
cc Mute time end SEGY STANDARD c
integer*2 mtimeeequivalence (thead(113),mtimee)
c cc No of samples in this trace SEGY STANDARDc VISTA USE ***
integer*2 lengthequivalence (thead(115),length)
cc Sample interval in microseconds SEGY STANDARD c
integer*2 isiequivalence (thead(117),isi)
cc Gain type (l=fixed 2=binary 3 floating) SEGY STANDARD c
integer*2 gaintequivalence (thead(119),gaint)
cc Gain constant SEGY STANDARD c
integer*2 gcequivalence (thead(121),gc)
86

c Instrument or initial gain in dBSTANDARDc
integer*2 gidbequivalence (thead(123),gidb)
cc Correlated l=no 2=yes STANDARD c
integer*2 tcorrequivalence (thead(125),tcorr)
SEGY
Start sweep frequency (HZ)
integer*2 tssweeequivalence (thead(127),tsswee)
End sweep frequency (HZ)
integer*2 teswee equivalence (thead(129) , teswee)
Sweep Length in milliseconds
integer*2 tslengequivalence (thead(131) , tsleng)
SWEEP TYPEstype=l LINEARstype=2 PARABOLICstype=3 EXPONENTIALstype=4 OTHERstype=5 BOREHOLE SOURCEStype=6 WATER EXPLOSIVE SOURCEstype=7 AIRGUN SOURCEinteger*2 tstypeequivalence (thead(133),tstype)
Sweep trace taper in milliseconds at start
integer*2 tsttsequivalence (thead(135) , tstts)
Sweep trace taper length in milliseconds at end
integer*2 tstteequivalence (thead(137),tstte)
Taper typettype=l LINEAR
SEGY
SEGY STANDARD
SEGY STANDARD
SEGY STANDARD
SEGY STANDARD SEGY STANDARD SEGY STANDARD SEGY STANDARD SEGY STANDARD LDS USE LDS USE LDS USE
SEGY STANDARD
SEGY STANDARD
SEGY STANDARD SEGY STANDARD
87

c ttype=2 COS**2 c ttype=3 OTHER c
integer*2 tttypeequivalence (thead(139),tttype)
c Anti alias filter frequencyinteger*2 aifequivalence (thead(141),aif)
c c Alias filter slope
integer*2 aisequivalence (thead(143),ais)
c Notch filter frequencyinteger*2 nifequivalence (thead(145),nif)
c c Notch filter slope
integer*2 nisequivalence (thead(147),nis)
c c Low cut frequncy
integer*2 flcequivalence (thead(149),flc)
cc High cut frequncy STANDARD
integer*2 equivalence
c Low cut slope STANDARD
integer*2
fhc(thead(151),fhc)
sicequivalence (thead(153),sic)
she(thead(155),shc)
c High cut slope STANDARD
integer*2equivalence
cc Year of start of trace STANDARD
integer*2 tyearequivalence (thead(157),tyear)
c c day of start of trace
integer*2 tdayequivalence (thead(159),tday)
cc Hour of start of trace STANDARD
SEGY STANDARD
SEGY STANDARD
SEGY STANDARD
SEGY STANDARD
SEGY STANDARD
SEGY STANDARD
SEGY
SEGY
SEGY
SEGY
SEGY STANDARD
SEGY
88

integer*2 thourequivalence (thead(161),thour)
cc Minute of start of trace SEGY STANDARD
integer*2 tminequivalence (thead(163),tmin)
c cc second of start of trace SEGY STANDARD
integer*2 tsecequivalence (thead(165),tsec)
c Time basis code l=local 2=gmt SEGY STANDARD
integer*2 tbcodeequivalence (thead(167),tbcode)
cc Trace weighting factor SEGY STANDARD c
integer*2 twfequivalence (thead(169),twf)
cc Geophone group no on roll switch first position SEGY STANDARD c
integer*2 ggrplequivalence (thead(171),ggrpl)
cc Geophone group no trace position 1 on field rec SEGY STANDARD c
integer*2 ggtpequivalence (thead(173),ggtp)
cc Geophone group no on last trace of filed rec SEGY STANDARD c
integer*2 gglpequivalence (thead(175),gglp)
cc Gap size SEGY STANDARD c
integer*2 gapszequivalence (thead(177),gapsz)
cc Overtravel l=down 2=behind SEGY STANDARD c
89

integer*2 overtequivalence (thead(179),overt)
c c c microseconds of trace start time LDS USE
integer*4 mstequivalence (thead(181),mst)
cc millisecond of timing correction LDS USE c to be added to reported times to get local or gmt times
integer*2 corequivalence (thead(185),cor)
c c charge size in kg LDS USE
integer*2 chargeequivalence (thead (187),charge)
c c shot time - year
integer*2 syearequivalence (thead(189),syear)
c LDS USE c c shot time - day
integer*2 sdayequivalence (thead(191),sday)
c LDS USE c c shot time - hour LDS USE
integer*2 shourequivalence (thead(193),shour)
c shot time - minute LDS USEinteger*2 sminequivalence (thead(195),smin)
c shot time - second LDS USEinteger*2 ssecoequivalence (thead(197),sseco)
c c shot time - microsecond LDS USE
integer*4 ssmicequivalence (thead(199),ssmic)
c c azimuth of receiver from shot-units are minutes LDS USE
integer*2 azimutequivalence (thead(203),azimut)
CPSNOV87c azimuth of geophone orientation axis with respect to true north c in minutes of arc
integer*2 geoaziequivalence (thead(205),geoazi)
CPSNOV87 c angle between geophone orientation axis and vertical.

c in minutes of arcinteger*2 geover equivalence (thead(207),geover)
CPSNOV87c time to be added to recorded trace time to get actual trace start c time. To be used when data has been reduced but trace start time is notc updated so that the actual time can be recovered even if distance and shotc time have changed (microseconds), c LDS USE
integer*4 ttraceequivalence (thead (209),ttrace)
c cCPSNOV87 c recording instrument number LDS USE
character*4 scrsequivalence (thead (213),scrs)
c c deployment name LDS USE
character*4 deployequivalence (thead(217),deploy)
c c Shotpoint Name LDS USE
character*4 spnameequivalence (thead(221),spname)
c c Receiver site Name LDS USE
character*4 rstnamequivalence (thead(225),rstnam)
c C SHOTID LDS USE
character*4 shotidequivalence (thead(229),shotid)
c C LINEID LDS USE
character*4 lineidequivalence (thead (233),lineid)
c C GEOPHONE ORIENTATION EG R40,Z LDS USE
character*4 geoorequivalence (thead (237),geoor)
c c_^^^^^^^
$LIST
91