a deeper look: inspire data demonstrates quality in
TRANSCRIPT

A Deeper Look
1
A Deeper Look: INSPIRE Data Demonstrates Quality in Educational Leadership Preparation
by Kathleen M. Winn, Erin Anderson, Cori Groth, Susan Korach,
Diana Pounder, Andrea Rorrer, and Michelle D. Young
A Deeper Look
2
This publication was developed and published by UCEA in cooperation with UCEA’s INSPIRE Institute for the Evaluation of Educational Leadership Preparation (www.edleaderprep.org). The University Council for Educational Administration (UCEA) is an international consortium of universities that offer doctoral programs in educational leadership and administration and are marked by a distinguishing commitment and capacity to lead the field of educational leadership and administration. UCEA has a single standard of excellence for membership: superior institutional commitment and capacity to provide leadership for the advancement of educational leadership preparation, scholarship, and practice consistent with UCEA's established mission. UCEA's mission is to advance the preparation and practice of educational leaders for the benefit of all children and schools. UCEA fulfills this purpose collaboratively by 1) promoting, sponsoring, and disseminating research on the essential problems of practice, 2) improving the preparation and professional development of school leaders and professors, and 3) influencing policy and practice through establishing and fostering collaborative networks. To learn more about UCEA, please visit our website at www.ucea.org The INSPIRE Institute for the Evaluation of Educational Leadership Preparation was established to make available valid and reliable evaluation research tools and methods, a systemic process for collecting and analyzing program and state level data, training materials and opportunities for program faculty and evaluators, and strategies for leveraging data for leadership preparation program improvement. Furthermore, the Institute aims to support a rigorous and longitudinal research program focused on the preparation and practice of educational leaders. Report Citation: Winn, K. M, Anderson, E., Groth, C., Korach, S., Pounder, D., Rorrer, A, & Young, M.D. (2016). A deeper look: INSPIRE data demonstrates quality in educational leadership preparation. Charlottesville, VA: UCEA.
UCEA AND INSPIRE

A Deeper Look
3
Abstract…………………………………………………………………………………….. 5
Introduction………………………………………………………………………………… 6 Methods……………………………………………………………………………………..8
Findings: Degrees, Licensure, and Certification………………………………………..9 Findings: Standards and Accreditation………………………………………………... 11
Findings: Program Structure and Components……………………………………….12 Findings: Program Personnel………………………………………………………….. 19 Findings: Program Content…………………………………………………………….. 21
Findings: Internship Experience……………………………………………………… 23 Findings: Assessment Practices……………………………………………………….. 25
Findings: Support and Trajectory of Program Graduates…………………………… 30 Findings: Program Demographics………………………………………………………31 Conclusions………………………………………………………………………………. 33
References……………………………………………………………………………….. 35
TABLE OF CONTENTS
A Deeper Look
4
A Deeper Look: INSPIRE Data Demonstrates Quality in Educational Leadership Preparation
by Kathleen M. Winn, Erin Anderson, Cori Groth, Susan Korach,
Diana Pounder, Andrea Rorrer, and Michelle D. Young

A Deeper Look
5
Since UCEA was established in 1954, much has changed in the field of educational leadership, including expectations for educational leadership preparation and practice. During this 60 year period, one thing has not waivered—UCEA’s dedication to promoting and disseminating research, engaging in continuous improvement, and preparing leaders to meet the needs of students. This report shares data collected through the INSPIRE Preparation Program (PP) edition of the INSPIRE Leadership program evaluation suite, and offers an encouraging research-based depiction of university educational leadership preparation programs affiliated with the UCEA consortium.
ABSTRACT

A Deeper Look
6
Never has it been more important to have well-prepared educational leaders who understand teaching and learning; who are able to support their school staff, student bodies, and school communities; and who are willing to question structures and norms in their efforts to meet the needs of those they lead (Young & Crow, 2017). Researchers are working to understand what counts as high quality preparation and how leadership preparation matters to the work of school leaders (Leithwood, Seashore Louis, Anderson, & Wahlstrom, 2004; Seashore Louis, Leithwood, Wahlstrom, & Anderson, 2010). Thus far, research has revealed links between characteristics of principal preparation programs and graduate career outcomes (Fuller, Baker, & Young, 2011; Fuller, Hollingworth, & An, 2016) and demonstrated relationships between specific program features and the perceived success of school leaders (Darling-Hammond, LaPointe, Meyerson, & Orr, 2007; Leithwood, Jantzi, Coffin, & Wilson, 1996; Orphanos & Orr, 2014; Orr, 2010). UCEA has contributed significantly to efforts focused on understanding the nature and impact of educational leadership preparation by organizing, supporting, and publishing research on educational leadership preparation as well as by developing program evaluation tools, including the Initiative for
Systemic Program Improvement through Research in Educational Leadership (INSPIRE) preparation program evaluation suite. The primary goal of the INSPIRE Suite is to provide a source of data for program faculty to take a critical and evaluative examination of their program in order to engage in productive and effective program changes for improvement, accreditation, and stakeholder support. The INSPIRE suite of survey instruments is the result of years of testing and improvement: (a) to describe program quality elements; (b) to assess graduate learning and immediate career outcomes: (c) to generate a 360 degree assessment of leadership behaviors and practices (leader self-assessment, subordinate/teacher assessment, and superordinate/supervisor assessment); and (d) to assess the leader’s influence on school conditions known to enhance teaching and learning. The surveys in the INSPIRE Leadership suite provide a means for examining relationships between program features, graduate perspectives, and graduate impact once candidates become educational leaders, for identifying program strengths and weaknesses, and for using survey results to foster program planning and improvement. Unfortunately, the field’s interest in developing high-quality and research-informed leadership preparation programs is discounted in some circles by critique and disdain (Levine, 2005). Critiques of leadership
INTRODUCTION

A Deeper Look
7
preparation tend to focus on almost every feature and practice of preparation, including how students are recruited and selected into programs, who teaches them, as well as what they are taught and how (Murphy, Young, Crow, & Ogawa, 2009). A fundamentally problematic aspect of much of the criticism is that they generally lump all educational leadership preparation programs together. Such broad brushed, one-size-fits-all critiques are both unfortunate and inappropriate, and ignore important distinctions between programs. For example, members of the UCEA consortium, given UCEA’s long-standing mission, have intentionally designed their program features (e.g., curriculum and instruction) to align with research-based practices to enhance program quality, coherence, and relevance. The universities that have chosen to affiliate with UCEA and accepted for membership have a culture and ethos of continuous improvement. Their interest in gathering and using program data to engage in program planning, improvement, and in some cases, redesign, is not a signal that the field is in peril; rather, it is a sign of intentionality and on-going commitment to high quality leadership preparation programming. This report analyzes and synthesizes data drawn from UCEA institutions who participated in the INSPIRE Preparation Program Survey. It offers valid and relevant evidence that contributes to the broad, national conversation pertaining to current educational leadership preparation programming. The analysis reveals that UCEA programs have incorporated program design elements and practices that reflect research evidence for high quality preparation. Furthermore, the evidence reflects UCEA’s expectation of continuous improvement, even as many UCEA programs already are regarded by the field as high-quality.

A Deeper Look
8
The report shares data from the INSPIRE-Preparation Program (PP) edition of the INSPIRE Leadership
Program Evaluation Suite, which captures descriptive information about critical program features and practices. This report presents the aggregate data from 113 different college-based preparation programs at 97 UCEA institutions. See Table 1 for sample details. Duplicate answers were removed, and if programs provided responses for more than one year, the researchers used the most recent data to improve accuracy of aggregated data.
Table 1 Description of Sample Sample N % Total Survey Responses
113
Total UCEA Institutions (U.S. only) 97 UCEA Institutions- Responded 89 92% UCEA Institutions- Multiple Programs 13 13% UCEA Institutions- Opted Out 4 4% UCEA Institutions- No Response 4 4%
Type of UCEA Institution in Sample Public 73 82% Private 16 18%
Academic Year of UCEA Institution in Total Sample 2013-2014 9 9% 2014-2015 77 73% 2015-2016 19 18% * Note: Programs who filled out surveys for multiple years were only included in the aggregated sample for the 2014-2015 school year. In addition, responses for superintendency/district leadership programs are not included in these data (Aggregate Sample of Programs, n = 103) To analyze data for this report, the researchers exported the dataset from the survey software program Qualtrics and reviewed the data to ensure one response from the most recent year of completion for each UCEA program with some institutions reporting on multiple programs. Survey responses were separated for programs with district-level certification only, building-level certification only, and building- and district-level certification. This report focuses only on those programs with building level certification programs.
METHODS

A Deeper Look
9
The INSPIRE suite of program evaluation surveys developed by UCEA offers the potential to provide a common framework and common measurements to assess the relationships between preparation program elements and both proximate and distal leadership outcomes. Preparation program elements, which are measured by the INSPIRE-PP, are organized into nine domains. These nine domains drive the organization of report findings. They include:
§ Degrees, Licensure, and Certification § Standards and Accreditation § Program Structure and Components § Program Personnel § Program Content § Internship Experience § Assessment Practices § Support and Trajectory of Program Graduates § Program Demographics
OVERVIEW OF DEGREES, LICENSURE, AND CERTIFICATION UCEA programs in this sample prepare candidates for building-level leadership positions. Forty-eight UCEA programs offer more than one type of degree. Seventy-two percent of those programs also prepare school district leaders in the preparation program. Along with building and district-level leadership preparation, 43% of programs prepare candidates for teacher leadership positions and 19% prepare leaders for higher education leadership positions. UCEA programs also prepare leaders for non-educational settings (28%). The majority (78%) of UCEA building-level preparation programs confer a degree upon completion. Of those programs offering a degree, graduates primarily earn a Master’s degree (85%), the most common degree for completing a principal preparation program (Young, Crow, & Ogawa, 2009). In addition, many UCEA programs offer Educational Specialist / Advanced Studies Certificates degrees (63%) and doctorate degrees (41%). For the UCEA programs that do not offer a degree, they offer certification, typically resulting in licensure only.
FINDINGS

A Deeper Look
10
As Table 2 outlines, candidates who complete UCEA preparation programs characteristically earn a building-level license (87%) and/or a district level license (38%). In 10% of programs, the graduates have the opportunity to obtain licensure for a different position such as teacher leader (specified by two programs), curriculum coordinator (specified by two programs), special education administrator (specified by two programs), or educational technology administrator. Table 2 Degree and Certification
Degree Candidates Earned
% of Sample
Doctorate Degree 41% Educational Specialist (or Certificate of Advanced Studies) 63% Masters 85% No degree 22%
Positions Prepared to Enter School-building leadership 99% School-district leadership 72% Teacher leadership 43% Higher education leadership 19% Leadership in non-educational settings 28% Level of Licensure or Certification Building 87% District 38% Other
10%
Licensure Exam School Leadership Licensure Assessment 30% State-developed test 48% Praxis Exam 5% State or Program portfolio 6% Other 3% None 18% Thirty-four states require licensure assessments aligned with standards (Anderson & Reynolds, 2015), These state requirements along with accreditation requisites may be related to the high percentage of UCEA programs requiring a certification exam upon program completion. The INSPIRE-PP data show the majority of UCEA programs (82%) require a licensure exam to demonstrate the knowledge and skills required for building-level leadership. For 18% of the programs, no licensure exam is required, but nearly half of programs (48%) require candidates to take a state-developed test like the School Leadership

A Deeper Look
11
Licensure Assessment (SLLA). Six states require a portfolio review for at least part of the licensure requirements and, 6% of responding programs indicated that their candidates compile and submit a portfolio of assessments used in their program or additional evidence to comply with their state. Additional data concerning the types of assessment are presented later in this document.
STANDARDS AND ACCREDITATION
Program Alignment with Standards All of the UCEA building-level preparation programs in the sample align their program with one or more sets of standards. In fact, 56 of the 103 programs indicated alignment with more than one set of standards. The most common standards programs use are state-developed standards (72%). Fifty-seven percent of UCEA programs are aligned with the 1996 or 2008 Interstate School Leaders Licensure Consortium (ISLLC) standards, and 41% of programs are aligned with the 2011 Educational Leadership Constituent Council (ELCC). It should be noted that many of the sets of standards pertaining to school leadership (i.e., ISLLC, ELCC, numerous state standards) are quite similar. An additional 10% of programs indicated that they use a different set of standards, such as the Council for the Accreditation of Educator Preparation Programs (CAEP), international standards, district standards, or other core competencies put forth by organizations such as Danforth. Accreditation Body In addition to adhering to standards, the entire sample of UCEA institutions also engages in an accreditation process, ensuring a high level of quality for the programs (see Table 3). Preparation programs can receive accreditation from national, state, or regional organizations, often depending on university or state level policies dictating expectations for third party accreditation. The largest proportion of programs are approved and accredited by a state accreditation body (77%), whereas 68% of programs undergo national approval from CAEP. (CAEP consists of the former accrediting bodies of National Council for Accreditation of Teacher Education (NCATE) and Teacher Education Accreditation Council (TEAC).) An additional 10% of programs indicate they use another accrediting body, such as regional organizations like the Southern Association of Colleges and Schools (SACS) (specifically mentioned by 4 programs). Fifty-four programs indicated more than one organization reviews their program for accreditation purposes.

A Deeper Look
12
Table 3 Standards and Accreditation of UCEA Principal Preparation Programs
% of Sample Program Alignment with Standards Educational Leadership Constituent Council (ELCC) 41% Interstate School Leaders Licensure Consortium (ISLLC) 57% State Standards 72% Other 10%
Accreditation Body National accreditation (e.g., CAEP, NCATE/TEAC/ELCC) 68% State accreditation 77% Other (e.g., Regional) 10%
PROGRAM STRUCTURE AND COMPONENTS
Credit Requirements UCEA building-level preparation programs report a range of credit hour requirements for graduation, with a minimum of 12 hours and a maximum of 96, often aligned with the type of degree being conferred (see Table 4). The average number of credits required is 39 credits (S.D. = 13.64). Of the 98 programs that indicated whether they were on a quarter or semester schedule, most programs (n = 92) organize courses and assign credits by semester. Table 4 Program Credit Requirements Across UCEA Principal Preparation Program Requirements
Mean Standard Deviation Min Max
Minimum Number of Credits Required 38.67 13.64 12 96 Length of Program Building-level preparation programs usually take candidates between one and three years to finish, again closely associated with the type of degree conferred at the program completion. Over 80% of UCEA building-level leader preparation programs convene for a typical duration of two or more years. The largest proportion of UCEA programs take two years to complete (51%), while 16% of programs take three years, and 14% require more than three years. Some programs have a typical duration lasting less than two years, with 11% of programs reported taking 18 months and 8% requiring only one year (see Table 5).

A Deeper Look
13
Table 5 Length of Programs Across UCEA Principal Preparation Programs
>3 years 3 years 2 years 18 months 1 year Typical duration of this program 14% 16% 51% 11% 8% Cohort Model Building-level leadership preparation programs are increasingly using cohort models. Research has shown cohorts are important aspects of principal preparation programs that build strong student relationships and provide unique opportunities for learning (Darling-Hammond, LaPointe, Meyerson, & Orr, 2007; Leithwood et al., 1996; Jackson & Kelley, 2003; McCarthy, 1999; Young et al., 2009). Table 6 shows that in the INSPIRE-PP sample, 90% of programs use a full, partial, or de facto cohort model. A full cohort model, found in 55% of UCEA programs, is a group of individuals who begin the program together and stay together throughout the duration. Two other cohort options include a partial model found in 13% of programs where there is a defined group of individuals for some courses, or the more informal de facto model used by 13% of programs, where students enter at the same time and take the majority of the same courses and in the same sequence but are not deemed a cohort. For the 78 programs that reported their typical cohort size, the mean was 17 students (S.D. = 4.64) with a range of seven candidates in the smallest cohort and 28 in the largest. Table 6 Cohort Models Across UCEA Principal Preparation Programs
Full
Cohort Partial Cohort
De facto Cohort
Non Cohort Other
Typical type of cohort model 55% 13% 13% 10% 9% Selection Selection and recruitment strategies are program components about which concerns have been raised (Young et al., 2009; Young, 2015). There is increased understanding that selection is a crucial aspect of building-level leader preparation (Darling-Hammond et al., 2007; Jacobson, McCarthy, & Pounder, 2015). Selection needs to rely on more than just test scores (Browne-Ferrigno & Muth, 2009; Murphy, Moorman & McCarthy, 2008) and the potential candidate’s interest in a leadership program (McCarthy, 2002). Selection should include a process for determining the applicant’s understanding of effective instruction, demonstrating prior leadership experience, the capacity for building leadership skills, and expressing clear

A Deeper Look
14
intentions for their career goals after the program (Browne-Ferrigno, 2003; Darling-Hammond et al., 2007; Jackson & Kelley, 2002). Table 7 Selection of Students For Admittance in UCEA Principal Preparation Programs
Extremely
Emphasized Very Much
Emphasized Emphasized Moderately
Almost No Emphasis
No Emphasis
Candidate Selection: Emphasis on Experience Academic potential 27% 55% 18% 0% 0% Leadership potential 48% 45% 6% 2% 0% Prior relevant experience 23% 42% 34% 2% 0% Job relevant demonstrations 16% 29% 33% 9% 13% Candidate Selection: Type of Information Professional recommendations 31% 54% 10% 4% 2% Transcripts 24% 46% 26% 5% 0% GRE or other test score 10% 23% 33% 11% 23% Personal statement 42% 42% 15% 1% 1% Resume 22% 43% 29% 3% 3% Prior degrees 11% 35% 43% 9% 2% Previous leadership experience 20% 39% 31% 6% 4% Communication skills 15% 58% 18% 6% 3% Social justice dispositions 15% 29% 37% 10% 8% Teaching experience 20% 46% 29% 4% 1% Teaching credentials 16% 39% 35% 6% 4% Evidence of teaching effectiveness 11% 19% 30% 20% 19% Simulations (e.g., leaderless group activity, case analysis) 10% 3% 11% 19% 57% Interviews 22% 25% 11% 10% 31% The majority (93%) of UCEA programs place large emphasis on leadership potential, often supported by evidence provided by the candidate’s current principal or district leader (see Table 7). In order to determine whether a candidate has leadership potential, as well as prior experience and academic potential, programs rely on traditional sources of admittance information (e.g., personal statements (99%), transcripts (96%), professional recommendations (95%), resumes (94%), leadership experience (90%), and prior degrees (89%)). A smaller but still impressive proportion of UCEA institutions also consider additional types of evidence, such as communication skills (91%) often assessed through interviews (58%), and evidence of

A Deeper Look
15
teaching effectiveness (60%), in contrast to basing acceptance decisions primarily on teaching experience (95%) and held credentials (90%). Importantly, 81% of programs indicate that they emphasize social justice dispositions when selecting candidates for admission. The expectation of prior experience is in line with the 39 states whose policies require three or more years of teaching or similar experience into order to be eligible for licensure (Anderson & Reynolds, 2015). The data indicate teaching experience is less important to program selection committees than is leadership potential, most likely due to the fact the vast majority of candidates are already required to either have been a teacher or school-level staff member or developed an interest in leadership from prior experience. To a lesser degree, as seen in Table 7, programs use job relevant demonstrations to help determine candidate fit in addition to measuring academic potential, leadership potential, and relevant prior experience. Partnerships One of the major contentions of a report by The Wallace Foundation (2016) was that “strong university-district partnerships are essential to high-quality preparation but are far from universal (pg. 8).” There is research that supports the need for partnerships, when appropriate, and suggests that the stronger the partnership, the more closely aligned theory and practice can be (Davis et al., 2005; Jacobson et al., 2015; Orr, 2011) and the greater the level of commitment of the candidate to the program (Orr & Barber, 2007). In a study of exceptional programs, Jackson and Kelley (2002) purported that each collaborated with local districts for (a) selection and recruitment, (b) ongoing support of program elements, and (c) the internship experience. These partnerships positively position both the university and district since Orr (2011) found that “programs with a district partnership are significantly more likely to have graduates who received district financial support” (p. 146). More recently however, research suggests best practice involves authentic collaboration between and among education stakeholders and is a type of partnership that is a complex and active relationship (Browne-Ferrigno, 2011). The level of dedication and complexity, or the rural locations of many of these respondents may be an explanation for the approximately one-quarter of UCEA programs that indicated on the INSPIRE-PP they do not have formal district partnerships.

A Deeper Look
16
The majority of UCEA building-level preparation programs are engaged in university-district partnerships but around a quarter of UCEA programs do not have formal district partnerships (see Table 8). INSPIRE-PP shows the most common reported area of collaboration is supporting internship arrangements and supervision as only 9% of the UCEA programs reported they do not work with a district on this task. The research team considered whether where a program is located (e.g., rural setting) influenced this, but upon further examination of the results, geography did not seem to impact collaboration since the 9% of institutions includes universities located in various types of settings (i.e. urban, town, city, rural). Of programs with more substantive relationships, their extensive partnerships include formalized memorandums of understanding (47%) and organized advisory committees (44%). Table 8 Partnerships Across UCEA Principal Preparation Programs
To a great
extent To a good
extent Somewhat A little Not at
all Formal advisory committee 22% 22% 27% 11% 19% Memorandum of understanding 28% 19% 13% 8% 32% Shared decision making on student selection 13% 17% 17% 21% 32%
Participation in curriculum and program design 12% 13% 34% 21% 19%
District support on internship arrangements and supervision 45% 20% 19% 7% 9%
District staff teach in the program 12% 19% 38% 19% 23%
District partner(s) gives priority to hiring program graduates into school or district leadership positions
7% 27% 23% 20% 23%
Districts and universities also collaborate on selection and instruction. These data can be found in Tables 8 and 9. Thirty percent of UCEA programs invite the district’s input in the decision making for selection of students, and 34% of the districts give priority to partner-program graduates to fill school or district leadership positions. Further evidence demonstrating the mutual commitment UCEA programs and their partnership districts share is seen in the crossover preparation program instruction: nearly a third of the programs (31%) have district staff teaching in the program. (More details pertaining to the preparation personnel are offered later in this document.)

A Deeper Look
17
Table 9 District Role in Selection for UCEA Principal Preparation Programs
Mean Standard Deviation Min Max
Degree to which districts participate in the nomination 48.95 33.64 0 100 Degree to which districts participate in the selection 37.89 35.03 0 100 Note: For nomination the most frequent answers included 100 (16%) and 10, 20, and 20 (8%). 58.6% of programs work with districts on nomination less than half the time. For selection, 0 is the most frequent answer (14.8%), followed by 100 (13.1%), 30 (9.8%), and 10 (8.2%). 72.1% of programs collaborate with districts in selection less than half the time. Accessibility UCEA programs are accessible and attractive to potential candidates with 99% of programs indicating that classes are offered at convenient times and 96% indicating that classes are offered at convenient locations. Additionally, 94% of programs deem their admission requirements reasonable. The affordability of tuition is less supported with only 64% agreeing tuition was affordable and only 10% indicating disagreement. More heartening is that 99% of programs reported they believe they have a good reputation. This information can be found in Table 10 below. Table 10 Accessibility Across UCEA Principal Preparation Programs Rate your agreement with the following statements about the influence of this program's accessibility and attractiveness.
Strongly Agree Agree
Neither Agree or Disagree Disagree
Strongly Disagree
Classes are offered at convenient times and days.
68% 31% 1% 0% 0%
The program location is convenient. 55% 41% 4% 0% 0% Tuition is affordable. 31% 33% 25% 8% 2% Courses are available online. 24% 11% 19% 20% 26% The program has a good reputation. 79% 20% 1% 0% 0% Admission requirements are reasonable. 54% 40% 6% 0% 0% Time. The INSPIRE-PP reveals UCEA institutions are purposeful in course scheduling. Building-level leadership programs usually offer the majority of their courses in the evening to accommodate candidates’ schedules, since they are usually working full time in a K-12 school setting. In order to ensure accessibility, 80% of programs teach all or most of their classes in the evenings with only 1% offering no evening classes. Programs also take advantage of using weekends (22%) or summers (28%) to offer all or most

A Deeper Look
18
courses. Twenty-eight percent of programs offer all or most of the classes at other times, most likely during the day. Notably, 22% teach at least a few classes during the day in a timeslot negotiated with their partner school districts; reiterating the aforementioned benefits of strong partnerships. Delivery Location and Mechanism. UCEA institutions hold courses in different settings (see Table 11). The most common location is on the institutions’ campuses (59%), while 27% offer all or most courses at a district location such as a school or district office, and 27% use a combination of both university and district locations. Scheduling classes at a district location allows candidates to reduce travel time and parking hassles. Furthermore, 35% of programs provide at least some online learning opportunities with 16% offering online instruction all or most of the time; and 12% of programs offer no face-to-face instruction. Relatedly, 84% of programs provide at least a few hybrid-learning opportunities. Table 11 Course Delivery Across UCEA Principal Preparation Programs All Most Some A few None Typical Class Location University-based location (on campus) 34% 25% 14% 12% 16% University-based location (off campus) 14% 11% 23% 10% 43% A district location (such as a school or district office) 15% 12% 18% 16% 39% In mixed locations (on campus and at the district 15% 12% 18% 16% 39% Online 10% 7% 8% 11% 65% Other 13% 12% 19% 25% 31% Typical Class Times
Evenings 34% 46% 13% 5% 1% Weekends 7% 15% 28% 18% 32% Summer 20% 8% 58% 12% 3% Daytime schedules that have been negotiated with partner school districts
3% 5% 5% 9% 78%
Other 14% 14% 0% 7% 64% Typical Delivery Mechanism
Only face-to-face 27% 39% 12% 11% 12% Only online 8% 8% 18% 22% 44% Hybrid 9% 16% 32% 27% 16% Technology All UCEA programs use technology on a regular basis, although there is a variation in the use in types, such as Interactive SMART boards (10% use them to a good or great extent and 43% do not use them at

A Deeper Look
19
all), assessment management systems (30% use them to a good or great extent and 45% do not use them at all), or virtual reality, computer games, and simulation programs (4% use them to a good or great extent while 52% do not use them at all). Every UCEA program in the sample used word processing software and electronic learning management systems; and nearly all programs use online research databases in their programs – 77% of programs using them to a good or great extent. These findings may be connected to and/or explained by the number of classes offered online. See Table 12 for the breakdown of the different uses of technology. Table 12 Technology Used Across UCEA Principal Preparation Programs To what extent does this program require candidates to use the technologies listed below in their program?
To a great extent
To a good extent Somewhat A little
Not at all
Computer labs with internet access 15% 10% 14% 16% 44% Laptops and/ or tablets (e.g., iPad, Kindle, Galaxy,
etc.) 48% 25% 12% 7% 8%
Interactive SMART Boards 6% 4% 24% 24% 43% Spreadsheet or Database Software (e.g., Excel)
21% 33% 29% 12% 5%
Word Processing Software (e.g., MS Word) 80% 17% 3% 0% 0% Access to video cameras, video recording
equipment 7% 25% 22% 26% 20%
Access to online research databases 50% 27% 16% 6% 1% Electronic learning management system (e.g.,
Blackboard, Canvas, etc.) 70% 22% 6% 2% 0%
Assessment management system (e.g., LiveText, Taskstream, etc.)
17% 13% 16% 9% 45%
Virtual reality/computer games/simulation programs
0% 4% 9% 35% 52%
Social networking technology 5% 9% 31% 31% 25%
PROGRAM PERSONNEL Program personnel are essential to candidates’ learning experiences (Jacobson et al., 2015) with faculty knowledge emerging as a leading indicator of program quality (Darling-Hammond et al., 2007; Pounder & Ni, 2016; Orr & Orphanos 2011). UCEA Institutional and Program Quality Criteria #2 states that programs must provide, “Evidence that the preparation program involves a critical mass of full-time faculty members whose appointments are in the department of which educational leaders are educated and who exhibit excellence in scholarship, teaching, and service in educational leadership. A majority of educational

A Deeper Look
20
leadership coursework must be taught by these full-time faculty members” (Young, Tucker, & Orr, 2012, p. 3). While pre-service principals are progressing through their leadership curriculum at UCEA member institutions, they will largely find that full-time faculty members provide the majority of their instruction. These programs engage their tenured or tenure track faculty to lead the majority (55%) of program courses, while full-time clinical faculty or clinical instructors teach 33% of courses. Adjunct, or part-time instructors were assigned, on average, to instruct just over one quarter (27%) of courses, while other practitioners were hired to teach only 11% of courses. These findings (see Table 13) are unsurprising given UCEA membership requirements articulate a commitment to engaging full-time faculty members in the instruction of the majority of the preparation coursework (Young et al., 2012). Table 13 Instructional Personnel in UCEA Principal Preparation Programs What proportion of the program courses are taught by the following personnel? (Place slider at the estimated percentage of courses taught.) Mean Min Max Tenured/Tenure Track Faculty 55 0 100 Full-Time Clinical Faculty/Instructors 33 0 100 Adjunct, Part-Time Faculty/Instructors 27 0 100 Other Practitioners 11 0 100 Practitioner Role within Principal Leadership Program The role of practitioners serving within building leader preparation programs, are primarily categorized as supporting and/or supervisory roles (see Table 14). Eighty-five percent of responding programs use them to a great or good extent in fieldwork supervision. Nearly all programs (99%) call upon practitioners to be guest speakers or panelists to present in courses or other events offered to candidates. When making programmatic decisions about students, a number of programs indicated that they do not use practitioners at all for decisions of admission (42%) nor completion (43%). However, 60% of programs noted they do rely on input from practitioners in similar ways for these decisions (e.g., practitioners are used to a good extent for admission decisions and a good extent for completion decisions). Further, the data suggest that practitioners serve in collaborative roles for curriculum decision making, since 89% of programs reported these stakeholders play a role in this area.

A Deeper Look
21
Table 14 Practitioner Roles within UCEA Principal Preparation Programs
To what extent do practitioners serve in this program?
To a Great Extent
To a Good Extent Somewhat A little
Not at all
Sole instructor for one or more courses 20% 37% 25% 10% 8% Co-teach with a faculty member for one or more
courses 9% 10% 28% 20% 32%
Guest speaker or panelist for one or more courses or special events
27% 47% 20% 5% 1%
Supervise field work 65% 20% 6% 4% 4% Advisory board 32% 21% 22% 6% 18% Assess students for program admissions 13% 16% 14% 14% 42% Assess students for program
completion/graduation 11% 21% 15% 9% 43%
Curriculum development 10% 21% 32% 25% 11% Other 10% 10% 0% 0% 80%
PROGRAM CONTENT Curriculum A hallmark of UCEA institutions is to reveal “evidence of significant efforts by faculty members to identify, develop, and promote relevant knowledge of best practices focused on the essential problems of schooling, leadership, and administration” (Young et al., 2012, p. 3). From INSPIRE-PP, there are five general content areas that a well-balanced program addresses in their curriculum (see Table 15): instructional leadership (97% very much or extremely emphasized), school improvement (96% very much or extremely emphasized), family and community relations (79% very much or extremely emphasized), management (69% very much or extremely emphasized), and organizational culture (68% very much or extremely emphasized). All UCEA programs in the sample target the five areas listed above. Management and family and community relations were only moderately emphasized by 31% and 20% of programs, respectively.

A Deeper Look
22
Table 15 Curriculum Across UCEA Principal Preparation Programs How much emphasis is given to the content areas below in this program's curriculum?
Extremely Emphasized
Very Much Emphasized
Emphasized Moderately
Almost No Emphasis
No Emphasis
Organizational Culture 31% 37% 2% 0% 0% Instructional Leadership 65% 32% 3% 0% 0% School Improvement 62% 34% 4% 0% 0% Management 29% 40% 31% 0% 0% Family and Community Relations
42% 37% 20% 1% 0%
Instruction
UCEA programs demonstrate an understanding of andragogy and best instructional practices associated with adult learning theory (Knowles, 1996), and the need to train high quality leaders to be prepared to make decisions to increase effectiveness of schools. In fact, as Table 16 shows, only 48% used lectures to a good or great extent. Building-level preparation programs are regularly using strategies that ensure lateral student learning and develop the necessary skills a leader needs to work with others through small group activities (95%) and discussions (91%). Programs also demonstrate an understanding of the need to create course experiences that mirror the expectations of a practicing administrator through field-based, course-related projects (95%), problem-based learning (83%), action research or inquiry projects (75%), and case studies (78%). Notably, 95% of programs indicate all seven strategies are used. Table 16 Instructional Strategies Across UCEA Principal Preparation Programs To what extent are the following
learning practices/instructional strategies part of program course work?
To a great extent
To a good extent Somewhat A little
Not at all
Field-based projects that are course-related
62% 33% 4% 1% 0%
Problem-based learning 39% 44% 15% 2% 0% Action research or inquiry projects
38% 37% 19% 4% 1%
Case studies 24% 54% 18% 4% 0% Lectures 14% 34% 35% 13% 4% Small-group activities (during class or outside class)
55% 40% 4% 1% 0%
In-class/online discussions 52% 39% 7% 2% 0%

A Deeper Look
23
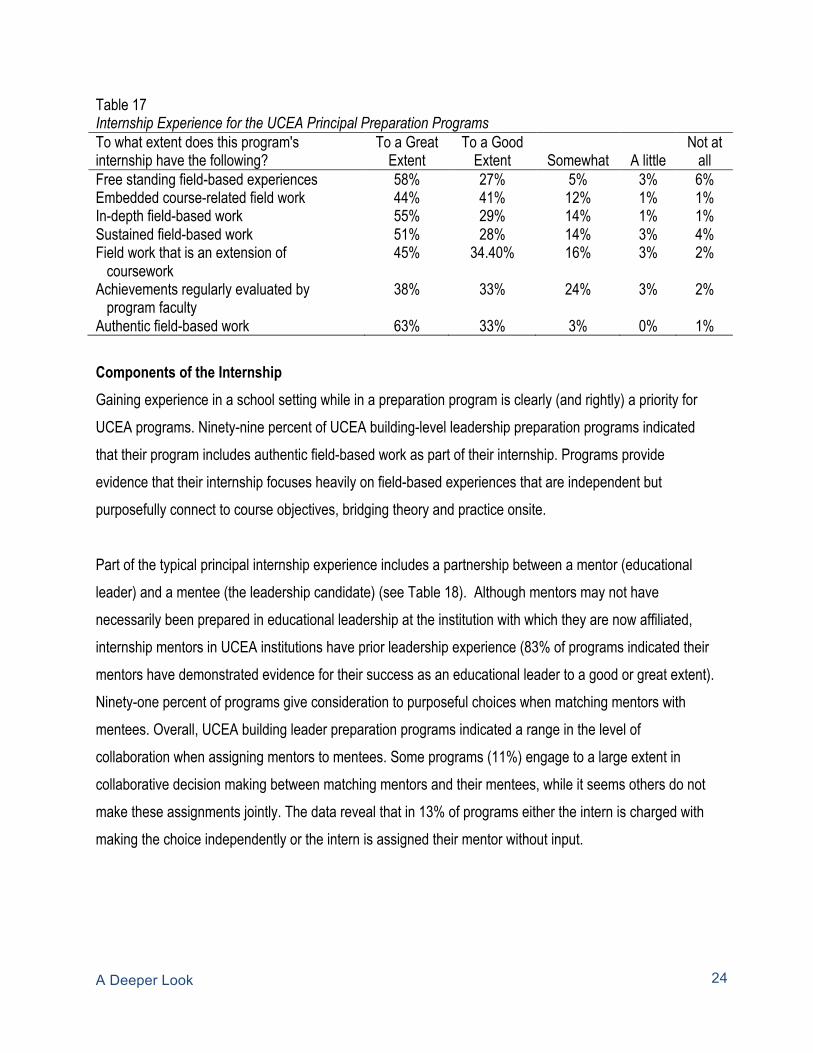
INTERNSHIP EXPERIENCE Opportunities within the Internship Experience The clinical experience offers an important opportunity to integrate the learning from courses into practice, to give students practical experience, and allow them to apply their knowledge (The Wallace Foundation, 2016). The internship seems to be the most important part of preparation programs (Cordeiro & Sloan, 1996; Darling-Hammond et al., 2007; Hackmann, Russell, & Elliot, 1999; Jackson & Kelley, 2003; Jacobson et al., 2015; McCarthy, 1999; Militello, Gajda, & Bowers, 2009; Orr, 2011; Orr & Orphanos, 2011; Orr & Pounder, 2011; Perez, Uline, Johnson, James-Ward, & Basom, 2011; Young et al., 2009). These clinical learning experiences typically consist of an internship where a pre-service building leader has the opportunity to learn within a school site(s). Data on the clinical experience can be found in Tables 17 and 18. UCEA institutions’ building-level preparation programs have a clinical component, as is required for membership. These clinical learning experiences typically consist of an internship where a pre-service building leader has the opportunity to learn within a school site(s). The data here indicate UCEA preparation programs focus on offering a high-quality internship experience to their leadership interns. Ninety-three percent of programs revealed that to a good or great extent, their internship program was organized to provide an excellent learning experience. Ninety-six percent of building-level leadership programs design their programs in such a way to offer interns opportunities to work in schools with diverse student populations. Further, the internship learning experiences were designed by UCEA programs focusing either to a good or great extent on ways leaders emphasize school improvement efforts (90%), apply the learned components from the program (e.g., coursework) to their professional practice (90%), develop professional decision making skills (88%), and engage in addressing problems collectively (84%).
A Deeper Look
24
Table 17 Internship Experience for the UCEA Principal Preparation Programs To what extent does this program's internship have the following?
To a Great Extent
To a Good Extent Somewhat A little
Not at all
Free standing field-based experiences 58% 27% 5% 3% 6% Embedded course-related field work 44% 41% 12% 1% 1% In-depth field-based work 55% 29% 14% 1% 1% Sustained field-based work 51% 28% 14% 3% 4% Field work that is an extension of coursework
45% 34.40% 16% 3% 2%
Achievements regularly evaluated by program faculty
38% 33% 24% 3% 2%
Authentic field-based work 63% 33% 3% 0% 1% Components of the Internship Gaining experience in a school setting while in a preparation program is clearly (and rightly) a priority for UCEA programs. Ninety-nine percent of UCEA building-level leadership preparation programs indicated that their program includes authentic field-based work as part of their internship. Programs provide evidence that their internship focuses heavily on field-based experiences that are independent but purposefully connect to course objectives, bridging theory and practice onsite. Part of the typical principal internship experience includes a partnership between a mentor (educational leader) and a mentee (the leadership candidate) (see Table 18). Although mentors may not have necessarily been prepared in educational leadership at the institution with which they are now affiliated, internship mentors in UCEA institutions have prior leadership experience (83% of programs indicated their mentors have demonstrated evidence for their success as an educational leader to a good or great extent). Ninety-one percent of programs give consideration to purposeful choices when matching mentors with mentees. Overall, UCEA building leader preparation programs indicated a range in the level of collaboration when assigning mentors to mentees. Some programs (11%) engage to a large extent in collaborative decision making between matching mentors and their mentees, while it seems others do not make these assignments jointly. The data reveal that in 13% of programs either the intern is charged with making the choice independently or the intern is assigned their mentor without input.

A Deeper Look
25
Table 18 Mentor Support During Internship Experiences in UCEA Principal Preparation Program To what extent are the following true about internship mentors?
To a Great Extent
To a Good Extent Somewhat A little
Not at all
Mentors have demonstrated successful experience as a current or former educational leader
46% 37% 11% 4% 1%
Selection of mentors is based on the match between candidate needs and mentor expertise
24% 33% 18% 17% 9%
Training is provided to mentors to guide supervision
9% 18% 35% 27% 10%
Mentors are trained by the program 7% 13% 30% 26% 24% Mentors are selected by both program faculty and intern
11% 29% 23% 24% 13%
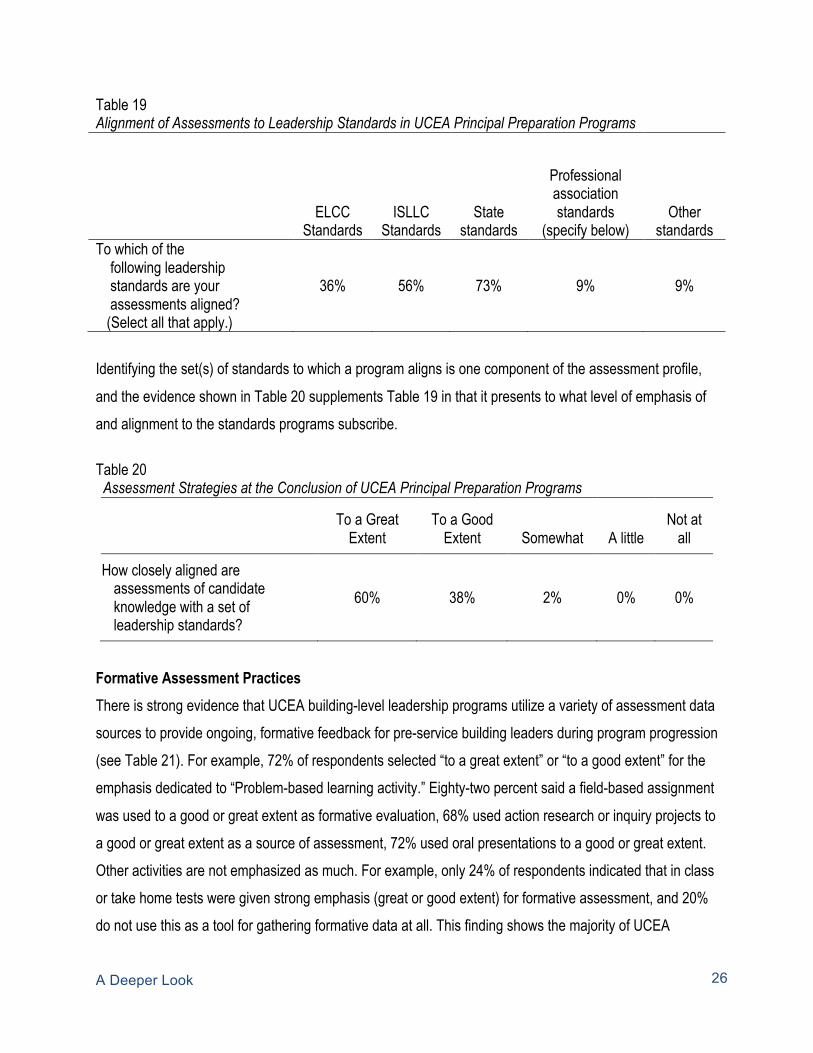
ASSESSMENT PRACTICES Effective programs should rely on standards-based assessments to measure learning (Orr & Orphanos, 2011). Recall that 100% of UCEA programs aligned their curriculum to one or more set(s) of standards. It is unsurprisingly then, that 97 UCEA member institutions reported that assessment tools in their programs also align to set(s) of leadership standards (see Table 19). Most programs (73%) indicated their assessments comply with state standards, while over half (56%) are aligned to the Interstate School Leaders Licensure Consortium (ISLLC) Standards, and over one third (35%) to the Educational Leadership Constituent Council (ELCC) Standards. Some programs also provided information about either professional associate standards or other sets of standards to which their assessments matched. Some examples of these data include CAEP, their university’s mission, or the goals of a nearby school district. The evidence shows that the ELCC Standards and ISLLC Standards or states’ standards are the primary standards to which programs design their assessments for their development of educational leaders. The evidence indicating the level of emphasis and alignment of the standards adds depth to understanding this notion. See Tables 19, 20, 21, 22, 23, 24, and 25 for detailed information on assessment practices.
A Deeper Look
26
Table 19 Alignment of Assessments to Leadership Standards in UCEA Principal Preparation Programs
ELCC
Standards ISLLC
Standards State
standards
Professional association standards
(specify below) Other
standards To which of the following leadership standards are your assessments aligned? (Select all that apply.)
36% 56% 73% 9% 9%
Identifying the set(s) of standards to which a program aligns is one component of the assessment profile, and the evidence shown in Table 20 supplements Table 19 in that it presents to what level of emphasis of and alignment to the standards programs subscribe. Table 20 Assessment Strategies at the Conclusion of UCEA Principal Preparation Programs
To a Great
Extent To a Good
Extent Somewhat A little Not at
all
How closely aligned are assessments of candidate knowledge with a set of leadership standards?
60% 38% 2% 0% 0%
Formative Assessment Practices There is strong evidence that UCEA building-level leadership programs utilize a variety of assessment data sources to provide ongoing, formative feedback for pre-service building leaders during program progression (see Table 21). For example, 72% of respondents selected “to a great extent” or “to a good extent” for the emphasis dedicated to “Problem-based learning activity.” Eighty-two percent said a field-based assignment was used to a good or great extent as formative evaluation, 68% used action research or inquiry projects to a good or great extent as a source of assessment, 72% used oral presentations to a good or great extent. Other activities are not emphasized as much. For example, only 24% of respondents indicated that in class or take home tests were given strong emphasis (great or good extent) for formative assessment, and 20% do not use this as a tool for gathering formative data at all. This finding shows the majority of UCEA

A Deeper Look
27
member institutions are placing more emphasis on the types of research-based assessment activities that are a more effective vehicle for formatively assessing one’s learning. Table 21 Use of Formative Assessments in UCEA Principal Preparation Programs To what extent are the following types of candidate formative assessments used to evaluate candidate learning?
To a Great Extent
To a Good Extent Somewhat A little
Not at all
Simulation-based activity 9% 22% 32% 26% 22.00% Problem-based learning activity 25% 47% 21% 7% 0% Analysis of field based problems and case studies
30% 51% 19% 0% 0%
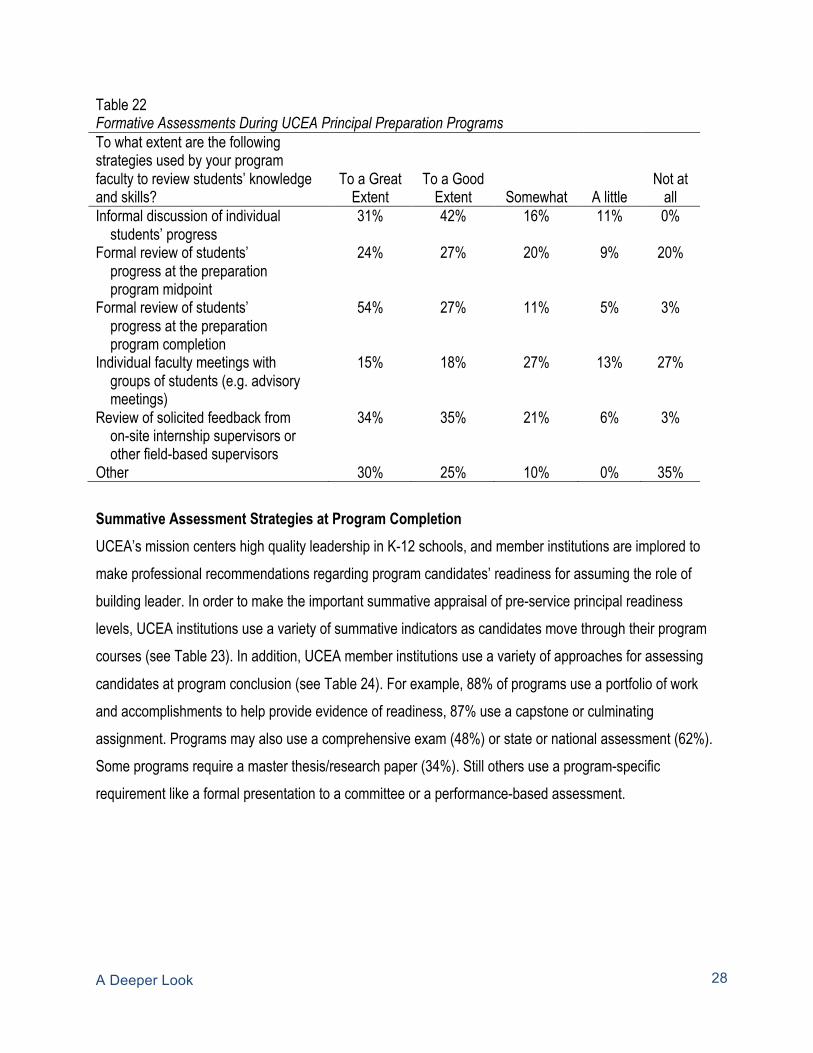
Demonstration 22% 27% 30% 13% 8% Oral presentation 28% 44% 20% 6% 2% Research paper or essay 34% 40% 15% 6% 4% In class or take home test 8% 16% 28% 28% 20% Field-based assignment 44% 38% 15% 2% 2% Action research or inquiry project 37% 31% 21% 6% 4% Field-based experience evaluation 39% 41% 16% 4% 1% Other 39% 0% 8% 0% 54% Faculty members engage in different practices to provide effective feedback to their students throughout the program. Data from INSPIRE-PP (Table 22) indicate that informal conversations, formal reviews of progress throughout students’ duration within the program, and feedback provided by their internship site are different ways UCEA principal preparation faculty engage in the assessment efforts of their pre-service building leaders. Because these data suggest faculty review students’ progression throughout different stages in their program, opportunities may develop for pre-service building leaders to engage in reflective practice and strengthen relationships with faculty members, school leaders, and mentors. Other examples of formal and regular assessment practices UCEA programs reported using include within course assessments (97%) and formal assessments of the candidate’s internship experience (98%).
A Deeper Look
28
Table 22 Formative Assessments During UCEA Principal Preparation Programs To what extent are the following strategies used by your program faculty to review students’ knowledge and skills?
To a Great Extent
To a Good Extent Somewhat A little
Not at all
Informal discussion of individual students’ progress
31% 42% 16% 11% 0%
Formal review of students’ progress at the preparation program midpoint
24% 27% 20% 9% 20%
Formal review of students’ progress at the preparation program completion
54% 27% 11% 5% 3%
Individual faculty meetings with groups of students (e.g. advisory meetings)
15% 18% 27% 13% 27%
Review of solicited feedback from on-site internship supervisors or other field-based supervisors
34% 35% 21% 6% 3%
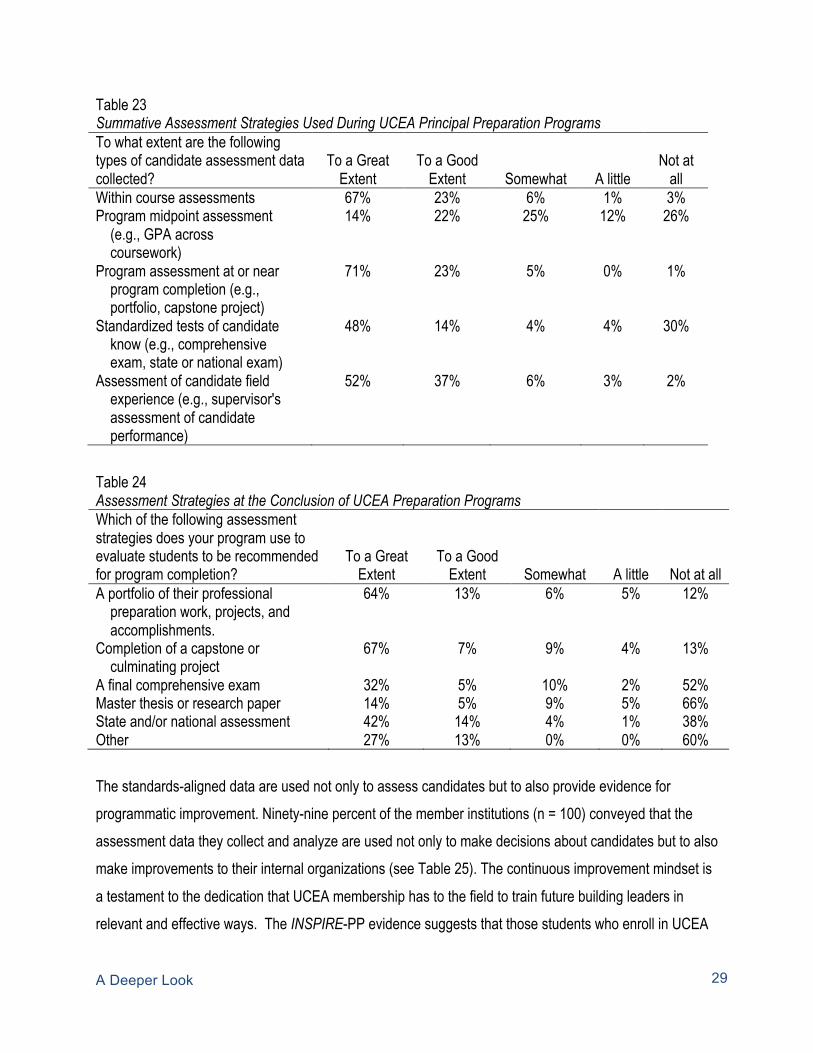
Other 30% 25% 10% 0% 35% Summative Assessment Strategies at Program Completion UCEA’s mission centers high quality leadership in K-12 schools, and member institutions are implored to make professional recommendations regarding program candidates’ readiness for assuming the role of building leader. In order to make the important summative appraisal of pre-service principal readiness levels, UCEA institutions use a variety of summative indicators as candidates move through their program courses (see Table 23). In addition, UCEA member institutions use a variety of approaches for assessing candidates at program conclusion (see Table 24). For example, 88% of programs use a portfolio of work and accomplishments to help provide evidence of readiness, 87% use a capstone or culminating assignment. Programs may also use a comprehensive exam (48%) or state or national assessment (62%). Some programs require a master thesis/research paper (34%). Still others use a program-specific requirement like a formal presentation to a committee or a performance-based assessment.
A Deeper Look
29
Table 23 Summative Assessment Strategies Used During UCEA Principal Preparation Programs To what extent are the following types of candidate assessment data collected?
To a Great Extent
To a Good Extent Somewhat A little
Not at all
Within course assessments 67% 23% 6% 1% 3% Program midpoint assessment (e.g., GPA across coursework)
14% 22% 25% 12% 26%
Program assessment at or near program completion (e.g., portfolio, capstone project)
71% 23% 5% 0% 1%
Standardized tests of candidate know (e.g., comprehensive exam, state or national exam)
48% 14% 4% 4% 30%
Assessment of candidate field experience (e.g., supervisor's assessment of candidate performance)
52% 37% 6% 3% 2%
Table 24 Assessment Strategies at the Conclusion of UCEA Preparation Programs Which of the following assessment strategies does your program use to evaluate students to be recommended for program completion?
To a Great Extent
To a Good Extent Somewhat A little Not at all
A portfolio of their professional preparation work, projects, and accomplishments.
64% 13% 6% 5% 12%
Completion of a capstone or culminating project
67% 7% 9% 4% 13%
A final comprehensive exam 32% 5% 10% 2% 52% Master thesis or research paper 14% 5% 9% 5% 66% State and/or national assessment 42% 14% 4% 1% 38% Other 27% 13% 0% 0% 60% The standards-aligned data are used not only to assess candidates but to also provide evidence for programmatic improvement. Ninety-nine percent of the member institutions (n = 100) conveyed that the assessment data they collect and analyze are used not only to make decisions about candidates but to also make improvements to their internal organizations (see Table 25). The continuous improvement mindset is a testament to the dedication that UCEA membership has to the field to train future building leaders in relevant and effective ways. The INSPIRE-PP evidence suggests that those students who enroll in UCEA

A Deeper Look
30
principal leadership preparation programs are rigorously prepared in a way that aligns with the agreed-upon professional standards of the educational leadership community.
Table 25 Use of Candidate Assessment Data for UCEA Principal Preparation Programs Identify to what extent candidate assessment data are used in this program.
To a Great Extent
To a Good Extent Somewhat A little
Not at all
Aligned with program standards 53% 38% 8% 1% 0% Analyzed and reviewed for program improvement purposes
51% 28% 13% 7% 1%
SUPPORT AND TRAJECTORY OF PRINCIPAL LEADERSHIP GRADUATES
Post-Program Support Upon program completion, successful graduates of UCEA programs should be positioned to begin a new leadership role; and UCEA member institutions offer a variety of supports and resources to their candidates including interviewing assistance (54%), job counseling (40%), job referrals (59%), networking opportunities (68%), and continued mentoring for novice principals (20%). Nine percent of programs are also involved with an induction program to help bridge the transition for the newly minted building leader between their principal leadership program and the new school district (see Table 26). Table 26 Post Program Support Provided by UCEA Principal Preparation Programs What post-program support is offered to graduates from this program? (Select all that apply.)
n Percentage of participating programs
Job counseling 41 40% Interviewing assistance 54 52% Job referral 61 59% Induction program 9 9% New principal mentoring or coaching 21 20% Networking opportunities with other graduates 70 68% Professional learning opportunities 40 39% Other 6 6%

A Deeper Look
31
Career Outcomes Table 27 shows the types of data UCEA member institutions gather in-house about their principal leadership program graduates’ trajectories. These data range from collecting the completion rates (87%) and retention rates (62%) of participants, to measuring the impact their principal graduates have once they begin their building-level leadership position (17%). Table 27 Tracking the Career Outcomes of Graduates by UCEA Principal Preparation Programs Which of the following graduate career outcomes does this program track? (Select all that apply.) n
Percentage of participating programs
Graduation/program completion rates 90 87% Program retention rates 64 62% Job placement rates 62 60% Job retention rates 12 12% Graduates' satisfaction with program 79 77% School districts' satisfaction with graduate quality 41 40% Job mobility and/or job turnover 9 9% Leadership behaviors or job performance of graduates 15 15% Leader impact data (e.g., school conditions, teacher turnover, other school outcome variables)
17 17%
PROGRAM DEMOGRAPHICS
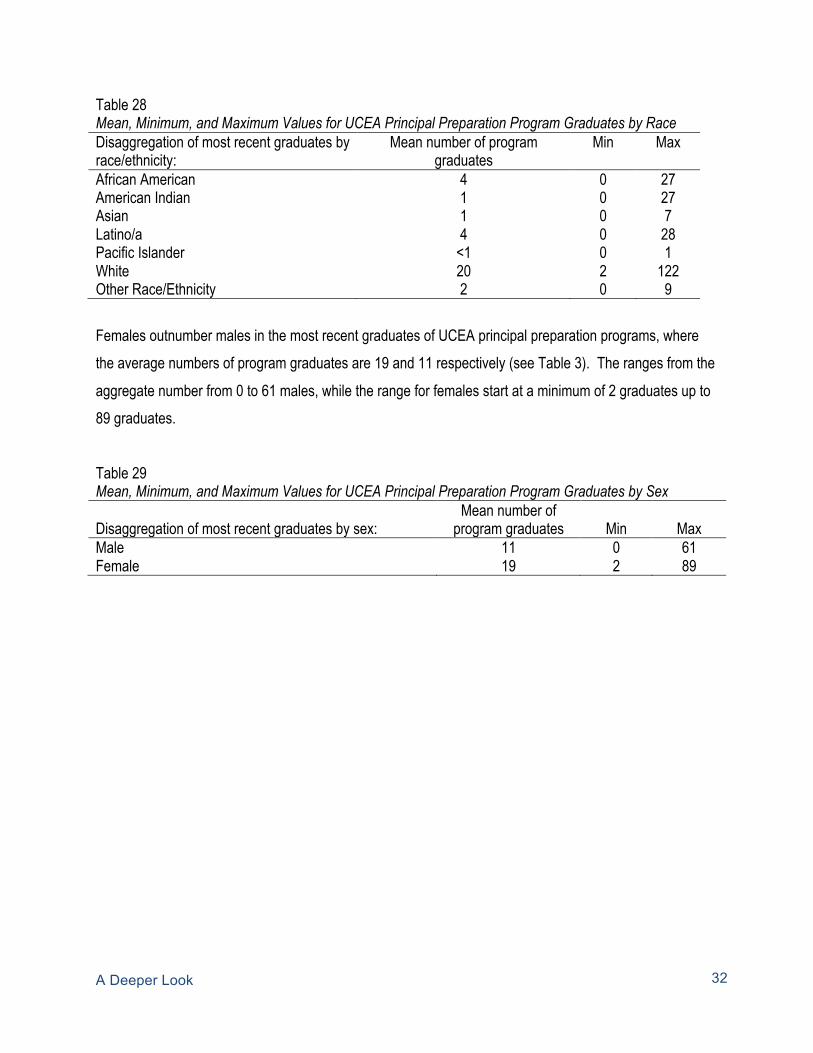
According to the INSPIRE-PP respondents, the demographic breakdown of program graduates varies by race greatly across institutions (see Table 28). When prompted to provide data on programs’ latest graduating class, some programs reported no students of races that are traditionally underrepresented as graduating from their program and others reported up to 28 Latino/a graduates (mean of the aggregate = 4), 27 African American graduates (mean of the aggregate = 1), 27 American Indian graduates (mean of the aggregate = 1), 7 Asian graduates (mean of the aggregate = 1), 1 Pacific Islander graduate (mean of the aggregate = < 1), and 9 graduates of other races (mean of the aggregate = 2). Programs reported a range from 2 to 122 White graduates (mean of the aggregate = 20).
A Deeper Look
32
Table 28 Mean, Minimum, and Maximum Values for UCEA Principal Preparation Program Graduates by Race Disaggregation of most recent graduates by race/ethnicity:
Mean number of program graduates
Min Max
African American 4 0 27 American Indian 1 0 27 Asian 1 0 7 Latino/a 4 0 28 Pacific Islander <1 0 1 White 20 2 122 Other Race/Ethnicity 2 0 9 Females outnumber males in the most recent graduates of UCEA principal preparation programs, where the average numbers of program graduates are 19 and 11 respectively (see Table 3). The ranges from the aggregate number from 0 to 61 males, while the range for females start at a minimum of 2 graduates up to 89 graduates. Table 29 Mean, Minimum, and Maximum Values for UCEA Principal Preparation Program Graduates by Sex
Disaggregation of most recent graduates by sex: Mean number of
program graduates Min Max Male 11 0 61 Female 19 2 89

A Deeper Look
33
High-quality leadership preparation and development are critical to high-quality practice, which in turn optimizes the capacity of schools to support student engagement, student learning, and other important school outcomes. The data from the INSIPRE-PP demonstrate that UCEA institutions reflect many of the structures deemed to be effective preparation practices including:
Alignment to Professional Standards. Programs are aligned to national and state standards reflecting research and professional knowledge concerning excellence in educational leadership.
Partnerships with Districts. Partnering with school districts provides a mutually beneficial relationship for universities and districts. Recruitment, selection, curriculum and program experiences are shaped to meet the pertinent problems of practice influencing partner districts and schools.
Mentoring for Candidates and Novice Leaders. Mentoring offers support to pre-service and novice principals to help guide them as they develop their leadership practice.
Clinical Experience in Schools with Diverse Student Populations. Diverse clinical experiences provide pre-service principals with the opportunity to apply knowledge and skills within authentic practice settings.
Accessible Program Scheduling. Accommodating aspiring principals’ schedules and location allows them to attend classes in a way that respects the reality of working full time.
Course Instruction Provided by Highly Qualified Faculty. Coursework that is primarily taught by highly qualified faculty provides students the opportunity to learn based on the field’s current research and practice. Pairing such instruction with relevant fieldwork can help students bridge theory and practice for school improvement.
Multiple Assessment Practices. Using multiple assessments invites candidates and their faculty, mentors, supervisors and others to comprehensively evaluate candidate progress, shape candidate experiences, and inform program improvement.
CONCLUSIONS

A Deeper Look
34
Career Support. As they enter the job market and while they are serving in their first leadership roles, mentors and university instructors support candidates’ professional capacity through advising and coaching.
In sum, UCEA institutions align their work to national standards for their curriculum and assessment designs, they actively engage in formalized partnerships with districts, they engage their candidates in a variety of assessment practices for formative, summative, and program conclusion purposes, and UCEA programs work to offer coursework to bridge classroom assignments to field-based experiences. Utilizing the INSPIRE Survey Suite is increasing among universities, districts and states. As the use of these surveys gains momentum, the field will benefit from both examining program efforts and proximal and distal program outcomes as well as using INSPIRE data to engender reflective practice and enthusiasm for program improvement that benefits the preparation of educational leaders. Given the changes in the education field and the practice of leadership, leadership preparation programs must engage in a continuous improvement cycle. Recognition of this fact among the members of the UCEA consortium is significant. As a professional organization, UCEA makes ongoing improvement an operational cornerstone.

A Deeper Look
35
Anderson, E. & Reynolds, A.L. (2015). A policymaker’s guide: Research-based policy for principal preparation program approval and licensure. Charlottesville, VA: University Council for Educational Administration. Browne-Ferrigno, T. (2011). Mandated university-district partnerships for principal preparation: Professors’ perspectives on required program redesign. Journal of School Leadership, 21, 735-756. Council for the Accreditation of Educator Preparation Programs (CAEP). What is accreditation. Retrieved from http://www.caepnet.org Fuller, E., Young, M., & Baker, B. D. (2011). Do principal preparation programs influence student
achievement through the building of teacher-team qualifications by the principal? An exploratory analysis. Educational Administration Quarterly, 47, 173-216. doi: 0011000010378613.
Fuller, E. J., Hollingworth, L., & An, B. P. (2016). The Impact of Personal and Program Characteristics on the Placement of School Leadership Preparation Program Graduates in School Leader Positions. Educational Administration Quarterly, 52, 643-674. doi: 10.1177/0013161X16656039 Darling-Hammond, L., LaPointe, M., Meyerson, D., & Orr, M. (2007). Preparing school leaders for a
changing world: Executive summary. Stanford, CA: Stanford University, Stanford Educational Leadership Institute.
Hess, F.M., & Kelly, A.P. (2007). Learning to Lead: What Gets Taught in Principal-Preparation Programs. Teachers College Record, 109, 244-274. Interstate School Leaders Licensure Consortium (ISLLC) standards
Knowles, M. (1996). Andragogy: an emerging technology for adult learning. London: Routledge. Leithwood, K., & Jantzi, D. Coffin, G., & Wilson, P. (1996). Preparing School Leaders: What Works. Journal
of School Leadership, 6, 316-342. Levine, A. (2005). Educating School Leaders. New York, NY: The Education School Project. National Policy Board For Educational Administration (2011). Educational Leadership Program Recognition Standards: Building-level. Retrieved from www.ncate.org Orphanos, S., & Orr, M. T. (2014). Learning leadership matters The influence of innovative school
leadership preparation on teachers’ experiences and outcomes. Educational Management Administration & Leadership, 42, 680-700. doi: 10.1177/1741143213502187
Orr, M. T., & Orphanos, S. (2011). How Graduate-Level Preparation Influences the Effectiveness of School Leaders: A Comparison of the Outcomes of Exemplary and Conventional Leadership Preparation Programs for Principals. Educational Administration Quarterly, 47(1), 18-70. doi:10.1177/0011000010378610
Orr, M.T. (2010). Pipeline to preparation to advancement: Graduates’ experiences in, through, and beyond leadership preparation. Educational Administration Quarterly, 41, 114-172. doi: 10.1177/001100001078612
REFERENCES
A Deeper Look
36
The Wallace Foundation. (2016). Improving University Principal Preparation Programs: Five Themes From the Field. New York City: Author.
University Council for Educational Administration & New Leaders. (2016). SEP3 Toolkit. Charlottesville, VA: UCEA
Young, M.D., & Crow, G. M. (2017). Introduction. In M. D. Young and G. M. Crow (Eds.), The handbook of research on the education of school leaders, 2nd Edition. New York, NY: Routledge.
Young, M. D., Crow, G. M., Murphy, J., & Ogawa, R. (2009). The handbook of research on the education of school leaders. New York, NY: Routledge.
Young, M.D, Orr, M.T., & Tucker, P.D. (2012). Institutional and Program Quality Criteria: Guidance for Master’s and Doctoral Programs in Educational Leadership. Charlottesville, VA: UCEA.