a declarative graphics system for pythonconference.scipy.org/scipy2011/slides/wang_metagraph.pdf ·...
TRANSCRIPT

MetagraphA Declarative Graphics System for Python
Peter Wang@pwang
Streamitive, LLC
I’m going to talk fast because I don’t have much time and there’s a lot of ground to cover. The title of my talk is ..., but in fact it could just as well be called:

MetagraphA New Architecture for Array Computation
Peter Wang@pwang
Streamitive, LLC
This is because as I was building out and thinking about the graphing system, I realized that what I really needed was at a more fundamental level, in fact so fundamental that it’s kind of a re-envisioning of vector computation in a high-level language.

MetagraphThe Virtue of Figuring Out What You’re Doing
Before You Name Your Project
Peter Wang@pwang
Streamitive, LLC
In a sense, the talk could also be an object lesson in figuring out what you’re doing before becoming enamored with a name and getting the domain and all that stuff. Because there really is enough to talk about to cover twice the amount of time we have. But whatever, what’s in a name, right?

Chaco
Many of you know me as the author of Chaco, an interactive plotting toolkit that we developed at Enthought to address the plotting needs in our various applications. That is, we needed interactivity, and we needed fast redraws, and we needed it to be extensible.
There was always the problem of it being too verbose. Ultimately one is explicitly building a graphics pipeline, and hooking up data to consumers/renderers. Creating custom renderers/graphics requires more code.
For a long time, tried to come up with a re-architecting or re-casting of the graphics problem that captures the mathematical basis of graphics in a much more unified way.

Grammar of Graphics
In 2005, Leland Wilkinson wrote this book, and I found out about it a year or two later. Robert Kern presented the Grammar of Graphics in a talk at Scipy 2008.
Grammar of Graphics
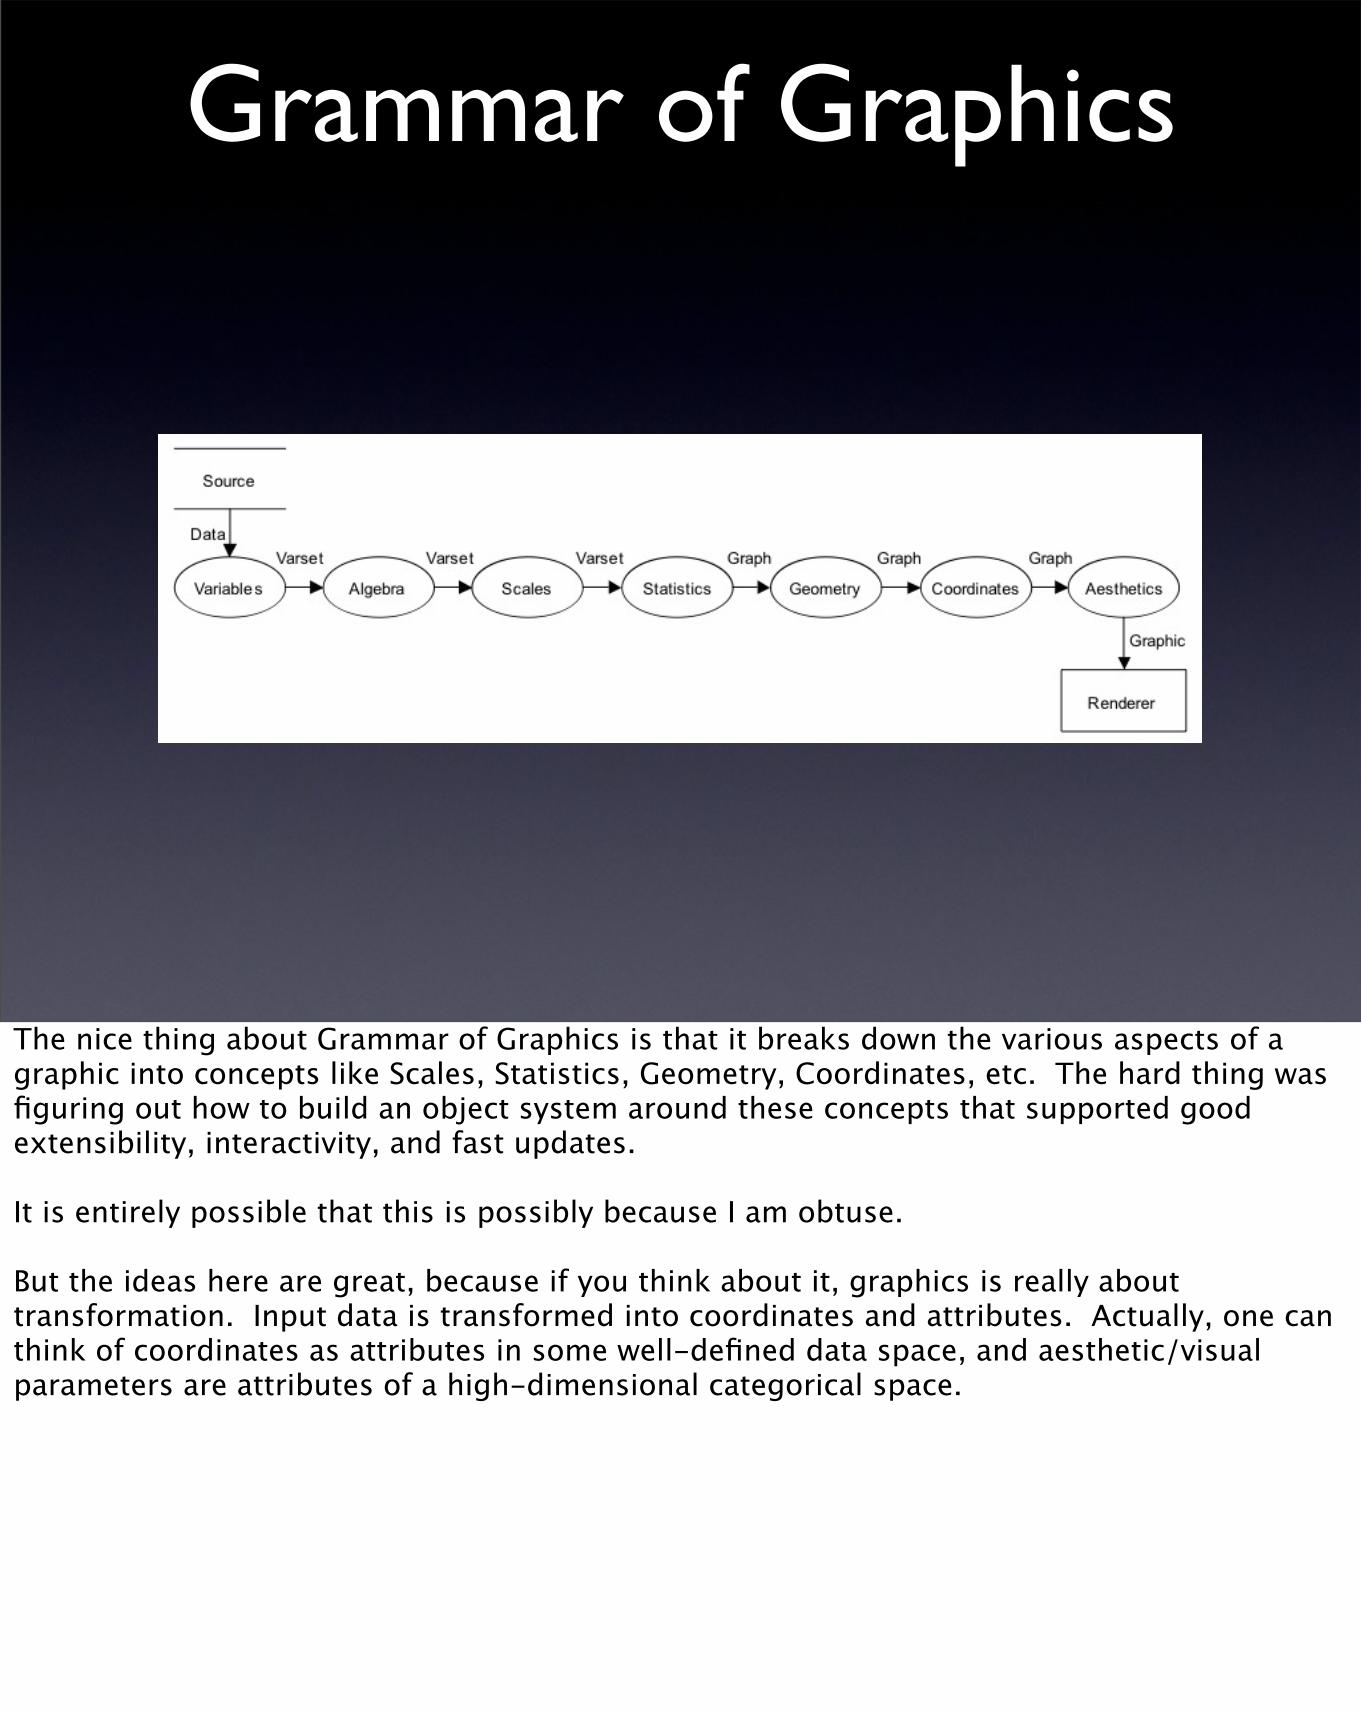
The nice thing about Grammar of Graphics is that it breaks down the various aspects of a graphic into concepts like Scales, Statistics, Geometry, Coordinates, etc. The hard thing was figuring out how to build an object system around these concepts that supported good extensibility, interactivity, and fast updates.
It is entirely possible that this is possibly because I am obtuse.
But the ideas here are great, because if you think about it, graphics is really about transformation. Input data is transformed into coordinates and attributes. Actually, one can think of coordinates as attributes in some well-defined data space, and aesthetic/visual parameters are attributes of a high-dimensional categorical space.

Protovis
I first encountered Protovis in 2010. Was very excited about the novelty of it, later realized that they were not the first to take the approach (Stencil by Cottam & Lumsdaine; declarative visualization in Haskell by Duke et al).

Stencil: A Declarative, Generative System for Visualizing Dynamic Data
“Traditional library use necessitates familiarity with the data structures and control flows that are integral to traditional programming, but not central to visualization. Additionally, many library based visualization tools do not explicitly address interaction issues, forcing programmers to fall back on language provided interaction metaphors instead.”
Joseph Cottam, Andrew Lumsdaine

• Existing graphing toolkits are primarily suited for software developers. Want to give low-level control of the graphics to non-expert developers.
• Implement the core ideas of Protovis and Stencil in a Python system that also affords parallelism and handles large data.
Motivations
Protovis itself arose from a very simple motivation.Metagraph builds on that to target large data and scalable visualization, which are my bailiwick.

• Very simple grammar
• Marks: graphical primitives (Bar, Line, Dot, Area, Image, Rule, Wedge)
• Data: arrays of values which are associated with attributes of the primitives
• Marks can use transformations of other Marks’ attributes as the value of their attributes.
Protovis Overview
In Numpy land, we are familiar with manipulating arrays by writing expressions which act as kernels, evaluated at each element in the array. Protovis extends this by providing kernels of visualizations, and allowing users to treat them as pseudo-mathematical objects.

Simple Example
Even if you don’t know Javascript, this should be pretty straightforward. It’s giving the bar plot some data, and setting a fixed bottom and width for every bar. It’s then using a callback to compute both the height as well as each successive “left” position.

Protovis Gallery

Another Example
You can see here that it’s a very constructionist approach towards building up a graph or visual.
So now that you’ve all seen this, I bet most of you are thinking, “Well doing this in Python should be a piece of cake! Maybe a couple of weekends, max.”
Well, maybe not everyone thought that, but that's certainly what I thought. So I went ahead and did a prototype using some Chaco.Component as a base class for marks.
Early “Chacovis”
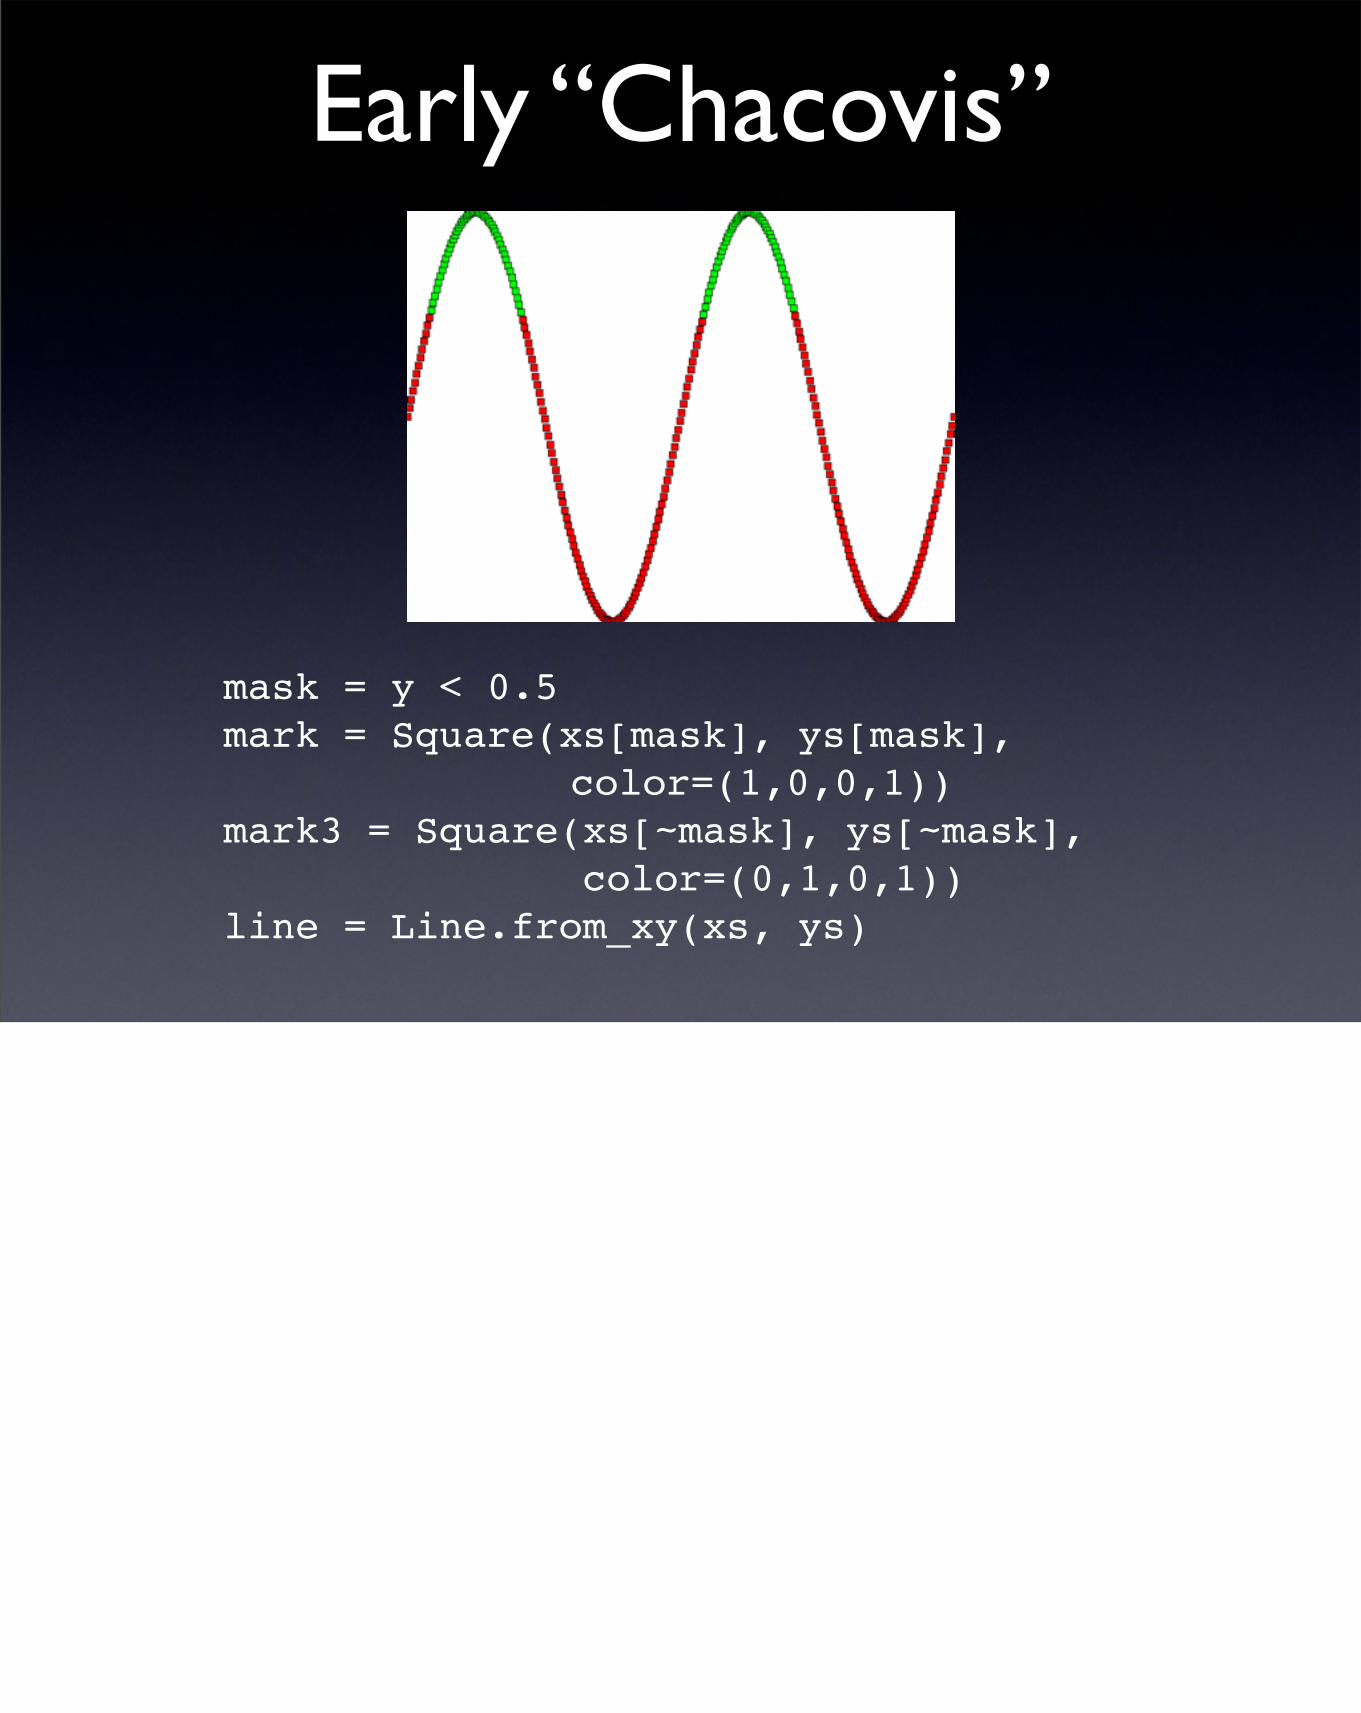
mask = y < 0.5mark = Square(xs[mask], ys[mask], color=(1,0,0,1))
mark3 = Square(xs[~mask], ys[~mask], color=(0,1,0,1))line = Line.from_xy(xs, ys)
More “Chacovis”
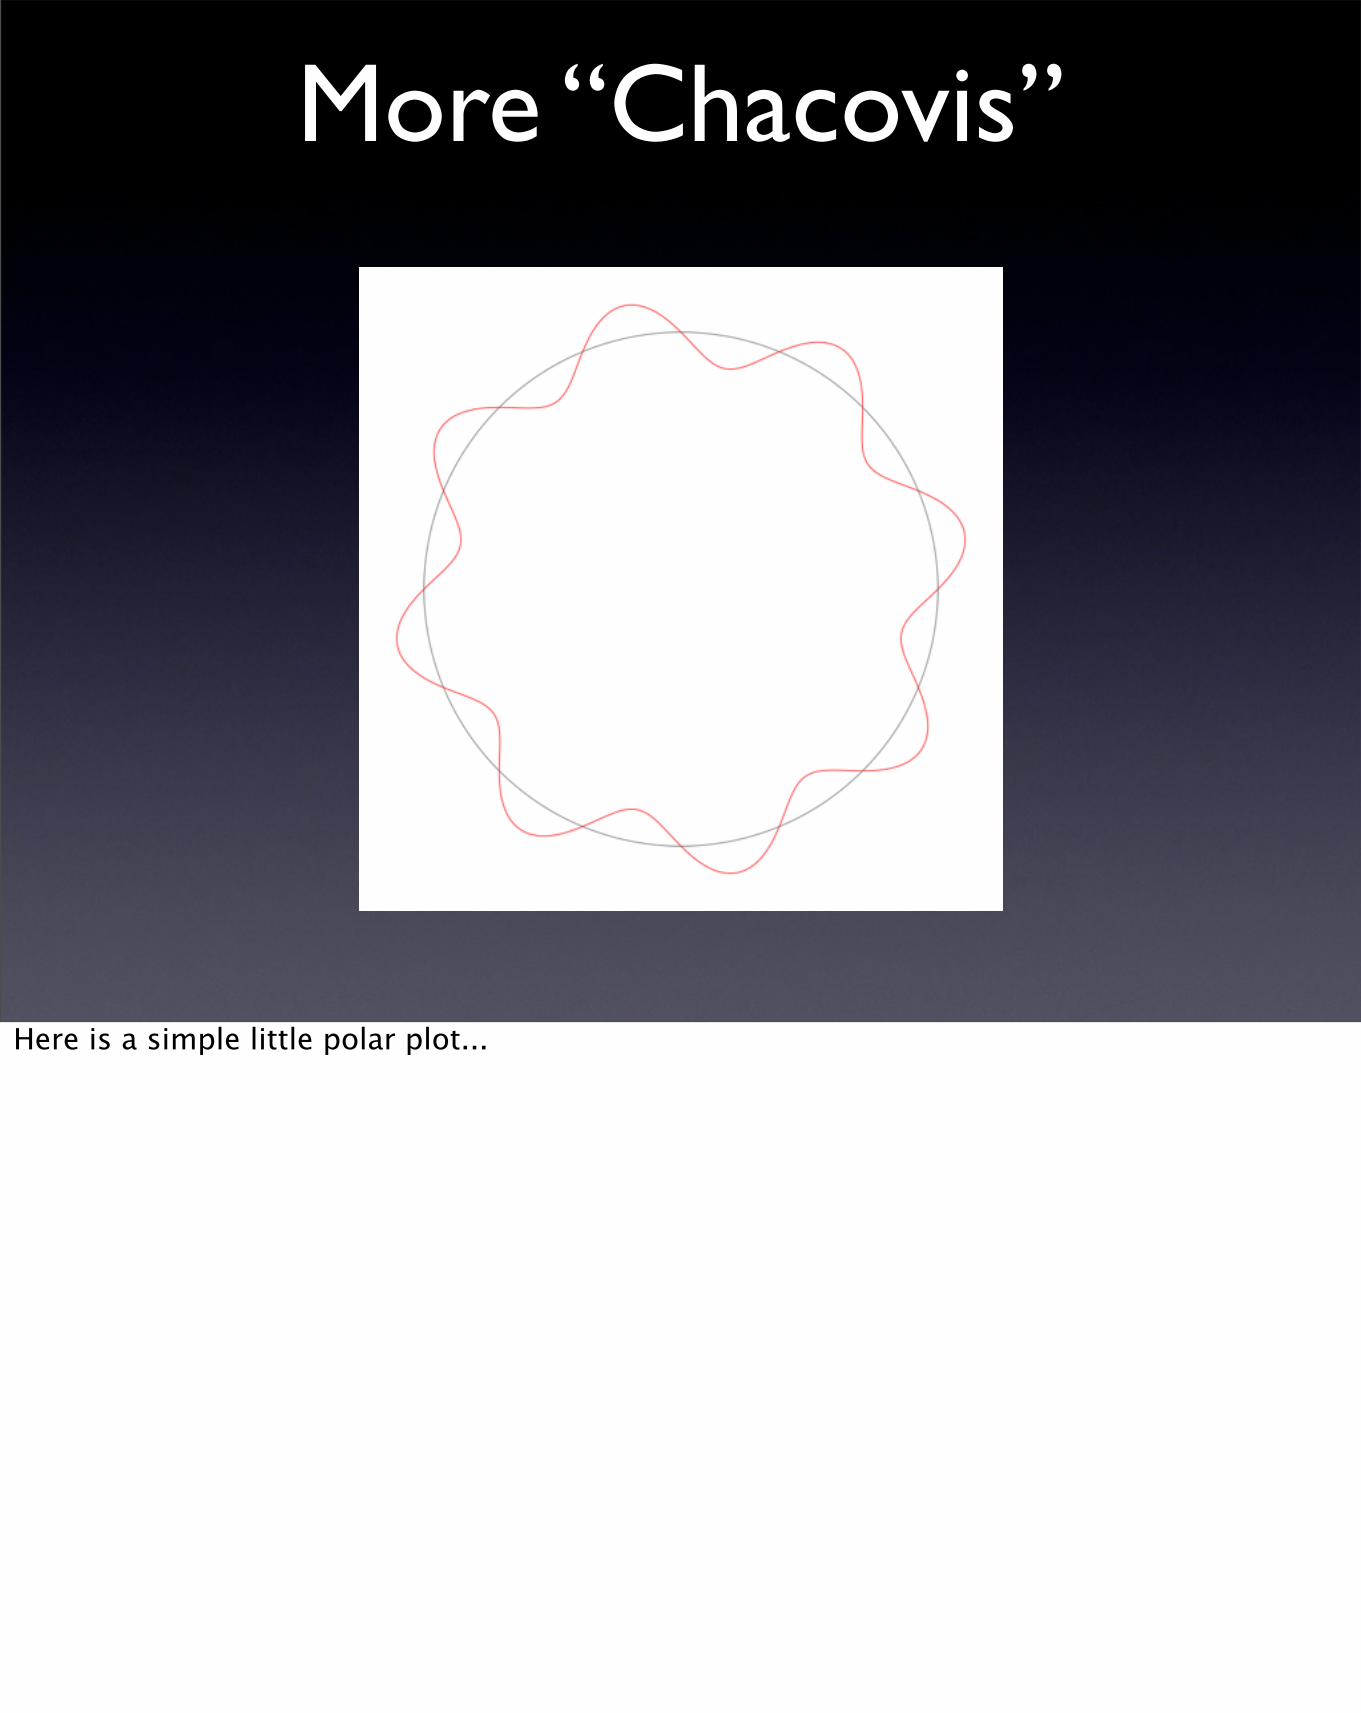
Here is a simple little polar plot...

More “Chacovis”
And here is a somewhat more involved polar plot. We are building wedges, and stacking them on top of each other.
All in all, it basically worked, but I didn’t get around to area/stacked area plots, because I noticed a problem.

Slight Problem
Let’s look at this Protovis javascript example.
It's very useful to pass in anonymous code blocks for transformation of data. However, while you can do the analogue of this in Python (using named functions, of course), you certainly don't want to be calling a Python function for each data point. In Javascript, anonymous functions are idiomatic, so interpreters are heavily optimized for this. In Python, function call overhead is very expensive.

Mathematical vs. Imperative
Mathematics
a,b = get_data();
x = a*width + offsetx;
y = b*height + offsety;
Code
a,b := get_data();
x := a*width + offsetx;
y := b*height + offsety;
If you look, these functions are mostly just simple mathematical transformations.In general, Python code is written imperatively. This is full of side-effects and such that make it difficult to optimize or reason about programmatically.
But in scientific programming, a lot of that code turns out to be mostly single-assignment form (or close to it), because people are setting up transformation pipelines on their data. There may be some involved kernels with lots of local variables and some state, but the overall flow of the code is about transformation.
Actually, plotting (and even 3D graphics) is not really much different in this regard.

• Instead of directly operating on bare arrays, we can use deferred or lazy-eval Numpy, which build out an expression graph
• Treat the expression graph as a dataflow
Dataflow
So a natural idea would be to take the Python expression tree and treat it as a dataflow. This means that instead of operating on bare arrays and requiring functions that operate on them, we can instead take expressions that use *deferred* array objects, and which build out an expression graph. This isn't really that new of an idea; various other project have done similar things.
But for graphics, I also needed to be able to express a somewhat richer set of transformations. I also needed to make "graphical ufuncs" to do the evaluation.

Fast ufuncs
def myfunc(cond, x1, x2):if cond:
return x1**2 + x2**2else:
return x1**2 - x2**2
plot = Bar(left=x, bottom=0, width=20, height=y)plot2 = plot.height(myfunc)
Furthermore, if we are going to require users to build on a transformation graph instead of the normal imperative style they are used to, then we need more flexibility in how to define the computation kernels.
There's the possibility of using something like Ilan's fast_vectorize, which uses PyPy's translation mechanism to build a C function out of your Python function, on the fly, and passes that in. It’s pretty slick, but it requires an extra compile step, and you still have the overhead of a C function call. It’s not inlined into the same for-loop that is traversing the array.
So I needed something that was both expressive enough to capture all of the ufuncs that I need for a comprehensive declarative graphics system, but was fast enough to run on large data and achieve interactive framerates. And also I wanted to avoid the compile step each time you modify the graphic a little bit.

Evaluating the Graph
a,b,c = get_data()x = (b-a)/2y = c / c.max()sx = x*width + offsetxsy = y*height + offsety
So here is some simple code for loading some data and transforming it to screen coordinates. It’s obviously very oversimplified, but it captures the essence.
By replacing all the Numpy functions, methods, operators, and constructors with versions that produce ArrayProxies, executing this code fragment generates an evaluation graph like:

Evaluating the Graph
Now, there may be a question of, “Why don’t you just walk the AST?” There’s a long answer, and there’s a short answer. The short answer (and probably the best answer) is that walking the AST is tricky, and you don’t know when you’ve fallen off of the part of the graph you care about, and into the part that you can’t handle. The long answer involves a lot of soapboxing about programming languages, paradigms, and square pegs and round holes.
More importantly, though, by using an ArrayProxy object, we can allow the user to tell us and to explicitly control what parts are part of the evaluation graph, and what parts are not. Explicit is better than implicit.

Translating the Graph
b.get a.get - 2 /x:
sx: b.get a.get - 2 / width * offsetx +
c.get c_max /y:
sx: c.get c_max / height * offsety +
Metagraph now walks this graph, and produces an intermediate representation for a stack-based language. For those who don’t know what a stack based language is, think back to your old HP calculator and RPN. The most well-known stack language is FORTH, but the most used one is probably Postscript.
The main idea is that calling functions is super cheap, because there is no saving of registers, etc. Instead, all the functions leave their arguments and return values on a single data stack.
The stack virtual machine that executes this IR has iterators for each of the arrays, and it surrounds these kernels with the machinery for incrementing the iterators. I don’t want to get too much into the weeds about the low-level details of FORTH, but it basically has no syntax, and everything is an applicative function. So a.get calls into the iterator, which will return the value of the iterator for this cycle through the loop.

WTF FORTH LOL

• Function call overhead in the inner loop is bad
• However, we want an expressive core
• Don’t need lots of fancy control logic
• Easy to reason about programmatically, so potential for lots of future optimizations
Why a Stack Language?
Because the kernel needs to be evaluated at each point, it needs to evaluate quickly. Traditional function call overhead can be expensive.However, to address the needs of graphing and data transformation, it needs to be fairly expressiveThat being said, since we are dealing pretty much strictly with numbers and math, we don't need a lot of fancy control logic.This really fits a stack language very well. Most people don’t think about languages like FORTH or Postscript when they want to solve their problems, but they’re still widely used. Most programmers haven’t heard of stack languages because they tend to be used in places where code needs to be fast and robust. Most people don’t actually care about that as much as they say they do. :)

• Derived columns
• Interpolation
• Interleave, re-indexing
• Windowing / moving average
Functional Iterators
Another cool thing is that since the iterators for each constructor or upstream data source are called by the stack VM each time through the loop, we can put some conditional logic and some local state into each of the iterators, so they are no longer merely just dumb for-loops.You can create derived columns in a data array, or dynamically do interpolation on-the-fly when two dissimilar arrays are passed into a binary function.So rather than going top-down and beating your data into aligned, uniformly strided arrays, you can write generators that present your data to the computation kernel.
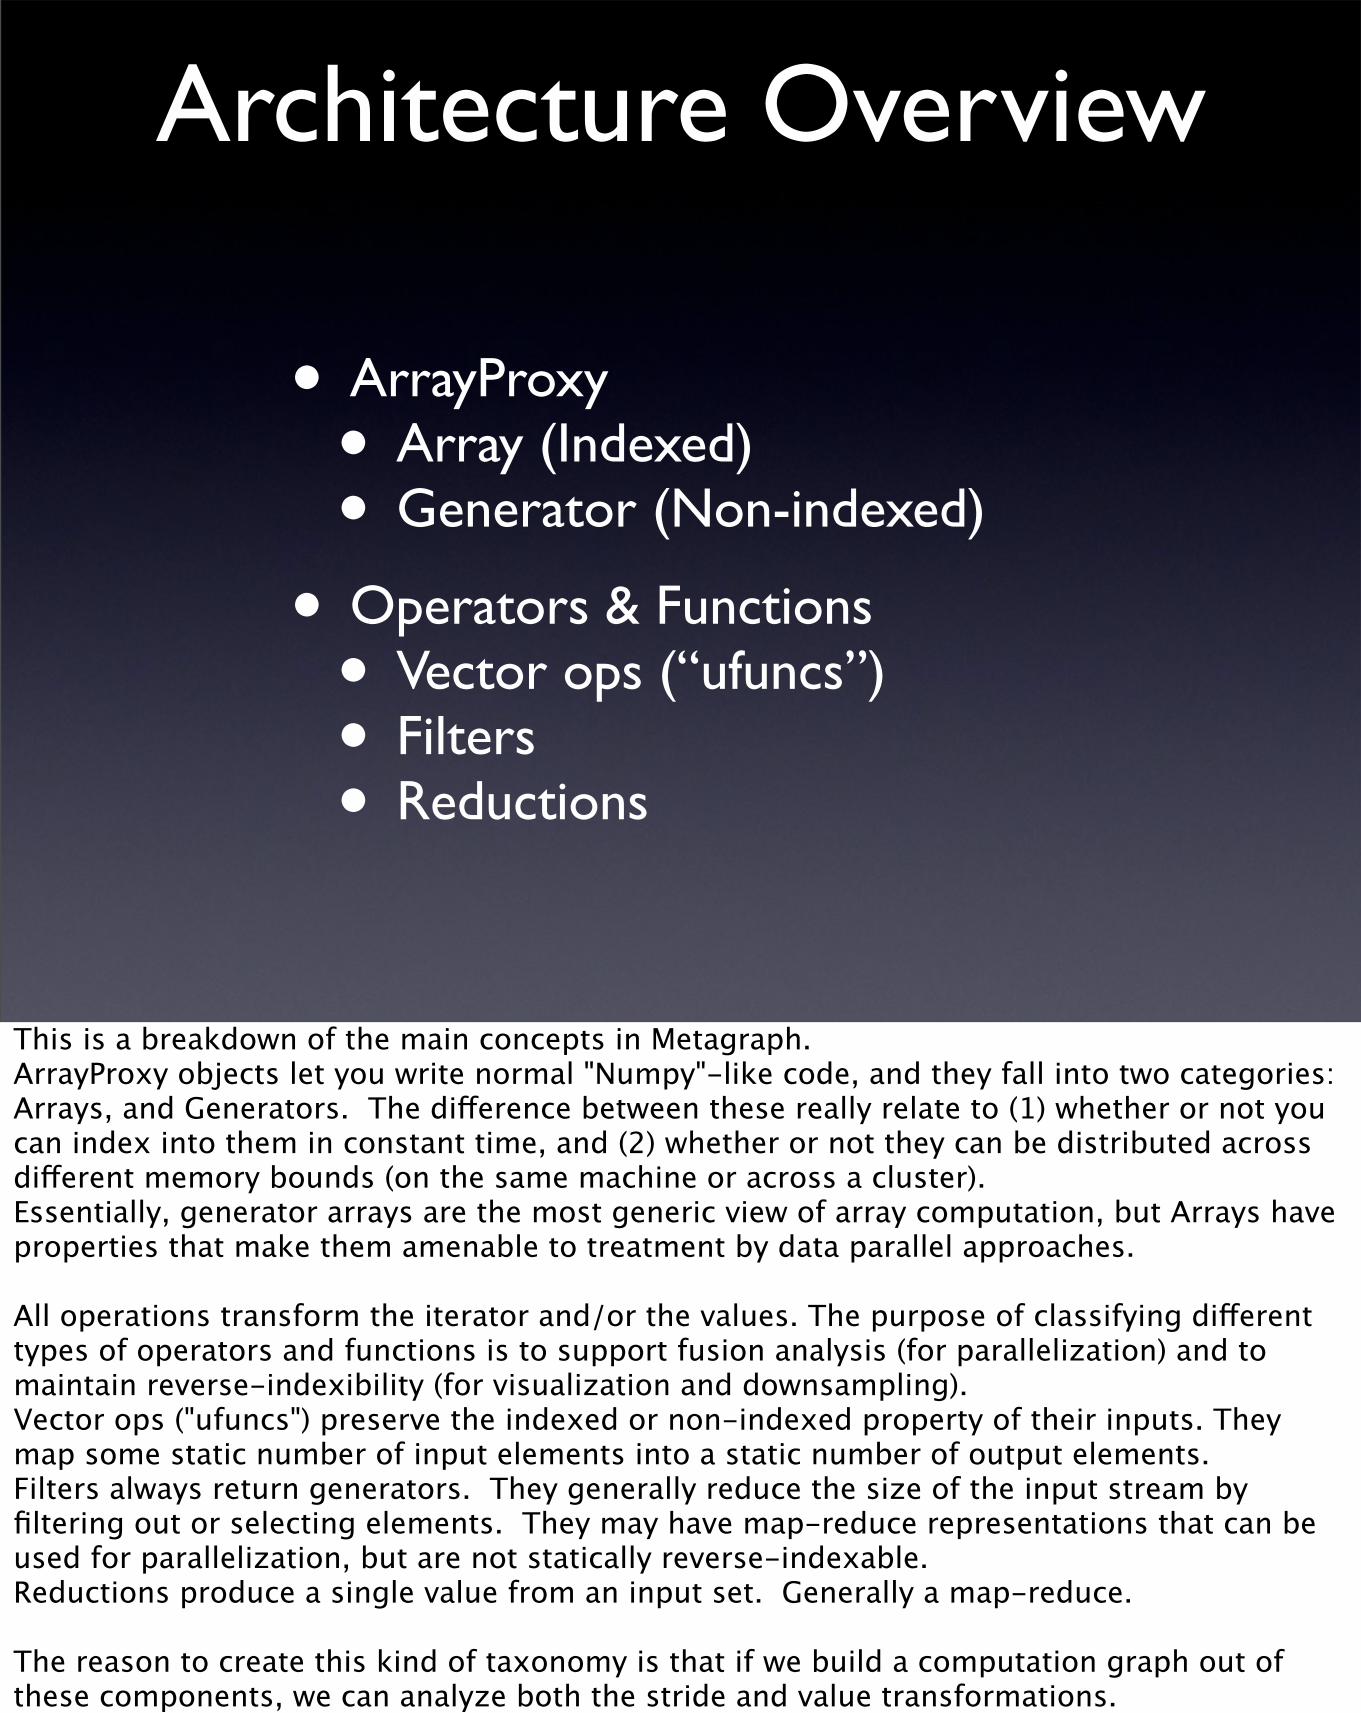
• ArrayProxy• Array (Indexed)• Generator (Non-indexed)
• Operators & Functions• Vector ops (“ufuncs”)• Filters• Reductions
Architecture Overview
This is a breakdown of the main concepts in Metagraph.ArrayProxy objects let you write normal "Numpy"-like code, and they fall into two categories: Arrays, and Generators. The difference between these really relate to (1) whether or not you can index into them in constant time, and (2) whether or not they can be distributed across different memory bounds (on the same machine or across a cluster).Essentially, generator arrays are the most generic view of array computation, but Arrays have properties that make them amenable to treatment by data parallel approaches.
All operations transform the iterator and/or the values. The purpose of classifying different types of operators and functions is to support fusion analysis (for parallelization) and to maintain reverse-indexibility (for visualization and downsampling).Vector ops ("ufuncs") preserve the indexed or non-indexed property of their inputs. They map some static number of input elements into a static number of output elements.Filters always return generators. They generally reduce the size of the input stream by filtering out or selecting elements. They may have map-reduce representations that can be used for parallelization, but are not statically reverse-indexable.Reductions produce a single value from an input set. Generally a map-reduce.
The reason to create this kind of taxonomy is that if we build a computation graph out of these components, we can analyze both the stride and value transformations.

• __op__
• Math ufuncs
• Most constructors (ones, zeros, etc.)
• itertools-like: chain,cycle,izip
Vector Ops
These are the functions that are subject to array fusion. The general rule of thumb is, if I want a certain stride or slice of the output, can I back out just how much of the input I need? If so, then we can do array fusion with it.

• cumsum, cumprod
• take (fancy indexing)
• nonzero, searchsorted
• trim_zeros
• LINQ: takewhile, skip, skipwhile, first, firstordefault, last, lastordefault
Generators / Filters
Here are some examples of generators or “filters”, as I sometimes call them. The rule of thumb is that you can’t figure out the index in the input of the Nth element of the output without figuring out the N-1th element.

• any, all, unique, single
• max, min, argmax, argmin
• mean, std, var
• sum, prod, nansum
Reductions

• Driven by relationship between iterators
• Array Fusion: Reduce temporaries while preserving striding/parallelization of underlying arrays
• Generator Fusion: Reduce number of times needed to loop over some data (merging of predicates)
Array/Stream Fusion

Fusion
a,b,c = get_data()x = (b-a)/2sx = x*width + offsetx
y = c / c.max()sy = y*height + offsety
Let’s go back to our previous code example. If I want the first 1000 elements of sx, I can look at the graph and statically determine that I need the first 1000 elements of A and B, and I know exactly what I need to do to them, to generate the output.
However, the same cannot be said for sy. Or rather, the same can be said for sy, but I know that I will need to get *all* of C before I can get even the first element of sy.
The former block is said be to “array fusable”, and the latter is not.

Generator Fusion
a = a[a>5].cumprod() .skipwhile(a%7==0)
The point of generator fusion (or stream fusion, as the Haskell folks call it) is to turn this into a single pass over A.
Functional languages have a more powerful mechanism for expressing anonymous functions as predicates, namely, the Let operator, but with intelligent graph traversal, we can do quite a bit with expressions.

Generator Fusion
a.get DUP 5 > IF $cumprod * a.get 7 % 0 == IF a.next ELSE return ENDIFELSE a.nextENDIF
Here is the IR code for the previous. This kernel then operates on a single pass over A. Those of you who know some FORTH will see that I’ve replaced THEN with ENDIF, because I think that looks less screwed up.
• Reified Compute Graph: New data can be efficiently pushed through the graph and appended to output
• Low-level Events
Streaming Data
Two features of Metagraph are key to supporting streaming data.
Preserving the compute graph means that new data appended to input arrays can be pushed through the graph and appended to the output, without requiring an expensive recompute of the entire array.
Vectorized events means that changes in upstream values can trigger updates downstream, without polling and diffing.

• Isn’t stride math hard when you have non-uniform arrays and such?
• What about windowing kernels?
• Doesn’t this only work for really simple cases?
Questions & Issues
stride math: Yes. But it’s tractable.
Windowing kernels, convolutions, etc.: I don’t have these implemented, but I have a great story to tell! (It’s an act, it’s a family act. It’s about the family of languages from which Numpy’s precursors came from, and where they’re at now. I’d encourage folks to look at ZPL / Chapel and their Regions concept.)
A lot of actual real-life use cases are actually pretty trivial. e.g. timeseries analysis consists of (1) handling data interpolation and imputation, (2) providing stats functions and sliding windows, (3) providing basic arithmetic and max/min/clip sort of functionality, and (4) doing all these when you drink from the firehose.
I’d encourage folks to look through their codebase and note the places where they are really just doing bulk vectorized operations, maybe with some offset slicing. That’s all fusable and parallelizable.

• Array proxies implementing most Numpy functions
• Fusing compiler
• Pure-python stack VM with Numpy extensions
Status

• Fast, multithreaded VM (Cython? PyPy? CorePy?)
• Smarter Scheduler (for task-parallel generator fusion)
• Supporting more complicated shape transformations
• Comprehensive tests
Next Steps

• Composite Arrays
• Remote/Distributed Arrays
• Streams (streamaxis)
• FFI for dispatch to custom C functions
Future Work

• Can be thought of as a “soft GPU” that is distributed
• Not perfect for every problem, but good for many very common ones
• Many different kinds of optimizing backends
A Software Architecture for SIMD
Ultimately, what I’m trying to implement is a software architecture for SIMD.
Why?

• The goal is not to dogmatically keep Python in scientific computing.
• The goal is to make scientific computing Pythonic.
The Important Thing

• A substrate that is relevant to modern challenges:
• Large data
• Streaming data (timeseries)
• Parallel Computing
• Interactive Visualization
What is needed?
Numpy has been successful because it addresses a core need: elegant, easy handling of uniformly strided data.
But there are a larger number of modern challenges. Well, they’re long-standing challenges, but in modern times, more and more people are having them.

• Fractured Ecosystem
• Pandas, larray, dataarray
• carray, Global Arrays
• numexpr
• GPU libs (PyStream, Copperhead, etc.)
What do we not want?
Everyone is trying to do arrays beyond Numpy. Not because they don’t like Numpy, but rather because they *do* like Numpy.
The problems are just bigger now.

• We need to generalize the array computation model beyond the dtype
• Everyone is doing code generation; we are having to leave the primitives that Python provides.
• Let’s provide better primitives.
Arrays Beyond the dtype
There's a reason why there is so much interest in functional languages like F#, Haskell and Clojure right now, and it's because they are amendable to parallelism. We happen to live in a mostly-functional neighborhood of a very imperative ecosystem, but we're lucky that our language Python is flexible enough for us to reap some of those same functional benefits.
We need to generalize the array computation model beyond the narrow confines of local, contiguous memory. Otherwise, we will have splintering of community: some tools don't support timeseries, or carrays, etc.

More Information
http://metagraph.org
@pwang @streamitive
(Not @metagraph, because some d-bag is squatting it.)