a decade of the new markets tax credit · pdf file3 introduction the new markets tax credit...
TRANSCRIPT

A REPORT BY THE NEW MARKETS TAX CREDIT COALITION
December 2014
A Decade of the New Markets Tax Credit
An Economic Impact Analysis

2
1331 G Street, NW, 10th Floor • Washington, DC 20005 (202) 393-5225 • (202) 393-3034 fax • www.nmtccoalition.org • @nmtccoalition Rapoza Associates prepared this report for the New Markets Tax Credit Coalition. Novogradac & Company LLP modeled much of the report’s economic impact data. The New Markets Tax Credit (NMTC) Coalition is a national membership organization that advocates on behalf of the NMTC program. The Coalition is managed by Rapoza Associates, a public interest lobbying, policy analysis, and government relations firm located in Washington, DC that specializes in providing comprehensive legislative and support services to community development organizations, associations and public agencies. Rapoza Associates prepared this report and Paul Anderson was the principal author. Special thanks to David Grubman of Novogradac & Company for his hard work on the economic modeling.
3
INTRODUCTION The New Markets Tax Credit (NMTC) was enacted in 2000 as part of the bipartisan Community Renewal
Tax Relief Act (P.L. 106-554), which then President Bill Clinton called “the most significant effort ever to
help hardpressed communities lift themselves up through private investment and entrepreneurship”1.
After decades of using grants for general economic development, Clinton – and his partner across the
aisle, Speaker of the House Dennis Hastert – chose to use the tax code as an economic development
tool, following the cost-effective model of the Low Income Housing Tax Credit.
The purpose of the new tax incentive was to spur private sector investment in economically distressed
urban and rural areas often left out of the economic mainstream. While not explicitly intended as a job
creation initiative, mayors, local leaders, and community development practitioners soon learned that
with billions in new investment comes thousands of jobs, from construction employment to new full-
time positions at manufacturing facilities, healthcare clinics, small businesses, and other new ventures.
The NMTC was created to address a persistent problem in economically distressed areas: despite the
presence of attractive business opportunities and untapped demand, the cost and scarcity of patient,
flexible capital is a substantial impediment to local economic growth. Underserved communities face
challenges in securing conventional commercial loans, including: lack of investor familiarity; perceived
risk; lingering effects of past discrimination; and difficulty of obtaining formal market data. Whatever
the reason, many of the cities, neighborhoods, and rural communities targeted by the NMTC have
experienced decades of stagnation and disinvestment that stubbornly persisted even during the 1990s,
a period of extraordinary economic growth.
In order to ease the flow of private sector investments to these communities and promote an economic
turnaround, the NMTC provides investors with a modest federal subsidy. Businesses, entrepreneurs,
nonprofit service providers, community development professionals, and leaders with deep ties to their
local communities put that capital to work, creating jobs, breaking ground on important revitalization
projects, and ultimately, jumpstarting local economies.
There is little doubt that the NMTC has succeeded in its chief goal of delivering capital to highly targeted
low-income communities. In fact, this is easily verified, as the Department of Treasury publishes public
data with location and characteristics of all NMTC transactions. Since the first NMTC project in 2003,
the NMTC has supplied $31 billion in private capital to communities with high poverty rates, low
incomes, and high unemployment rates. This $31 billion leveraged an equal amount of capital from
other public and private sources, financing everything from urban health care centers to rural factories
and small business loan funds. Seventy-six percent of those NMTC investments went to severely
distressed communities that far exceed the statutory requirements for economic distress.
There has been ample research on the NMTC’s track record of delivering capital to our most challenged
communities. However, researchers had not attempted to quantify secondary economic impacts such as
job creation, increased regional consumption, and tax revenue generation until December of 2012,
when the New Markets Tax Credit Coalition released the NMTC Economic Impact Report. The report
analyzed the impact of nearly 3,000 NMTC projects closing between 2003 and 2010. This report is an
1 The President’s Radio Address, December 16, 2000.
4
update of the Coalition’s 2012 report. It includes an analysis of NMTC transaction data from two
additional years: 2011 and 2012.
Executive Summary Our findings show that the between 2003 and 2012, the New Markets Tax Credit (NMTC) created nearly
three-quarters of a million jobs, generated well over $100 billion in economic activity in long-distressed
communities, and expanded the tax base of state and local governments. Our research found a
significant return on NMTC investment to federal taxpayers.
There are six key findings in this report:
1. From 2003 to 2012, NMTC investments generated nearly $118 billion in economic activity,
creating 744,267 jobs in low-income rural and urban communities, including 457,487
construction jobs and 286,781 full-time equivalent jobs in nearly every industry sector of the
economy;
2. The NMTC targets about 40 percent of nation’s census tracts that meet the statutory
requirements for economic distress. However, most NMTC financing goes to severely
distressed communities that far exceed program requirements for poverty and income.
From 2003 to 2012, seventy-six percent of NMTC projects were located in severely
distressed communities;
3. The federal tax revenue generated by NMTC investments more than pays for the cost of the
program. For example, in 2012, the NMTC generated $15.2 billion in economic activity, and
this activity generated $984 million in federal tax revenue, more than enough cover the
$800 million annual cost of the program in 20122;
4. By stabilizing and revitalizing local economies, the NMTC helps boost tax revenue for state
and local governments. In 2012, NMTC investments nationwide generated $542 million in
state and local tax revenue;
5. Beyond creating jobs and generating economic activity, the NMTC helps enhance
community revitalization efforts by financing community facilities and other important
quality of life amenities. Between 2003 and 2012, more than 1,200 NMTC projects involved
community amenities like healthcare facilities, schools, nonprofit service providers, and day
care centers; and
6. Over the years as the program has matured, NMTC financing has increasingly gone to rural
communities, areas experiencing severe economic distress, and community facilities like
healthcare clinics.
2 Data from the Joint Committee on Taxation, Estimates of Federal Tax Expenditures for Fiscal Years 2011-2015 (JCS-I-12), January 17, 2012, was used to estimate the cost of the NMTC for calendar year 2012.
5
Methodology This goal of this report was to measure the aggregate economic impact of NMTC investments over the
course of the program. It also examines the extent to which the federal tax revenue generated by
individuals and businesses benefiting from NMTC investing offsets the cost of the program to the federal
government. The methodology is similar to the NMTC Coalition’s December 2012 economic impact
report, with several minor changes.
Rapoza Associates, on behalf of the New Markets Tax Credit Coalition, once again retained Novogradac
& Company LLP, a public accounting firm, to create an input/output model using the IMPLAN software.
IMPLAN is an economic impact assessment software system originally developed by the USDA Forest
Service and now maintained by the Minnesota IMPLAN Group (MIG). It combines a set of extensive
databases concerning location specific trade patterns and other economic multipliers and demographic
statistics with a highly refined and detailed system of modeling software.
Novogradac used IMPLAN to measure the impact of over 3,800 NMTC projects and businesses in
economically distressed urban and rural communities.
Inputs:
Our principle data source was NMTC transaction data covering 2003 to 2012 from the administering
agency for the NMTC, the Community Development Financial Institutions (CDFI) Fund of the Department
of Treasury.
The CDFI Fund’s data collection system is more robust and comprehensive than any other federal
economic development program. The Fund continues to enhance and refine its efforts to collect data on
the nature and impact of NMTC transactions and to track the progress of CDEs in deploying NMTC
allocation to low-income communities.
The CDFI Fund collects data on the NMTC through the Community Investment Impact System (CIIS), a
web-based data collection system. Through CIIS, CDEs provide project and transaction level data on
more than 150 variables and metrics, including but not limited to: the amount of capital provided to a
qualified business; the nature of the financial products provided to a business; the jobs created by a
project; characteristics of the census tract where the project is located; and many more. The Fund
makes much of this data available to the public on its website for use by researchers and policymakers.
Our team conducted supplemental research to verify the CIIS data and learn more about the nature of
each NMTC project. Thanks to the work of our research team and the data collection efforts of the CDFI
Fund, we were able to analyze impacts for nearly every NMTC project closing between 2003 and 2012.
Thus, our analysis does not suffer from a sampling error.
The CDFI Fund’s data – along with further investigation about the nature of each project – factored into
assumptions on the proportion of project financing going to operational and construction spending.
These proportions were critical to quantifying the construction and operational impacts of a given
project. NMTC projects were further divided into 30 industry categories. The model incorporated
distinct industry-level assumptions about construction to operational project spending ratios informed
by research team’s extensive experience modeling economic, analyzing, and profiling tax credit financed

6
development projects. The CDFI Fund’s reported jobs data was used to inform and verify our
employment assumptions.
The total project cost of each project was an important variable, as was the location of the project.
State-level trade patterns were used to determine outputs on the following variables of interest to our
study, described below.
Outputs:
IMPLAN distinguishes between three types of effects: direct, indirect, and induced.
Direct effects gauge the impact within the industry that is immediately affected by an NMTC
investment.
Induced effects concern intra-industry economic impact up and down the supply chain from
NMTC investments.
Induced effects measure the economic impact of increases in household spending as a result of
an NMTC investment.
The IMPLAN model reports two types of employment impacts: construction jobs and operational jobs.
Construction jobs: Temporary construction jobs are reported in terms of “person-years” of
labor. For example, an employment impact of “10 construction jobs” could refer to 20 people
working 6 months, 2 people working 5 years, or 10 people working 1 year.
Operational jobs: Permanent jobs created that contribute to the operation of a business. Direct
operational jobs are jobs created at an NMTC-financed business, whereas indirect and induced
operational jobs are permanent jobs created as a result of indirect or induced effects.
Operational and construction impacts are also provided for “value added”, a variable that describes (in
dollar terms) the additional economic activity generated in a regional economy above and beyond total
project investment. The total economic impact of an NMTC project is quantified by summing its total
project cost and the value added.
While IMPLAN provides a variety of specific data on tax revenue generation, this report focuses on two
categories: (1) state and local and (2) federal:
State and local taxes include any applicable dividend taxes, social insurance taxes, indirect
business taxes, corporate income taxes, and/or personal income taxes. These numbers vary by
state based on the local tax code.
Federal taxes include any applicable federal social insurance taxes, indirect business taxes,
corporate income taxes, and personal income taxes.
Cost Estimates:
Data from the Joint Committee on Taxation (JCT) was used to estimate the cost of the NMTC for
calendar year 2012. JCT releases annual estimates of tax provision costs.

7
Changes from the December 2012 study
As mentioned previously, two years of new data (2011 and 2012) were added to this updated paper. We
also took a different approach to categorizing projects, using additional industry sectors. The research
team was able to categorize nearly every NMTC project closed between 2003 and 2012. Our improved
industry classification system resulted in a large reduction in the number of real estate projects that did
not easily fit into one industry category, from 6.3 percent in our past report to 1.1 percent in this report.
We model these projects using basic assumptions about commercial real estate investments.
8
Findings: Our findings show that between 2003 and 2012, the New Markets Tax Credit created a significant
number of jobs, expanded the tax base of state and local governments, and added amenities and
facilities to disinvested communities. Our research also shows that the NMTC generated a significant
return on investment to taxpayers. The combination of job creation and cost efficiency make the NMTC
an effective use of federal resources in a time of high deficits and difficult fiscal choices.
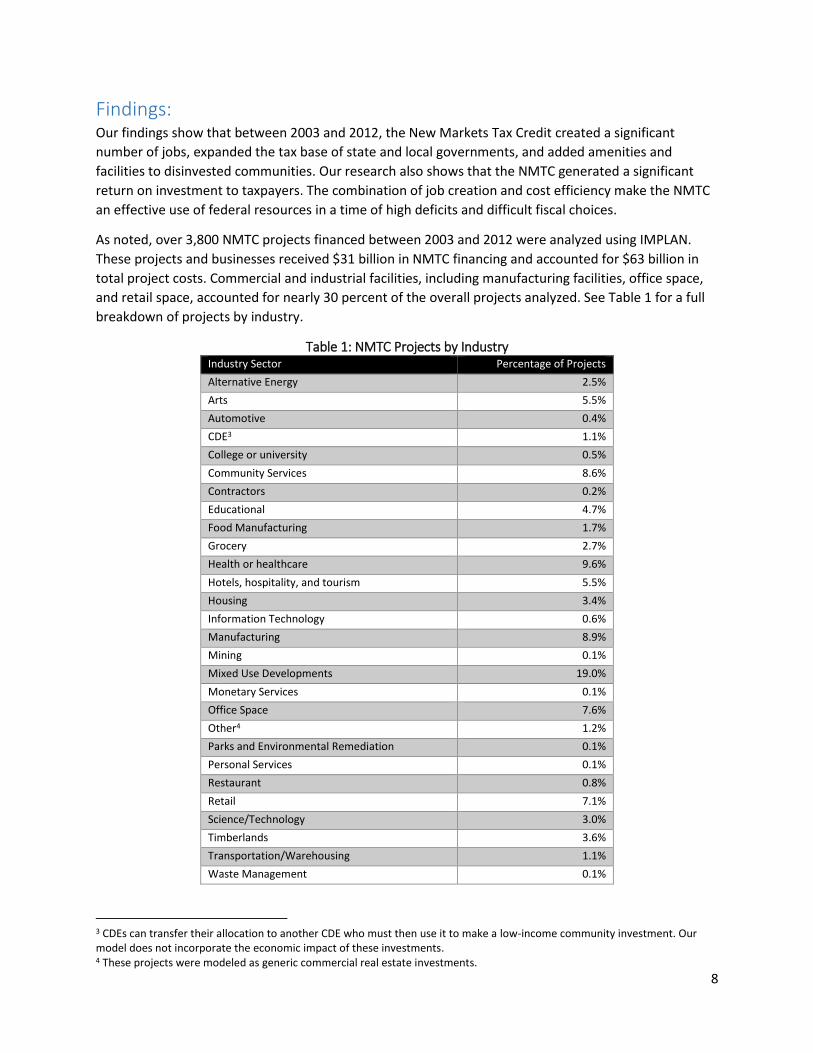
As noted, over 3,800 NMTC projects financed between 2003 and 2012 were analyzed using IMPLAN.
These projects and businesses received $31 billion in NMTC financing and accounted for $63 billion in
total project costs. Commercial and industrial facilities, including manufacturing facilities, office space,
and retail space, accounted for nearly 30 percent of the overall projects analyzed. See Table 1 for a full
breakdown of projects by industry.
Table 1: NMTC Projects by Industry Industry Sector Percentage of Projects
Alternative Energy 2.5%
Arts 5.5%
Automotive 0.4%
CDE3 1.1%
College or university 0.5%
Community Services 8.6%
Contractors 0.2%
Educational 4.7%
Food Manufacturing 1.7%
Grocery 2.7%
Health or healthcare 9.6%
Hotels, hospitality, and tourism 5.5%
Housing 3.4%
Information Technology 0.6%
Manufacturing 8.9%
Mining 0.1%
Mixed Use Developments 19.0%
Monetary Services 0.1%
Office Space 7.6%
Other4 1.2%
Parks and Environmental Remediation 0.1%
Personal Services 0.1%
Restaurant 0.8%
Retail 7.1%
Science/Technology 3.0%
Timberlands 3.6%
Transportation/Warehousing 1.1%
Waste Management 0.1%
3 CDEs can transfer their allocation to another CDE who must then use it to make a low-income community investment. Our model does not incorporate the economic impact of these investments. 4 These projects were modeled as generic commercial real estate investments.
9
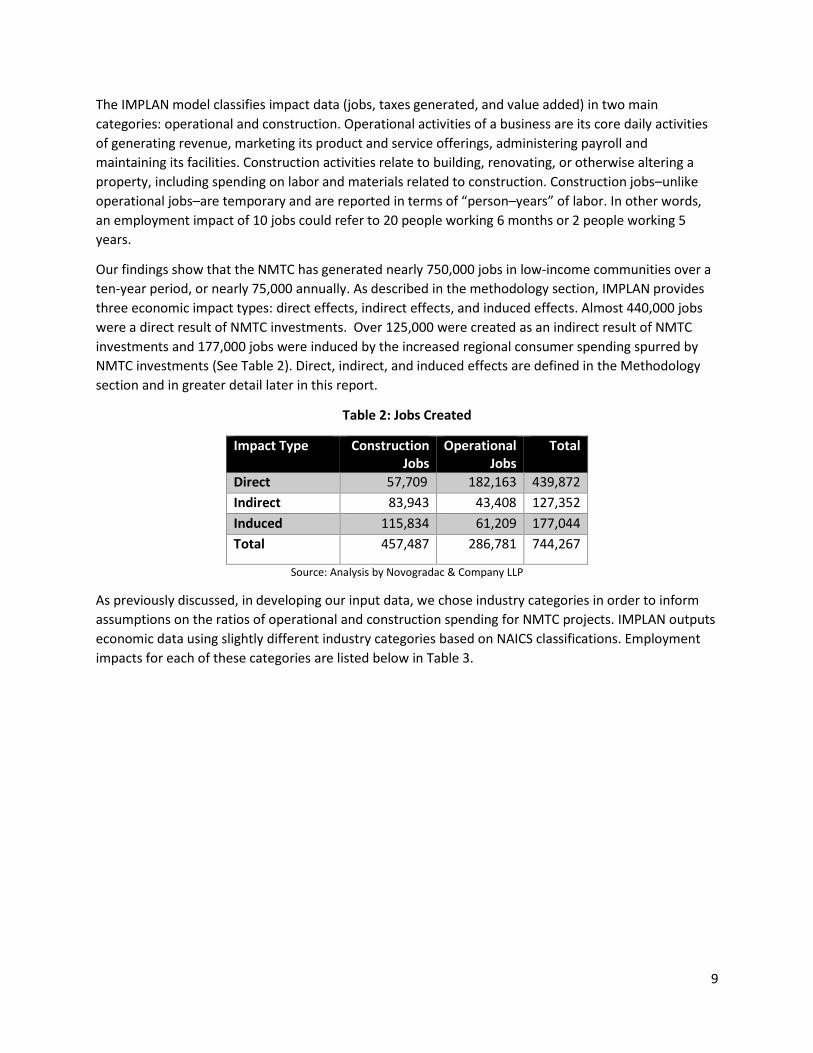
The IMPLAN model classifies impact data (jobs, taxes generated, and value added) in two main
categories: operational and construction. Operational activities of a business are its core daily activities
of generating revenue, marketing its product and service offerings, administering payroll and
maintaining its facilities. Construction activities relate to building, renovating, or otherwise altering a
property, including spending on labor and materials related to construction. Construction jobs–unlike
operational jobs–are temporary and are reported in terms of “person–years” of labor. In other words,
an employment impact of 10 jobs could refer to 20 people working 6 months or 2 people working 5
years.
Our findings show that the NMTC has generated nearly 750,000 jobs in low-income communities over a
ten-year period, or nearly 75,000 annually. As described in the methodology section, IMPLAN provides
three economic impact types: direct effects, indirect effects, and induced effects. Almost 440,000 jobs
were a direct result of NMTC investments. Over 125,000 were created as an indirect result of NMTC
investments and 177,000 jobs were induced by the increased regional consumer spending spurred by
NMTC investments (See Table 2). Direct, indirect, and induced effects are defined in the Methodology
section and in greater detail later in this report.
Table 2: Jobs Created
Impact Type Construction Jobs
Operational Jobs
Total
Direct 57,709 182,163 439,872
Indirect 83,943 43,408 127,352
Induced 115,834 61,209 177,044
Total 457,487 286,781 744,267
Source: Analysis by Novogradac & Company LLP
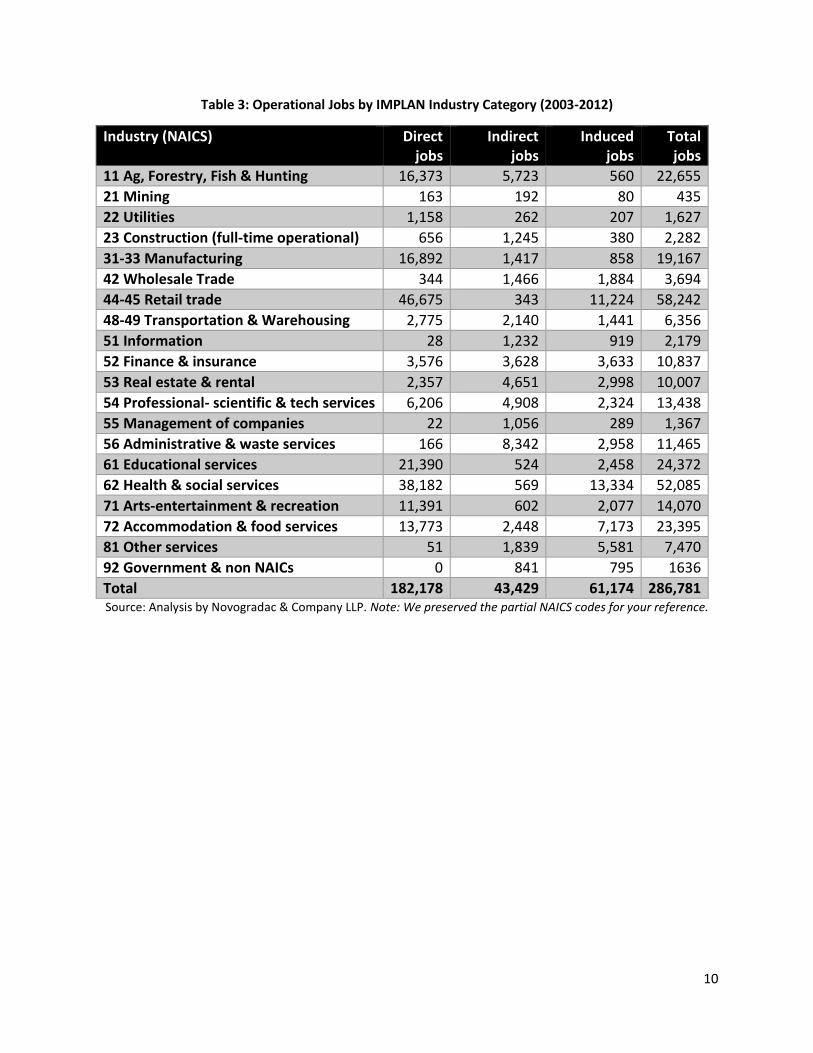
As previously discussed, in developing our input data, we chose industry categories in order to inform
assumptions on the ratios of operational and construction spending for NMTC projects. IMPLAN outputs
economic data using slightly different industry categories based on NAICS classifications. Employment
impacts for each of these categories are listed below in Table 3.
10
Table 3: Operational Jobs by IMPLAN Industry Category (2003-2012)
Industry (NAICS) Direct jobs
Indirect jobs
Induced jobs
Total jobs
11 Ag, Forestry, Fish & Hunting 16,373 5,723 560 22,655
21 Mining 163 192 80 435
22 Utilities 1,158 262 207 1,627
23 Construction (full-time operational) 656 1,245 380 2,282
31-33 Manufacturing 16,892 1,417 858 19,167
42 Wholesale Trade 344 1,466 1,884 3,694
44-45 Retail trade 46,675 343 11,224 58,242
48-49 Transportation & Warehousing 2,775 2,140 1,441 6,356
51 Information 28 1,232 919 2,179
52 Finance & insurance 3,576 3,628 3,633 10,837
53 Real estate & rental 2,357 4,651 2,998 10,007
54 Professional- scientific & tech services 6,206 4,908 2,324 13,438
55 Management of companies 22 1,056 289 1,367
56 Administrative & waste services 166 8,342 2,958 11,465
61 Educational services 21,390 524 2,458 24,372
62 Health & social services 38,182 569 13,334 52,085
71 Arts-entertainment & recreation 11,391 602 2,077 14,070
72 Accommodation & food services 13,773 2,448 7,173 23,395
81 Other services 51 1,839 5,581 7,470
92 Government & non NAICs 0 841 795 1636
Total 182,178 43,429 61,174 286,781 Source: Analysis by Novogradac & Company LLP. Note: We preserved the partial NAICS codes for your reference.
11
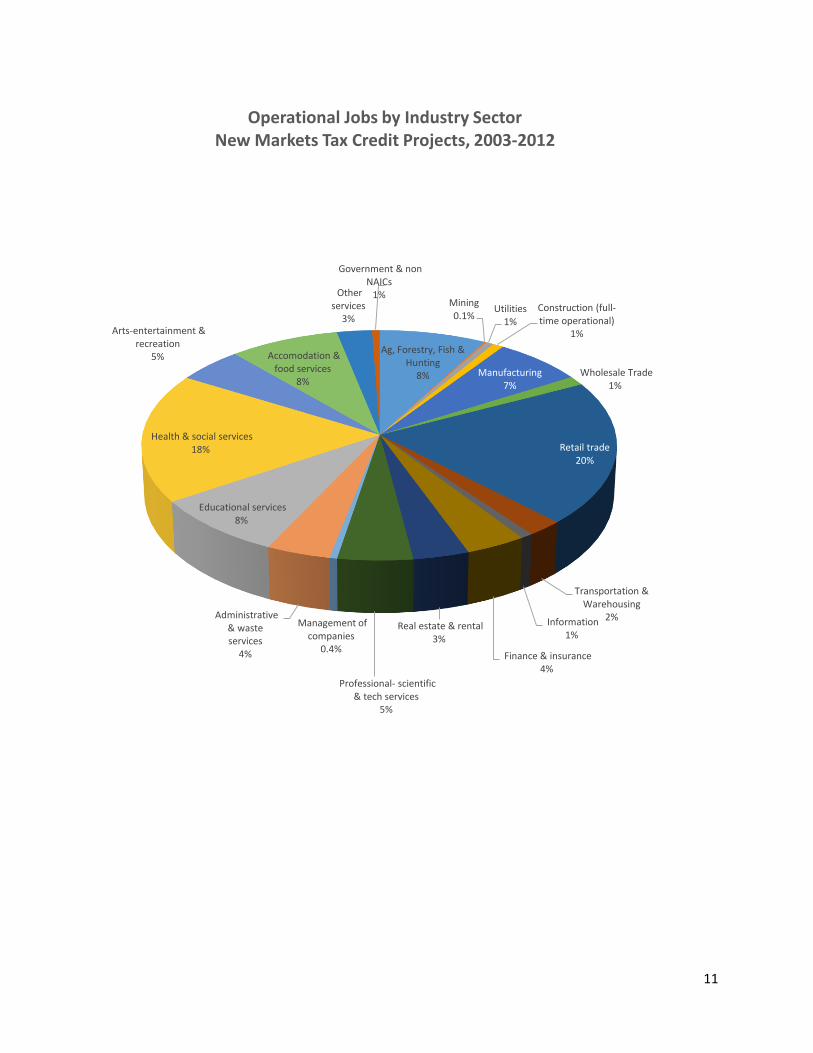
Ag, Forestry, Fish & Hunting
8%
Mining0.1%
Utilities1%
Construction (full-time operational)
1%
Manufacturing7%
Wholesale Trade1%
Retail trade20%
Transportation & Warehousing
2%Information1%
Finance & insurance4%
Real estate & rental3%
Professional- scientific & tech services
5%
Management of companies
0.4%
Administrative & waste services
4%
Educational services8%
Health & social services18%
Arts-entertainment & recreation
5% Accomodation & food services
8%
Other services
3%
Government & non NAICs
1%
Operational Jobs by Industry SectorNew Markets Tax Credit Projects, 2003-2012

12
DIRECT ECONOMIC EFFECTS Direct effects gauge the impact within the industry that is immediately affected by an NMTC investment.
For example, direct jobs would include the construction workers hired to build an NMTC-financed
manufacturing facility as well as full-time jobs created within that new facility. The NMTC directly
created 439,872 jobs, including 257,709 construction jobs and 182,163 operational jobs (see Table 4).
In addition to $63 billion in total project costs, NMTC investments directly generated over $29 billion in
additional economic activity.
Table 4 — Direct Effects: Job Creation and Value Added (2003-2012)
Category Jobs Value Added
Construction 257,709 $17,410,650,319
Operational 182,163 $12,151,217,139
Total 439,872 $29,561,867,458 Source: Analysis by Novogradac & Company LLP
INDIRECT ECONOMIC EFFECTS Indirect effects concern intra-industry economic impacts. NMTC investments create indirect effects in
the local economy by increasing demand for goods and services up and down the supply chain. For
example, an NMTC-financed timber mill might create business opportunities in the trucking industry and
for wood suppliers and machinery shops, generating local jobs and spending on goods and services,
along with the accompanying tax revenue.
The NMTC indirectly added over $11 billion in economic activity to the economy, generating 127,352
jobs, including 83,943 construction jobs and 43,408 operational jobs (see Table 5). Most of the indirect
operational jobs were in the service sector, transportation, waste management, agriculture, real estate
management, or information technology sectors.
Table 5: Indirect Effects: Job Creation and Value Added (2003-2012)
Category Jobs Value Added
Construction 83,943 $7,730,663,064
Operational 43,408 $3,698,363,059
Total 127,352 $11,429,026,123 Source: Analysis by Novogradac & Company LLP
INDUCED ECONOMIC EFFECTS Induced effects measure the economic impact of increases in household spending as a result of an
NMTC investment. When workers are hired and local wages increase, boosting regional consumer
spending, the added demand for goods and services allows local businesses to expand, construct new
facilities, hire more employees, and spend more on products and services that generate tax revenue. For
example, a grocery store might be built to support the additional consumer demand generated by large
scale NMTC-financed industrial facility.
Our findings indicate that the NMTC financing induced 177,044 jobs, including 115,834 in the
construction sector and 61,209 operational jobs (see Table 6). Nearly half of the induced operational

13
jobs were in the retail, restaurant, and healthcare sectors. This economic activity represented over $14
billion in value added to the economy.
Table 6: Induced Effects: Job Creation and Value Added (2003-2012)
Category Jobs Value Added
Construction 115,834 $9,490,456,031
Operational 61,209 $4,935,970,404
Total 177,044 $14,426,426,435 Source: Analysis by Novogradac & Company LLP
RETURN ON INVESTMENT Federal Tax Revenue
The NMTC provides the federal government with a significant return on investment. Our findings show
that – even with the most conservative assumptions about federal tax revenue generated – the credit
pays for its cost to the federal government. Our revenue assumptions are conservative because while
tax revenue from construction activity covers the entire report period (2003-2012), our model only
provided federal tax revenue from operational activity for the final year of the period (2012). In 2012,
the NTMC cost the federal Treasury an estimated $800 million5.
During the same period, NMTC investments generated $984 million in federal tax revenue6, including
$628 million generated by construction activities and $371 million generated by operational activities
(see Table 7). This revenue fully offsets the cost of the program to the federal government and provides
an annual return of $184 million, or 23 percent. Furthermore, if the model included annual federal tax
revenue generated by jobs and operational activity before 2012, the program would provide an even
more substantial return on investment.
Table 7: Tax Impacts, 2012
Type of Tax Revenue Generated by 2012 NMTC Projects
Revenue from
Construction Impacts,
2012
Revenue from Operational
Impacts, 2012
Total Revenue,
2012
FY 2012 Cost to the Federal
Government
Return on Investment
(Balance)
Federal Tax Revenue $612,656,871 $371,069,436 $983,726,307 $800,000,000 $183,726,307
State & Local Revenue
$298,193,499 $244,175,331 $542,368,830
Implications for Tax Reform
The new Chairman of the House Ways and Means Committee in the 114th Congress, Representative Paul
Ryan (R-WI), has called for the Joint Committee on Taxation and the Congressional Budget Office to
5 Data from the Joint Committee on Taxation, Estimates of Federal Tax Expenditures for Fiscal Years 2011-2015 (JCS-I-12), January 17, 2012, was used to estimate the cost of the NMTC for calendar year 2012. 6 Includes any applicable federal social insurance taxes, indirect business taxes, corporate income taxes, and personal income taxes.
14
utilize a form of macroeconomic impact analysis called “dynamic scoring” when calculating the cost of
tax provisions. As policymakers consider tax reform and weigh the merits of dynamic scoring systems,
we suggest they incorporate our revenue findings.
While our study does not attempt to measure the absolute effect of the NMTC program on U.S. Gross
Domestic Product, the data provided could serve as a baseline for a dynamic analysis of the NMTC.
Further research is needed to determine the extent to which the NMTC directly generates new domestic
investment by easing the flow of capital to underutilized “new markets”, allowing entrepreneurs to tap
into unmet demand in low-income communities. The long-term catalytic or indirect impact of large scale
NMTC investments in underserved markets might also merit study, along with the extent to which job
intensive NMTC investments in high unemployment areas reduce social safety net spending by
employing low-income community residents. Fifty-two percent of NMTC projects between 2003 and
2012 were located in communities with unemployment rates at least 150 percent of the national
average.
Regardless, as an incentive for economic development in underutilized markets, the NMTC is clearly a
revenue generating program. As Congress discusses “pro-growth” tax reform, efficient economic
development incentives like the NMTC should be the centerpiece of the anti-poverty plank of tax reform
proposals. While the cost of the NMTC is small, it is now arguably largest federal community
development program, delivering nearly $10 billion in total project financing annually to capital-starved
communities.
State and Local Tax Revenue
By stabilizing and revitalizing local economies, the NMTC helps boost tax revenue for state and local
governments. In 2012, a year when 42 state governments and the District of Columbia faced budget
shortfalls, NMTC investments nationwide generated $542 million in state and local tax revenue (see
Table 7 above).
A 2013 Urban Institute evaluation of the NMTC similarly found that the NMTC Program had a dramatic
impact on the local tax base. A survey of local stakeholders indicated: 80 percent of projects enhanced
the local tax base; 70 percent of projects reporting an increase in payroll taxes paid; two-thirds reporting
an increase in property taxes paid; 60 percent reporting an increase in individual income taxes; more
than half reporting an increase in sales taxes; and one-third reporting an increase in corporate taxes.7
Other Economic Benefits While this report mostly focuses on metrics such as jobs, tax revenue, and economic activity, we should
note that the impact of NMTC investments goes beyond a simple measurement of job creation or new
revenue. NMTC investments help revitalize communities by adding long-needed amenities and financing
new community facilities enhance the quality of life for residents of low-income communities. For
example, NMTC financed facilities provide better access to fresh food, healthcare and daycare options,
and job training centers. Children can attend new or renovated schools, exercise in new YMCAs, and
participate in programming at one of the innovative nonprofits financed by the NMTC.
7 “New Markets Tax Credit Program Evaluation.” The Urban Institute, 2013.

15
A recent Urban Institute study examined the extent to which the NMTC helps communities add
amenities, improve services, and finance community facilities. The study found that 88 percent of NMTC
projects brought direct or indirect quality-of-life improvements to their communities, including parks,
playgrounds, shopping centers, health clinics, and other amenities.8
Table 8 shows many of the community amenities financed by the NMTC between 2003 and 2012.
Table 8: Community Facilities
Project Type Number of Projects
Nonprofit Service Providers 446
Healthcare facilities 381
Educational facilities 218
Arts and Cultural Projects 167
Grocery stores 140
Parks/Environmental Remediation 6
Source: The NMTC Coalition’s analysis of CDFI Fund transaction data (2003-2012)
Ten Years of the NMTC: Investment Trends Like most government programs, over time the NMTC program has matured and changed. Increased
awareness, investor demand, regulatory clarifications, shifting economic landscape, and competition for
allocation created subtle shifts in the deployment of NMTC allocations. Investments have shifted toward
areas of greater distress, and investments in rural communities are increasing. And recently, more
NMTC financing is going to the community facilities.
In order to quantify these trends, we analyzed more than 3,800 projects closing between 2003 and
2012. We compared data from the Early Years (2003-2007) and Recent Years (2008-2012).
Location Trends
Data from the CDFI Fund shows that CDEs have increasingly invested in communities with higher levels
of distress where conventional financing is more difficult to secure. For example, during the Early Years,
48.2 percent of NMTC projects were in communities with unemployment rates of least 150 percent of
the national average, but in the Recent Years (2008 and 2012), the number of projects in these
communities increased to 54.8 percent, a jump of 13.7 percent.
In 2006, Congress enacted The Tax Relief and Health Care Act of 2006 (P.L. 109-432), which amended
the NMTC statute to ensure that non-metropolitan communities were allocated a proportional share of
QLICIs. The CDFI Fund defined “non-metropolitan counties” as counties that are not contained within a
Metropolitan Statistical Area, according to the most recent census. There is evidence that the 2006
provision initiated a trend toward more investment in rural communities, as investment in non-metro
counties has picked up in the Recent Years, averaging 19 percent between 2008 and 2012 after
averaging 16 percent between 2003 and 2007. This percentage is roughly proportional to the overall
rural share of the population, which is about 20 percent.
8 “New Markets Tax Credit Program Evaluation.” The Urban Institute, 2013.
16
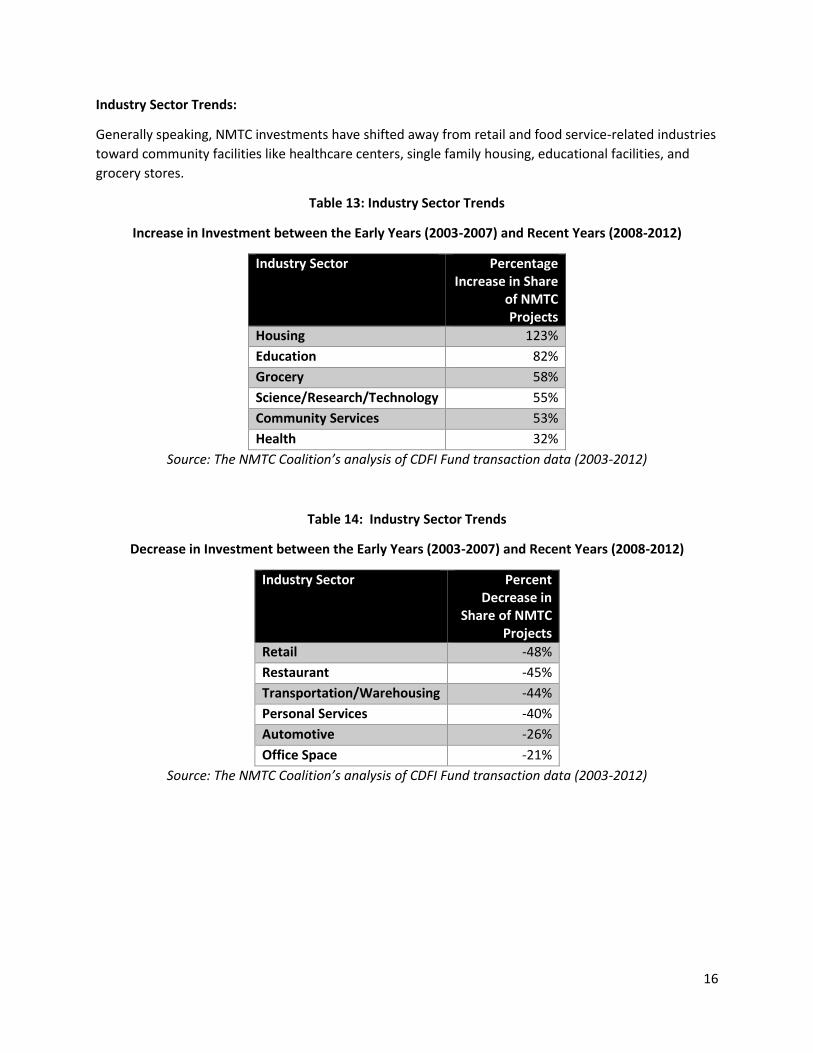
Industry Sector Trends:
Generally speaking, NMTC investments have shifted away from retail and food service-related industries
toward community facilities like healthcare centers, single family housing, educational facilities, and
grocery stores.
Table 13: Industry Sector Trends
Increase in Investment between the Early Years (2003-2007) and Recent Years (2008-2012)
Industry Sector Percentage Increase in Share
of NMTC Projects
Housing 123%
Education 82%
Grocery 58%
Science/Research/Technology 55%
Community Services 53%
Health 32%
Source: The NMTC Coalition’s analysis of CDFI Fund transaction data (2003-2012)
Table 14: Industry Sector Trends
Decrease in Investment between the Early Years (2003-2007) and Recent Years (2008-2012)
Industry Sector Percent Decrease in
Share of NMTC Projects
Retail -48%
Restaurant -45%
Transportation/Warehousing -44%
Personal Services -40%
Automotive -26%
Office Space -21%
Source: The NMTC Coalition’s analysis of CDFI Fund transaction data (2003-2012)

17
