a decade of changes in nitrogen oxides over regions … decade of changes in nitrogen oxides over...
TRANSCRIPT

A Decade of Changes in Nitrogen Oxides over Regions of Oil & Natural
Gas Activities in the US
Debra Kollonige (UMD, NASA), Bryan Duncan (NASA),
Lok Lamsal (GESTAR, NASA), Anne Thompson (NASA)

Presentation Outline
• Nitrogen oxides (NOx) over the last decade for:
– Continental US (CONUS)
– Regions with Oil & Natural Gas (ONG) Operations
– Regions without ONG Operations: Are the observed trends real?
• Upcoming satellite validation experiment with the
Bureau of Ocean Energy Management (BOEM) over
coastal ONG operations
• Expectations for future satellite missions

Annual Mean Ozone Monitoring Instrument (OMI) NO2 Levels (x1015 molec/cm2) from 2005 to 2016
• OMI data indicate widespread decreases in NO2 levels over U.S. since 2005 associated with pollution emission controls on power plants & automobiles. (Figures left).
• However, we observe several less polluted areas, such as the Central US, with statistically significant relative increases of ~10-30% over the same time period (Duncan et al., 2016).
2005
2016
Images from: https://airquality.gsfc.nasa.gov/
Low High
Low High

OMI NO2 (2005 – 2016): US Urban Trends
Images from: https://airquality.gsfc.nasa.gov/usa
• In US cities, such as Baltimore MD (Map on right), sharp decreases in NO2 observed 2005-2010 (Left Figure).
• Afterwards OMI NO2 appears to level off despite any additional pollution emission controls in place. Surface measurements also confirm this surprising result.

Oil & Natural Gas (ONG) Production Across US • Numerous studies have
sought to understand the air quality impacts of ONG industry in U.S.
• Majid et al. (2017) presented analysis of Ozone Monitoring Instrument (OMI) tropospheric NO2 levels over the seven main U.S. shale plays (Figure right).
• Total oil and gas production from each region at the close of our study period (December 2015) is shown in left figure.
• At the end of 2015, the sum of production from these shale plays accounted for over 95% and 75% of the total ONG production in the U.S., respectively.
Ga
s Pro
du
ction
(x10
5 m3/d
ay
)
Oil
Pro
du
ctio
n (
x10
6 b
arr
els
/da
y)

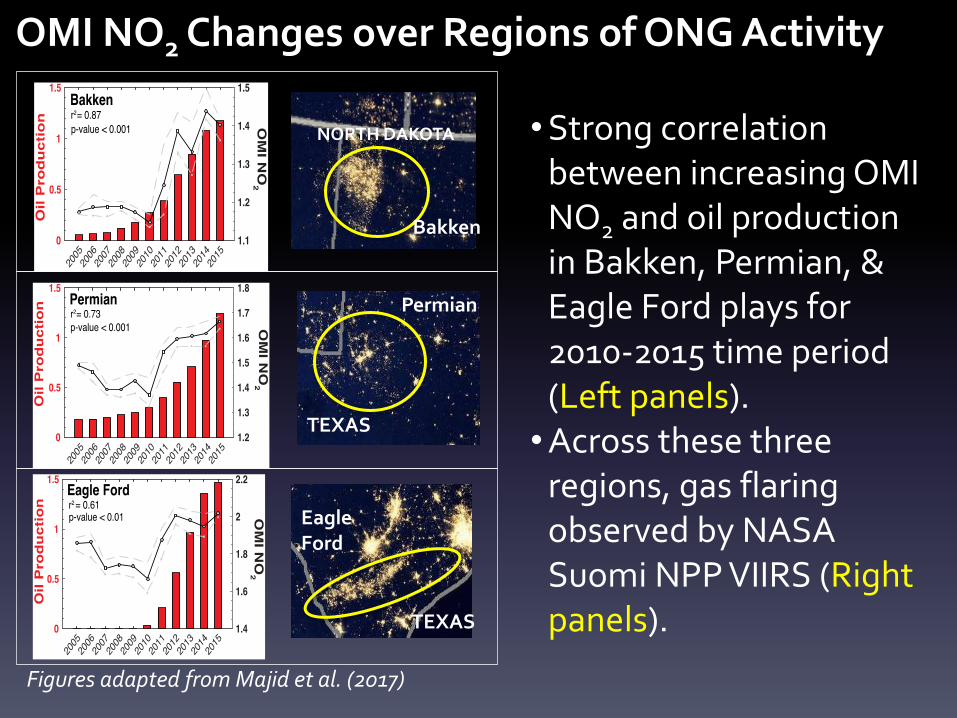
OMI NO2 Changes over Regions of ONG Activity
Absolute Changes in OMI NO2 from 2005 to 2015
Majid et al. (2017)
• Over less polluted regions of Central Plains, OMI data show increases in NO2 levels over areas of ONG activity, which is consistent with activity, such as oil production.
• Changes in NO2 levels over ONG areas in more polluted regions of the U.S. (e.g., Marcellus-Utica) do not correspond to ONG activity as changes in pollution levels are dominated by power plant and mobile sources.
Absolute Change NO2 (x1015 molec/cm2)
OMI NO2 Changes over Regions of ONG Activity
NORTH DAKOTA
Bakken
TEXAS
Permian
TEXAS
Eagle Ford
Figures adapted from Majid et al. (2017)
•Strong correlation between increasing OMI NO2 and oil production in Bakken, Permian, & Eagle Ford plays for 2010-2015 time period (Left panels).
•Across these three regions, gas flaring observed by NASA Suomi NPP VIIRS (Right panels).

Relative changes in OMI NO2 over ONG Activity • 2005-2015 changes in NO2 over 6 active ONG plays.
∆NO2 (x1015 molec/cm2) ∆NO2 (x1015 molec/cm2)
• Increase in NO2 visible in ONG plays (Bakken, Permian, Eagle Ford) with limited non-ONG NOx sources.
• Changes in NO2 over Marcellus play are masked by decline in urban pollution.
• Figures from Majid et al. (2017) ∆NO2 (x1015 molec/cm2)

Decadal OMI NO2 over 7 Shale Regions
• During the low- phase of ONG
production (2005–2009), declining
trends in tropospheric NOx are similar to
the national trend (–4.6% per yr) in 6 of 7
study regions (–8 to –2% per yr).
• In the high-production phase (2010–15),
increasing NOx trend is in 5 of 7 study
basins (0.4 to 4.5% per yr) while the
national trend continued to decline (–
0.3% per yr).
Figure from Majid et al. (2017)
OMI NO2 Trends (%/yr)

Relationship b/w ONG production & OMI NO2
• Relative (%) changes between 2005–
2009 & 2010–2015 OMI NO2 (Top
Figure) show % difference in OMI NO2
increases significantly (6–18%) across
all four oil producing shale plays—
Bakken, Eagle Ford, Permian, &
Niobrara-Codell.
• Note: Dramatic NO2 change between
the low (–32%) & high (–2%) production
phases over the Marcellus-Utica region.
• Annual oil production rates & NO2
enhancements (ΔNO2; Bottom Figure)
suggest significant linear relationship
between regional oil operations &
tropospheric NO2 enhancements. Figures from Majid et al. (2017)
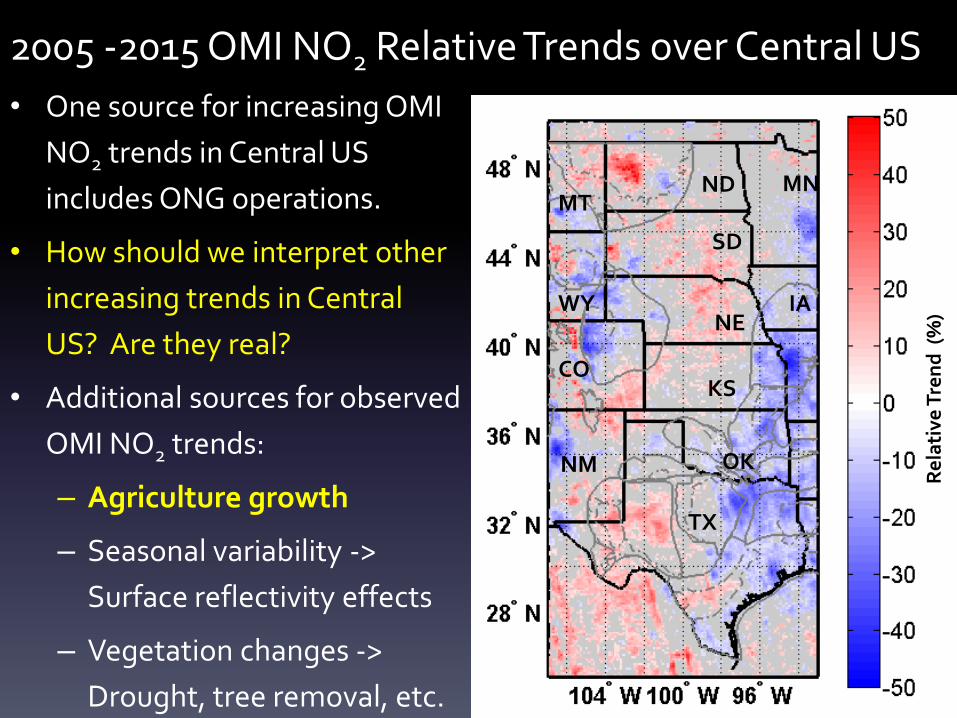
2005 -2015 OMI NO2 Relative Trends over Central US
SD
ND
NE
KS
OK
TX
NM
CO
WY
MT MN
IA
• One source for increasing OMI
NO2 trends in Central US
includes ONG operations.
• How should we interpret other
increasing trends in Central
US? Are they real?
• Additional sources for observed
OMI NO2 trends:
– Agriculture growth
– Seasonal variability ->
Surface reflectivity effects
– Vegetation changes ->
Drought, tree removal, etc.
R
ela
tive
Tre
nd
(%
)

Crop Expansion in the North Plains
Figure above and data above supplied by EIA and NREL.
Image from Wright et al. (2017) shows relative conversion rates of arable non-cropland to cropland (2008–2012).
• Lark et al (2015) discovered cropland expanded nationwide from 2008 to 2012. North Plains had corn, soybeans, and winter wheat as break-out crops.
• Wright et al (2017; Figure left) suggests that Land Cover Land Use Changes (LCLUC) is correlated to the proximity of ethanol refineries.
• Number of ethanol plants has doubled in last 10 years (Figure below).
U.S. Ethanol Plants, Capacity & Production N
um
ber
of
Pla
nts
Land Cover Land Use Change (LCLUC) Non-Crop to Crop Conversion (%)

Corn for Ethanol Co-located with Positive NO2 Trend
• Positive NO2 trends correlate with LCLUC of Non-crop to Crop and increase in corn crops in Eastern South Dakota and Nebraska.
Above and left: OMI 2005-2015 NO2 relative trends with zoom in over SD and NE. Black points are ethanol plants in the region supplied by EIA.
R
ela
tive
Tre
nd
(%
)
R
ela
tive
Tre
nd
(%
)

Seasonal Changes Impact OMI NO2 in North Plains
- Norfolk, NE & Aberdeen, SD are both located near ethanol plants and increasing OMI NO2.
- NO2 maxima correspond to planting months:
- Corn -> April, May
- Wheat -> Oct
- Surface reflectance does impact NO2 retrieval.
- Anomalously high NO2 in winter appears correlated to high monthly OMLER.
OMLER V3:
Surface Reflectance
Climatology
Monthly Mean OMI
NO2 2005-2016
OMI monthly mean NO2 over 2005-2016 period for (a) Norfolk & (b) Aberdeen. OMI monthly & yearly surface reflectance climatology for (c) Norfolk & (d) Aberdeen.
Norfolk
Aberdeen
NO
2 (x
101
5 mo
lec/
cm2 )
NO
2 (x
1015
mo
lec/
cm2)
OM
I LE
R
OM
I LE
R
Month Month

Climate & Land Use Changes Affect OMI NO2
• Vegetation changes from drought, temperature increases, and land use changes can affect surface reflectivity, interfering with OMI NO2 retrievals.
• This appears to impact: Black Hills National Forest (dying trees), and northeastern Nebraska (farming growth). Both locations have positive NO2 trends due to both real NO2 source increases and retrieval artifacts from surface reflectivity changes.
Landsat images of SD and NE showing changes from (a) 2005 to (b) 2016 of surface vegetation, such as fewer trees in the Black Hills and increased farming in Northeast NE. http://world.time.com/timelapse/

Upcoming Satellite Validation over ONG Activity (w/ BOEM): Satellite Continental & Oceanic Atmospheric Pollution Exp.
(SCOAPE) • Outer Continental Shelf Lands Act (OCSLA) requires BOEM to ensure compliance with
NAAQS so that OCS O&G exploration, development, and production do not negatively affect the AQ of any state.
• Our goal (NASA) is to assess feasibility of using satellite observations to monitor coastal and over water AQ.
Future areas for new BOEM leases
Future areas for new BOEM leases
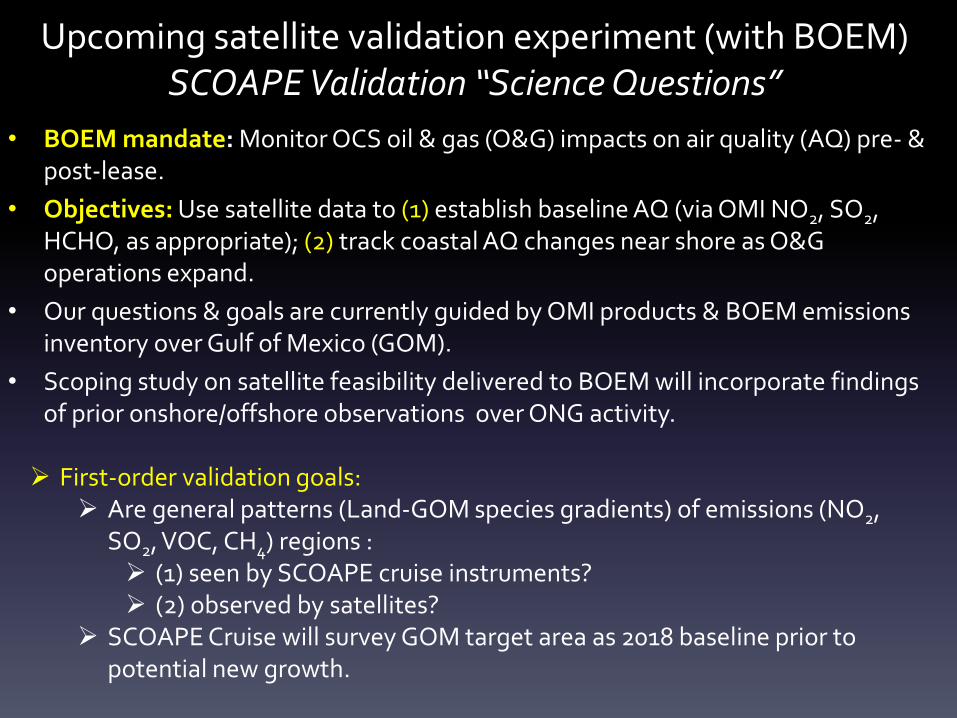
Upcoming satellite validation experiment (with BOEM) SCOAPE Validation “Science Questions”
• BOEM mandate: Monitor OCS oil & gas (O&G) impacts on air quality (AQ) pre- & post-lease.
• Objectives: Use satellite data to (1) establish baseline AQ (via OMI NO2, SO2, HCHO, as appropriate); (2) track coastal AQ changes near shore as O&G operations expand.
• Our questions & goals are currently guided by OMI products & BOEM emissions inventory over Gulf of Mexico (GOM).
• Scoping study on satellite feasibility delivered to BOEM will incorporate findings of prior onshore/offshore observations over ONG activity.
First-order validation goals: Are general patterns (Land-GOM species gradients) of emissions (NO2,
SO2, VOC, CH4) regions : (1) seen by SCOAPE cruise instruments? (2) observed by satellites?
SCOAPE Cruise will survey GOM target area as 2018 baseline prior to potential new growth.

Second-order Validation Goals for SCOAPE Cruise: Rationale for Cruise Track
• Gradients: Capture North-South
& East-West concentration
differences in broad area and
“hot spots”. Capture regions
where maximum & minimum
NO2 (SO2, CO, VOC) are
expected.
• Focus on two near-shore large
“hot spots” (WHITE Circles).
Sample early & later in cruise.
• Sample 1 or 2 isolated “hot
spots” farther off-shore to
quantify detection of contrasts.
Louisiana Offshore Oil Port (LOOP)
High Emissions Area (HEA)
Above: Cover image from BOEM OCS Study 2017-044. GOM Platform and Non-Platform NOx emissions in 2014.

Survey of Satellite Observations over GOM • Figure (left): OMI NO2 first look at GOM from 2005-2016.
Color scale skewed by Houston.
• Declining continental NOx trends extend 100km+ offshore, perhaps masking any significant increasing trends over GOM from ONG sources.
• Caveat: Open ocean info subject to validation. Lok Lamsal will work on improving NO2 retrievals.
• Figure (bottom): OMI time series of pixel (labeled BOEM on Figure 3) agree with pattern of BOEM NOx emissions from 2005-2014.
Houston LOOP
From 2014 BOEM emissions report, we know that NOx declines 2005-2008, increases from 2008-2011, & then decreases again 2011-2014 over platform sources.
OMI NO2 (2016)
∆OMI NO2 (%; 2016-2005)
De
sea
son
ali
zed
OM
I NO
2
NO
2 (x
101
5 mo
lec/
cm2)
BOEM

Strawman Cruise Plan for May 2018 over GOM
Cruise path courtesy of Ryan Stauffer

SCOAPE Cruise: Vertical Structure over Water
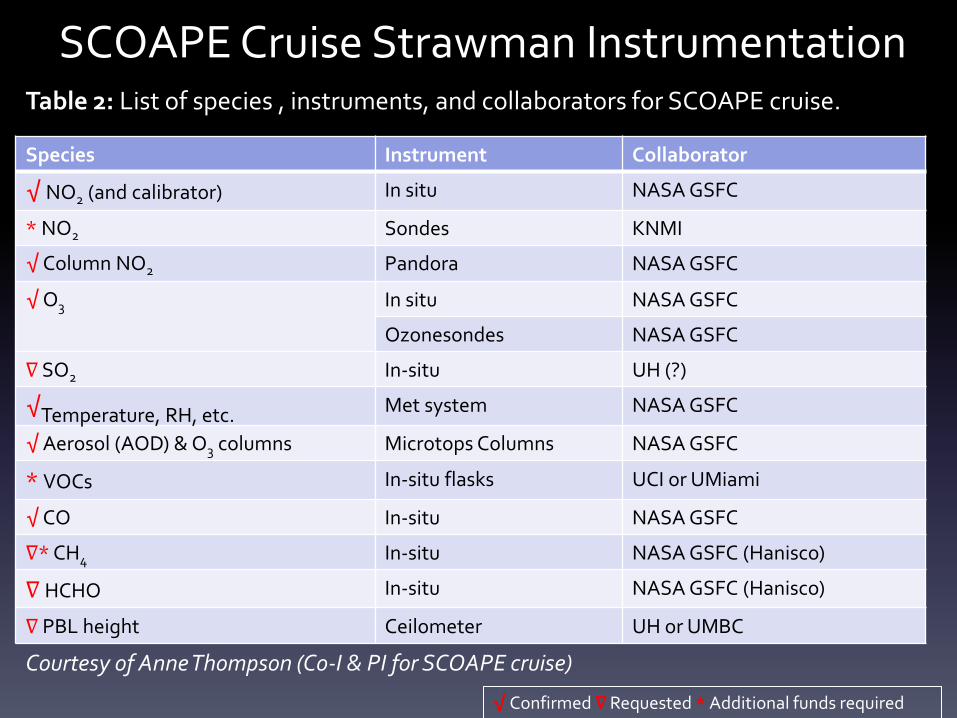
SCOAPE Cruise Strawman Instrumentation
Species Instrument Collaborator
√ NO2 (and calibrator) In situ NASA GSFC
* NO2 Sondes KNMI
√ Column NO2 Pandora NASA GSFC
√ O3 In situ NASA GSFC
Ozonesondes NASA GSFC
∇ SO2 In-situ UH (?)
√Temperature, RH, etc. Met system NASA GSFC
√ Aerosol (AOD) & O3 columns Microtops Columns NASA GSFC
* VOCs In-situ flasks UCI or UMiami
√ CO In-situ NASA GSFC
∇* CH4 In-situ NASA GSFC (Hanisco)
∇ HCHO In-situ NASA GSFC (Hanisco)
∇ PBL height Ceilometer UH or UMBC
Table 2: List of species , instruments, and collaborators for SCOAPE cruise.
√ Confirmed ∇ Requested * Additional funds required
Courtesy of Anne Thompson (Co-I & PI for SCOAPE cruise)

Satellite Observations of Interest for BOEM
• OMI-like observations of: NO2, SO2, O3, HCHO
• VIIRS: AOD, DNB Imagery and Flare detection
• AIRS & CrIS NH3
• MODIS: Imagery and AOD
• TROPOMI: NO2, SO2, O3, HCHO, CO, CH4
• MODIS – oil slicks?
VIIRS DNB Imagery and VIIRS & MODIS Day Night Thermal Anomalies on June 22, 2017.
Image retrieved from NASA Worldview.
Gas Flaring detected over active platforms in GOM

Expectations for future satellite missions: TROPOspheric Monitoring Instrument (TROPOMI)
• Launched on October 13 2017 by the European Space Agency.
• Global Coverage with Sub-urban spatial resolution (3.5 x 7 km2 for NO2).
• 1x/day: NO2, ozone (0-2 km vertical), aerosol, clouds, formaldehyde, glyoxal, SO2, CO, & methane.
Slide Courtesy of TROPOMI Science Team
Real data from Nov. 28, 2017
OMI TROPOMI

Summary • OMI observes widespread decreases in NO2 levels over U.S.
since 2005 associated with pollution emission controls. • However, we observe several less polluted areas, such as
Central US, with statistically significant relative increases of ~10-30% over same time period.
• Main sources for increasing NO2 levels in Central US over last decade include: ONG operations & agriculture growth.
• Over less polluted regions of Central Plains, OMI data show increases in NO2 levels over areas of ONG activity (eg. Bakken, Permian, & Eagle Ford plays) & strong correlation to ONG production.
• Changes in NO2 levels over ONG areas in more polluted regions of U.S. (eg. Marcellus-Utica) do not correspond to ONG activity as changes in pollution levels are dominated by power plant and mobile sources.
• Upcoming SCOAPE project & cruise with BOEM will assess the use of satellite data for air quality applications over open water in the presence of ONG activity.

Acknowledgements • We’d like to thank Julie McDill for the invitation to present at this workshop.
• This work was supported by NASA Aura and HAQAST grants, the University
of Sheffield, as well as an Interagency Agreement with BOEM.
• NO2 data provided by OMI and TROPOMI science teams.
• Thanks to Ryan Stauffer and the rest of the SCOAPE team for their efforts in
organizing the upcoming research cruise.
• Thank you for your attention!

Extra slides

Surface Reflectance: Black Hills National Forest –> Tree Removal
2005 2008
2012 2016
http://world.time.com/timelapse/

What is the connection between NO2 and NH3? • Warner et al (GRL, 2017) addresses
enhanced NH3 over agricultural areas including the US Midwest.
• Several areas of elevated NH3 VMRs correlate with positive NO2 trends -> Increasing corn, soybean, and wheat production in SD and NE.
• We are working on quantitative comparison between Warner’s AIRS NH3 VMRs and OMI NO2.
Figures from Warner et al (GRL, 2017)

25.5
26
26.5
27
27.5
28
28.5
29
29.5
30
30.5
-98 -97 -96 -95 -94 -93 -92 -91 -90 -89 -88 -87
Lati
tud
e
Longitude
CH4 VOC NOx CO SO2
Bubble size scaled by emissions amount
May 2014 Top 200 Emitters in GOM Region
Port Fourchon
New Orleans Biloxi
BOEM 2014 Platform Emissions Maps Guide SCOAPE
HEA & LOOP: Note High VOC & CH4
Two “Isolated” Regions Define Cruise extremities

Task 3: R/V Selection and Cruise Track Plan
• 13-19 May sailing time would
be 5-6 day Nominal Leg #1.
• Request option to add 2-3
days for Leg #2 focused on
high emissions areas such as
LOOP and HEA.
• Final track will be iterated
with R/V Tommy Munro
(depending on rules, cost).