a data repository for the edm community: the pslc datashoppact.cs.cmu.edu/koedinger/pubs/koedinger,...
TRANSCRIPT

1
A Data Repository for the EDM community:
The PSLC DataShop
Kenneth R. Koedinger1, Ryan S.J.d. Baker2, Kyle Cunningham1, Alida Skogsholm1, Brett Leber1, John Stamper1
{krk, kcunning, alida, bleber, jstamper} @ cs.cmu.edu, [email protected]
1 Human-Computer Interaction Institute, Carnegie Mellon University 2 Department of Social Science and Policy Studies, Worcester Polytechnic Institute
Introduction
In recent years, educational data mining has emerged as a burgeoning new area for scientific
investigation. One reason for the emerging excitement about educational data mining is the
increasing availability of fine-grained, extensive, and longitudinal data on student learning.
These data come from many sources, including standardized tests combined with student
demographic data (for instance, www.icpsr.umich.edu/IAED), and videos of classroom
interactions [22]. Extensive new data sources have been transformational in science [5] and
business (being a major part of the success of key businesses such as Google, FedEx, and Wal-
Mart).
In this paper, we present an open data repository of learning data – the Pittsburgh Science of
Learning Center DataShop (http://pslcdatashop.org) – which we have designed to have
characteristics that make it particularly useful for educational data mining. We discuss the ways
in which members of the EDM community are currently utilizing this resource, and how
DataShop’s tools support both exploratory data analysis and educational data mining.

2
At present, DataShop specializes in data on the interaction between students and educational
software, including data from online courses, intelligent tutoring systems, virtual labs, online
assessment systems, collaborative learning environments, and simulations. Historically,
educational data of this nature have been stored in a wide variety of formats, including streamed
log files directly from web-based or non-web-based educational software, summary log files
(sometimes including outputs from student models), and researcher-specific database formats
(both flat and relational). Moving toward a common set of standards for sharing data, student
models, and the results of EDM analyses – key goals of the DataShop project – will facilitate
more efficient, extensive storage and use of such data, and more effective collaboration within
the community.
DataShop contains data with three attributes that make it particularly useful for educational data
mining analyses. First, the data is fine-grained, at the grain-size of semantically meaningful
“transactions” between the student and the software, including both the student’s action, and the
software’s response. Second, the data is longitudinal, involving student behavior and learning, in
many cases, over the span of an entire semester or year of study. Third, the data is extensive,
involving millions of transactions for some of the educational software packages for which
DataShop has data. These three characteristics have made the PSLC DataShop useful to many
educational data miners, both involved with the PSLC and external to it. We have the ambition
of becoming the key venue for sharing educational interaction data and collaborating on its
progressive analysis to support scientific discovery in education.
I. The Pittsburgh Science of Learning Center DataShop
DataShop is a data repository and web application for learning science researchers and

3
educational data mining researchers. It provides secure data storage as well as an array of
analysis and visualization tools available through a web-based interface. Data is collected from
the PSLC’s six ongoing courses: Algebra (intelligent tutors and collaborative learning),
Chemistry (virtual labs, on-line course interactions, and intelligent tutors), Chinese (on-line
course interactions and optimized drill), English (intelligent tutors and optimized drill),
Geometry (intelligent tutors) and Physics (intelligent tutors and collaborative learning). There are
also sources external to the PSLC that regularly contribute data to DataShop, such as middle
school math data from the ASSISTments project (http://www.assistment.org) [18] and college
on-line course data (e.g., in Statistics) from the Open Learning Initiative (http://cmu.edu/oli).
Many other studies and researchers also use DataShop to analyze their data.
DataShop can store a wide variety of types of data associated with a computerized course or
study. This includes student-software interaction data (which is capable of being analyzed
through the analysis and visualization tools) as well as any related publications, files,
presentations, or electronic artifacts a researcher would like to store. In many cases, pre and post
tests, questionnaire responses, system screen shots, and demographic data are associated with
student interaction data. Mappings between problem steps and knowledge components (either
skills or concepts) can be created by researchers and statistically compared to one another.
Courses and studies are represented as datasets, which are organized by project, when relevant.
For example, one dataset that has been used in several educational data mining analyses [cf. 6, 7,
9, 10, 23, 24] is the “Algebra 1 2005-2006” dataset, which is grouped with similar datasets under
the “Algebra Course” project.
The amount of data in DataShop is constantly growing. As of June 2009, DataShop offers 164

4
datasets under 50 projects. Across data sets, there are 25 million software-student transactions,
representing over 111,000 student hours.
Researchers have utilized DataShop to explore learning issues in a variety of educational
domains. These include, but are not limited to, collaborative problem solving in Algebra [31],
self-explanation in Physics [20], the effectiveness of worked examples and polite language in a
Stoichiometry tutor [25] and the optimization of knowledge component learning in Chinese [28].
II. Logging and Storage Methods
Software-student interaction data is typically parsed from messages logged by educational
software – such as the intelligent tutor shown in Figure 1 – into the DataShop XML format.
While the student learns from the software, the student’s actions and the tutor’s responses are
stored in a log database or file, which is imported into DataShop for storage and analysis.
Figure 1. A problem from Carnegie Learning’s Cognitive Tutor Geometry (2005 version).
The DataShop logging format differs from many other educational data formatting standards in
that it attempts to capture student-computer interaction history at a fine-grained level, while also

5
providing data on the interactions’ context. The format does not attempt to describe, a priori,
learning resources and how they’re transferred [cf. 1, 16] or test content [cf. 32]. In this way, the
format is essentially descriptive, not prescriptive. The DataShop logging model is represented by
the following constructs [cf. 31]:
Context message: the student, problem, and session with the tutor
Tool message: represents an action in the tool performed by a student or tutor
Tutor message: represents a tutor’s response to a student action
Below we see example context, tool, and tutor messages in the DataShop XML format:
<context_message context_message_id="C2badca9c5c:-7fe5" name="START_PROBLEM">
<dataset> <name>Geometry Hampton 2005-2006</name>
<level type="Lesson"> <name>PACT-AREA</name>
<level type="Section"> <name>PACT-AREA-6</name>
<problem> <name>MAKING-CANS</name> </problem>
</level>
</level>
</dataset>
</context_message>
<tool_message context_message_id="C2badca9c5c:-7fe5">
<semantic_event transaction_id="T2a9c5c:-7fe7" name="ATTEMPT" />
<event_descriptor>
<selection>(POG-AREA QUESTION2)</selection>
<action>INPUT-CELL-VALUE</action>
<input>200.96</input>
</event_descriptor>
</tool_message>
<tutor_message context_message_id="C2badca9c5c:-7fe5">
<semantic_event transaction_id="T2a9c5c:-7fe7" name="RESULT" />
<event_descriptor> … [as above] … </event_descriptor>
<action_evaluation>CORRECT</action_evaluation>
</tutor_message>

6
In this example, the student attempted problem “MAKING-CANS” in the “PACT-AREA”
lesson of the Geometry tutor, shown in Figure 1. Looking at the tool and tutor message pair, we
see the student correctly entered “200.96” as the answer. Tool and tutor messages are paired with
each other (by the context message), allowing DataShop to interpret the student action and the
tutor’s response in conjunction. These pairs are then stored as a single tutor transaction in the
database. Table 1 below illustrates how actions from the Making Cans example are interpreted
and stored as tutor transactions.
A tutor transaction stores details such as the student identifier, session, time, problem name,
problem step (or subgoal) identifier, attempt number, transaction type (e.g., attempt or hint
request), student input, tutor response, hint number (if this transaction was a hint request)
conditions assigned to the problem step, as well as the knowledge components (skills or
concepts) relevant to the transaction. DataShop can also store “untutored” student actions,
which include a student clicking “play” on an audio or video segment, navigating through pages
of on-line course content, or taking an action in an un-tutored virtual lab like pouring the
contents of one virtual beaker into another. These actions are logged as unpaired tool messages
(i.e., there is no corresponding tutor message) and are stored in the repository as well.

7
Table 1. A simplified tutor transaction excerpt from the “Making Cans” example.
Multiple tool and tutor messages are typically logged for a single problem-solving activity.
Problem-solving activity is broken down into “steps” which represent completion of possible
subgoals or pieces of a problem solution. Students often make multiple attempts at a step or get
instructional help on a step and each of these attempts or help requests are stored as a separate
tutor transaction in the database. In the “Making Cans” example, we see the student attempted
the “(SCRAP-METAL-AREA Q1)” step three times (transaction numbers 2, 3 and 6 in Table 1).
We can ascertain from the transactions that the student was unsuccessful in her first two
attempts, providing an answer of “32” and “4”, both labeled as incorrect by the tutor. On the
third attempt, the student successfully completed the problem step, providing an input of “13.76”
(as can be seen in Figure 1).
To allow for fast and easy analysis of data and distillation into visualizations (discussed later in
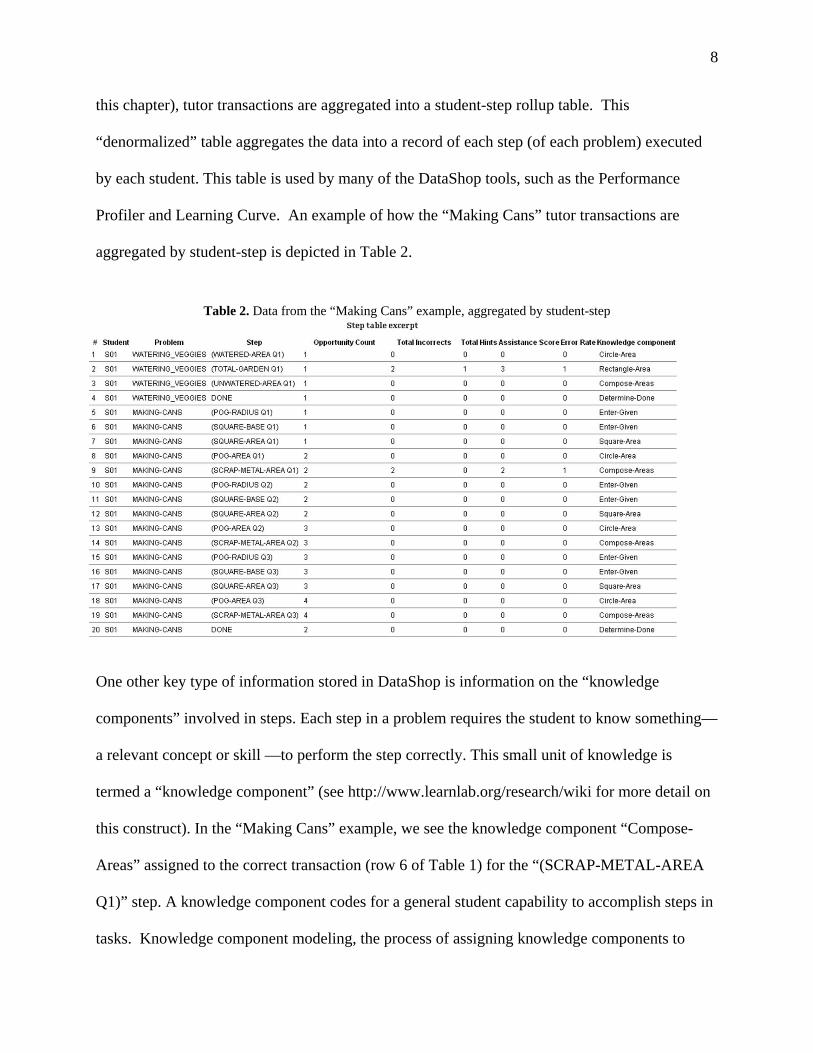
8
this chapter), tutor transactions are aggregated into a student-step rollup table. This
“denormalized” table aggregates the data into a record of each step (of each problem) executed
by each student. This table is used by many of the DataShop tools, such as the Performance
Profiler and Learning Curve. An example of how the “Making Cans” tutor transactions are
aggregated by student-step is depicted in Table 2.
Table 2. Data from the “Making Cans” example, aggregated by student-step
One other key type of information stored in DataShop is information on the “knowledge
components” involved in steps. Each step in a problem requires the student to know something—
a relevant concept or skill —to perform the step correctly. This small unit of knowledge is
termed a “knowledge component” (see http://www.learnlab.org/research/wiki for more detail on
this construct). In the “Making Cans” example, we see the knowledge component “Compose-
Areas” assigned to the correct transaction (row 6 of Table 1) for the “(SCRAP-METAL-AREA
Q1)” step. A knowledge component codes for a general student capability to accomplish steps in
tasks. Knowledge component modeling, the process of assigning knowledge components to

9
steps, bolsters the usefulness of intelligent tutor data, increasing the feasibility of assessing a
student’s knowledge relevant to a given step [cf. 7, 8]. A step can have zero, one, or multiple
knowledge components associated with it.
To document this required concept or skill, a tutor author can label steps with the hypothesized
knowledge component(s) required for correct completion of the step, and this encoding can be
imported into DataShop along with the data. Alternatively, researchers can develop their own
knowledge component to step mappings, either through knowledge engineering, exploratory data
analysis (using DataShop’s Performance Profiler – more on this later), or educational data
mining [cf. 14], and import these mappings into DataShop through the web application.
DataShop provides researchers with an assessment of the goodness of each model (e.g., the
Bayesian Information Criterion [cf. 30]), which can be used to determine which model best
represents the data. Some data sets now have as many as ten different knowledge component
models associated with them, by researchers at multiple universities (for instance, the “Geometry
Area (1996-1997)” data set).
III. Importing and Exporting Learning Data
Data may be imported into the DataShop repository through XML or a tab-delimited text file
format. Logging to DataShop XML provides the richest and most complete data. If logging via
XML, educational software can send messages directly to the DataShop logging server in real
time. This approach is used by example-tracing tutors built in the CTAT framework
(ctat.pact.cs.cmu.edu) [cf. 3]. Logs are automatically processed on a nightly basis, making them
available for analysis or export through the web application. Alternatively, a computer tutor can
write XML to files on the local hard disk (for example, if a tutor is running off-line) and then

10
send the data to the logging server at a later time. Data in a pre-existing log format can also be
converted to DataShop XML and then imported into the repository. This procedure has worked
well for data collected by several types of educational software including Andes
(www.andes.pitt.edu) [19], mathematics Cognitive Tutors (carnegielearning.com) [4], REAP
(reap.cs.cmu.edu) [13], Optimized vocabulary practice [28], and Assistments (assistments.org)
[18]. The tab-delimited format of a transaction table can alternatively be used to import from a
preexisting source.
DataShop offers various data export options through the web application, each delivered in a tab-
delimited text file. These include transaction and student-step level exports (as illustrated in
Tables 1 & 2), and a student-problem aggregate export.
IV. Analysis and Visualization Tools
The DataShop web application provides several tools to assist with analyzing and visualizing
repository data. These tools can be used in conjunction to jump-start data analysis: A researcher
can determine if students are learning by viewing learning curves, then drill down on individual
problems, knowledge components, and students to analyze performance in greater detail.
The following DataShop tools are available for exploratory data analysis:
Dataset Info: provides dataset metrics, contextual information, demographics, high-level
descriptive information (number of students, transactions, knowledge components, etc.) as
well as papers, files, a problem summary table, and the ability to export and import
knowledge component models.

11
Error Report: presents each student’s first attempt at a problem or knowledge
component, including if he or she was correct, the number of students or observations, and
the details of the student’s answer.
Performance Profiler: multi-purpose tool that visualizes student performance at various
grain sizes (problem, step, curriculum level, knowledge component, and student) and offers a
choice of measures of performance (error rate, assistance score, average number of incorrect
actions, average number of hints, and residual error rate). There is support for selecting sub-
sets of interest (“samples”) among the problems or knowledge components in a curriculum.
Figure 2 below shows student performance (proportion of correct answers, errors, and hint
requests) on a sub-set of the problems in Cognitive Tutor Algebra; the y-axis (“Problem”)
represents individual problems, and the proportion of each performance category is shown
along the x-axis.
Figure 2. Performance Profiler tool showing the average Error Rate, which is the incorrect entries (red) plus hints (yellow) on students’ first attempt at each step across a selection of Problems from a Geometry Area data set. Using controls not pictured, the user has selected to view the 6 problems with the lowest

12
error rate and the 6 with the highest error rate. The blue points are predictions based a particular knowledge component model and the statistical model behind the Learning Factors Analysis [14] algorithm.
Learning Curve: visualizes student learning changes over time. The tool can visualize
the change over time in error rate, assistance score, correct step time, and other metrics as
well. The Learning Factors Analysis model [14] can provide predicted values for error rate
learning curves. Figure 3 below depicts error rate learning curves generated by DataShop. In
this graph, “error rate”, or the percentage of students that asked for a hint or made an
incorrect attempt on their first attempt on steps associated with a specific knowledge
component, is shown on the y-axis. The x-axis (“Opportunity”) indicates the nth time (e.g., 4
is the 4th time) a student has (according to the current model) had an opportunity to use a
knowledge component to solve a step in a problem. Each unique step in a problem is distinct
from other problem-solving steps, even if they involve the same knowledge component(s).
Figure 3. Error Rate Learning Curve with predicted values from a Geometry Area dataset. The solid curve represents the actual values, each point is an average across all students and knowledge components for the given opportunity. The dashed curve represents the predicted curve values, based on the Learning Factor Analysis (LFA) model [14], a variant of Item Response Theory.

13
V. Uses of the PSLC DataShop
As indicated above, many recent analyses of data from DataShop have been performed in a
variety of domains. A number of other studies have used, tested or extended the analysis
techniques employed in DataShop including investigations in reading [21], Physics [26], and
Geometry [29]. Often analyses have been targeted at finding ways to improve student learning.
In some cases, the work has been taken full circle such that an analysis led to an instructional
redesign that was demonstrated to improve student learning beyond that realized by the original
instruction. We provide a couple of examples.
Cen, Junker, and Koedinger performed a learning curve analysis using the Learning Factors
Analysis (LFA) algorithm based on data from the Area unit of the Geometry Cognitive Tutor
[15]. They noticed that while students were required to over-practice some easy target
knowledge components or skills (see square-area in Figure 2), they under-practiced some harder
skills (see trapezoid-area in Figure 2). Based on observation and further analysis, they created a
new version of the geometry tutor by resetting parameters that determine how often skills are
practiced. They ran a classroom experiment where students in a course were pre- and post-tested
and randomly assigned to use either the previous or the new tutor version. Students using the
new version took 20% less time to finish the same curriculum units (because over-practice was
eliminated) and learned just as much as measured by normal, transfer, and long-term retention
tests.
A second demonstration of a data mining project that “closed the loop” is work by Baker et al.
[8] who had done formal observations of student behavior in computer labs while working
14
through lessons of a middle school math Cognitive Tutor. Among a number of categories of
disengaged behavior, he found that “gaming the system” had the largest correlation with poor
learning outcomes. Gaming refers to student behavior that appears to avoid thinking and
learning through systematic guessing or fast and repeated requests for increasing help. Baker
used machine learning techniques to build a “detector” capable of processing student log
information, in real time, to determine when students were gaming. The detector became the
basis for an intervention system, a “meta tutor”, designed to discourage gaming and engage
students in supplementary instruction on topics they had gamed. A controlled experiment
demonstrated student-learning benefits associated with this adaptive selection of supplementary
instruction for students observed to be gaming. Since then, the gaming detector has been used
within analyses of why students game [11], and precisely how gaming leads to poorer learning.
Broadly, the data available in DataShop is driving the development of more precise
computational models of human cognition, motivation, and learning. In particular, an ongoing
area of research using DataShop data is the empirical evaluation and improvement of knowledge
representations [cf. 12, 17, 33]. As noted in a major national report, “psychometric validation of
[on-line] assessments is needed so they can be compared with conventional assessments, and
complement and ultimately supplant them” [2].
VI. Data Annotation: A Key Upcoming Feature
Over the next year, one of our key development goals is to make it possible for researchers to
easily upload the results of data mining and computational modeling projects to the data sets
where those analyses took place, annotating transactions, problem steps, and students with
reference to any cognitive, meta-cognitive, or motivational constructs that can be expressed at

15
these grain-sizes. Functionality will be added to enable researchers to connect to DataShop either
programmatically (via a web service) or by uploading annotations within the web application (as
is currently possible for knowledge component models). We believe that adding this capacity to
DataShop will increase its utility, as today’s analyses often build on yesterday’s analyses. For
instance, models of gaming the system and off-task behavior have relied upon estimates of the
probability that the student knew the relevant knowledge components at the time of the behavior.
It will also allow for a larger number of competitive analyses [cf. 6], where multiple modeling
methods are applied to the same data set, and evaluated for comparative goodness of fit.
VII. Conclusions
We have described PSLC’s DataShop, an open repository and web-based tool suite for storing
and analyzing click-stream data, fine-grained longitudinal data generated by online courses,
assessments, intelligent tutoring systems, virtual labs, simulations, and other forms of
educational technology. In contrast to other types of educational data such as video and school-
level data, data in DataShop includes a rich set of semantic codes that facilitate automated
analysis and meaningful interpretation.
The PSLC DataShop uniform data format is an initial attempt to develop a common standard that
we hope will be useful to the field if not as is, then in driving better or more useful common
standards. In addition to being a source for learning data, it is also a place where researchers can
deposit data and then get help from other researchers who can perform secondary analysis on this
data.
DataShop allows free access to a wide variety of data sets and analysis tools. These tools help

16
researchers visualize student performance, difficulties, and learning over time. Such analyses
can lead to demonstrably better instructional designs. The data can also drive improved models
of student cognition, affect, and learning that can be used to improve on-line assessment and on-
line learning. We take as a premise that the human brain constructs knowledge based on a variety
of input sources (e.g., verbal, visual, physical) and in a fashion and at a grain size that may or
may not conform to the structure as conceived by an instructor or domain expert. The question
of how the latent nature and content of human knowledge representation can be discovered from
data is a deep and important scientific question, like for instance, the nature of the human
genome. To answer this question requires a vast collection of relevant data, associated analysis
methods, and new theory.
Acknowledgements
Research supported by National Science Foundation award number SBE-0354420 for the
Pittsburgh Science of Learning Center.
References
1. Advanced Distributed Learning. 2003. SCORM Overview. Unpublished white paper.
Alexandria, VA: Advanced Distributed Learning.
2. Ainsworth, S., Honey, M., Johnson, W. L., Koedinger, K. R., Muramatsu, B., Pea, R.,
Recker, M., and Weimar, S. Cyberinfrastructure for Education and Learning for the Future
(CELF): A Vision and Research Agenda. 2005. Washington, DC: Computing Research
Association.
17
3. Aleven, V., McLaren, B., Sewall, J. and Koedinger, K. 2006. The Cognitive Tutor Authoring
Tools (CTAT): Preliminary Evaluation of Efficiency Gains. Proceedings of the 8th
International Conference on Intelligent Tutoring Systems: 61-70.
4. Anderson, J. R., Corbett, A. T., Koedinger, K. R., and Pelletier, R. 1995. Cognitive tutors:
Lessons learned. The Journal of the Learning Sciences 4 (2): 167-207.
5. Atkins, D.E. (Ed.). 2003. Revolutionizing Science and Engineering Through
Cyberinfrastructure: Report on the National Science Foundation Blue-Ribbon Advisory
Panel on Cyberinfrastructure. Arlington, Virginia: National Science Foundation.
http://www.cise.nsf.gov/sci/reports/atkins.pdf
6. Baker, R.S.J.d., Corbett, A.T., Aleven, V. 2008. Improving Contextual Models of Guessing
and Slipping with a Truncated Training Set. Proceedings of the 1st International Conference
on Educational Data Mining: 67-76.
7. Baker, R.S.J.d., Corbett, A.T., Aleven, V. 2008. More Accurate Student Modeling Through
Contextual Estimation of Slip and Guess Probabilities in Bayesian Knowledge Tracing.
Proceedings of the 9th International Conference on Intelligent Tutoring Systems: 406-415.
8. Baker, R., Corbett, A., Koedinger, K. R., Evenson, S., Roll, I., Wagner, A., Naim, M.,
Raspat, J., Baker, D., and Beck, J. 2006. Adapting to when students game an intelligent
tutoring system. In M. Ikeda, K. D. Ashley, T.-W. Chan (Eds.) Proceedings of the 8th
International Conference on Intelligent Tutoring Systems: 392-401.
9. Baker, R.S.J.d., de Carvalho, A. M. J. A. 2008. Labeling Student Behavior Faster and More
Precisely with Text Replays. Proceedings of the 1st International Conference on Educational
Data Mining: 38-47.
18
10. Baker, R.S.J.d., de Carvalho, A.M.J.A., Raspat, J., Aleven, V., Corbett, A.T., Koedinger,
K.R. 2009. Educational Software Features that Encourage and Discourage "Gaming the
System". Proceedings of the 14th International Conference on Artificial Intelligence in
Education: 475-482.
11. Baker, R., Walonoski, J., Heffernan, N., Roll, I., Corbett, A., Koedinger, K. 2008. Why
Students Engage in "Gaming the System" Behavior in Interactive Learning Environments.
Journal of Interactive Learning Research 19 (2): 185-224.
12. Barnes, T., D. Bitzer, and Vouk, M. 2005. Experimental analysis of the q-matrix method in
knowledge discovery. Proceedings of the 15th International Symposium on Methodologies
for Intelligent Systems, May 25-28, 2005, Saratoga Springs, NY.
13. Brown, J., Frishkoff, G., Eskenazi, M. 2005. Automatic Question Generation for Vocabulary
Assessment. Proceedings of the Annual Human Language Technology Meeting: 249-254.
14. Cen, H., Koedinger, K., and Junker, B. 2006. Learning Factors Analysis - A general method
for cognitive model evaluation and improvement. Proceedings of the 8th International
Conference on Intelligent Tutoring Systems.
15. Cen, H., Koedinger, K., and Junker, B., 2007. Is over practice necessary? – Improving
learning efficiency with the cognitive tutor through educational data mining. In Rose Luckin
and Ken Koedinger (Eds.) Proceedings of the 13th International Conference on Artificial
Intelligence in Education: 511-518.
16. Duval, E., and Hodgins, W. 2003. A LOM Research Agenda. Proceedings of WWW2003 -
Twelfth International World Wide Web Conference, 20-24 May 2003, Budapest, Hungary.
17. Falmagne, J.-C., Koppen, M., Villano, M., Doignon, J.-P. 1990. Introduction to knowledge
spaces: How to build, test, and search them. Psychological Review 97: 201-224.

19
18. Feng, M., Heffernan, N.T. 2007. Towards Live Informing and Automatic Analyzing of
Student Learning: Reporting in ASSISTment System. Journal of Interactive Learning
Research 18 (2): 207-230.
19. Gertner, A.S., and VanLehn, K. 2000. Andes: A Coached Problem-Solving Environment for
Physics. Proceedings of the 5th International Conference on Intelligent Tutoring Systems:
133-142.
20. Hausmann, R., and VanLehn, K. 2007. Self-explaining in the classroom: Learning curve
evidence. In McNamara and Trafton (Eds.), Proceedings of the 29th Annual Cognitive
Science Society: 1067-1072.
21. Leszczenski, J. M. and Beck J. E. 2007. What’s in a word? Extending learning factors
analysis to model reading transfer. Proceedings of the Educational Data Mining Workshop at
the 14th International Conference on Artificial Intelligence in Education: 31-39.
22. MacWhinney, B., Bird, S., Cieri, C., Martell, C. 2004. TalkBank: Building an open unified
multimodal database of communicative interaction. Proceedings of the 4th International
Conference on Language Resources and Evaluation.
23. Matsuda, N., Cohen, W., Sewall, J., Lacerda, G., and Koedinger, K. R. 2007. Evaluating a
simulated student using real students data for training and testing. In C.Conati, K. McCoy,
and G. Paliouras, (Eds.) Proceedings of the 11th International Conference on User Modeling,
UM2007: 107-116.
24. Matsuda, N., Cohen, W., Sewall, J., Lacerda, G., and Koedinger, K. R. 2007. Predicting
students’ performance with SimStudent: learning cognitive skills from observation. In R.
Lukin, K.R. Koedinger, and J. Greer, (Eds.) Proceedings of the 13th International
Conference on Artificial Intelligence in Education: 467-476.

20
25. McLaren, B. M., Lim, S., Yaron, D., and Koedinger, K. R. 2007. Can a polite intelligent
tutoring system lead to improved learning outside of the lab? In Luckin and Koedinger (Eds.)
Proceedings of the 13th International Conference on Artificial Intelligence in Education:
433-440.
26. Nwaigwe, A., Koedinger, K.R., VanLehn, K., Hausmann, R., and Weinstein, A. 2007.
Exploring alternative methods for error attribution in learning curves analyses in intelligent
tutoring systems. In Luckin and Koedinger (Eds.) Proceedings of the 13th International
Conference on Artificial Intelligence in Education: 246-253.
27. Ohlsson, S. and Mitrovic, A. 2006. Constraint-based knowledge representation for
individualized instruction. Computer Science and Information Systems: 1-22.
28. Pavlik Jr., P. I., Presson, N., and Koedinger, K. R. 2007. Optimizing knowledge component
learning using a dynamic structural model of practice. In R. Lewis and T. Polk (Eds.)
Proceedings of the Eighth International Conference of Cognitive Modeling.
29. Rafferty, A. N. and Yudelson, M. 2007. Applying learning factors analysis to build
stereotypic student models. Proceedings of 13th International Conference on Artificial
Intelligence in Education.
30. Raftery, A. 1995. Bayesian Model Selection in Social Science Research. Sociological
Methodology 28: 111-163.
31. Ritter, S., and Koedinger, K. R. 1998. An architecture for plug-in tutor agents. Journal of
Artificial Intelligence in Education 7 (3-4): 315-347.
32. Smythe, C., and Roberts, P. 2000. An Overview of the IMS Question & Test Interoperability
Specification, Proceedings of the Conference on Computer Aided Assessment (CAA'2000),
Leicestershire, UK.

21
33. Tatsuoka, K. 1983. Rule space: An approach for dealing with misconceptions based on item
response theory. Journal of Educational Measurement 20 (4): 345-354.