a cross-validated cytoarchitectonic atlas of the human...
TRANSCRIPT

Contents lists available at ScienceDirect
NeuroImage
journal homepage: www.elsevier.com/locate/neuroimage
A cross-validated cytoarchitectonic atlas of the human ventral visual stream
Mona Rosenkea,⁎, Kevin S. Weinera, Michael A. Barnetta, Karl Zillesb,c, Katrin Amuntsb,d,Rainer Goebele,f, Kalanit Grill-Spectora,g
a Department of Psychology, Stanford University, Stanford, CA, United Statesb Institute for Neuroscience and Medicine (INM-1), and JARA Brain, Research Centre Jülich, Jülich, Germanyc Department for Psychiatry, Psychotherapy and Psychosomatics, University Hospital Aachen, RWTH Aachen University, and JARA-BRAIN,Aachen, Germanyd C. and O. Vogt Institute for Brain Research, Heinrich Heine University Düsseldorf, Germanye Faculty of Psychology and Neuroscience, Maastricht University, The Netherlandsf Netherlands Institute for Neuroscience, Amsterdam, The Netherlandsg Stanford Neuroscience Institute, Stanford, CA, United States
A R T I C L E I N F O
Keywords:Visual cortexBrain parcellationCortex-based alignmentHuman brain atlasRetinotopyObjecet recognition
A B S T R A C T
The human ventral visual stream consists of several areas that are considered processing stages essential forperception and recognition. A fundamental microanatomical feature differentiating areas is cytoarchitecture,which refers to the distribution, size, and density of cells across cortical layers. Because cytoarchitectonicstructure is measured in 20-micron-thick histological slices of postmortem tissue, it is difficult to assess (a) howanatomically consistent these areas are across brains and (b) how they relate to brain parcellations obtainedwith prevalent neuroimaging methods, acquired at the millimeter and centimeter scale. Therefore, the goal ofthis study was to (a) generate a cross-validated cytoarchitectonic atlas of the human ventral visual stream on awhole brain template that is commonly used in neuroimaging studies and (b) to compare this atlas to a recentlypublished retinotopic parcellation of visual cortex (Wang et al., 2014). To achieve this goal, we generated anatlas of eight cytoarchitectonic areas: four areas in the occipital lobe (hOc1-hOc4v) and four in the fusiformgyrus (FG1-FG4), then we tested how the different alignment techniques affect the accuracy of the resultingatlas. Results show that both cortex-based alignment (CBA) and nonlinear volumetric alignment (NVA)generate an atlas with better cross-validation performance than affine volumetric alignment (AVA).Additionally, CBA outperformed NVA in 6/8 of the cytoarchitectonic areas. Finally, the comparison of thecytoarchitectonic atlas to a retinotopic atlas shows a clear correspondence between cytoarchitectonic andretinotopic areas in the ventral visual stream. The successful performance of CBA suggests a coupling betweencytoarchitectonic areas and macroanatomical landmarks in the human ventral visual stream, and furthermore,that this coupling can be utilized for generating an accurate group atlas. In addition, the coupling betweencytoarchitecture and retinotopy highlights the potential use of this atlas in understanding how anatomicalfeatures contribute to brain function. We make this cytoarchitectonic atlas freely available in both BrainVoyagerand FreeSurfer formats (http://vpnl.stanford.edu/vcAtlas). The availability of this atlas will enable futurestudies to link cytoarchitectonic organization to other parcellations of the human ventral visual stream withpotential to advance the understanding of this pathway in typical and atypical populations.
Introduction
The ventral visual pathway, a stretch of cortex including the ventralaspects of the occipital and temporal lobes, is a key processing streaminvolved in visual perception and recognition (Goodale et al., 1991;Mishkin et al., 1983; Grill-Spector and Weiner, 2014). A majorneuroscientific goal is to understand the anatomical infrastructurecomposing this pathway. A classic microanatomical feature defining an
area is cytoarchitecture – or the spatial arrangement of cell bodies andtypes in the six-layered cortical ribbon (Amunts and Zilles, 2015;Brodmann, 1909; Campbell, 1905; Smith, 1907; v.Economo andKoskinas, 1925), which is considered to be tightly linked to thefunctional properties of an area. To characterize the distribution anddensity across cortical layers, which is the main criterion to delineateboundaries between cytoarchitectonic brain areas, postmortem brainsare stained to differentiate cell bodies of neurons and glial cells from
http://dx.doi.org/10.1016/j.neuroimage.2017.02.040Accepted 14 February 2017
⁎ Correspondence to: Department of Psychology, Stanford University, Jordan Hall, Bld. 420, Stanford, CA 94305-2130, United States.E-mail address: [email protected] (M. Rosenke).
NeuroImage xxx (xxxx) xxx–xxx
1053-8119/ © 2017 Elsevier Inc. All rights reserved.
Please cite this article as: Rosenke, M., NeuroImage (2017), http://dx.doi.org/10.1016/j.neuroimage.2017.02.040

other compartments of the cortical tissue (e.g. myelinated nerve fibers,axons, dendrites). Even though established more than a century ago, alarge majority of present neuroimaging studies still relate their findingsto Brodmann's (1909) classic cytoarchitectonic parcellation.
While influential, there are several limitations to Brodmann's andother classical approaches (Bailey and Bonin, 1951; Brodmann, 1909;Campbell, 1905; Smith, 1907; v.Economo and Koskinas, 1925) used todefine brain areas based on cytoarchitectonics (Zilles and Amunts,2010). First, classical approaches lack important information regardingthe inter-subject variability of cytoarchitectonic structures. Second, thecriteria used for histological distinctions were not clearly defined andresearchers identified boundaries based on visual inspection of histo-logical sections. Consequently, definitions of cytoarchitectonic bound-aries depend on subjective judgments made by particular observers,leading to contention among researchers regarding the location ofboundaries, especially in higher sensory and association cortices.Third, the cytoarchitectonic areas that were identified with thisapproach were typically summarized by schematic drawings indicatingtheir approximate location on the brain. As such, they are oftenoversimplified. Further, there is no precise method to project theseschematics onto actual anatomical brain volumes obtained by modernmagnetic resonance imaging (MRI) techniques to allow for comparisonto other brain parcellation methods (Amunts et al., 2013; Glasser et al.,2016; Glasser and Van Essen, 2011; Yeo et al., 2011; Zilles andAmunts, 2009). A common solution to project these areas ontoanatomical MRIs has been to manually approximate locations of thesecytoarchitectonic areas relative to cortical folding patterns (e.g.Talairach and Tournoux, 1988, Scholtens et al., 2015; van denHeuvel et al., 2015). This, however, results in considerable subjectivityand uncertainty in localizing cytoarchitectonic areas.
To overcome the problems of classical approaches, methodologicaladvancements in the last 20 years have yielded new methods enablingmore accurate delineation of cytoarchitectonic areas in the humanbrain (Schleicher et al., 2005, 1999, 1998). The main advantages ofthese modern techniques are that (1) the definitions of areal bound-aries are observer-independent and statistically testable, and (2)properties of each cytoarchitectonic area are determined based onthe analysis of histological structure of multiple brains. Specifically, anobserver-independent algorithm identifies locations along the corticalribbon in which the density and layering of cell bodies across thecortical depth (referred to as gray level index, GLI), show a significantchange (Schleicher et al., 1999, 1998). For a cytoarchitectonic bound-ary to be accepted, it has to be consistently found in neighboring serialsections and across brains. Finally, cytoarchitectonic areas identified inhistological sections are registered to the anatomical MRI volumes ofeach brain taken prior to histological processing. This not onlyidentifies the precise location of a cytoarchitectonic area in each brain,but also corrects for shrinkage artifacts associated with histologicalprocessing (Amunts et al., 2000).
Using this approach, eight cytoarchitectonic areas have beenidentified in the human ventral visual stream (hOc1-hOc4v: Amuntset al., 2000; Rottschy et al., 2007, FG1-FG4: Caspers et al., 2013;Lorenz et al., 2015, see Fig. 1). Additionally, a probabilistic atlas ofthese cytoarchitectonic areas has been incorporated into the SPMtoolbox (Eickhoff et al., 2005). However, it is unknown how well theseprobabilistic maps predict the location of these cytoarchitectonic areasin new subjects, and whether cytoarchitectonic parcellations corre-spond to other parcellations of the human ventral visual stream (e.g.,Glasser et al., 2016; Wang et al., 2014).
To fill these gaps in knowledge we (1) generated a cross-validatedprobabilistic atlas of cytoarchitectonic areas in the human ventralvisual stream extending from the occipital lobe through ventraltemporal cortex (VTC) and (2) compared the cross-validated cytoarch-itectonic atlas to a recently published retinotopic atlas of human visualcortex (Wang et al., 2014).
Importantly, we tested how different alignment approaches affect
the accuracy of the generated atlas. Specifically, we generated atlasesusing three different methods: (1) an affine volumetric alignment(AVA) to the MNI305 brain, (2) a nonlinear volumetric alignment(NVA) to the Colin27 brain, and (3) cortex-based alignment (CBA),which aligns brains based on cortical folding patterns (Fischl et al.,1999; Frost and Goebel, 2012a, 2012b) to a common brain. Here weused the FreeSurfer average brain, which is an average cortical surfaceof 39 independent living participants. We quantitatively assessed theperformance of the different methods by (1) evaluating the consistencyof cytoarchitectonic areas across brains and (2) quantifying how welleach method predicts the location of cytoarchitectonic areas in newbrains using an exhaustive leave-one-out cross-validation procedure.Recent reports find a strong coupling between cytoarchitectonicboundaries relative to macroanatomical landmarks in ventral occipi-tal-temporal cortex (Lorenz et al., 2015; Rottschy et al., 2007; Weineret al., 2014) and provide evidence that cortex-based alignmentimproves the inter-subject registration of two cytoarchitectonic areaswithin the human occipital lobe (Fischl et al., 2008). Thus, wehypothesized that registering brains using alignment methods thatuse macroanatomical features would increase the inter-subject consis-tency of cytoarchitectonic areas and produce a more precise group atlasof cytoarchitectonic areas of the human ventral visual stream comparedto affine volumetric alignment that does not use macroanatomicallandmarks.
Methods
Definition of cytoarchitectonic areas (cROIs)
Cytoarchitectonic regions of interest (cROIs) were defined pre-viously from a sample of 11 postmortem (PM) adult brains (5 females;Amunts et al., 2000; Caspers et al., 2013; Lorenz et al., 2015; Rottschyet al., 2007). Each cROI was defined in 10 PM brains. hOc1-hOc4v, aswell as FG1 and FG2, were defined on the same 10 brains. FG3 andFG4 were defined on 9 of these brains and in one additional PM brain,resulting in 11 brains in total. The brains were obtained from the bodydonor program of the Institute of Anatomy at the University ofDüsseldorf. Donors had no neurological or psychiatric diseases, exceptone case with transitory motor disease (for details see Table 1 inAmunts et al., 2000; Caspers et al., 2013; Rottschy et al., 2007). Within8–24 h after death the brains were removed and fixated in 4% formalinor Bodians's fixative for a time period of at least six months. Before thebrains were histologically processed, each brain was scanned at aSiemens 1.5 T scanner (Erlangen, Germany). A high-resolution anato-mical image of the whole brain was acquired, using a T1-weighted 3D-FLASH sequence (1 mm isotropic, TR = 40 ms, TE = 5 ms, flip angle =40°). Following that, the brains were embedded in paraffin, seriallysectioned in oblique close to coronal sections of 20 μm and every 15th
slice was stained for cell bodies (Merker, 1983). Detailed methods ofhistology and 3D reconstruction have been described previously(Amunts et al., 2005; Amunts et al., 1999; Zilles et al., 2002).
Characteristics of ventral visual stream cROIs
There are four cROIs in the occipital lobe:Human occipital cytoarchitectonic area 1, hOc1 (Amunts et al.,
2000), is located in the calcarine sulcus (Fig. 1a – dark green). Thisarea closely matches functionally defined area V1 (Abdollahi et al.,2014; Hinds et al., 2009; Wohlschläger et al., 2005) and corresponds toBrodmann area 17 (Brodmann, 1909). hOc1 is characterized by a clearlayered structure with prominent layer IV, which is further subdividedinto sublayers, small cells in layer III and V, and a dense layer VI(Amunts et al., 2000).
Human occipital cytoarchitectonic area 2, hOc2 (Amunts et al.,2000), surrounds hOc1 both inferiorly and superiorly. It has a thinnerlayer IV compared to hOc1, a cell dense layer III, and shows a
M. Rosenke et al. NeuroImage xxx (xxxx) xxx–xxx
2

columnar organization (Fig. 1a - red); hOc2 matches area 18 ofBrodmann (1909).
Human occipital cytoarchitectonic area 3 ventral, hOc3v (Rottschyet al., 2007), follows hOc2 ventrally and is located in the collateralsulcus, CoS. It does not have a clear border between layer II and III, hasa moderately dense and indistinctive layer IV, and shows a columnarorganization ( Fig. 1a - cyan).
Human occipital cytoarchitectonic area 4 ventral, hOc4v (Rottschyet al., 2007), is located on the ventral aspect of the occipital lobe,anterior to hOc3v. Compared to hOc3v, it is characterized by a denselayer II and a cell dense, prominent layer IV (Fig. 1b - yellow).
There are four cROIs in the fusiform gyrus (FG) and surroundingsulci:
FG1 is located on the posterior and medial fusiform gyrus andextends to the collateral sulcus (CoS, Caspers et al., 2013). It displays acolumnar arrangement of small pyramidal cells and a thin and cellsparse layer IV (Caspers et al., 2013, Fig. 1b - light green).
FG2 is located on the posterior fusiform gyrus, lateral to the mid-fusiform gyrus (MFS) and extends to the occipito-temporal sulcus(OTS, Fig. 1b - pink). It shows large pyramidal cells in layer III, aprominent layer IV, but a less pronounced columnar organization.Additionally, FG2 is characterized by a higher cell density compared toFG1 (Caspers et al., 2013).
FG3 is located on the medial fusiform gyrus, anterior to FG1 andcovers the medial aspect of the FG and extends to the CoS (Lorenzet al., 2015). FG3 shows a compact and dense layer II, a prominentsub-layer IIIc with medium-sized pyramidal cells, and little clusters ofgranular cells in layer IV (Lorenz et al., 2015, Fig. 1b - dark blue).
FG4 is located on the lateral FG, anterior to FG2 and covering thelateral aspect of the FG, extending to the OTS (Fig. 1b - dark red). It hasa less densely packed layer II, broad layer III, a thin, moderately denselayer IV, and a cell dense layer VI (Lorenz et al., 2015, Fig. 1b - darkred).
Analysis pipeline
Each of the postmortem brains was manually segmented toseparate gray from white matter using ITK-SNAP (http://www.itksnap.org/pmwiki/pmwiki.php). Subsequently, each brain'sanatomical T1-weighted image, cortical segmentation, andcytoarchitectonic areas were further analyzed in BrainVoyager QX 2.8(Brain Innovation, Maastricht, The Netherlands) if not statedotherwise. The anatomy of each postmortem brain was aligned via anaffine transformation to the MNI305 template (Evans et al., 1993;Evans et al., 1992). The same transformation was applied to eachcytoarchitectonic area to bring it to the MNI305 template. Thesegmentations were then used to create a cortical surfacereconstruction for each individual brain and each hemisphere,separately (Fig. 2). Subsequently, cytoarchitectonic areas wereprojected from each brain's volume to their cortical surfacereconstruction.
Comparison of different brain alignment methods and their effect onthe between-subject consistency of cROIs
To investigate whether alignment of macroanatomical structuresinfluences the correspondence of cytoarchitectonic areas across brains,we performed three different brain alignments to generate agroup atlas: (1) affine volumetric alignment (AVA) to the MNI305template (http://www.bic.mni.mcgill.ca/ServicesAtlases/MNI305), (2)nonlinear volumetric alignment (NVA) to the Colin27 brain (http://www.bic.mni.mcgill.ca/ServicesAtlases/Colin27) brain, and (3) cortex-based alignment (CBA) to the FreeSurfer average (fsaverage) brain.
Affine volume alignment to the MNI305 brain (AVA)As each of the individual brain anatomies and cytoarchitectonic
areas were normalized to the MNI305 template in the previous step,
Fig. 1. Eight cytoarchitectonic areas in human occipital and ventral temporal cortex. (a) Four occipital cytoarchitectonic regions of interest (cROIs). Left: occipital cROIs onan inflated cortical surface of an example postmortem brain. The surface is shown in a posterior-medial view (see inset). Color coding of cROIs corresponds to the colors on the rightpanels. Right 4 panels: Each panel depicts an example histological slice of a cROI. Cell bodies were stained using the Merker method (Merker, 1983) and borders were defined using aquantitative observer-independent algorithm. All sections are taken from the same brain. Note differences in the packing density of cells, the size and shape of cell bodies, and the widthof cortical layers, which together form the basis to distinguish cytoarchitectonic areas from one another. Roman numerals indicate cortical layer. (b) Four fusiform gyrus (FG) cROIs.Left: ventral cROIs on the same example inflated cortical surface (see inset for zoomed portion). Right 4 panels: histological slices of FG cROIs. Acronyms: hOc1-2: human occipitalcytoarchitectonic areas 1 and 2; hOc3v-4v: human occipital cytoarchitectonic ventral areas 3 and 4; FG1-4: fusiform gyrus areas 1–4; CaS: Calcarine sulcus; CoS: Collateral sulcus; OTS:Occipito-temporal sulcus.
M. Rosenke et al. NeuroImage xxx (xxxx) xxx–xxx
3

the cytoarchitectonic areas of all brains were already in the commoncoordinate system of the MNI305 anatomy.
Nonlinear volume alignment to the Colin27 brain (NVA)Brains in native space were first aligned to Colin27 using an affine
volume registration using AFNI tools to bring them to the sameorientation and reference frame. Then, we utilized a nonlinear align-ment to align each brain to the Colin27 brain using a nonlineartransformation implemented in ANTS (https://sourceforge.net/projects/advants/). Code used for the affine and nonlineartransformation can be found here: https://github.com/VPNL/cyto-functional. The same two-step transformation was applied to thecROIs to register them from the individual brain to the commonvolume of the Colin27 brain.
Cortex-based alignment to the FreeSurfer average brain (CBA)The left and right cortical surfaces of each brain were inflated into a
sphere and curvature maps of gyri and sulci were created. First, eachbrain was rotated to best match the curvature pattern of the fsaverageusing an initial rigid alignment. The best match was established by thelowest variability in curvature between each respective brain and thetarget brain (details in Frost and Goebel, 2012a, 2012b; Goebel,Esposito, and Formisano, 2006). Second, a non-rigid cortex-basedalignment was initiated by iteratively aligning curvature maps of all PMbrains to the target through vertex movements. This process is doneiteratively, yielding a coarse to fine curvature alignment with four levelsof anatomical detail. For each postmortem hemisphere, the sphere-to-sphere mapping file aligning the individual brain's cortical surface tothe fsaverage was saved during the alignment process. We applied thistransformation to each cytoarchitectonic area to bring it into alignmentwith the common fsaverage surface.
To evaluate whether the template used for generating the atlasaffects the accuracy of the atlas, we compared CBA to the fsaverage(CBAfs) to CBA to the mean cortical surface of the postmortem brains(CBApm, see accompanying Data in Brief, DiB). Results show that
performance is similar across the two templates with slight advantageto CBAfs over CBApm for hOc1 and FG3 (Fig. 1 in DiB). As thefsaverage is (1) more commonly used in fMRI analyses, (2) based onindependent data (same as the other templates used for AVA andNVA), and (3) its performance is the same or superior to CBApm, allsubsequent analyses in the main manuscript use CBA to the fsaveragebrain.
Creation of group cytoarchitectonic probability mapsWe transformed each individual brain's cytoarchitectonic areas to
each of three common brain spaces: MNI305 (Fig. 2c), Colin27(Fig. 2d), and fsaverage (Fig. 2e). A group map of each cytoarchitec-tonic area (cROI) was generated by averaging the binarized cROIs (1:cROI present; 0: cROI absent) of each brain in each of the commonbrain spaces. Thus, the value at each voxel (or vertex on the corticalsurface for CBA) in the group map represents the proportion ofsubjects in which this voxel/vertex of the brain belongs to a givencytoarchitectonic area. For example, a value of 0 means that this voxel/vertex did not belong to that cytoarchitectonic area in any brain, a valueof .5 means that it belonged to the area in half of the brains, and a valueof 1 indicates that it belonged to the cytoarchitectonic area in all brains.
Evaluating the cross-validation performance of the differentalignment methods
We quantified how well the group cROI predicts cROIs in individualbrains using an exhaustive leave-one-out cross-validation procedure.In each iteration, we created a group probabilistic map of each cROIbased on all brains but one, and tested how well it predicted thelocation and extent of the cytoarchitectonic area in the left-out brain.This procedure was repeated for all combinations of left-out brains,and separately for each of the three alignment methods. We estimatedthe predictability of the group probabilistic cROI (G) and the left-outcROI (I) by calculating the dice coefficient (dc) between these cROIs:
Fig. 2. Generating a group cytoarchitectonic atlas. The pipeline involves the following steps: (a) At the individual subject level, cytoarchitectonic areas from histological slices aretransformed to the MRI of that brain. (b) The individual cytoarchitectonic areas are projected to the cortical surface reconstruction of that brain. (a,b) show a coronal slice and corticalsurface, respectively, of an individual postmortem (PM) brain and cytoarchitectonic area FG1 (green). Individual subject cROIs are transformed to a common brain template using one of3 methods described in (c-e). In this common space, cROIs are averaged across subjects to yield a map of proportion overlapping subjects at each point in the brain (see colorbar). (c)Affine volume alignment (AVA) to the MNI305 brain: Volume anatomies and cROIs were aligned to the MNI305 template brain. (d) Nonlinear volume alignment (NVA) to Colin27:Volume anatomies and cROIs were warped to the Colin27 template using ANTS. (e) Cortex-based alignment (CBA) to the FreeSurfer average brain (fsaverage): Cortical surfaces of PMbrains and cROIs were aligned to the FreeSurfer average surface using CBA.
M. Rosenke et al. NeuroImage xxx (xxxx) xxx–xxx
4

dc I GI G
= 2 | ∩ || |+| |
The dice coefficient is a statistic used for comparing the similarity oftwo samples (Dice, 1945; Sørensen, 1948). A dice coefficient of zeroindicates no predictability and a dice coefficient of 1 indicates perfectpredictability. We applied different threshold levels to the groupprobabilistic cROI (G) to predict the location of the left-out-brain.
To perform statistical analyses comparing dice coefficients acrossalignment methods, we used two different thresholds: (1) unthre-sholded data and (2) the threshold level that generated the highestpredictability across alignments and cROIs. To determine the latter, weaveraged dice coefficient values across alignment methods, hemi-spheres, and cROIs, resulting in one dice coefficient per thresholdlevel. Comparison across thresholds revealed that the threshold of .33produced the highest predictability. Therefore, this threshold was usedfor the comparison.
To evaluate whether there were statistically significant differencesin cross-validation performance across alignment methods and hemi-spheres, we used a non-parametric version of the analysis of variance,the Friedman test (Upton and Cook, 2008) as our data is not normallydistributed. Once establishing significant differences across alignmentmethods, we performed pairwise comparisons between methods usingpaired permutation tests within each cROI. We tested all three possiblepairwise comparisons: AVA vs. NVA, AVA vs. CBA, and NVA vs. CBA.To perform the paired permutation test, we generated a null distribu-tion for which alignment labels were randomly shuffled 10,000 times.Using this null distribution, we estimated a p-value indicating theprobability that the measured dice coefficients were derived from thisnull distribution. Statistical significance was Bonferroni corrected toadjust for the increased Type I error rate due to multiple comparisons.
Evaluating whether cROI size affects cross-validation performanceThe probability that a cROI overlaps across subjects and its predict-
ability may be related to the size of the cROI. To test this, we determinedif there is a correlation between the cross-validated dice coefficient andaverage cROI size. We also estimated the chance level dice coefficient foreach cROI size. To do so, we generated synthetic data of cortical disksmatched for each cROI size, randomly placed them within the anatomicalmask of the ventral part of occipital cortex and ventral temporal cortex(Fig. 4, right inset), and estimated the chance level dice coefficient giventhis area size for each threshold level. For each iteration, we randomlyplaced 8 discs (as for the cross-validated data) to generate the groupprobability map, and one additional random disk that simulated the left-out subject. The dice coefficient was computed the same way as for theactual data. We ran 10,000 iterations per simulated cROI size andcalculated the chance dice coefficient for each threshold level. Chancelevel was estimated separately for cortex-based alignment (CBA) andvolume based alignment (AVA and NVA) for several reasons: (1) thenumber of voxels in the volume is greater than on the cortical surface, asthe volume, but not the surface, has a depth component, (2) the spatialvariability of cROIs on the cortical surface is limited to the 2 dimensionsof the cortical surface but in the volume they can vary in 3 dimensions,and (3) the resolution of the standard cortical surface in BrainVoyager iscoarser than the resolution of the volume. Results of these simulationsare shown in the volume (dashed yellow lines) and surface (light bluelines) in Fig. 4. To establish whether the measured dice coefficients weresignificantly higher than the empirical chance level we used permutationtesting, comparing AVA and NVA to volume chance level (Fig. 4 – dashedyellow), and CBA to surface chance level (Fig. 4 – dashed light blue).
Creating a ventral visual stream cytoarchitectonic atlas
After comparing alignment methods, we used cortex-based alignmentto generate a human ventral visual stream cytoarchitectonic atlas.
Maximum-probability map (MPM) of cROIsThe probability maps generated in the previous section determine
the probability that each voxel/vertex belongs to a given cROI.However, it is possible that a point on the brain may belong to morethan one probabilistic cROI. This overlap is more likely to occur alongboundaries of neighboring cytoarchitectonic areas. In order to assign aunique cytoarchitectonic label to each vertex in the atlas, we generateda maximum-probability map (MPM) of each area (Eickhoff et al.,2005). We used the probabilistic cROIs generated with CBA to theFreeSurfer average (fsaverage) brain, as this method yielded thehighest dice coefficients (Fig. 4) and the fsaverage brain is widely usedin the neuroimaging community (Benson et al., 2014, 2012; Glasseret al., 2016; Hinds et al., 2009; Wang et al., 2014).
Using probabilistic cROIs generated with CBA, we determinedwhich vertices were shared by more than one probabilistic cROI andassigned these vertices to a single cROI based on the group cROI thathad the highest probability at that vertex (Eickhoff et al., 2005). Incases where one vertex had the same probability across multiple cROIs,we used the probability of the neighboring vertices to make thedecision. The neighborhood was determined iteratively starting fromthe nearest neighbors. In brief, for vertices that were assigned to morethan one cROI, we first calculated the average probability of each cROIacross the vertex and its nearest neighbors. The vertex was thenassigned to the cROI that yielded the highest neighborhood probability.If the neighborhood probability was still identical across cROIs, theneighborhood was increased by the next set of nearest neighbors andthe neighborhood probability was evaluated again. This process wasrepeated iteratively until the probability for one cROI was greater, orthe neighborhood size exceeded the size of the cROI (a case that did nothappen in this dataset). As a last step, vertices that did not have at leastone 3rd degree neighbor were either (a) deleted if they did not belong toany probability map before overlap removal, or (b) were assigned to thecROI with the 2nd highest probability if it was surrounded byneighbors of that cROI.
This process creates an MPM of each cytoarchitectonic area thateliminates vertices that are shared across cROIs at the group level, thusgenerating a unique, non-overlapping tiling of the ventral visual streamby the eight cytoarchitectonic areas (Fig. 6).
Determining the relationship between cytoarchitectonic andretinotopic parcellations of human ventral visual cortex
One utility of this cytoarchitectonic atlas is that it can be comparedto other atlases and parcellations of human visual cortex. Here, wecompared our atlas to a functional atlas of retinotopic visual areas(Wang et al., 2014). We compared our cROI atlas to the retinotopicatlas for the following reasons: (1) cytoarchitectonic and retinotopicatlases are based on independent methods (cytoarchitecture andvisual field topography respectively) and (2) both of these atlasesare based on key features scientists use to parcellate the brain(Felleman and Van Essen, 1991), (3) retinotopy is the single mostcommonly agreed method used to define areas in visual cortex(Wandell and Winawer, 2015, 2011) and (4) both atlases are alignedto the fsaverage brain using CBA. Thus, we compared different datathat were aligned using the same algorithm as well as the samecommon brain template.
To test the correspondence between cROIs and retinotopic ROIs,we calculated the percentage overlap between each of the group fROIsand each of the individual PM cROIs aligned to the fsaverage brain.This resulted in 10 values per fROI-cROI combination per hemisphere.We performed this analysis for all retinotopic visual areas in the Wanget al. (2014) atlas that were in occipital and ventral temporal cortex: V1(combination of their V1d and V1v), V2d, V2v, V3v, VO1, VO2, PHC1,PHC2.
Additionally, we computed the chance level overlap between eachfROI-cROI pair to test if the overlap between a retinotopic area and
M. Rosenke et al. NeuroImage xxx (xxxx) xxx–xxx
5

cROI is significantly different from chance. We estimated the chancelevel by calculating the average percentage overlap between a givenretinotopic ROI and a randomly chosen cROI from a randomly chosenPM brain. This procedure was repeated 1000 times with replacements.We used a permutation test to evaluate whether the reported percen-tage overlap between retinotopic fROIs and cROIs were above chance.Those comparisons were Bonferroni corrected for each fROI by a factorof 7 (8 cROIs per fROI). We used a Friedman's test (Upton and Cook,2008) to test for hemispheric differences.
Results
Cortex-based alignment improves the precision of group cROI mapscompared to volumetric alignments
Using data from 10 postmortem brains per cROI, we generated agroup map of 8 cytoarchitectonic ventral visual stream areas usingthree methods: (1) affine volumetric alignment (AVA) to the MNI305template, (2) nonlinear alignment to the Colin27 template (NVA), and(3) cortex-based alignment to the fsaverage atlas brain (CBA, seeMethods and Fig. 2 for methodological details). Fig. 3 illustrates
resulting group maps derived by each of these methods for an examplecytoarchitectonic area in occipital cortex (hOc2) and an example areain ventral temporal cortex (FG1).
Qualitative examination of these maps highlights two observa-tions. First, the location and shape of the group cROI generated byCBA largely resembles the individual brain example for CBA, but theresemblance is poorer for the group cROIs generated by AVA andNVA (Fig. 3). For example, in the representative brain hOc2 illus-trates a ring-like arrangement surrounding the calcarine sulcus(Fig. 3a - top left). Likewise, the group hOc2 generated by CBAillustrates a similar arrangement surrounding the calcarine in therespective common cortical surface. In contrast, AVA and NVAgenerate a group hOc2 that does not illustrate a ring shape aroundthe calcarine sulcus, but instead, almost entirely encompasses thecalcarine sulcus. The latter alignments are clearly erroneous, as it iswell established that the calcarine sulcus is the locus of the first visualoccipital area hOc1, which has distinct anatomical (Amunts et al.,2000; Brodmann, 1909; Hinds et al., 2011; v.Economo and Koskinas,1925) and functional characteristics (Engel et al., 1994; Holmes,1945; Sereno et al., 1995).
Likewise, both NVA and AVA generate a group cROI of hOc2 that
Fig. 3. Comparison between single brain and group cytoarchitectonic maps generated by the three alignment methods. (a) Comparison of individual brain and grouphuman occipital cytoarchitectonic area two, hOc2. Top row: inflated cortical surface view. Left inset: Anatomical region of the brain which is shown in each panel. Left: RepresentativehOc2 shown in orange in an example inflated surface of a postmortem brain. Three panels on the right: Group cytoarchitectonic region of interest (cROI) of hOc2 for each of threealignment methods shown on an inflated cortical surface. CBA: Cortex-based alignment to the FreeSurfer average (fsaverage) cortical surface from 39 independent brains. NVA:Nonlinear volumetric alignment to the Colin27 template. AVA: Affine volumetric alignment to the MNI305 template, displayed on Colin27. Bottom row: same data displayed in a singlebrain slice. The individual postmortem cROI is displayed in the native brain space, group maps are displayed on Colin27. (b) Same as (a) but for cytoarchitectonic area fusiform gyrus 1(FG1). Color bar: proportion of brains containing the cROI.
M. Rosenke et al. NeuroImage xxx (xxxx) xxx–xxx
6
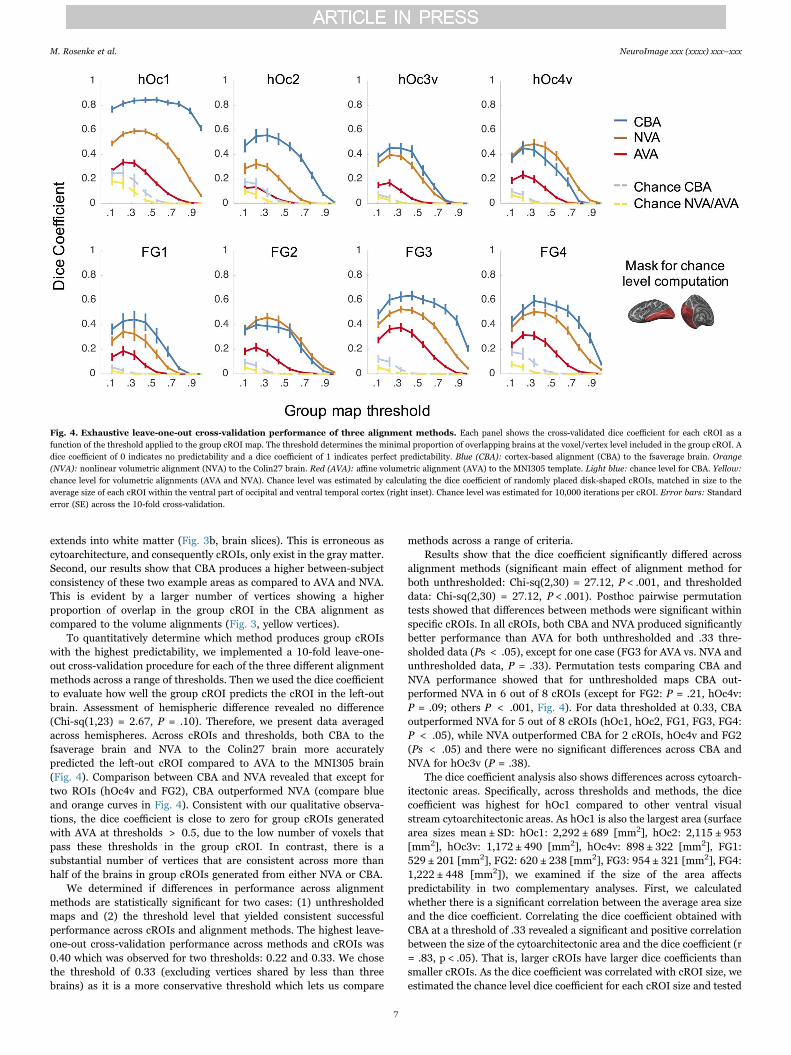
extends into white matter (Fig. 3b, brain slices). This is erroneous ascytoarchitecture, and consequently cROIs, only exist in the gray matter.Second, our results show that CBA produces a higher between-subjectconsistency of these two example areas as compared to AVA and NVA.This is evident by a larger number of vertices showing a higherproportion of overlap in the group cROI in the CBA alignment ascompared to the volume alignments (Fig. 3, yellow vertices).
To quantitatively determine which method produces group cROIswith the highest predictability, we implemented a 10-fold leave-one-out cross-validation procedure for each of the three different alignmentmethods across a range of thresholds. Then we used the dice coefficientto evaluate how well the group cROI predicts the cROI in the left-outbrain. Assessment of hemispheric difference revealed no difference(Chi-sq(1,23) = 2.67, P = .10). Therefore, we present data averagedacross hemispheres. Across cROIs and thresholds, both CBA to thefsaverage brain and NVA to the Colin27 brain more accuratelypredicted the left-out cROI compared to AVA to the MNI305 brain(Fig. 4). Comparison between CBA and NVA revealed that except fortwo ROIs (hOc4v and FG2), CBA outperformed NVA (compare blueand orange curves in Fig. 4). Consistent with our qualitative observa-tions, the dice coefficient is close to zero for group cROIs generatedwith AVA at thresholds > 0.5, due to the low number of voxels thatpass these thresholds in the group cROI. In contrast, there is asubstantial number of vertices that are consistent across more thanhalf of the brains in group cROIs generated from either NVA or CBA.
We determined if differences in performance across alignmentmethods are statistically significant for two cases: (1) unthresholdedmaps and (2) the threshold level that yielded consistent successfulperformance across cROIs and alignment methods. The highest leave-one-out cross-validation performance across methods and cROIs was0.40 which was observed for two thresholds: 0.22 and 0.33. We chosethe threshold of 0.33 (excluding vertices shared by less than threebrains) as it is a more conservative threshold which lets us compare
methods across a range of criteria.Results show that the dice coefficient significantly differed across
alignment methods (significant main effect of alignment method forboth unthresholded: Chi-sq(2,30) = 27.12, P < .001, and thresholdeddata: Chi-sq(2,30) = 27.12, P < .001). Posthoc pairwise permutationtests showed that differences between methods were significant withinspecific cROIs. In all cROIs, both CBA and NVA produced significantlybetter performance than AVA for both unthresholded and .33 thre-sholded data (Ps < .05), except for one case (FG3 for AVA vs. NVA andunthresholded data, P = .33). Permutation tests comparing CBA andNVA performance showed that for unthresholded maps CBA out-performed NVA in 6 out of 8 cROIs (except for FG2: P = .21, hOc4v:P = .09; others P < .001, Fig. 4). For data thresholded at 0.33, CBAoutperformed NVA for 5 out of 8 cROIs (hOc1, hOc2, FG1, FG3, FG4:P < .05), while NVA outperformed CBA for 2 cROIs, hOc4v and FG2(Ps < .05) and there were no significant differences across CBA andNVA for hOc3v (P = .38).
The dice coefficient analysis also shows differences across cytoarch-itectonic areas. Specifically, across thresholds and methods, the dicecoefficient was highest for hOc1 compared to other ventral visualstream cytoarchitectonic areas. As hOc1 is also the largest area (surfacearea sizes mean ± SD: hOc1: 2,292 ± 689 [mm2], hOc2: 2,115 ± 953[mm2], hOc3v: 1,172 ± 490 [mm2], hOc4v: 898 ± 322 [mm2], FG1:529 ± 201 [mm2], FG2: 620 ± 238 [mm2], FG3: 954 ± 321 [mm2], FG4:1,222 ± 448 [mm2]), we examined if the size of the area affectspredictability in two complementary analyses. First, we calculatedwhether there is a significant correlation between the average area sizeand the dice coefficient. Correlating the dice coefficient obtained withCBA at a threshold of .33 revealed a significant and positive correlationbetween the size of the cytoarchitectonic area and the dice coefficient (r= .83, p < .05). That is, larger cROIs have larger dice coefficients thansmaller cROIs. As the dice coefficient was correlated with cROI size, weestimated the chance level dice coefficient for each cROI size and tested
Fig. 4. Exhaustive leave-one-out cross-validation performance of three alignment methods. Each panel shows the cross-validated dice coefficient for each cROI as afunction of the threshold applied to the group cROI map. The threshold determines the minimal proportion of overlapping brains at the voxel/vertex level included in the group cROI. Adice coefficient of 0 indicates no predictability and a dice coefficient of 1 indicates perfect predictability. Blue (CBA): cortex-based alignment (CBA) to the fsaverage brain. Orange(NVA): nonlinear volumetric alignment (NVA) to the Colin27 brain. Red (AVA): affine volumetric alignment (AVA) to the MNI305 template. Light blue: chance level for CBA. Yellow:chance level for volumetric alignments (AVA and NVA). Chance level was estimated by calculating the dice coefficient of randomly placed disk-shaped cROIs, matched in size to theaverage size of each cROI within the ventral part of occipital and ventral temporal cortex (right inset). Chance level was estimated for 10,000 iterations per cROI. Error bars: Standarderror (SE) across the 10-fold cross-validation.
M. Rosenke et al. NeuroImage xxx (xxxx) xxx–xxx
7

if the dice coefficient obtained by the various methods was higher thanchance (see Methods). We reasoned that if cROI size determines thedice coefficient, then the measured dice coefficients should be similar tochance. However, if cROI size does not solely determine the dicecoefficient, the measured dice coefficient should be larger than chance.Results show that the chance level dice coefficient varied with bothcROI size and thresholds (Fig. 4 – yellow and light blue dashed lines).Critically, however, dice coefficients obtained by both CBA and NVAwere significantly higher than chance level (permutation tests: Ps <.005 for unthresholded; Ps < .005 thresholded at .33). Even thepoorest alignment (AVA) performed consistently better than chance(unthresholded: hOc2: P < .05, all other Ps < .005, thresholded at.33: Ps < .005).
A cytoarchitectonic atlas of human ventral visual stream cROIs
We next created a group probability map for each of the eightventral cytoarchitectonic areas based on CBA to the fsaverage atlasbrain using a threshold of 30% (see Methods), which allows visualiza-tion of the cROIs on a common brain space (Fig. 5). We chose thisapproach because (1) CBA outperformed both affine and nonlinearvolume based alignments, and (2) the fsaverage brain is a commonbrain space that has been widely used to generate atlases (Benson et al.,2014, 2012; Glasser et al., 2016; Hinds et al., 2009; Wang et al., 2014),which allows comparison between this cytoarchitectonic atlase to otheratlases in the field.
Consistent with the results of the dice coefficient analysis and prior
Fig. 5. Probabilistic group maps for each of the ventral visual stream cytoarchitectonic areas. Maps are based on the CBA alignment to the fsaverage cortical surfacethresholded at 0.33 and displayed on the inflated cortical surface of the fsaverage brain. Color bar: proportion of overlapping brains at each vertex. (a) Occipital group cROIs: hOc1-hOc4v. (b) Fusiform gyrus group cROIs: FG1-FG4. Black outline: mid-fusiform sulcus (MFS) of the fsaverage brain. Insets: the magnified brain area in the corresponding panels.
M. Rosenke et al. NeuroImage xxx (xxxx) xxx–xxx
8

results (Fischl et al., 2008), visualization of the cROI atlas shows thathOc1 shows the highest consistency across PM brains (Fig. 5).Between-subject consistency is somewhat lower in subsequent areas.However, consistency across brains does not further decline across theventral visual steam processing hierarchy. In fact, between-subjectconsistency is as high in areas FG3 and FG4 on the fusiform gyrus, as itis in hOc2 (Fig. 5).
As a final step, we generated a maximum probability map (MPM) ofhuman ventral visual stream cROIs. This generates a discrete tiling ofthe human ventral visual stream by cytoarchitectonic areas such thatthere is a unique labeling of each vertex on the cortical surface (Fig. 6).
It is interesting that the cytoarchitectonic organization of the MPMatlas of the ventral visual stream preserves the relationship betweencytoarchitectonic areas and cortical folding reported in single brains.Specifically, the spatial layout of the MPM based on group data mirrorsthe spatial layout of the cytoarchitectonic tiling in individual brains(compare Figs. 6 and 1). Also, as in the individual brains (Lorenz et al.,2015; Weiner et al., 2014), the MFS of the fsaverage brain serves as aboundary between FG1 and FG2 as well as between FG3 and FG4.
The relationship between retinotopic regions and cytoarchitecture
The present cROI atlas of the human ventral visual streamgenerated on the cortical surface can be compared to other anatomicaland functional parcellations of the ventral stream derived from otheranatomical or functional metrics. As retinotopy is a key feature used todefine visual areas (Wandell and Winawer, 2015, 2011) and there is agroup atlas of retinotopic visual areas aligned to the fsaverage brain(Wang et al., 2014), we sought to compare the two atlases in order toassess how cytoarchitectonic and retinotopic areas align in the humanventral visual stream. To quantify their correspondence, we computedthe percentage overlap between each retinotopic ROI and eachcytoarchitectonic ROI (Fig. 7). As there were no significant differencesacross hemispheres (Friedman's test: chi-sq(1,71) = 1.09, P = .30), wereport data averaged across hemispheres.
Consistent with prior results (Fischl et al., 2008), these analysesreveal that the strongest coupling between cytoarchitectonic andretinotopic areas occurs within striate compared to extrastriate cortex.Specifically, the cytoarchitectonic-retinotopic coupling within striatecortex (V1-hOc1 coupling=88 ± 3%, significantly greater than chance,permutation testing, P < .001 Fig. 7b, top left) exceeds that among thesecond, third, and fourth visual areas in extrastriate cortex (V2d-hOc2
coupling=64 ± 6%; V2v-hOc2 coupling=51 ± 10%; V3v-hOc3V cou-pling=48 ± 9%; hV4-hOc4v coupling=55 ± 9%, all Ps < .001, permuta-tion testing, Fig. 7b).
Crucially, cytoarchitectonic – retinotopic coupling does not furtherdecline in the temporal lobe relative to the occipital lobe: VO1 largelyaligns with FG1 (56 ± 9%), while PHC1 and PHC2 are largely containedwithin FG3 (69 ± 8%, 65 ± 10% respectively). Nevertheless, theseanalyses also reveal that while occipital cROIs are largely functionallyhomogenous, cROIs in the ventral temporal cortex can be functionallyheterogeneous. Specifically, retinotopically-defined VO2, PHC1, andPHC2 are all located within cytoarchitectonically-defined FG3 (Fig. 7a -bottom, this coupling is significantly different than chance Ps < .001).Together these analyses precisely quantify the complex correspondencebetween cytoarchitectonic and retinotopic parcellations of the humanvisual cortex.
Discussion
In the present study, we generated a cross-validated cytoarchitec-tonic atlas of the human ventral visual stream. We compared cortex-based alignment (CBA), nonlinear volumetric alignment (NVA), andaffine volumetric alignment (AVA). We found that CBA and NVAgenerated better inter-subject consistency of group cROIs and a higherpredictability as compared to an affine volumetric transformation tothe MNI305 template. Furthermore, we found that CBA was superiorto NVA for six of the eight cytoarchitectonic areas. In the followingsections, we discuss the implications of these results for generatingcytoarchitectonic atlases as well as the potential utility of this atlas infuture research.
The relationship among cytoarchitectonic areas and cortical foldingacross the ventral visual processing hierarchy
The present study shows that there is improved between-subjectcorrespondence and predictability of ventral visual stream cytoarchi-tectonic areas with cortex-based alignment and nonlinear volumetricalignment compared to an affine volumetric alignment that does nottake macroanatomy into account. This improved alignment (whichnotably also occurs in higher-order visual cortices), may seem surpris-ing since classic (Brodmann, 1909; Smith, 1907) and modern (VanEssen and Drury, 1997; Zilles et al., 2013) studies provide evidencefor significant variability between cytoarchitectonic boundaries and
Fig. 6. Maximum probability map (MPM) of human ventral visual stream cytoarchitectonic areas. The MPM was generated after CBA to the fsaverage brain and is shownon the fsaverage cortical surface. (a) Posterior view zoomed on the occipital cortex. (b) Ventral view. RH: right hemisphere; LH: left hemisphere.
M. Rosenke et al. NeuroImage xxx (xxxx) xxx–xxx
9

cortical folding in several cortical areas. Specifically, these studiesshowed that there is often not a 1:1 mapping between either the crownof a gyrus and a cytoarchitectonic boundary or the fundus of a sulcusand a cytoarchitectonic boundary (Amunts et al., 2007). Althoughcytoarchitectonic boundaries do not perfectly follow gyral crowns orsulcal fundi, accumulating evidence suggests that there is a grosscoupling between cytoarchitectonic areas and macroanatomical struc-tures. For example, area hOc3v is likely to be found in the collateralsulcus, not the fusiform gyrus, whereas the reverse is true for area FG4(Lorenz et al., 2015; Rottschy et al., 2007). Additionally, there is evenmore fine-grained coupling as some cytoarchitectonic boundaries tendto align with specific macroanatomical features with millimeter preci-sion. For example, the cytoarchitectonic boundary between areas FG1and FG2 occurs within the posterior mid-fusiform sulcus (MFS, Weineret al., 2014; Weiner and Zilles, 2016) and the boundary between areasFG3 and FG4 occurs within more anterior portions of the MFS (Lorenzet al., 2015). We speculate that the combination of the general, gross,topological relationship between macroanatomical structures andcytoarchitectonic areas, as well as the more fine-grained (but infre-quent) relationships, contribute to the improved between-subjectcorrespondence and predictability of cytoarchitectonic areas withmacroanatomical alignments compared to AVA, which ignores thesefeatures.
While our results illustrate that the highest cytoarchitectonic-macroanatomical coupling occurs for area hOc1, as reported previously(Fischl et al., 2008), it is interesting that after hOc2, the level ofcytoarchitectonic-macroanatomical coupling does not further decrease
across the ventral visual stream hierarchy. Rather, the consistency ofthe cROI group maps across brains for other intermediate and high-level cROIs – hOc3v, hOc4v, FG1 and FG2 – is similar to the hOc2 leveland even slightly increases for FG3 and FG4, which are located inhigher stages of the ventral processing stream.
Despite the consistency of the group cytoarchitectonic maps relativeto cortical folding, there are also two main sources of variability. First,the precise boundaries of a given cytoarchitectonic area can vary acrossdifferent brains (Amunts et al., 2007; Van Essen and Drury, 1997;Zilles et al., 2013). For example, the transition between FG1 and FG2as described above, as well as the transition between FG3 and FG4 arelocated at the MFS. However, the boundary between FG3 and FG4 isbetter predictable by the MFS than the FG1 and FG2 boundary (Lorenzet al., 2015). Second, macroanatomical landmarks vary in theirmorphological features. For example, the MFS is variable in length,and shows higher variability in its posterior than anterior extent(Weiner et al., 2014). That results in higher consistency in cROIstightly linked to the anterior tip of the MFS (FG3 and FG4), comparedto those located more posteriorly (FG1 and FG2). Another importantcharacteristic of the morphology of the brain is that macroanatomicallandmarks vary in their fractination. As an example, the occipito-temporal sulcus (OTS) can vary between having one continuous sulcalbed or having several fractionated components. This variability canoccur even across hemispheres in the same brain. The greater thevariability of a given landmark across brains, the more noise isintroduced during CBA. Future research can examine anatomical andcytoarchitectonic variability, as well as the coupling between these
Fig. 7. Coupling between cytoarchitectonic and retinotopic parcellations of the human occipito-temporal and ventral temporal cortex. (a) Superposition of ourcROI MPM atlas (Fig. 6) and the Wang et al. (2014) retinotopic MPM atlas on the fsaverage brain. Top: Occipital view of the fsaverage brain, inset shows zoomed region of the braindisplayed. Bottom: Ventral view of the fsaverage brain; Solid colors: retinotopic ROIs; Outlines: cROIs. (b) Quantification of the correspondence between retinotopic ROIs and cROIs.Each graph shows the average overlap between an MPM of a retinotopic area and an individual subject's cROI. X-axis: cROIs, y-axis: proportion of the retinotopic ROI contained in eachcROI. Horizontal bars: Chance level with 95% confidence interval. Errorbars: Standard error across postmortem subjects. Asterisks indicate significant difference relative to chance (P< .01).
M. Rosenke et al. NeuroImage xxx (xxxx) xxx–xxx
10

features across the brain more generally, to test if these features areunique to the ventral visual stream or reflect general principles of brainarchitecture.
Comparison between the applied alignment methods: implications
Volume-based atlases integrate both brain areas along the corticalribbon and areas within nuclei located deep in the brain. In generatingvolumetric atlases, our analyses suggest that nonlinear volumetricanalysis to a template with macroanatomical details, such as theColin27 brain, is superior to AVA to a group average brain template,such as the MNI305. Two methodological constraints of the AVA mayhave contributed to its decreased performance compared to NVA: (1)the rigid affine transformation and (2) the usage of the MNI305template that lacks macroanatomical information. While NVA to aspecific brain is better than AVA to a group average, it is also importantto be cautious about possible idiosyncrasies of that specific brain thatmay affect the outcome. We have used NVA to the Colin 27 brain as ithas been used previously to align these cROIs (Evans et al., 2012).
While cortex-based alignment does not enable generating atlases ofdeep brain structures, it enables generating precise atlases of corticalregions. In the ventral visual system, cortex-based alignment of cROIsoutperformed both types of volumetric alignments. This advantage isparticular prominent for cortical areas that display a consistentcoupling to macroanatomical landmarks (Figs. 3 and 4, see alsoFischl et al., 2008; Frost and Goebel, 2013). Additionally, CBA allowsaligning brains to an average template that contains macroanatomicallandmarks, which may be a more representative brain than any specificsingle brain such as the Colin27 brain.
For this atlas containing 8 cROIs spanning the occipital andtemporal cortex, CBA performed similarly or better than NVA.However, whether CBA, in general, outperforms NVA for other partsof the brain is an open question for future research. For example, thedorsal visual stream also contains cytoarchitectonic (Kujovic et al.,2013; Malikovic et al., 2015; Scheperjans et al., 2008) and retinotopicregions (Silver and Kastner, 2009; Swisher et al., 2007; Wang et al.,2014). Nevertheless, macroanatomical-cytoarchitectonic coupling hasnot yet been investigated in the dorsal visual stream with the same levelof detail as in the ventral stream. Thus, a thorough investigation of thisstructural coupling and examination of how the alignment methodaffects an atlas of dorsal regions in occipital and parietal cortex is animportant topic for future research.
Comparison of an atlas based on CBA to the fsaverage brain vs. CBAto the postmortem average brain reveals similar accuracy. This hasboth theoretical and practical implications (DiB, Fig. 1). On thetheoretical side, the similar cROI consistency across alignments todifferent brain templates suggests that distortions introduced by thestorage of PM brains outside of the skull prior to scanning (Amuntset al., 2000) and the possible idiosyncrasies of the anatomical featuresof these particular brains, do not prevent generalization from these PMdata to a typical set of living subjects. Furthermore, the finding thatthere were no significant differences in predictability or between-subject correspondence across the two types of alignments for 6 ofthe 8 cROIs (DiB, Fig. 1) suggests that the variability of the PM brainsis not significantly different from the variability of an independentgroup of in-vivo brains. In turn, this suggests that having an averagebrain anatomy derived from CBA of many subjects ( > =39, such as thefsaverage), produces a stable average anatomy that is likely to general-ize to independent brains, either in-vivo or postmortem.
While our cytoarchitectonic atlas of the ventral visual stream iscross-validated, we acknowledge that this atlas has one main limita-tion: it provides an estimated location of ventral visual streamcytoarchitectonic areas based on a group of postmortem brains, ratherthan a method to directly identify cytoarchitectonic areas in-vivo withinindividual subjects. Nevertheless, currently there are no methods thatenable cytoarchitectonic analyses at microscopic resolution in-vivo
within individual brains. It is important to consider that even withthe most advanced brain alignments available, alignments will neverresult in 100% consistency across brains, due to individual differencesin both cytoarchitectonic areas and macroanatomical landmarks.Therefore, a future goal would be to compare the predicted locus ofcytoarchitectonic areas with anatomical delineations based on MRIscans in-vivo. Indeed, recently developed methods of quantitative MRI(qMRI), enable quantifying in-vivo anatomical tissue properties(Glasser and Van Essen, 2011; Mezer et al., 2013; Sereno et al.,2013). By comparing in-vivo quantitative MRI measurements with thepredicted loci of cROIs (Gomez et al., 2017), future studies couldpotentially further validate these measurements by identifying whatexact tissue properties are being measured with qMRI scans.
Utility of the cytoarchitectonic atlas of the ventral visual stream
The present cROI atlas of the human ventral visual streamgenerated on the cortical surface has many applications. First,cytoarchitecture can be used as a method for anatomical localizationand labeling of brain areas. The introduction of this newly generated,cross-validated cytoarchitectonic atlas enables a more robust andaccurate localization of cytoarchitectonic areas on MRI data than thewidely used Brodmann parcellation, which is still commonly used tolocalize functional brain areas in the neuroimaging community. Wemake the cROI atlas publicly available on the fsaverage brain in boththe FreeSurfer and BrainVoyager platforms to enable researchers touse and integrate the atlas in their studies (http://vpnl.stanford.edu/vcAtlas). Second, these cytoarchitectonic parcellations can becompared to other parcellations of the ventral stream such as thosederived from other anatomical or functional metrics (Amunts et al.,2013; Glasser et al., 2016; Glasser and Van Essen, 2011; Wang et al.,2014; Yeo et al., 2011). For example, this cROI atlas can be comparedto the recent atlas based on multimodal properties of the human brain(Glasser et al., 2016, DiB, Fig. 2). Third, cytoarchitectonic parcellationscan be used to test differences in the ventral visual stream betweentypical and atypical populations. In particular, this cROI atlas can beuseful for participant populations for which it is relatively easy toobtain anatomical measurements of the brain, but for which it isdifficult to obtain functional scans of the visual system. For example,participants who are congenitally blind (Bedny et al., 2011; Mahonet al., 2009; Striem-Amit et al., 2012a, 2012b), autistic (Osterling andDawson, 1994; Pierce et al., 2001; Schultz et al., 2000; Van Kootenet al., 2008), brain lesioned (Barton, 2008; Gilaie-Dotan et al., 2009;Schiltz and Rossion, 2006; Sorger et al., 2007; Steeves et al., 2006;Susilo et al., 2015), or very young (Cantlon et al., 2011; Golarai et al.,2007; Peelen et al., 2009; Scherf et al., 2007; Sowell et al., 2003).
Coupling between cytoarchitectonic and retinotopic parcellations ofthe ventral visual stream
Comparing this cytoarchitectonic atlas to functional parcellations ofthe ventral visual stream (Abdollahi et al., 2014; Amunts et al., 2007;Hinds et al., 2009; Malikovic et al., 2015) can address central questionsregarding how cytoarchitectonic features may constrain functionalfeatures (Felleman and Van Essen, 1991; Grill-Spector and Weiner,2014; Hubbel, 2013; Kravitz et al., 2013; Orban et al., 2004; Van Essenet al., 1992). As retinotopy is considered a fundamental organizationalprinciple of the ventral visual stream (Arcaro et al., 2009; Brewer et al.,2005; Kolster et al., 2010; Orban et al., 2004; Roe et al., 2012; Serenoet al., 1995; Silson et al., 2016, 2015; Wang et al., 2014), we comparedthe present atlas to a recently published retinotopic atlas (Wang et al.,2014).
This comparison revealed a coupling between cytoarchitectonic andretinotopic areas in the ventral visual stream. The correspondencebetween cytoarchitectonic and retinotopic parcellations is particularlystriking in striate cortex, which replicates prior findings (Abdollahi
M. Rosenke et al. NeuroImage xxx (xxxx) xxx–xxx
11

et al., 2014; Amunts et al., 2007; Hinds et al., 2009; Malikovic et al.,2015). While this coupling declines in extrastriate areas, most of theretinotopic areas in the ventral visual stream are confined to a singlecytoarchitectonic area.
Discrepancies between cytoarchitectonic and retinotopic areas (e.g.hOc2-V2v or hOc3-V3v) may be due to imprecisions in comparisonsacross group atlases, or may indicate differences between cytoarchi-tectonic and retinotopic parcellations. We favor the former interpreta-tion for two reasons. First, we believe that the accuracy of comparisonsbetween cytoarchitecture and function may improve if these compar-isons were done within the same participant. Future developmentsenabling measurements of cytoarchitecture in-vivo could test thishypothesis. Second, other evidence suggests that functional category-selective regions in the ventral stream are largely cytoarchitectonicallyhomogenous (Weiner et al., 2016). Thus, we believe cytoarchitectonichomogeneity to be a general feature of functional regions in visualcortex.
Interestingly, this comparison also reveals differences betweenstructural-functional relations in the occipital and ventral temporalcortices. In occipital cortex there is largely a 1-to-1 mapping betweencytoarchitecture and retinotopy, but in ventral temporal cortex, there isevidence for a 1-to-many mapping between cytoarchitecture andretinotopy. For example, FG3 contains three retinotopic areas: VO2,PHC1, PHC2, which is consistent with findings of a 1-to-many mappingbetween cytoarchitecture and category-selective regions in FG2 andFG4 (Weiner et al., 2016). Overall, these findings suggest thatcomparisons across different types of cortical parcellations (see alsoDiB) have the potential to advance understanding of how microanato-mical features contribute to the functional organization of the brain.
Conclusions
In sum, the present study shows that macroanatomical alignment ofpostmortem brains using cortex-based alignment results in a moreaccurate alignment of cytoarchitectonic areas compared to volumetricalignments. These results indicate that cytoarchitectonic areas of theventral visual stream are largely coupled to macroanatomy.Additionally, we find a correspondence between cytoarchitectonic andretinotopic visual areas in the human ventral visual stream. Finally, weare hopeful that with the publication of this cROI atlas, it will bebroadly utilized to advance the understanding of the architecture andfunction of the human ventral visual stream. The atlas can be down-loaded here: http://vpnl.stanford.edu/vcAtlas.
Acknowledgements
Support for this research was provided by National Institute ofHealth (NIH) grants: 1RO1EY 02231801A1 and 1R01EY02391501A1to KGS, the European Union Seventh Framework Programme (FP7/2007- 2013) under grant agreement no. 604102 (Human BrainProject) to KA and KZ.
References
Abdollahi, R.O., Kolster, H., Glasser, M.F., Robinson, E.C., Coalson, T.S., Dierker, D.,Jenkinson, M., Van Essen, D.C., Orban, G.A., 2014. Correspondences betweenretinotopic areas and myelin maps in human visual cortex. Neuroimage 99, 509–524.http://dx.doi.org/10.1016/j.neuroimage.2014.06.042.
Amunts, K., Lepage, C., Borgeat, L., Mohlberg, H., Dickscheid, T., Rousseau, M. -étienne,Bludau, S., Bazin, P., Lewis, L.B., Shah, N.J., Lippert, T., Zilles, K., Evans, A.C., 2013.BigBrain: an ultrahigh-resolution 3D human brain model. Science (80-) 340,1472–1475.
Amunts, K., Malikovic, A., Mohlberg, H., Schormann, T., Zilles, K., 2000. Brodmann'sareas 17 and 18 brought into stereotaxic pace - where and how variable? Neuroimage11, 66–84.
Amunts, K., Schleicher, A., Zilles, K., 2007. Cytoarchitecture of the cerebral cortex–morethan localization. Neuroimage 37, 1061–1068. http://dx.doi.org/10.1016/j.neuroimage.2007.02.037.
Amunts, K., Zilles, K., 2015. Architectonic mapping of the human brain beyond
Brodmann. Neuron 88, 1086–1107. http://dx.doi.org/10.1016/j.neuron.2015.12.001.
Arcaro, M.J., McMains, S.A., Singer, B.D., Kastner, S., 2009. Retinotopic organization ofhuman ventral visual cortex. J. Neurosci. 29,10638–10652, (doi:29/34/10638 [pii]/r10.1523/JNEUROSCI.2807-09.2009).
Bailey, P., Bonin, G., 1951. The Isocortex of Man. Univ. Illinois Press, Urbana.Barton, J.J.S., 2008. Structure and function in acquired prosopagnosia: lessons from a
series of 10 patients with brain damage. J. Neuropsychol. 2, 197. http://dx.doi.org/10.1348/174866407X214172.
Bedny, M., Pascual-Leone, A., Dodell-Feder, D., Fedorenko, E., Saxe, R., 2011. Languageprocessing in the occipital cortex of congenitally blind adults. Proc. Natl. Acad. Sci.USA 108, 4429–4434. http://dx.doi.org/10.1073/pnas.1014818108.
Benson, N.C., Butt, O.H., Brainard, D.H., Aguirre, G.K., 2014. Correction of distortion inflattened representations of the cortical surface allows prediction of V1-V3 functionalorganization from anatomy. PLoS Comput. Biol. 10. http://dx.doi.org/10.1371/journal.pcbi.1003538.
Benson, N.C., Butt, O.H., Datta, R., Radoeva, P.D., Brainard, D.H., Aguirre, G.K., 2012.The retinotopic organization of striate cortex is well predicted by surface topology.Curr. Biol. 22, 2081–2085. http://dx.doi.org/10.1016/j.cub.2012.09.014.
Brewer, A.A., Liu, J., Wade, A.R., Wandell, B.A., 2005. Visual field maps and stimulusselectivity in human ventral occipital cortex. Nat. Neurosci. 8, 1102–1109. http://dx.doi.org/10.1038/nn1507.
Brodmann, K., 1909. Vergleichende Lokal. der Grosshirnrinde ihren Prinz. dargestelltauf Grund des Zellenbaues, Barth, Leipzig.
Campbell, A.W., 1905. Histological Studies on the Localisation of Cerebral Function.Cambridge Univ. Press.
Cantlon, J.F., Pinel, P., Dehaene, S., Pelphrey, K.A., 2011. Cortical representations ofsymbols, objects, and faces are pruned back during early childhood. Cereb. Cortex21, 191–199. http://dx.doi.org/10.1093/cercor/bhq078.
Caspers, J., Zilles, K., Eickhoff, S.B., Schleicher, A., Mohlberg, H., Amunts, K., 2013.Cytoarchitectonical analysis and probabilistic mapping of two extrastriate areas ofthe human posterior fusiform gyrus. Brain Struct. Funct. 218, 511–526. http://dx.doi.org/10.1007/s00429-012-0411-8.
Dice, L.R., 1945. Measures of the Amount of Ecologic Association Between SpeciesAuthor (s): Lee R. Dice Published by: Wiley Stable. URL: ⟨http://www.jstor.org/stable/1932409⟩ Accessed: 08.04.2016 13: 33 UTC Your use of the JSTOR archiveindicates your acceptance of th. Ecology, 26, pp. 297–302.
Eickhoff, S.B., Stephan, K.E., Mohlberg, H., Grefkes, C., Fink, G.R., Amunts, K., Zilles, K.,2005. A new SPM toolbox for combining probabilistic cytoarchitectonic maps andfunctional imaging data. Neuroimage 25, 1325–1335. http://dx.doi.org/10.1016/j.neuroimage.2004.12.034.
Engel, S.A., Rumelhart, D.E., Wandell, B.A., Lee, A.T., Glover, G.H., Chichilnisky, E.-J.,Shadlen, M.N., 1994. fMRI of human visual cortex. Nature. http://dx.doi.org/10.1038/369525a0.
Evans, A.C., Janke, A.L., Collins, D.L., Baillet, S., 2012. Brain templates and atlases.Neuroimage 62, 911–922. http://dx.doi.org/10.1016/j.neuroimage.2012.01.024.
Felleman, D.J., Van Essen, D.C., 1991. Distributed hierarchical processing in the primatecerebral cortex. Cereb. Cortex 1, 1–47. http://dx.doi.org/10.1093/cercor/1.1.1.
Fischl, B., Rajendran, N., Busa, E., Augustinack, J., Hinds, O., Yeo, B.T., Mohlberg, H.,Amunts, K., Zilles, K., 2008. Cortical folding patterns and predictingcytoarchitecture. Cereb. Cortex 18, 1973–1980. http://dx.doi.org/10.1093/cercor/bhm225.
Fischl, B., Sereno, M.I., Tootell, R.B., Dale, A.M., 1999. High-resolution intersubjectaveraging and a coordinate system for the cortical surface. Hum. Brain Mapp. 8,272–284.
Frost, M.A., Goebel, R., 2013. Functionally informed cortex based alignment: anintegrated approach for whole-cortex macro-anatomical and ROI-based functionalalignment. Neuroimage 83, 1002–1010. http://dx.doi.org/10.1016/j.neuroimage.2013.07.056.
Frost, M.A., Goebel, R., 2012a. Measuring structural-functional correspondence: spatialvariability of specialised brain regions after macro-anatomical alignment.Neuroimage 59, 1369–1381. http://dx.doi.org/10.1016/j.neuroimage.2011.08.035.
Frost, M.A., Goebel, R., 2012b. Measuring structural-functional correspondence: spatialvariability of specialised brain regions after macro-anatomical alignment.Neuroimage 59, 1369–1381. http://dx.doi.org/10.1016/j.neuroimage.2011.08.035.
Gilaie-Dotan, S., Perry, A., Bonneh, Y., Malach, R., Bentin, S., 2009. Seeing withprofoundly deactivated mid-level visual areas: non-hierarchical functioning in thehuman visual cortex. Cereb. Cortex 19, 1687–1703. http://dx.doi.org/10.1093/cercor/bhn205.
Glasser, M.F., Coalson, T.S., Robinson, E.C., Hacker, C.D., Harwell, J., Yacoub, E., 2016.A multi-modal parcellation of human cerebral cortex. Nature 536, 171–178. http://dx.doi.org/10.1038/nature18933.
Glasser, M.F., Van Essen, D.C., 2011. Mapping human cortical areas in vivo based onmyelin content as revealed by T1- and T2-weighted MRI. J. Neurosci. 31,11597–11616. http://dx.doi.org/10.1523/JNEUROSCI.2180-11.2011.
Goebel, R., Esposito, F., Formisano, E., 2006. Analysis of functional image analysiscontest (FIAC) data with brainvoyager QX: from single-subject to cortically alignedgroup general linear model analysis and self-organizing group independentcomponent analysis. Hum. Brain Mapp. 27, 392–401. http://dx.doi.org/10.1002/hbm.20249.
Golarai, G., Ghahremani, D.G., Whitfield-Gabrieli, S., Reiss, A., Eberhardt, J.L., Gabrieli,J.D.E., Grill-Spector, K., 2007. Differential development of high-level visual cortexcorrelates with category-specific recognition memory. Nat. Neurosci. 10, 512–522.http://dx.doi.org/10.1038/nn1865.
Gomez, J., Barnett, M.A., Natu, V., Mezer, A., Palomero-Gallagher, N., Weiner, K.S.,Amunts, K., Zilles, K., Grill-Spector, K., 2017. Microstructural proliferation in
M. Rosenke et al. NeuroImage xxx (xxxx) xxx–xxx
12
human cortex is coupled with the development of face processing. Science 355,68–71. http://dx.doi.org/10.1126/science.aag0311.
Goodale, M.A., Milner, A.D., Jakobson, L.S., Carey, D.P., 1991. A neurologicaldissociation between perceiving objects and grasping them. Nature. http://dx.doi.org/10.1038/349154a0.
Grill-Spector, K., Weiner, K.S., 2014. The functional architecture of the ventral temporalcortex and its role in categorization. Nat. Rev. Neurosci. 15, 536–548. http://dx.doi.org/10.1038/nrn3747.
Hinds, O., Ghosh, S., Thompson, T.W., Yoo, J.J., Whitfield-Gabrieli, S., Triantafyllou, C.,Gabrieli, J.D.E., 2011. Computing moment-to-moment BOLD activation for real-time neurofeedback. Neuroimage 54, 361–368. http://dx.doi.org/10.1016/j.neuroimage.2010.07.060.
Hinds, O., Polimeni, J.R., Rajendran, N., Balasubramanian, M., Amunts, K., Zilles, K.,Schwartz, E.L., Fischl, B., Triantafyllou, C., 2009. Locating the functional andanatomical boundaries of human primary visual cortex. Neuroimage 46, 915–922.http://dx.doi.org/10.1016/j.neuroimage.2009.03.036.
Holmes, G., 1945. Ferrier lecture : The organization of the visual cortex in Man.Proceedings of the Royal Society of London. Series B, Biological Sciences 132,348–361.
Hubbel, 2013. Eye, brain and vision. J. Chem. Inf. Model. 53, 1689–1699. http://dx.doi.org/10.1017/CBO9781107415324.004.
Kolster, H., Peeters, R., Orban, G. a, 2010. The retinotopic organization of the humanmiddle temporal area MT/V5 and its cortical neighbors. J. Neurosci. 30, 9801–9820.http://dx.doi.org/10.1523/JNEUROSCI.2069-10.2010.
Kravitz, D.J., Saleem, K.S., Baker, C.I., Ungerleider, L.G., Mishkin, M., 2013. The ventralvisual pathway: an expanded neural framework for the processing of object quality.Trends Cogn. Sci. 17, 26–49. http://dx.doi.org/10.1016/j.tics.2012.10.011.
Kujovic, M., Zilles, K., Malikovic, A., Schleicher, A., Mohlberg, H., Rottschy, C., Eickhoff,S.B., Amunts, K., 2013. Cytoarchitectonic mapping of the human dorsal extrastriatecortex. Brain Struct. Funct. 218, 157–172. http://dx.doi.org/10.1007/s00429-012-0390-9.
Lorenz, S., Weiner, K.S., Caspers, J., Mohlberg, H., Schleicher, A., Bludau, S., Eickhoff,S.B., Grill-Spector, K., Zilles, K., Amunts, K., 2015. Two new cytoarchitectonic areason the human mid-fusiform gyrus. Cereb. Cortex. http://dx.doi.org/10.1093/cercor/bhv225, (bhv225).
Mahon, B.Z., Anzellotti, S., Schwarzbach, J., Zampini, M., Caramazza, A., 2009.Category-specific organization in the human brain does not require visualexperience. Neuron 63, 397–405. http://dx.doi.org/10.1016/j.neuron.2009.07.012.
Malikovic, A., Amunts, K., Schleicher, A., Mohlberg, H., Kujovic, M., Palomero-Gallagher, N., Eickhoff, S.B., Zilles, K., 2015. Cytoarchitecture of the human lateraloccipital cortex: mapping of two extrastriate areas hOc4la and hOc4lp. Brain Struct.Funct. http://dx.doi.org/10.1007/s00429-015-1009-8.
Merker, B., 1983. Silver staining of cell bodies by means of physical development. J.Neurosci. Methods 9, 235–241.
Mezer, A., Yeatman, J.D., Stikov, N., Kay, K.N., Cho, N.-J., Dougherty, R.F., Perry, M.L.,Parvizi, J., Hua, L.H., Butts-Pauly, K., Wandell, B.A., 2013. Quantifying the localtissue volume and composition in individual brains with magnetic resonanceimaging. Nat. Med. 19, 1667–1672. http://dx.doi.org/10.1038/nm.3390.
Mishkin, M., Ungerleider, L.G., Macko, K. a, 1983. Object vision and spatial vision: twocentral pathways. Trends Neurosci. 6, 414–417. http://dx.doi.org/10.1016/0166-2236(83)90190-X.
Orban, G.A., Van Essen, D., Vanduffel, W., 2004. Comparative mapping of higher visualareas in monkeys and humans. Trends Cogn. Sci. 8, 315–324. http://dx.doi.org/10.1016/j.tics.2004.05.009.
Osterling, J., Dawson, G., 1994. Early Recognition of Children With Autism - a Study of1St Birthday Home Videotapes. J. Autism Dev. Disord. 24, 247–257. http://dx.doi.org/10.1007/bf02172225.
Peelen, M.V., Glaser, B., Vuilleumier, P., Eliez, S., 2009. Differential development ofselectivity for faces and bodies in the fusiform gyrus. Dev. Sci. 12, 16–25. http://dx.doi.org/10.1111/j.1467-7687.2009.00916.x.
Pierce, K., Müller, R. a, Ambrose, J., Allen, G., Courchesne, E., 2001. Face processingoccurs outside the fusiform “face area” in autism: evidence from functional MRI.Brain 124, 2059–2073. http://dx.doi.org/10.1093/brain/124.10.2059.
Roe, A.W., Chelazzi, L., Connor, C.E., Conway, B.R., Fujita, I., Gallant, J.L., Lu, H.,Vanduffel, W., 2012. Toward a unified theory of visual area V4. Neuron 74, 12–29.http://dx.doi.org/10.1016/j.neuron.2012.03.011.
Rottschy, C., Eickhoff, S.B., Schleicher, A., Mohlberg, H., Kujovic, M., Zilles, K., Amunts,K., 2007. Ventral visual cortex in humans: cytoarchitectonic mapping of twoextrastriate areas. Hum. Brain Mapp. 28, 1045–1059.
Scheperjans, F., Hermann, K., Eickhoff, S.B., Amunts, K., Schleicher, A., Zilles, K., 2008.Observer-independent cytoarchitectonic mapping of the human superior parietalcortex. Cereb. Cortex 18, 846–867. http://dx.doi.org/10.1093/cercor/bhm116.
Scherf, K.S., Behrmann, M., Humphreys, K., Luna, B., 2007. Visual category-selectivityfor faces, places and objects emerges along different developmental trajectories. Dev.Sci., 10. http://dx.doi.org/10.1111/j.1467-7687.2007.00595.x.
Schiltz, C., Rossion, B., 2006. Faces are represented holistically in the human occipito-temporal cortex. Neuroimage 32, 1385–1394. http://dx.doi.org/10.1016/j.neuroimage.2006.05.037.
Schleicher, A., Amunts, K., Geyer, S., Kowalski, T., Zilles, K., 1998. An Observer-Independent Cytoarchitectonic Mapping of the Human Cortex Using A StereologicalApproach. Acta Stereol. 17, 75–82.
Schleicher, A., Amunts, K., Geyer, S., Morosan, P., Zilles, K., 1999. Observer-independentmethod for microstructural parcellation of cerebral cortex: a quantitative approachto cytoarchitectonics. Neuroimage 9, 165–177. http://dx.doi.org/10.1006/nimg.1998.0385.
Schleicher, A., Morosan, P., Amunts, K., Zilles, K., 2005. Quantitative architectural
analysis: a new approach to cortical mapping. J. Autism Dev. Disord. 39, 1568–1581. http://dx.doi.org/10.1007/s10803-009-0790-8.
Scholtens, L.H., de Reus, M.A., van den Heuvel, M.P., 2015. Linking contemporary highresolution magnetic resonance imaging to the von economo legacy: a study on thecomparison of MRI cortical thickness and histological measurements of corticalstructure. Hum. Brain Mapp. 3046, 3038–3046. http://dx.doi.org/10.1002/hbm.22826.
Schultz, R.T., Gauthier, I., Klin, A., Fulbright, R.K., Anderson, a W., Volkmar, F.,Skudlarski, P., Lacadie, C., Cohen, D., Gore, J.C., 2000. Abnormal ventral temporalcortical activity during face discrimination among individuals with autism andAsperger syndrome. Arch. Gen. Psychiatry 57, 331–340. http://dx.doi.org/10.1001/archpsyc.57.4.331.
Sereno, M.I., Dale, a M., Reppas, J.B., Kwong, K.K., Belliveau, J.W., Brady, T.J., Rosen,B.R., Tootell, R.B.H., Series, N., May, N., 1995. Humans revealed by functionalmagnetic resonance imaging borders of multiple visual areas in humans revealed byfunctional magnetic resonance imaging. Science 268, 889–893.
Sereno, M.I., Lutti, A., Weiskopf, N., Dick, F., 2013. Mapping the human cortical surfaceby combining quantitative T1 with retinotopy. Cereb. Cortex 23, 2261–2268. http://dx.doi.org/10.1093/cercor/bhs213.
Silson, E.H., Chan, a W.-Y., Reynolds, R.C., Kravitz, D.J., Baker, C.I., 2015. A RetinotopicBasis for the Division of High-Level Scene Processing between Lateral and VentralHuman Occipitotemporal Cortex. J. Neurosci. 35, 11921–11935. http://dx.doi.org/10.1523/JNEUROSCI.0137-15.2015.
Silson, E.H., Groen, I.I.A., Kravitz, D.J., Baker, C.I., 2016. Evaluating the correspondencebetween face-, scene-, and object-selectivity and retinotopic organization withinlateral occipitotemporal cortex. J. Vis. 16, 1–21. http://dx.doi.org/10.1167/16.6.14.
Silver, M.A., Kastner, S., 2009. Topographic maps in human frontal and parietal cortexMichael. Trends Cogn. Sci. 13, 488–495. http://dx.doi.org/10.1016/j.tics.2009.08.005.Topographic.
Smith, G.E., 1907. A new topographical survey of human cerebral cortex. J. Anat. 41,237–254.
Sørensen, T., 1948. A method of establishing groups of equal amplitude in plantsociology based on similarity of species and its application to analyses of thevegetation on Danish commons. Biol. Skr. 5, 1–34.
Sorger, B., Goebel, R., Schiltz, C., Rossion, B., 2007. Understanding the functionalneuroanatomy of acquired prosopagnosia. Neuroimage 35, 836–852. http://dx.doi.org/10.1016/j.neuroimage.2006.09.051.
Sowell, E.R., Peterson, B.S., Thompson, P.M., Welcome, S.E., Henkenius, A.L., Toga,A.W., 2003. Mapping cortical change across the human life span. Nat. Neurosci. 6,309–315. http://dx.doi.org/10.1038/nn1008.
Steeves, J.K.E., Culham, J.C., Duchaine, B.C., Pratesi, C.C., Valyear, K.F., Schindler, I.,Humphrey, G.K., Milner, A.D., Goodale, M.A., 2006. The fusiform face area is notsufficient for face recognition: evidence from a patient with dense prosopagnosia andno occipital face area. Neuropsychologia 44, 594–609. http://dx.doi.org/10.1016/j.neuropsychologia.2005.06.013.
Striem-Amit, E., Cohen, L., Dehaene, S., Amedi, A., 2012a. Reading with sounds: sensorysubstitution selectively activates the visual word form area in the blind. Neuron 76,640–652. http://dx.doi.org/10.1016/j.neuron.2012.08.026.
Striem-Amit, E., Dakwar, O., Reich, L., Amedi, A., 2012b. The large-scale organization of“visual” streams emerges without visual experience. Cereb. Cortex 22, 1698–1709.http://dx.doi.org/10.1093/cercor/bhr253.
Susilo, T., Yang, H., Potter, Z., Robbins, R., Duchaine, B., 2015. Normal body perceptiondespite the loss of right fusiform gyrus. J. Cogn. Neurosci. 27, 614–622.
Swisher, J.D., Halko, M.A., Merabet, L.B., McMains, S.A., Somers, D.C., 2007. Visualtopography of human intraparietal sulcus. J. Neurosci. 27, 5326–5337. http://dx.doi.org/10.1523/JNEUROSCI.0991-07.2007.
Talairach, J., Tournoux, P., 1988. Co-planar Stereotaxic Atlas of the Human Brain.Upton, G., Cook, I., 2008. A Dictionary of Statistics. Oxford University Press.v.Economo, C., Koskinas, G.N., 1925. Die Cytoarchitektonik der Hirnrinde des
Erwachsenen Menschen. Springer, Berlin.van den Heuvel, M.P., Scholtens, L.H., Feldman Barrett, L., Hilgetag, C.C., de Reus, M.A.,
2015. Bridging cytoarchitectonics and connectomics in human cerebral cortex. J.Neurosci. 35, 13943–13948. http://dx.doi.org/10.1523/JNEUROSCI.2630-15.2015.
Van Essen, D.C., Anderson, C.H., Felleman, D.J., 1992. Information processing in theprimate visual system: an integrated systems perspective. Science 255 (80-),419–423.
Van Essen, D.C., Drury, H.A., 1997. Structural and functional analyses of human cerebralcortex using a surface-based atlas. J. Neurosci. 17, 7079–7102.
Van Kooten, I.A.J., Palmen, S.J.M.C., Von Cappeln, P., Steinbusch, H.W.M., Korr, H.,Heinsen, H., Hof, P.R., Van Engeland, H., Schmitz, C., 2008. Neurons in the fusiformgyrus are fewer and smaller in autism. Brain 131, 987–999. http://dx.doi.org/10.1093/brain/awn033.
Wandell, B.A., Winawer, J., 2015. Computational neuroimaging and population receptivefields. Trends Cogn. Sci. 19, 349–357. http://dx.doi.org/10.1016/j.tics.2015.03.009.
Wandell, B.A., Winawer, J., 2011. Imaging retinotopic maps in the human brain. Vision.Res. 51, 718–737. http://dx.doi.org/10.1016/j.visres.2010.08.004.
Wang, L., Mruczek, R.E.B., Arcaro, M.J., Kastner, S., 2014. Probabilistic maps of visualtopography in human cortex. Cereb. Cortex, 1–21.
Weiner, K.S., Barnett, M., Lorenz, S., Caspers, J., Stigliani, A., Amunts, K., Zilles, K.,Fischl, B., Grill-Spector, K., 2016. The cytoarchitecture of domain-specific regions inhuman high-level visual cortex. Cereb. Cortex, 1–16. http://dx.doi.org/10.1093/cercor/bhw361.
Weiner, K.S., Golarai, G., Caspers, J., Chuapoco, M.R., Mohlberg, H., Zilles, K., Amunts,K., Grill-Spector, K., 2014. The mid-fusiform sulcus: a landmark identifying bothcytoarchitectonic and functional divisions of human ventral temporal cortex.
M. Rosenke et al. NeuroImage xxx (xxxx) xxx–xxx
13

Neuroimage 84, 453–465. http://dx.doi.org/10.1016/j.neuroimage.2013.08.068.Weiner, K.S., Zilles, K., 2016. The anatomical and functional specialization of the
fusiform gyrus. Neuropsychologia 83, 48–62. http://dx.doi.org/10.1016/j.neuropsychologia.2015.06.033.
Wohlschläger, A.M., Specht, K., Lie, C., Mohlberg, H., Wohlschläger, A., Bente, K.,Pietrzyk, U., Stöcker, T., Zilles, K., Amunts, K., Fink, G.R., 2005. Linking retinotopicfMRI mapping and anatomical probability maps of human occipital areas V1 and V2.Neuroimage 26, 73–82. http://dx.doi.org/10.1016/j.neuroimage.2005.01.021.
Yeo, B.T.T., Krienen, F.M., Sepulcre, J., Sabuncu, M.R., Lashkari, D., Hollinshead, M.,Roffman, J.L., Smoller, J.W., Zöllei, L., Polimeni, J.R., Fischl, B., Liu, H., Buckner,R.L., 2011. The organization of the human cerebral cortex estimated by intrinsic
functional connectivity. J. Neurophysiol. http://dx.doi.org/10.1152/jn.00338.2011.Zilles, K., Amunts, K., 2010. Centerary of Brodmann's map - Conception and Fate. Nat.
Rev. Neurosci. 11, 139–145. http://dx.doi.org/10.1038/nrn2776.Zilles, K., Amunts, K., 2009. Receptor mapping: architecture of the human cerebral
cortex. Curr. Opin. Neurol. 22, 331–339.Zilles, K., Palomero-Gallagher, N., Amunts, K., 2013. Development of cortical folding
during evolution and ontogeny. Trends Neurosci. 36, 275–284. http://dx.doi.org/10.1016/j.tins.2013.01.006.
Zilles, K., Schleicher, A., Palomero-Gallagher, N., Amunts, K., 2002. Quantitative analysisof cyto- and receptor architecture of the human brain. In: Maz, J., Toga, A. (Eds.),Brain Mapping, Methods. Elsevier, 573–602.
M. Rosenke et al. NeuroImage xxx (xxxx) xxx–xxx
14