a cross entropy based stochastic approximation algorithm for reinforcement learning ... ·...
TRANSCRIPT

A Cross Entropy based Stochastic ApproximationAlgorithm for Reinforcement Learning with Linear
Function ApproximationAjin George Joseph
Department of Computer Science and Automation, Indian Institute of Science, Bangalore, India, [email protected]
Shalabh BhatnagarDepartment of Computer Science and Automation, Indian Institute of Science, Bangalore, India, [email protected]
In this paper, we provide a new algorithm for the problem of prediction in Reinforcement Learning, i.e., estimating the
Value Function of a Markov Reward Process (MRP) using the linear function approximation architecture, with memory
and computation costs scaling quadratically in the size of the feature set. The algorithm is a multi-timescale variant of
the very popular Cross Entropy (CE) method which is a model based search method to find the global optimum of a real-
valued function. This is the first time a model based search method is used for the prediction problem. The application of
CE to a stochastic setting is a completely unexplored domain. A proof of convergence using the ODE method is provided.
The theoretical results are supplemented with experimental comparisons. The algorithm achieves good performance fairly
consistently on many RL benchmark problems. This demonstrates the competitiveness of our algorithm against least
squares and other state-of-the-art algorithms in terms of computational efficiency, accuracy and stability.
Key words: Reinforcement Learning, Cross Entropy, Markov Reward Process, Stochastic Approximation, ODE
Method, Mean Square Projected Bellman Error, Off Policy Prediction
1. Introduction and Preliminaries
In this paper, we follow the Reinforcement Learning (RL) framework as described in [1, 2, 3]. The basic
structure in this setting is the discrete time Markov Decision Process (MDP) which is a 4-tuple (S, A, R,
P), where S denotes the set of states and A is the set of actions. R : S×A× S→R is the reward function
where R(s, a, s′) represents the reward obtained in state s after taking action a and transitioning to s′.
Without loss of generality, we assume that the reward function is bounded, i.e., |R(., ., .)| ≤ Rmax <∞.
P : S×A×S→ [0,1] is the transition probability kernel, where P(s, a, s′) = P(s′|s, a) is the probability of
next state being s′ conditioned on the fact that the current state is s and action taken is a. We assume that
the state and action spaces are finite with |S|= n and |A|= b. A stationary policy π : S→ A is a function
1
arX
iv:1
609.
0944
9v1
[cs
.SY
] 2
9 Se
p 20
16

2
from states to actions, where π(s) is the action taken in state s. A given policy π along with the transition
kernel P determines the state dynamics of the system. For a given policy π, the system behaves as a Markov
Reward Process (MRP) with transition matrix Pπ(s, s′) = P(s,π(s), s′). The policy can also be stochastic
in order to incorporate exploration. In that case, for a given s ∈ S, π(.|s) is a probability distribution over
the action space A.
For a given policy π, the system evolves at each discrete time step and this process can be captured as
a sequence of triplets (st,rt, s′t), t≥ 0, where st is the random variable which represents the current state
at time t, s′t is the transitioned state from st and rt = R(st, π(st), s′t) is the reward associated with the
transition. In this paper, we are concerned with the problem of prediction, i.e., estimating the long run γ-
discounted cost V π ∈RS (also referred to as the Value function) corresponding to the given policy π. Here,
given s∈ S, we let
V π(s),E
[∞∑t=0
γtrt∣∣s0 = s
], (1)
where γ ∈ [0,1) is a constant called the discount factor and E[·] is the expectation over sample trajectories
of states obtained in turn from Pπ when starting from the initial state s. V π is represented as a vector in
R|S|. V π satisfies the well known Bellman equation under policy π, given by
V π = Rπ + γPπV π , T πV π, (2)
where Rπ , (Rπ(s), s ∈ S)> with Rπ(s) = E [rt|st = s], V π , (V π(s), s ∈ S)> and T πV π , ((T πV π)(s),
s ∈ S)>, respectively. Here T π is called the Bellman operator. If the model information, i.e., Pπ and Rπ
are available, then we can obtain the value function V π by solving analytically the linear system V π =
(I − γPπ)−1Rπ.
However, in this paper, we follow the usual RL framework, where we assume that the model, is inac-
cessible; only a sample trajectory {(st,rt, s′t)}∞t=1 is available where at each instant t, state st of the triplet
(st,rt, s′t) is sampled using an arbitrary distribution ν over S, while the next state s′t is sampled using
Pπ(st, .) and rt is the immediate reward for the transition. The value function V π has to be estimated here
from the given sample trajectory.

3
To further make the problem more arduous, the number of states n may be large in many practical ap-
plications, for example, in games such as chess and backgammon. Such combinatorial blow-ups exemplify
the underlying problem with the value function estimation, commonly referred to as the curse of dimen-
sionality. In this case, the value function is unrealizable due to both storage and computational limitations.
Apparently one has to resort to approximate solution methods where we sacrifice precision for computa-
tional tractability. A common approach in this context is the function approximation method [1], where we
approximate the value function of unobserved states using available training data.
In the linear function approximation technique, a linear architecture consisting of a set of k, n-
dimensional feature vectors, 1 ≤ k� n, {φi ∈ RS}, 1 ≤ i ≤ k, is chosen a priori. For a state s ∈ S, we
define
φ(s),
φ1(s)
φ2(s)
...
φk(s)
k×1
, Φ,
φ(s1)>
φ(s2)>
...
φ(sn)>
n×k
, (3)
where the vector φ(·) is called the feature vector, while Φ is called the feature matrix.
Primarily, the task in linear function approximation is to find a weight vector z ∈ Rk such that the pre-
dicted value function Φz ≈ V π. Given Φ, the best approximation of V π is its projection on to the subspace
{Φz|z ∈ Rk} (column space of Φ) with respect to an arbitrary norm. Typically, one uses the weighted
norm ‖.‖ν where ν(·) is an arbitrary distribution over S. The norm ‖.‖ν and its associated linear projection
operator Πν are defined as
‖V ‖2ν =n∑i=1
V (i)2ν(i), Πν = Φ(Φ>DνΦ)−1Φ>Dν , (4)
whereDν is the diagonal matrix withDνii = ν(i), i= 1, . . . , n. So a familiar objective in most approximation
algorithms is to find a vector z∗ ∈Rk such that Φz∗ ≈ΠνV π.
Also it is important to note that the efficacy of the learning method depends on both the features φi and
the parameter z [4]. Most commonly used features include Radial Basis Functions (RBF), Polynomials,

4
Fourier Basis Functions [5], Cerebellar Model Articulation Controller (CMAC) [6] etc. In this paper, we
assume that a carefully chosen set of features is available a priori.
The existing algorithms can be broadly classified as (i) Linear methods which include Temporal Differ-
ence (TD) [7], Gradient Temporal Difference (GTD [8], GTD2 [9], TDC [9]) and Residual Gradient (RG)
[10] schemes, whose computational complexities are linear in k and hence are good for large values of
k and (ii) Second order methods which include Least Squares Temporal Difference (LSTD) [11, 12] and
Least Squares Policy Evaluation (LSPE) [13] whose computational complexities are quadratic in k and are
useful for moderate values of k. Second order methods, albeit computationally expensive, are seen to be
more data efficient than others except in the case when trajectories are very small [14].
Eligibility traces [7] can be integrated into most of these algorithms to improve the convergence rate.
Eligibility trace is a mechanism to accelerate learning by blending temporal difference methods with Monte
Carlo simulation (averaging the values) and weighted using a geometric distribution with parameter λ ∈
[0,1). The algorithms with eligibility traces are named with (λ) appended, for example TD(λ), LSTD(λ)
etc. In this paper, we do not consider the treatment of eligibility traces.
Sutton’s TD(λ) algorithm with function approximation [7] is one of the fundamental algorithms in RL.
TD(λ) is an online, incremental algorithm, where at each discrete time t, the weight vectors are adjusted to
better approximate the target value function. The simplest case of the one-step TD learning, i.e. λ= 0, starts
with an initial vector z0 and the learning continues at each discrete time instant t where a new prediction
vector zt+1 is obtained using the recursion,
zt+1 = zt +αt+1δt(zt)φ(st).
In the above, αt is the learning rate which satisfies∑
tαt =∞,∑
tα2t <∞ and δt(z), rt + γz>φ(s′t)−
z>φ(st) is called the Temporal Difference (TD)-error. In on-policy cases where Markov Chain is ergodic
and the sampling distribution ν is the stationary distribution of the Markov Chain, then with αt satisfying
the above conditions and with Φ being a full rank matrix, the convergence of TD(0) is guaranteed [15].
But in off-policy cases, i.e., where the sampling distribution ν is not the stationary distribution of the chain,
TD(0) is shown to diverge [10].

5
By applying stochastic approximation theory, the limit point z∗TD of TD(0) is seen to satisfy
0 =E [δt(z)φ(st)] =Az− b, (5)
where A= E [φ(st)(φ(st)− γφ(s′t))>] and b= E [rtφ(st)] . This gives rise to the Least Squares Temporal
Difference (LSTD) algorithm [11, 12], which at each iteration t, provides estimates At of matrix A and bt
of vector b, and upon termination of the algorithm at time T , the approximation vector zT is evaluated by
zT = (AT )−1bT .
Least Squares Policy Evaluation (LSPE) [13] is a multi-stage algorithm where in the first stage, it obtains
ut+1 = arg minu ‖Φzt−T πΦu‖2ν using the least squares method. In the subsequent stage, it minimizes the
fix-point error using the recursion zt+1 = zt +αt+1 (ut+1− zt).
Van Roy and Tsitsiklis [15] gave a different characterization for the limit point z∗TD of TD(0) as the fixed
point of the projected Bellman operator ΠνT π,
Φz = ΠνT πΦz. (6)
This characterization yields a new error function, the Mean Squared Projected Bellman Error (MSPBE)
defined as
MSPBE(z), ‖Φz−ΠνT πΦz‖2ν , z ∈Rk. (7)
In [9, 8], this objective function is maneuvered to derive novel Θ(k) algorithms like GTD, TDC and GTD2.
GTD2 is a multi-timescale algorithm given by the following recursions:
zt+1 = zt +αt+1 (φ(st)− γφ(s′t)) (φ(st)>vt), (8)
vt+1 = vt +βt+1(δt(zt)−φ(st)>vt)φ(st). (9)
The learning rates αt and βt satisfy∑
tαt =∞,∑
tα2t <∞ and βt = ηαt, where η > 0.
Another pertinent error function is the Mean Square Bellman Residue (MSBR) which is defined as
MSBR(z),E[(E [δt(z)|st])2
], z ∈Rk. (10)
MSBR is a measure of how closely the prediction vector represents the solution to the Bellman equation.

6
| Algorithm |Complexity | Error | Eligibility Trace |
LSTD Θ(k3) MSPBE Yes
TD Θ(k) MSPBE Yes
LSPE Θ(k3) MSPBE Yes
GTD Θ(k) MSPBE -
GTD2 Θ(k) MSPBE -
RG Θ(k) MSBR Yes
Table 1 Comparison of the state-of-the-art function approximation RL algorithms
Residual Gradient (RG) algorithm [10] minimizes the error function MSBR directly using stochastic
gradient search. RG however requires double sampling, i.e., generating two independent samples s′t and s′′t
of the next state when in the current state st. The recursion is given by
zt+1 = zt +αt+1
(rt + γz>t φ
′t− z>t φt
)(φt− γφ
′′
t
), (11)
where φt , φ(st), φ′t , φ(s′t+1) and φ′′t , φ(s
′′t ). Even though RG algorithm guarantees convergence, due
to large variance, the convergence rate is small.
If the feature set, i.e., the columns of the feature matrix Φ is linearly independent, then both the error
functions MSBR and MSPBE are strongly convex. However, their respective minima are related depending
on whether the feature set is perfect or not. A feature set is perfect if V π ∈ {Φz|z ∈Rk}. If the feature set is
perfect, then the respective minima of MSBR and MSPBE are the same. In the imperfect case, they differ.
A relationship between MSBR and MSPBE can be easily established as follows:
MSBR(z) = MSPBE(z) + ‖T πΦz−ΠνT πΦz‖2, z ∈Rk. (12)
A vivid depiction of the relationship is shown in Figure 1.
Another relevant error objective is the Mean Square Error (MSE) which is the square of the ν-weighted
distance from V π and is defined as
MSE(z), ‖V π −Φz‖2ν , z ∈Rk. (13)

7
Π
Φz
T πΦz
ΠT πΦz
Tπ
√ MSPBE
√ MSB
R
{Φz|z ∈ Rk}
Figure 1 Diagram depicting the relationship between the error functions MSPBE and MSBR.
In [16] and [17] the relationship between MSE and MSBR is provided. It is found that, for a given ν with
ν(s)> 0,∀s∈ S, √MSE(z)≤
√C(ν)
1− γ√
MSBR(z), (14)
where C(ν) = maxs,s′P(s,s′)ν(s)
. Another bound which is of considerable importance is the bound on the MSE
of the limit point z∗TD of the TD(0) algorithm provided in [15]. It is found that
√MSE(z∗TD)≤ 1√
1− γ2
√MSE(zν), (15)
where zν ∈ Rk satisfies Φzν = ΠνV π and γ is the discount factor. Table 1 provides a list of important TD
based algorithms along with the associated error objectives. The algorithm complexities are also shown in
the table.
Put succinctly, when linear function approximation is applied in an RL setting, the main task can be cast
as an optimization problem whose objective function is one of the aforementioned error functions. Typi-
cally, almost all the state-of-the-art algorithms employ gradient search technique to solve the minimization
problem. In this paper, we apply a gradient-free technique called the Cross Entropy (CE) method instead
to find the minimum. By ‘gradient-free’, we mean the algorithm does not incorporate information on the
gradient of the objective function, rather uses the function values themselves. Cross Entropy method is com-
monly subsumed within the general class of Model based search methods [18]. Other methods in this class

8
are Model Reference Adaptive Search (MRAS) [19], Gradient-based Adaptive Stochastic Search for Sim-
ulation Optimization (GASSO) [20], Ant Colony Optimization (ACO) [21] and Estimation of Distribution
Algorithms (EDAs) [22]. Model based search methods have been applied to the control problem1 in [23]
and in basis adaptation2 [24], but this is the first time such a procedure has been applied to the prediction
problem. However, due to certain limitations in the original CE method, it cannot be directly applied to the
RL setting. In this paper, we have proposed a method to workaround these limitations of the CE method,
thereby making it a good choice for the RL setting. Note that any of the aforementioned error functions can
be employed, but in this paper, we attempt to minimize MSPBE as it offers the best approximation with less
bias to the projection ΠνV π for a given policy π, using a single sample trajectory.
Our Contributions The Cross Entropy (CE) method [25, 26] is a model based search algorithm to find
the global maximum of a given real valued objective function. In this paper, we propose for the first time,
an adaptation of this method to the problem of parameter tuning in order to find the best estimates of the
value function V π for a given policy π under the linear function approximation architecture. We propose a
multi-timescale stochastic approximation algorithm which minimizes the MSPBE. The algorithm possesses
the following attractive features:
1. No restriction on the feature set.
2. The computational complexity is quadratic in the number of features (this is a significant improvement
compared to the cubic complexity of the least squares algorithms).
3. It is competitive with least squares and other state-of-the-art algorithms in terms of accuracy.
4. It is online with incremental updates.
5. It gives guaranteed convergence to the global minimum of the MSPBE.
A noteworthy observation is that since MSPBE is a strongly convex function [14], local and global minima
overlap and the fact that CE method finds the global minima as opposed to local minima, unlike gradient
search, is not really essential. Nonetheless, in the case of non-linear function approximators, the convexity
property does not hold in general and so there may exist multiple local minima in the objective and the
gradient search schemes would get stuck in local optima unlike CE based search. We have not explored
the non-linear case in this paper. However, our approach can be viewed as a significant first step towards
efficiently using model based search for policy evaluation in the RL setting.

9
2. Proposed Algorithm: SCE-MSPBEM
We present in this section our algorithm SCE-MSPBEM, acronym for Stochastic Cross Entropy-Mean
Squared Projected Bellman Error Minimization that minimizes the Mean Squared Projected Bellman Error
(MSPBE) by incorporating a multi-timescale stochastic approximation variant of the Cross Entropy (CE)
method.
2.1. Summary of Notation:
Let Ik×k and 0k×k be the identity matrix and the zero matrix with dimensions k×k respectively. Let fθ(·) be
the probability density function (pdf ) parametrized by θ and Pθ be its induced probability measure. Let Eθ[·]
be the expectation w.r.t. the probability distribution fθ(·). We define the (1− ρ)-quantile of a real-valued
functionH(·) w.r.t. the probability distribution fθ(·) as follows:
γHρ (θ), sup{l ∈R : Pθ(H(x)≥ l)≥ ρ}, (16)
Also dae denotes the smallest integer greater than a. For A⊂ Rm, let IA represent the indicator function,
i.e., IA(x) is 1 when x ∈ A and is 0 otherwise. We denote by Z+ the set of non-negative integers. Also
we denote by R+ the set of non-negative real numbers. Thus, 0 is an element of both Z+ and R+. In this
section, x represents a random variable and x a deterministic variable.
2.2. Background: The CE Method
To better understand our algorithm, we briefly explicate the original CE method first.
2.2.1. Objective of CE The Cross Entropy (CE) method [25, 27, 26] solves problems of the following
form:
Find x∗ ∈ arg maxx∈X⊂Rm
H(x),
whereH(·) is a multi-modal real-valued function and X is called the solution space.
The goal of the CE method is to find an optimal “model” or probability distribution over the solution space
X which concentrates on the global maxima of H(·). The CE method adopts an iterative procedure where
at each iteration t, a search is conducted on a space of parametrized probability distributions {fθ|θ ∈Θ} on

10
X over X , where Θ is the parameter space, to find a distribution parameter θt which reduces the Kullback-
Leibler (KL) distance from the optimal model. The most commonly used class here is the exponential family
of distributions.
Exponential Family of Distributions: These are denoted as C , {fθ(x) = h(x)eθ>Γ(x)−K(θ) | θ ∈ Θ ⊂
Rd}, where h : Rm −→R, Γ : Rm −→Rd and K : Rd −→R. By rearranging the parameters, we can show
that the Gaussian distribution with mean vector µ and the covariance matrix Σ belongs to C. In this case,
fθ(x) =1√
(2π)m|Σ|e−(x−µ)>Σ−1(x−µ)/2, (17)
and so one may let h(x) =1√
(2π)m, Γ(x) = (x,xx>)> and θ= (Σ−1µ, −1
2Σ−1)>.
~ Assumption (A1): The parameter space Θ is compact.
2.2.2. CE Method (Ideal Version) The CE method aims to find a sequence of model parameters
{θt}t∈Z+ , where θt ∈Θ and an increasing sequence of thresholds {γt}t∈Z+ where γt ∈R, with the property
that the support of the model identified using θt, i.e., {x|fθt(x) 6= 0} is contained in the region {x|H(x)≥
γt}. By assigning greater weight to higher values of H at each iteration, the expected behaviour of the
probability distribution sequence should improve. The most common choice for γt+1 is γHρ (θt), the (1−ρ)-
quantile of H(x) w.r.t. the probability distribution fθt(·), where ρ ∈ (0,1) is set a priori for the algorithm.
We take Gaussian distribution as the preferred choice for fθ(·) in this paper. In this case, the model param-
eter is θ= (µ,Σ)> where µ∈Rm is the mean vector and Σ∈Rm×m is the covariance matrix.
The CE algorithm is an iterative procedure which starts with an initial value θ0 = (µ0,Σ0)> of the mean
vector and the covariance matrix tuple and at each iteration t, a new parameter θt+1 = (µt+1,Σt+1)> is
derived from the previous value θt as follows:
θt+1 = arg maxθ∈Θ
Eθt{S(H(x))I{H(x)≥γt+1} log fθ(x)
}, (18)
where S is positive and strictly monontone.
If the gradient w.r.t. θ of the objective function in (18) is equated to 0 and using (17) for fθ(·), we obtain
µt+1 =Eθt [g1(H(x),x, γt+1)]
Eθt [g0(H(x), γt+1)],Υ1(H(·), θt, γt+1), (19)

11
Σt+1 =Eθt [g2(H(x),x, γt+1, µt+1)]
Eθt [g0(H(x), γt+1)],Υ2(H(·), θt, γt+1, µt+1). (20)
where g0(H(x), γ), S(H(x))I{H(x)≥γ}, (21)
g1(H(x), x, γ), S(H(x))I{H(x)≥γ}x, (22)
g2(H(x), x, γ,µ), S(H(x))I{H(x)≥γ}(x−µ)(x−µ)>. (23)
REMARK 1. The function S(·) in (18) is positive and strictly monotone and is used to account for the cases
when the objective functionH(x) takes negative values for some x. One common choice is S(x) = exp(rx)
where r ∈R is chosen appropriately.
2.2.3. CE Method (Monte-Carlo Version) It is hard in general to evaluate Eθt [·] and γt, so the stochas-
tic counterparts of the equations (19) and (20) are used instead in the CE algorithm. This gives rise to
the Monte-Carlo version of the CE method. In this stochastic version, the algorithm generates a sequence
{θt = (µt, Σt)>}t∈Z+
, where at each iteration t,Nt samples Λt = {x1,x2, . . . ,xNt} are picked using the dis-
tribution fθt and the estimate of γt+1 is obtained as follows: γt+1 =H(d(1−ρ)Nte) whereH(i) is the ith-order
statistic of {H(xi)}Nti=1. The estimate θt+1 = (µt+1, Σt+1)> of the model parameters θt+1 = (µt+1,Σt+1)>
is obtained as
µt+1 =1Nt
∑Nti=1 g1(H(xi),xi, γt+1)
1Nt
∑Nti=1 g0(H(xi), γt+1)
, Υ1(H(·), θt, γt+1), (24)
Σt+1 =1Nt
∑Nti=1 g2(H(xi),xi, γt+1, µt+1)
1Nt
∑Nti=1 g0(H(xi), γt+1)
, Υ2(H(·), θt, γt+1, µt+1). (25)

12
An observation allocation rule {Nt ∈ Z+}t∈Z+is used to determine the sample size. The Monte-Carlo
version of the CE method is described in Algorithm 1.
Algorithm 1: The Monte-Carlo CE Algorithm
Step 0: Choose an initial p.d.f. fθ0(·) on X where θ0 = (µ0, Σ0)> and fix an ε > 0;
Step 1: [Sampling Candidate Solutions] Randomly sample Nt independent and identically
distributed solutions Λt = {x1, . . . ,xNt} using fθt(·).
Step 2: [Threshold Evaluation] Calculate the sample (1− ρ)-quantile γt+1 =H(d(1−ρ)Nte), where
H(i) is the ith-order statistic of the sequence {H(xi)}Nti=1;
Step 3: [Threshold Comparison]
if γt+1 ≥ γ∗t + ε thenγ∗t+1 = γt+1,
elseγ∗t+1 = γ∗t .
Step 3: [Model Parameter Update]
θt+1 = (µt+1, Σt+1)> =(
Υ1(H(·), θt, γ∗t+1), Υ2(H(·), θt, γ∗t+1, µt+1))>
.
Step 4: If the stopping rule is satisfied, then return θt+1, else set t := t+ 1 and go to Step 1.
REMARK 2. The CE method is also applied in stochastic settings for which the objective function is given
by H(x) = Ey [G(x,y)], where y ∈ Y and Ey[·] is the expectation w.r.t. a probability distribution on Y .
Since the objective function is expressed in terms of expectation, it might be hard in some scenarios to
obtain the true values of the objective function. In such cases, estimates of the objective function are used
instead. The CE method is shown to have global convergence properties in such cases too.
2.2.4. Limitations of the CE Method A significant limitation of the CE method is its dependence on
the sample size Nt used in Step 1 of Algorithm 1. One does not know a priori the best value for the sample
size Nt. Higher values of Nt while resulting in higher accuracy also require more computational resources.
One often needs to apply brute force in order to obtain a good choice of Nt. Also as m, the dimension of
the solution space, takes large values, more samples are required for better accuracy, making Nt large as
well. This makes finding the ith-order statistic H(i) in Step 2 harder. Note that the order statistic H(i) is
obtained by sorting the list {H(x1),H(x2), . . .H(xNt)}. The computational effort required in that case is

13
O(Nt logNt) which in most cases is inadmissible. The other major bottleneck is the space required to store
the samples Λt. In situations when m and Nt are large, the storage requirement is a major concern.
The CE method is also offline in nature. This means that the function values {H(x1), . . . ,H(xNt)} of the
sample set Λt = {x1, . . . ,xNt} should be available before the model parameters can be updated in Step 4 of
Algorithm 1. So when applied in the prediction problem of approximating the value function V π for a given
policy π using the linear architecture defined in (3) by minimizing the error function MSPBE(·), we require
the estimates of {MSPBE(x1), . . . ,MSPBE(xNt)}. This means that a sufficiently long traversal along
the given sample trajectory has to be conducted to obtain the estimates before initiating the CE method.
This does not make the CE method amenable to online implementations in RL, where the value function
estimations are performed in real-time after each observation.
In this paper, we resolve all these shortcomings of the CE method by remodelling the same in the stochas-
tic approximation framework and thus replacing the sample averaging operation in equations (24) and (25)
with a bootstrapping approach where we continuously improve the estimates based on past observations.
Each successive estimate is obtained as a function of the previous estimate and a noise term. We replace
the (1− ρ)-quantile estimation using the order statistic method in Step 2 of Algorithm 1 with a stochastic
recursion which serves the same purpose, but more efficiently. The model parameter update in step 3 is
also replaced with a stochastic recursion. We also bring in additional modifications to the CE method to
adapt to a Markov Reward Process (MRP) framework and thus obtain an online version of CE where the
computational requirements are quadratic in the size of the feature set for each observation. To fit the online
nature, we have developed an expression for the objective function MSPBE, where we are able to separate
its deterministic and non-deterministic components. This separation is critical since the original expression
of MSPBE is convoluted with the solution vector and the expectation terms and hence is unrealizable. The
separation further helps to develop a stochastic recursion for estimating MSPBE. Finally, in this paper, we
provide a proof of convergence of our algorithm using an ODE based analysis.
2.3. Proposed Algorithm (SCE-MSPBEM)
Notation: In this section, z represents a random variable and z a deterministic variable.
SCE-MSPBEM is an algorithm to approximate the value function V π (for a given policy π) with linear

14
function approximation, where the optimization is performed using a multi-timescale stochastic approxima-
tion variant of the CE algorithm. Since the CE method is a maximization algorithm, the objective function
in the optimization problem here is the negative of MSPBE. Thus,
z∗ = arg minz∈Z⊂Rk
MSPBE(z) = arg maxz∈Z⊂Rk
J (z), (26)
where J =−MSPBE.
HereZ is the solution space, i.e., the space of parameter values of the function approximator. We also define
J ∗ ,J (z∗).
REMARK 3. Since ∃z ∈Z such that Φz = ΠνT πΦz, the value of J ∗ is 0.
~ Assumption (A2): The solution space Z is compact, i.e., it is closed and bounded.
In [9] a compact expression for MSPBE is given as follows:
MSPBE(z) = (Φ>Dν(TπVz −Vz))>(Φ>DνΦ)−1(Φ>Dν(TπVz −Vz)). (27)
Using the fact that Vz = Φz, the expression Φ>Dν(TπVz −Vz) can be rewritten as
Φ>Dν(TπVz −Vz) =E[E[φt(rt + γz>φ′t− z>φt)|st
]]=E [E [φtrt|st]] +E
[E[φt(γφ
′t−φt)>|st
]]z, where φt , φ(st) and φ′t , φ(s′t). (28)
Also, Φ>DνΦ =E[φtφ
>t
]. (29)
Putting all together we get,
MSPBE(z) =(E [E [φtrt|st]] +E
[E[φt(γφ
′t−φt)>|st
]]z)>
(E[φtφ
>t
])−1
(E [E [φtrt|st]] +E
[E[φt(γφ
′t−φt)>|st
]]z). (30)
=(ω(0)∗ +ω(1)
∗ z)>ω(2)∗(ω(0)∗ +ω(1)
∗ z), (31)
where ω(0)∗ ,E [E [φtrt|st]], ω(1)
∗ ,E [E [φt(γφ′t−φt)>|st]] and ω(2)
∗ , (E [φtφ>t ])−1.
This is a quadratic function on z. Note that, in the above expression, the parameter vector z and the
stochastic component involving E[·] are decoupled. Hence the stochastic component can be estimated inde-
pendent of the parameter vector z.

15
The goal of this paper is to adapt CE method into a MRP setting in an online fashion, where we solve the
prediction problem which is a continuous stochastic optimization problem. The important tool we employ
here to achieve this is the stochastic approximation framework. Here we take a slight digression to explain
stochastic approximation algorithms.
Stochastic approximation algorithms [28, 29, 30] are a natural way of utilizing prior information. It
does so by discounted averaging of the prior information and are usually expressed as recursive equations
of the following form:
zj+1 = zj +αj+1∆zj+1, (32)
where ∆zj+1 = q(zj) + bj +Mj+1 is the increment term, q(·) is a Lipschitz continuous function, bj is the
bias term with bj → 0 and {Mj} is a martingale difference noise sequence, i.e., Mj is Fj-measurable and
integrable and E[Mj+1|Fj] = 0,∀j. Here {Fj}j∈Z+is a filtration, where the σ-field Fj = σ(zi,Mi,1≤ i≤
j,z0). The learning rate αj satisfies Σjαj =∞, Σjα2j <∞.
We have the following well known result from [28] regarding the limiting behaviour of the stochastic
recursion (32):
THEOREM 1. Assume supj ‖zj‖ <∞, E[‖Mj+1‖2|Fj] ≤ K(1 + ‖zj‖2),∀j and q(·) is Lipschitz contin-
uous. Then the iterates zj converge almost surely to the compact connected internally chain transitive
invariant set of the ODE:
z(t) = q(z(t)), t∈R+. (33)
Put succinctly, the above theorem establishes an equivalence between the asymptotic behaviour of the iter-
ates {zj} and the deterministic ODE (33). In most practical cases, the ODE have a unique globally asymp-
totically stable equilibrium at an arbitrary point z∗. It will then follow from the theorem that zj → z∗ a.s.
However, in some cases, the ODE can have multiple isolated stable equilibria. In such cases, the conver-
gence of {zj} to one of these equilibria is guaranteed, however the limit point would depend on the noise
and the initial value.
A relevant extension of the stochastic approximation algorithms is the multi-timescale variant. Here there
will be multiple stochastic recursions of the kind (32), each with possibly different learning rates. The

16
learning rates defines the timescale of the particular recursion. So different learning rates imply different
timescales. If the increment terms are well-behaved and the learning rates properly related (defined in Chap-
ter 6 of [28]), then the chain of recursions exhibit a well-defined asymptotic behaviour. See Chapter 6 [28]
for more details.
Now digression aside, note that the important stochastic variables of the ideal CE method are H, γk, µk,
Σk and θk. Here, the objective function H = J . In our approach, we track these variables independently
using stochastic recursions of the kind (32). Thus we model our algorithm as a multi-timescale stochastic
approximation algorithm which tracks the ideal CE method. Note that the stochastic recursion is uniquely
identified by their increment term, their initial value and the learning rate. We consider here these recursions
in great detail.
1. Tracking the Objective Function J (·): Recall that the goal of the paper is to develop an online and in-
cremental prediction algorithm. This implies that algorithm has to learn from a given sample trajectory using
an incremental approach with a single traversal of the trajectory. The algorithm SCE-MSPBEM operates on-
line on a single sample trajectory {(st,rt, s′t)}∞t=0, where st ∼ ν(·), s′t ∼Pπ(st, ·) and rt = R(st, π(st), s′t).
~ Assumption (A3): For the given trajectory {(st,rt, s′t)}∞t=0, let φt, φ′t, and rt have uniformly bounded
second moments. Also, E [φtφ>t ] is non-singular.
In the expression (31) for the objective function J (·), we have isolated the stochastic and deterministic
part. The stochastic part can be identified by the tuple ω∗ , (ω(0)∗ , ω
(1)∗ , ω
(2)∗ )>. So if we can find ways to
track ω∗, then it implies we could track J (·). This is the line of thought we follow here. In our algorithm,
we track ω∗ using the time dependent variable ωt , (ω(0)t , ω
(1)t , ω
(2)t )>, where ω(0)
t ∈ Rk, ω(1)t ∈ Rk×k and
ω(2)t ∈Rk×k. Here ω(i)
t independently tracks ω(i)∗ , 1≤ i≤ 3. Note that tracking implies limt→∞ω
(i)t = ω
(i)∗ ,
1≤ i≤ 3. The increment term ∆ωt , (ω(0)t , ω
(1)t , ω
(2)t )> used for this recursion is defined as follows:
4ω(0)t = rtφt−ω(0)
t ,
4ω(1)t = φt(γφ
′t−φt)>−ω(1)
t ,
4ω(2)t = Ik×k−φtφ>t ω(2)
t ,
(34)

17
where φt , φ(st) and φ′t , φ(s′t). Now we define a new function J (ωt, z) ,
−(ω
(0)t +ω
(1)t z)>
ω(2)t
(ω
(0)t +ω
(1)t z)
. Note that this is the same expression as (31) except for ωt replacing
ω∗. Since ωt tracks ω∗, it is easily verifiable that J (ωt, z) indeed tracks J (z) for a given z ∈Z .
The stochastic recursions which track ω∗ and the objective function J (·) are defined in (41) and (42)
respectively. A rigorous analysis of the above stochastic recursion is provided in lemma 2. There we also
find that the initial value ω0 is irrelevant.
2. Tracking γρ(J , θ): Here we are faced two difficult situations: (i) the true objective function J is
unavailable and (ii) we have to find a stochastic recursion which tracks γρ(J , θ) for a given distribution
parameter θ. To solve (i) we use whatever is available, i.e. J (ωt, ·) which is the best available estimate of
the true function J (·) at time t. In other words, we bootstrap. Now to address the second part we make use
of the following lemma from [31]. The lemma provides a characterization of the (1−ρ)-quantile of a given
real-valued function H w.r.t. to a given probability distribution function fθ.
LEMMA 1. The (1− ρ)-quantile of a bounded real valued function H(·)(
with H(x)∈ [Hl,Hu])
w.r.t the
probability density function fθ(·) is reformulated as an optimization problem
γρ(H,θ) = arg miny∈[Hl,Hu]
Eθ [ψ(H(x), y)] , (35)
where x ∼ fθ(·), ψ(H(x), y) = (1 − ρ)(H(x) − y)I{H(x)≥y} + ρ(y − H(x))I{H(x)≤y} and Eθ[·] is the
expectation w.r.t. the p.d.f. fθ(·).
In this paper, we employ the time-dependent variable γt to track γρ(J , ·). The increment term in the re-
cursion is the subdifferential ∇yψ. This is because ψ is non-differentiable as it follows from its definition
from the above lemma. However subdifferential exists for ψ. Hence we utilize it to solve the optimization
problem (35) defined in lemma 1. Here, we define an increment function (contrary to an increment term)
and is defined as follows:
∆γt+1(z) =−(1− ρ)I{J (ωt,z)≥γt}+ ρI{J (ωt,z)≤γt}(36)

18
The stochastic recursion which tracks γρ(J , ·) is given in (43). A deeper analysis of the recursion (43) is
provided in lemma 3. In the analysis we also find that the initial value γ0 is irrelevant.
3. Tracking Υ1 and Υ2: In the ideal CE method, for a given θt, note that Υ1(θt, . . . ) and Υ2(θt, . . . )
form the subsequent model parameter θt+1. In our algorithm, we completely avoid the sample averaging
technique employed in the Monte-Carlo version. Instead, we follow the stochastic approximation recursion
to track the above quantities. Two time-dependent variables ξ(1)t and ξ(2)
t are employed to track Υ1 and Υ2
respectively. The increment functions used by their respective recursions are defined as follows:
∆ξ(0)t+1(z) = g1(J (ωt, z), z, γt)− ξ(0)
t g0(J (ωt, z), γt), (37)
∆ξ(1)t+1(z) = g2(J (ωt, z), z, γt, ξ
(0)t )− ξ(1)
t g0(J (ωt, z), γt). (38)
The recursive equations which track Υ1 and Υ2 are defined in (44) and (45) respectively. The analysis of
these recursions is provided in lemma 4. In this case also, the initial values are irrelevant.
4. Model Parameter Update: In the ideal version of CE, note that given θt, we have θt+1 =
(Υ1(H(·), θt, . . . ),Υ2(H(·), θt, . . . ))>. This is a discrete change from θt to θt+1. But in our algorithm, we
adopt a smooth update of the model parameters. The recursion is defined in equation (48). We prove in
theorem 2 that the above approach indeed provide an optimal solution to the optimization problem defined
in (26).
5. Learning Rates and Timescales: The algorithm uses two learning rates αt and βt which are determin-
istic, positive, nonincreasing and satisfy the following conditions:
∞∑t=1
αt =∞∑t=1
βt =∞,∞∑t=1
(α2t +β2
t
)<∞, lim
t→∞
αtβt
= 0. (39)
In a multi-timescale stochastic approximation setting, it is important to understand the difference between
timescale and learning rate. The timescale of a stochastic recursion is defined by its learning rate (also re-
ferred as step-size). Note that from the conditions imposed on the learning rates αt and βt in (39), we have
αtβt→ 0. So αt decays to 0 faster than βt. Hence the timescale obtained from βt, t≥ 0 is considered faster as
compared to the other. So in a multi-timescale stochastic recursion scenario, the evolution of the recursion

19
controlled by the faster step-sizes (converges faster to 0) is slower compared to the recursions controlled by
the slower step-sizes. This is because the increments are weighted by their learning rates, i.e., the learning
rates control the quantity of change that occurs to the variables when the update is executed. So the faster
timescale recursions converge faster compared to its slower counterparts. Infact, when observed from a
faster timescale recursion, one can consider the slower timescale recursion to be almost stationary. This at-
tribute of the multi-timescale recursions are very important in the analysis of the algorithm. In the analysis,
when studying the asymptotic behaviour of a particular stochastic recursion, we can consider the variables
of other recursions which are on slower timescales to be constant. In our algorithm, the recursion of ωt and
θt proceed along the slowest timescale and so updates of ωt appear to be quasi-static when viewed from
the timescale on which the recursions governed by βt proceed. The recursions of γt, ξ(0)t and ξ(1)
t proceed
along the faster timescale and hence have a faster convergence rate. The stable behaviour of the algorithm
is attributed to the timescale differences obeyed by the various recursions.
6. Sample Requirement: The streamline nature inherent in the stochastic approximation algorithms de-
mands only a single sample per iteration. Infact, we use two samples zt+1 (generated in (40)) and zpt+1
(generated in (46) whose discussion is deferred for the time being).This is a remarkable improvement, apart
from the fact that the algorithm is now online and incremental in the sense that whenever a new state transi-
tion (st,rt, s′t) is revealed, the algorithm learns from it by evolving the variables involved and directing the
model parameter θt towards the degenerate distribution concentrated on the optimum point z∗.
7. Mixture Distribution: In the algorithm, we use a mixture distribution fθt to generate the sample xt+1,
where fθt = (1− λ)fθt + λfθ0 with λ ∈ (0,1) the mixing weight. The initial distribution parameter θ0 is
chosen s.t. the density function fθ0 is strictly positive on every point in the solution space X , i.e., fθ0(x)>
0,∀x∈X . The mixture approach facilitates exploration of the solution space and prevents the iterates from
getting stranded in suboptimal solutions.
The SCE-MSPBEM algorithm is formally presented in Algorithm 2.

20
Algorithm 2: SCE-MSPBEMData: αt, βt, ct ∈ (0,1), ct→ 0, ε1, λ, ρ∈ (0,1), S(·) :R→R+;
Initialization: γ0 = 0, γp0 =−∞, θ0 = (µ0,Σ0)>, T0 = 0, ξ(0)t = 0k×1, ξ(1)
t = 0k×k,
ω(0)0 = 0k×1, ω
(1)0 = 0k×k, ω
(2)0 = 0k×k, θ
p =NULL;
foreach (st,rt, s′t) of the trajectory do
fθt = (1−λ)fθt +λfθ0 ;
zt+1 ∼ fθt(·);(40)
• [Objective Function Evaluation]
ωt+1 = ωt +αt+1∆ωt+1; (41)
J (ωt,zt+1) =−(ω
(0)t +ω
(1)t zt+1
)>ω
(2)t
(ω
(0)t +ω
(1)t zt+1
); (42)
I [Threshold Evaluation]
γt+1 = γt−βt+1∆γt+1(zt+1); (43)
I [Tracking µt+1 and Σt+1 of (19) and (20)]
ξ(0)t+1 = ξ
(0)t +βt+1∆ξ
(0)t+1(zt+1); (44)
ξ(1)t+1 = ξ
(1)t +βt+1∆ξ
(1)t+1(zt+1); (45)
if θp 6= NULL then
zpt+1 ∼ fθp(·), λfθ0 + (1−λ)fθp ;
γpt+1 = γpt −βt+1∆γt+1(zpt+1);
(46)
I [Threshold Comparison]
Tt+1 = Tt + c(I{γt+1>γ
pt+1}− I{γt+1≤γ
pt+1}−Tt
); (47)
I [Updating Model Parameter]
if Tt+1 > ε1 then
θp = θt;
θt+1 = θt +αt+1
((ξ
(0)t , ξ
(1)t )>− θt
); (48)
γpt+1 = γt; Tt = 0; c= ct; (49)
elseγpt+1 = γpt ; θt+1 = θt;
t := t+ 1;

21
γk+1 = γk + βk+1∆γk+1
ξ(0)k+1 = ξ
(0)k + βk+1∆ξ
(0)k+1
ξ(1)k+1 = ξ
(1)k + βk+1∆ξ
(1)k+1
Yes
γpk+1 = γ
pk + βk+1∆γ
pk+1
Tk > ǫ1
z ∼fθk(·)
ωk+1 = ωk + αk+1∆ωk+1
Tk+1 = Tk + λ∆Tk+1
θk+1 = θk + αk+1∆θk+1
Model parameters
θk+1 = θk
No
γpk+1 = γk+1
12
3
∆θk+1, γk+1
Figure 2 FlowChart representation of the algorithm SCE-MSPBEM.
REMARK 4. In practice, different stopping criteria can be used. For instance, (a) t reaches an a priori fixed
limit, (b) the computational resources are exhausted, or (c) the variable Tt is unable to cross the ε1 threshold
for an a priori fixed number of iterations.
The pictorial depiction of the algorithm SCE-MSPBEM is shown in Figure 2.
It is important to note that the model parameter θt is not updated at each t. Rather it is updated every time
Tt hits ε1 where 0< ε1 < 1. So the update of θt only happens along a subsequence {t(n)}n∈Z+of {t}t∈Z+
.
So between t= t(n) and t= t(n+1), the variable γt estimates the quantity γρ(Jωt , , θt(n)). The threshold γpt
is also updated during the ε1 crossover in (49). Thus γpt(n) is the estimate of (1− ρ)-quantile w.r.t. fθt(n−1).
Thus Tt in recursion (47) is a elegant trick to ensure that the estimates γt eventually become greater than
the prior threshold γpt(n) , i.e., γt >γpt(n)
for all but finitely many t. A timeline map of the algorithm is shown
in Figure 3.
It can be verified as follows that the random variable Tt belongs to (−1,1), ∀t > 0. We state it as a
proposition here.
PROPOSITION 1. For any T0 ∈ (0,1), Tt in (47) belongs to (−1,1), ∀t > 0.
Proof: Assume T0 ∈ (0,1). Now the equation (47) can be rearranged as
Tt+1 = (1− c)Tt + c(I{γt+1>γpt+1}− I{γt+1≤γ
pt+1}
),

22
θt(n)θt(n+1)
θt(n+2)θt(n+3)
γt+1 = γt + βt+1∆γt+1
ξ(0)t+1 = ξ
(0)t
+ βt+1∆ξ(0)t+1
ξ(1)t+1 = ξ
(1)t
+ βt+1∆ξ(1)t+1
γt+1 = γt + βt+1∆γt+1
ξ(0)t+1 = ξ
(0)t
+ βt+1∆ξ(0)t+1
ξ(1)t+1 = ξ
(1)t
+ βt+1∆ξ(1)t+1
θt = θt(n), t(n) ≤ t ≤ t(n+1) θt = θt(n+1)
, t(n+1) ≤ t ≤ t(n+2) θt = θt(n+2), t(n+2) ≤ t ≤ t(n+3)
t −→
∆θt+
1 , γt+
1
∆θt+
1 ,γt+
1
γt+
1∆θt+
1 ,
γt+1 = γt + βt+1∆γt+1
ξ(0)t+1 = ξ
(0)t
+ βt+1∆ξ(0)t+1
ξ(1)t+1 = ξ
(1)t
+ βt+1∆ξ(1)t+1
J (ωt, zt+1) J (ωt, zt+1) J (ωt, zt+1)
Figure 3 Timeline graph of the algorithm SCE-MSPBEM.
where c ∈ (0,1). In the worst case, either I{γt+1>γpt+1}
= 1, ∀t or I{γt+1≤γpt+1}
= 1, ∀t. Since the two
events {γt+1 > γpt+1} and {γt+1 ≤ γpt+1} are mutually exclusive, we will only consider the former event
I{γt+1>γpt+1}
= 1, ∀t. In this case
limt→∞
Tt = limt→∞
(c+ c(1− c) + c(1− c)2 + · · ·+ c(1− c)t−1 + (1− c)tT0
)= lim
t→∞
c(1− (1− c)t)c
+T0(1− c)t = limt→∞
(1− (1− c)t) +T0(1− c)t = 1. (∵ c∈ (0,1))
Similarly for the latter event I{γt+1≤γpt+1}
= 1, ∀t, we can prove that limt→∞ Tt =−1. �
REMARK 5. The recursion in equation (46) is not addressed in the discussion above. The update of γpt in
equation (49) happens along a subsequence {t(n)}n≥0. So γpt(n) is the estimate of γρ(Jωt(n) , θt(n−1)), where
Jωt(n) (·) = J (ωt(n) , ·). But at time t(n) < t ≤ t(n+1), γpt is compared with γt in equation (47). But γt is
derived from a better estimate of J (ωt, ·). Equation (46) ensures that γpt is updated using the latest estimate
of J (ωt, ·). The variable θp holds the model parameter θt(n−1)and the update of γpt in (46) is performed
using the zpt+1 sampled using fθp(·).
3. Convergence Analysis
For analyzing the asymptotic behaviour of the algorithm, we apply the ODE based analysis from [29, 32, 28]
where an ODE whose asymptotic behaviour is eventually tracked by the stochastic system is identified.
The long run behaviour of the equivalent ODE is studied and it is argued that the algorithm asymptotically
converges almost surely to the set of stable fixed points of the ODE. We define the filtration {Ft}t∈Z+where
the σ-field Ft = σ(ωi, γi, γ
pi , ξ
(0)i , ξ
(1)i , θi,0≤ i≤ t;zi,1≤ i≤ t; si,ri, s′i,0≤ i < t
), t∈Z+.

23
It is worth mentioning that the recursion (41) is independent of other recursions and hence can be analysed
independently. For the recursion (41) we have the following result.
LEMMA 2. Let the step-size sequences αt and βt , t ∈ Z+ satisfy (39). For the sample trajectory
{(st,rt, s′t)}∞t=0, we let assumption (A3) hold and let ν be the sampling distribution. Then, for a given z ∈Z ,
the iterates ωt in equation (41) satisfy with probability one,
limt→∞
(ω(0)t +ω
(1)t z) = ω(0)
∗ +ω(1)∗ z,
limt→∞
ω(2)t = ω(2)
∗ and limt→∞J (ωt, z) =J (z),
where Jt(z) is defined in equation (42), J (z) is defined in equation (26), Φ is defined in equation (3) and
Dν is defined in equation (4) respectively.
Proof: By rearranging equations in (41), for t∈Z+, we get
ω(0)t+1 = ω
(0)t +αt+1
(M(0,0)t+1 +h(0,0)(ω
(0)t )), (50)
where M(0,0)t+1 = rtφt−E [rtφt] and h(0,0)(x) =E [rtφt]−x.
Similarly,
ω(1)t+1 = ω
(1)t +αt+1
(M(0,1)t+1 +h(0,1)(ω
(1)t )), (51)
where M(0,1)t+1 = φt(γφ
′t−φt)>−E [φt(γφ
′t−φt)>] and h(0,1)(x) =E [φt(γφ
′t−φt)>]−x.
Finally,
ω(2)t+1 = ω
(2)t +αt+1
(M(0,2)t+1 +h(0,2)(ω
(2)t )), (52)
where M(0,2)t+1 =E
[φtφ
>t ω
(2)t
]−φtφ>t ω(2)
t and h(0,2)(x) = Ik×k−E [φtφ>t x].
It is easy to verify that h(0,i),0≤ i≤ 2 are Lipschitz continuous and {M(0,i)t+1 }t∈Z+
, 0≤ i≤ 2 are martingale
difference noise terms, i.e., for each i, M(0,i)t is Ft-measurable, integrable and E
[M(0,i)t+1 |Ft
]= 0, t ∈ Z+,
0≤ i≤ 2.
Since φt and rt have uniformly bounded second moments, the noise terms {M(0,0)t+1 }t∈Z+
have uniformly
bounded second moments as well and hence ∃K0,0 > 0 s.t.
E[‖M(0,0)
t+1 ‖2|Ft]≤K0,0(1 + ‖ω(0)
t ‖2), t≥ 0.

24
Also h(0,0)c (x) , h(0,0)(cx)
c= E[rtφt|Ft]−cx
c= E[rtφt|Ft]
c− x. So h(0,0)
∞ (x) = limt→∞ h(0,0)c (x) = −x. Since
the ODE x(t) = h(0,0)∞ (x) is globally asymptotically stable to the origin, we obtain that the iterates
{ω(0)t }t∈Z+
are almost surely stable, i.e., supt ‖ω(0)t ‖<∞ a.s., from Theorem 7, Chapter 3 of [28]. Similarly
we can show that supt ‖ω(1)t ‖<∞ a.s.
Since φt and φ′t have uniformly bounded second moments, the second moments of {M(0,1)t+1 }t∈Z+
are
uniformly bounded and therefore ∃K0,1 > 0 s.t.
E[‖M(0,1)
t+1 ‖2|Ft]≤K0,1(1 + ‖ω(1)
t ‖2), t≥ 0.
Now define
h(0,2)c (x),
h(0,2)(cx)
c=
Ik×k−E [φtφ>t cx|Ft]
c=
Ik×kc−xE
[φtφ
>t
].
Hence h(0,2)∞ (x) = limt→∞ h
(0,2)c (x) =−xE [φtφ
>t ]. The ∞-system ODE given by x(t) = h(0,2)
∞ (x) is also
globally asymptotically stable to the origin since E[φtφ>t ] is positive definite (as it is non-singular and
positive semi-definite). So supt ‖ω(2)t ‖<∞ a.s. from Theorem 7, Chapter 3 of [28].
Since φt has uniformly bounded second moments, ∃K0,2 > 0 s.t.
E[‖M(0,2)
t+1 ‖2|Ft]≤K0,2(1 + ‖ω(2)
t ‖2), t≥ 0.
Now consider the following system of ODEs associated with (50)-(52):
d
dtω(0)(t) =E [rtφt]−ω(0)(t), t∈R+, (53)
d
dtω(1)(t) =E
[φt(γφ
′t−φt)>
]−ω(1)(t)), t∈R+, (54)
d
dtω(2)(t) = Ik×k−E
[φtφ
>t
]ω(2)(t), t∈R+. (55)
For the ODE (53), the point E [rtφt] is a globally asymptotically stable equilibrium. Similarly for the ODE
(54), the point E [φt(γφ′t−φt)>] is a globally asymptotically stable equilibrium. For the ODE (55), since
E [φtφ>t ] is non-negative definite and non-singular (from the assumptions of the lemma), the ODE (55) is
globally asymptotically stable to the point E [φtφ>t ]−1.

25
It can now be shown from Theorem 2, Chapter 2 of [28] that the asymptotic properties of the recursions
(50), (51), (52) and their associated ODEs (53), (54), (55) are similar and hence limt→∞ω(0)t =E [rtφt] a.s.,
limt→∞ω(1)t =E [φt(γφ
′t−φt)>] a.s. and limt→∞ω
(2)t+1 =E [φtφ
>t ]−1 a.s.. So for any z ∈Rk, using (28), we
have limt→∞(ω(0)t +ω
(1)t z) = Φ>Dν(TπVz−Vz) a.s. Also, from (29), we have limt→∞ω
(2)t+1 = (Φ>DνΦ)−1
a.s.
Putting all the above together we get limt→∞ J (ωt, z) = J (ω∗, z) = J (z) a.s. �
As mentioned before, the update of θt only happens along a subsequence {t(n)}n∈Z+of {t}t∈Z+
. So
between t= t(n) and t= t(n+1), θt is constant. The lemma and the theorems that follow in this paper depend
on the timescale difference in the step-size schedules {αt}t≥0 and {βt}t≥0. The timescale differences allow
the different recursions to learn at different rates. The step-size {βt}t≥0 decays to 0 at a slower rate than
{αt}t≥0 and hence the increments in the recursions (43), (44) and (45) which are controlled by βt are
larger and hence converge faster than the recursions (41),(42) and (48) which are controlled by αt. So the
relative evolution of the variables from the slower timescale αt, i.e., ωt is indeed slow and in fact can be
considered constant when viewed from the faster timescale βt, see Chapter 6, [28] for a succinct description
on multi-timescale stochastic approximation algorithms.
~ Assumption (A4): The iterate sequence γt in equation (43) satisfies supt |γt|<∞ a.s..
REMARK 6. The assumption (A4) is a technical requirement to prove convergence. In practice, one may
replace (43) by its ‘projected version’ whereby the iterates are projected back to an a priori chosen compact
convex set if they stray outside of this set.
Notation: We denote by Eθ[·] the expectation w.r.t. the mixture pdf and Pθ denotes its induced probability
measure. Also γρ(·, θ) represents the (1− ρ)-quantile w.r.t. the mixture pdf fθ.
The recursion (43) moves on a faster timescale as compared to the recursion (41) of ωt and the recursion
(48) of θt. Hence, on the timescale of the recursion (43), one may consider ωt and θt to be fixed. For
recursion (43) we have the following result:

26
LEMMA 3. Let ωt ≡ ω, θt ≡ θ. Let Jω(·), J (ω, ·). Then γt, t∈Z+ in equation (43) satisfy γt→ γρ(Jω, θ)
as t→∞ with probability one.
Proof: Here, for easy reference we rewrite the recursion (43),
γt+1 = γt−βt+1∆γt+1(zt+1), (56)
Substituting the expression for ∆γt+1 in (56) with ωt = ω and θt = θ, we get
γt+1 = γt−βt+1
(− (1− ρ)I{J (ω,zt+1)≥γt}+ ρI{J (ω,zt+1)≤γt}
), where zt+1 ∼ fθ(·) (57)
The above equation can be apparently viewed as,
γt+1− γt ∈−βt+1∇yψ(Jω(zt+1), γt),
where∇yψ is the sub-differential of ψ(x, y) w.r.t. y (where ψ is defined in Lemma 1).∇yψ is a set function
and is defined as follows:
∇yψ(Jω(z), y) =
{−(1− ρ)I{J (ω,z)≥y}+ ρI{J (ω,z)≤y}}, for y 6= J (ω, z)
[ρ1, ρ2 ] , for y= J (ω, z),
(58)
where ρ1 = min{1− ρ, ρ} and ρ2 = max{1− ρ, ρ}.
Rearranging the terms in equation (57) we get,
γt+1 = γt +βt+1
(M(1,0)t+1 −Eθ [∆γt+1(zt+1)]
), (59)
where M(1,0)t+1 =Eθ [∆γt+1(zt+1)]−∆γt+1(zt+1) with zt+1 ∼ fθ(·).
It is easy to verify that Eθ [∆γt+1(zt+1)] = ∇yEθ[ψ(J (zt+1), y)
]. For brevity, define h(1,0)(γ) ,
−∇yEθ[ψ(Jω(zt+1), γ)
].
The set function h(1,0) :R→{subsets of R} satisfies the following properties:
1. For each y ∈R, h(1,0)(y) is convex and compact.
2. For each y ∈R, supy′∈h(y) |h(1,0)(y′)|<K1,0(1 + |y|), for some 0<K1,0 <∞.
3. h(1,0) is upper semi-continuous.
The noise term M(1,0)t satisfies the following properties:

27
1. M(1,0)t is Ft-measurable ∀t and integrable, ∀t > 0.
2. M(1,0)t , t≥ 0 is a martingale difference noise sequence, i.e., E[M(1,0)
t+1 |Ft] = 0 a.s.
3. E[‖M(1,0)
t+1 ‖2∣∣Ft]≤K1,1(1 + ‖γt‖2 + ‖ωt‖2), for some 0<K1,1 <∞. This follows directly from the
fact that ∆γt+1(zt+1) has finite first and second order moments.
Therefore by the almost sure boundedness of the sequence {γt} in assumption (A4) and by Lemma 1,
Chapter 2 in [28], we can claim that the stochastic sequence {γt} asymptotically tracks the differential
inclusion
d
dtγ(t)∈−Eθ
[∇yψ(Jω(z), γ(t))
]=−∇yEθ
[ψ(Jω(z), γ(t))
]= h(1,0)(γ(t)). (60)
The interchange of∇γ and Eθ[·] in the above equation is guaranteed by the dominated convergence theorem.
Now we prove the stability of the above differential inclusion. Note that by Lemma 1 of [31], we know
that γ∗ , γρ(Jω, θ) is a root of the function h(1,0)(γ) and hence it is a fixed point of the flow induced by
the above differential inclusion. Now define V (γ) , Eθ[ψ(Jω(z), γ)
]− γ∗. It is easy to verify that V is
continuously differentiable. Also by Lemma 1 of [31], we have Eθ[ψ(Jω(z), γ)
]to be a convex function
and γ∗ to be its global minimum. Hence V (γ)> 0, ∀γ ∈ Rd\{γ∗}. Further V (γ∗) = 0 and V (γ)→∞ as
‖γ‖→∞. So V (·) is a Lyapunov function. Also note that<∇V (γ), h(γ)>≤ 0. So γ is the global attractor
of the differential inclusion defined in (60). Thus by Theorem 2 of chapter 2 in [28], the iterates γt converge
almost surely to γ∗ = γρ(ω, θ). �
The recursions (44) and (45) move on a faster timescale as compared to the recursion (41) of ωt and the
recursion (48) of θt. Hence, viewed from the timescale of the recursions (44) and (45), one may consider ωt
and θt to be fixed. For the recursions (44) and (45), we have the following result:
LEMMA 4. Assume ωt ≡ ω, θt ≡ θ. Let Jω(·), J (ω, ·). Then almost surely,
(i) limt→∞
ξ(0)t = ξ(0)
∗ =Eθ[g1(Jω(z),z, γρ(J , θ)
]Eθ[g0(Jω(z), γρ(J , θ)
] ,
(ii) limt→∞
ξ(1)t = ξ(1)
∗ =Eθ[g2
(Jω(z),z, γρ(Jω, θ), ξ(0)
∗
)]Eθ[g0
(Jω(z), γρ(Jω, θ)
)] .
where Eθ[·] is the expectation w.r.t. the pdf fθ(·) and z∼ fθ(·).
(iii) If γρ(Jω, θ)>γρ(Jω, θp), then Tt, t∈Z+ in equation (47) satisfy limt→∞ Tt = 1 a.s.

28
Proof: (i) First, we recall equation (44) below
ξ(0)t+1 = ξ
(0)t +βt+1
(g1(J (ωt,zt+1),zt+1, γt)− ξ(0)
t g0
(J (ωt,zt+1), γt
)). (61)
Note that the above recursion of ξ(0)t depends on γt, but not the other way. This implies that we can replace
γt by its limit point γρ(Jω, θ) and a bias term which goes to zero as t→∞. We denote the decaying bias
term using the notation o(1). Further, using the assumption that ωt = ω, θt = θ and from the equation (61),
we get,
ξ(0)t+1 = ξ
(0)t +βt+1
(h(2,0)(ξ
(0)t ) +M(2,0)
t+1 + o(1)), (62)
where h(2,0)(x),−E[xg0
(Jω(zt+1), γρ(Jω, θ)
)∣∣∣Ft]+E[g1
(Jω(zt+1),zt+1, γρ(Jω, θ)
)∣∣∣Ft] , (63)
M(2,0)t+1 , g1
(Jω(zt+1),zt+1, γρ(Jω, θ)
)−E
[g1
(Jω(zt+1),zt+1, γρ(Jω, θ)
)∣∣∣Ft]−ξ
(0)t g0
(Jω(zt+1), γρ(Jω, θ)
)+E
[ξ
(0)t g0
(Jω(zt+1), γρ(Jω, θ)
)∣∣∣Ft] and zt+1 ∼ fθ(·).
Since zt+1 is independent of the σ-field Ft, the function h(2,0)(·) in equation (63) can be rewritten as
h(2,0)(x) =−Eθ[xg0
(Jω(z), γρ(Jω(z), θ)
)]+Eθ
[g1
(Jω(z),z, γρ(Jω, θ)
)], where z∼ fθ(·).
It is easy to verify that M(2,0)t , t ∈ Z+ is a martingale difference sequence, i.e., M(2,0)
t is Ft-measurable,
integrable and E[M(2,0)t+1 |Ft] = 0 a.s., ∀t ∈ Z+. It is also easy to verify that h(2,0)(·) is Lipschitz continuous.
Also since S(·) is bounded above and fθ(·) has finite first and second moments we have almost surely,
E[‖M(2,0)
t+1 ‖2|Ft]≤K2,0(1 + ‖ξ(0)
t ‖2),∀t≥ 0, for some 0<K2,0 <∞.
Now consider the ODE
d
dtξ(0)(t) = h(2,0)(ξ(0)(t)). (64)
We may rewrite the above ODE as,
d
dtξ(0)(t) =Aξ(0)(t) + b(0),
where A is a diagonal matrix with Aii =−Eθ[g0(Jω(z), γρ(Jω, θ))
], 0≤ i < k and
b(0) = Eθ[g1(Jω(z),z, γρ(Jω, θ))
]. Now consider the ODE in the ∞-system d
dtξ(0)(t) =

29
limη→∞h(2,0)(ηξ(0)(t))
η= Aξ(0)(t). Since the matrix A has the same value for all the diagonal elements,
A has only one eigenvalue: λ(A) = −Eθ[g0(Jω(z), γρ(Jω, θ))
]with multiplicity k. Also observe that
λ(A)< 0. Hence the ODE (64) is globally asymptotically stable to the origin. Using Theorem 7, Chapter 3
of [28], the iterates {ξ(0)t }t∈Z+
are stable a.s., i.e., supt∈Z+‖ξ(0)t ‖<∞ a.s.
Again, by using the earlier argument that the eigenvalues λ(A) of A are negative and identical, the
point −A−1b(0) can be seen to be a globally asymptotically stable equilibrium of the ODE (64). By using
Corollary 4, Chapter 2 of [28], we can conclude that
limt→∞
ξ(0)t =−A−1b(0)a.s. =
Eθ
[g1(Jω(z),z, γρ(Jω, θ))
]Eθ
[g0(Jω(z), γρ(Jω, θ))
] a.s.
(ii) We recall first the matrix recursion (45) below:
ξ(1)t+1 = ξ
(1)t +βt+1
(g2(J (ωt,zt+1),zt+1, γt, ξ
(0)t )− ξ(1)
t g0
(J (ωt,zt+1), γt
)). (65)
As in the earlier proof, we also assume ωt = ω and θt = θ. Also note that ξ(1)t , ξ(0)
t and γt are on the
same timescale. However, the recursion of γt proceeds independently and in particular does not depend
on ξ(0)t and ξ(1)
t . Also, there is a unilateral coupling of ξ(1)t on ξ(0)
t and γt, but not the other way. Hence,
while analyzing (61), one may replace γt and ξ(0)t in equation (61) with their limit points γρ(Jω, θ) and ξ(0)
∗
respectively and a decaying bias term o(1). Now, by considering all the above observations, we rewrite the
equation (65) as,
ξ(1)t+1 = ξ
(1)t +βt+1
(h(2,1)(ξ
(1)t ) +M(2,1)
t+1 + o(1)), (66)
where h(2,1)(x),E[g2
(Jω(zt+1),zt+1, γρ(Jω, θ), ξ(0)
∗
)∣∣∣Ft]−E[xg0
(Jω(zt+1), γρ(Jω, θ)
)∣∣∣Ft] (67)
and M(2,1)t+1 ,E
[ξ
(1)t g0
(Jω(zt+1), γρ(Jω(θ)
)∣∣∣Ft]− ξ(1)t g0
(Jω(zt+1), γρ(Jω(θ)
)−
E[g2
(Jω(zt+1),zt+1, γρ(Jω, θ), ξ(0)
∗
)∣∣∣Ft]+g2
(Jω(zt+1),zt+1, γρ(Jω, θ), ξ(0)
∗
),
where zt+1 ∼ fθ(·).
(68)
Since zt+1 is independent of the σ-field Ft, the function h(2,1)(·) in equation (67) can be rewritten as
h(2,1)(x) =Eθ[g2
(Jω(z),z, γρ(Jω, θ), ξ(0)
∗
)]−Eθ
[xg0
(Jω(z), γρ(Jω, θ)
)], where z∼ fθ(·). (69)

30
It is not difficult to verify that M(2,1)t+1 , t ∈ Z+ is a martingale difference noise sequence and h(2,1)(·) is
Lipschitz continuous. Also since S(·) is bounded and fθ(·) has finite first and second moments we get,
E[‖M(2,1)
t+1 ‖2|Ft]≤K2,1(1 + ‖ξ(1)
t ‖2),∀t∈Z+, for some 0<K2,1 <∞.
Now consider the ODE given by
d
dtξ(1)(t) = h(2,1)(ξ(1)(t)), t∈R+. (70)
By rewriting the above equation we get,
d
dtξ(1)(t) =Aξ(1)(t) + b(1), t∈R+,
where A is a diagonal matrix as before, i.e., Aii = −Eθ[g0(Jω(z), γρ(Jω, θ)
], ∀i,0 ≤ i < k
and b(1) = Eθ[g2(Jω(z),z, γρ(Jω, θ), ξ(0)
∗ )]. Now consider the ODE in the ∞-system d
dtξ(1)(t) =
limη→∞1ηh(2,1)(ηξ(1)(t)) =Aξ(1)(t). Again, the eigenvalue λ(A) =−Eθ
[g0(Jω(z), γρ(Jω, θ)
]ofA is neg-
ative and is of multiplicity k and hence origin is the unique globally asymptotically stable equilibrium of the
∞-system. Therefore it follows that the iterates {ξ(1)t }t∈Z+
are almost surely stable, i.e., supt∈Z+‖ξ(0)t ‖<∞
a.s., see Theorem 7, Chapter 3 of [28].
Again, by using the earlier argument that the eigenvalues λ(A) of A are negative and identical, the point
−A−1b(1) can be seen to be a globally asymptotically stable equilibrium of the ODE (70). By Corollary 4,
Chapter 2 of [28], it follows that
limt→∞
ξ(1)t =−A−1b(1) a.s.=
Eθ[g2(Jω(z),z, γρ(Jω, θ), ξ(0)
∗ )]
Eθ[g0(Jω(z), γρ(Jω, θ)
] a.s.
(iii) Here also we assume ωt = ω. Then γt in recursion (43) and γpt in recursion (46) converge to γρ(Jω, θ)
and γρ(Jω, θp) respectively. So if γρ(Jω, θ)> γρ(Jω, θp), then γt > γpt eventually, i.e., γt > γpt for all but
finitely many t. So almost surely Tt in equation (47) will converge to E[I{γt>γpt }− I{γt≤γpt }
]= P{γt >
γpt }−P{γt ≤ γpt }= 1− 0 = 1. �
Notation: For the subsequence {t(n)}n>0 of {t}t≥0, we denote t−(n) , t(n)− 1 for n> 0.
As mentioned earlier, θt is updated only along a subsequence {t(n)}n≥0 of {t}t≥0 with t0 = 0 as follows:
θt(n+1)= θt(n) +αt(n+1)
((ξ
(0)
t−(n+1)
, ξ(1)
t−(n+1)
)>− θt(n)). (71)

31
Now define Ψ(ω, θ) = (Ψ1(ω, θ),Ψ2(ω, θ))>, where
Ψ1(ω, θ),Eθ[g1(Jω(z),z, γρ(Jω, θ)
]Eθ[g0(Jω(z), γρ(Jω, θ)
] , (72)
Ψ2(ω, θ),Eθ[g2
(Jω(z),z, γρ(Jω, θ),Ψ1(ω, θ)
)]Eθ[g0
(Jω(z), γρ(Jω, θ)
)] . (73)
We now state our main theorem. The theorem states that the model sequence {θt} generated by Algorithm
2 converges to θ∗ = (z∗,0k×k)>, which is the degenerate distribution concentrated at z∗.
THEOREM 2. Let S(z) = exp(rz), r ∈ R+. Let ρ ∈ (0,1), λ ∈ (0,1) and λ > ρ. Let θ0 = (µ0, qIk×k)>,
where q ∈ R+. Let the step-size sequences αt, βt, t ∈ Z+ satisfy (39). Also let ct → 0. Suppose {θt =
(µt,Σt)>}t∈Z+
is the sequence generated by Algorithm 2 and assume θt ∈ int(Θ), ∀t ∈ Z+. Also, let the
assumptions (A1), (A2), (A3) and (A4) hold. Further, we assume that there exists a continuously differen-
tiable function V : Θ→ R+ s.t. ∇V >(θ)Ψ(ω∗, θ)< 0, ∀θ ∈Θr {θ∗} and ∇V >(θ∗)Ψ(ω∗, θ∗) = 0. Then,
there exists q∗ ∈R+, r∗ ∈R+ and ρ∗ ∈ (0,1) s.t. ∀q > q∗, ∀r > r∗ and ∀ρ< ρ∗,
limt→∞J (ωt, µt) =J ∗ and lim
t→∞θt = θ∗ = (z∗,0k×k)
> almost surely,
where J ∗ and z∗ are defined in (26). Further, since J = −MSPBE, the algorithm SCE-MSPBEM con-
verges to the global minimum of MSPBE a.s.
Proof: Rewriting the equation (48) along the subsequence {t(n)}n∈Z+, we have for n∈Z+,
θt(n+1)= θt(n) +αt(n+1)
((ξ
(0)
t−(n+1)
, ξ(1)
t−(n+1)
)>− θt(n)). (74)
The iterates θt(n) are stable, i.e., supn ‖θt(n)‖ <∞ a.s. It is directly implied from the assumptions that
θt(n) ∈ int(Θ) and Θ is a compact set.
Rearranging the equation (74) we get, for n∈Z+,
θt(n+1)= θt(n) +αt(n+1)
(Ψ(ω∗, θt(n)) + o(1)
). (75)
This easily follows from the fact that, for t(n) < t≤ t(n+1), the random variables ξ(0)t and ξ(1)
t estimates the
quantities Ψ1(ωt(n) , θt(n)) and Ψ2(ωt(n) , θt(n)) respectively. Since ct→ 0, the estimation error decays to 0.

32
Hence the term o(1).
The limit points of the above recursion are the roots of Ψ. Hence by equating Ψ1(ω∗, θ) to 0k×1, we get,
µ=Eθ[g1
(J (z),z, γρ(J , θ)
)]Eθ[g0
(J (z), γρ(J , θ)
)] . (76)
Equating Ψ2(ω∗, θ) to O (= 0k×k), we get,
Eθ[g2
(J (z),z, γρ(J , θ), µ
)]Eθ[g0
(J (z), γρ(J , θ)
)] −Σ =O. (77)
For brevity, we define
γ∗ρ(θ), γρ(J , θ), g0(z, θ), g0
(J (z), γ∗ρ(θ)
)and L(θ),Eθ [g0(z, θ)] . (78)
Substituting the expression for µ from (76) in (77) and after further simplification we get,
(1/L(θ))Eθ[g0(z, θ)zz>
]−µµ>−Σ =O.
Since Σ =Eθ [zz>]−µµ>, the above equation implies
(1/L(θ))Eθ[g0(z, θ)zz>
]−Eθ
[zz>
]=O
=⇒1 Eθ[g0(z, θ)zz>
]−L(θ)Eθ
[zz>
]=O,
=⇒2 (1−λ)Eθ[g0(z, θ)zz>
]+λEθ0
[g0(z, θ)zz>
]−L(θ)Eθ
[zz>
]=O
=⇒3 (1−λ)Eθ[g0(z, θ)zz>
]+λEθ0
[g0(z, θ)zz>
]− (1−λ)Eθ
[g0(z, θ)
]Eθ[zz>
]−
λEθ0[g0(z, θ)
]Eθ[zz>
]=O
=⇒4 (1−λ)Eθ[(
g0(z, θ)−Eθ[g0(z, θ)
])zz>
]+λEθ0
[(g0(z, θ)−Eθ0
[g0(z, θ)
])zz>
]+
−λ(Eθ[zz>
]−Eθ0
[zz>
])Eθ0[g0(z, θ)
]=O
=⇒5 (1−λ)Σ2Eθ[∇2zg0(z, θ)
]+λΣ2
0Eθ0[∇2zg0(z, θ)
]+
λ(Eθ[zz>
]−Eθ0
[zz>
])Eθ0[g0(z, θ)
]=O
=⇒6 (1−λ)Σ2Eθ[∇2zg0(z, θ)
]+λq2Eθ0
[∇2zg0(z, θ)
]+
λ(Eθ[zz>
]−Eθ0
[zz>
])Eθ0[g0(z, θ)
]=O

33
=⇒8 (1−λ)Σ2Eθ[S(J (z))Gr(z)I{J (z)≥γ∗ρ(θ)}
]+λq2Eθ0
[S(J (z))Gr(z)I{J (z)≥γ∗ρ(θ)}
]+
λ(Eθ[zz>
]−Eθ0
[zz>
])Eθ0[g0(z, θ)
]=O,
(79)
where Gr(z), r2∇J (z)∇J (z)>+ r∇2J (z). Note that =⇒5 follows from “integration by parts” rule for
multivariate Gaussian and =⇒8 follows from the assumption S(z) = exp(rz). Note that for each z ∈ Z ,
Gr(z)∈Rk×k. Hence we denote Gr(z) as[Grij(z)
]i=k,j=ki=1,j=1
. For brevity, we also define
F r,ρ(z, θ), S(J (z))Gr(z)I{J (z)≥γ∗ρ(θ)}, (80)
where F r,ρ(z, θ)∈Rk×k which is also denoted as[F r,ρij (z)
]i=k,j=ki=1,j=1
.
Hence equation (79) becomes,
(1−λ)Σ2Eθ[F r,ρ(z, θ)
]+λq2Eθ0
[F r,ρ(z, θ)
]+λ
(Eθ[zz>
]−Eθ0
[zz>
])Eθ0[g0(z, θ)
]=O. (81)
Note that (∇iJ )2 ≥ 0. Hence we can find a r∗ ∈ R+ s.t. Grii(z) > 0, ∀r > r∗, 1 ≤ i ≤ k, ∀z ∈ Z . This
further implies that Eθ[F r,ρii (z, θ] > 0, ∀θ ∈ Θ. Also since Z is compact and J is continuous, we have
J(z)>B1 >−∞, ∀z ∈Z . Hence we obtain the following bound:
(Eθ[z2i
]−Eθ0
[z2i
])Eθ0[g0(z, θ)
]>ρK3S(B1), where 0<K3 <∞. (82)
Now from (81) and (82), we can find a ρ∗ ∈ (0,1) and q∗ ∈R s.t. ∀ρ< ρ∗, ∀q > q∗, ∀r > r∗, we have,
(1−λ)Σ2Eθ[F r,ρii (z, θ)
]+λq2Eθ0
[F r,ρii (z, θ)
]+λ
(Eθ[z2i
]−Eθ0
[z2i
])Eθ0[g0(z, θ)
]> 0. (83)
This contradicts equation (81) for such a choice of ρ, q and r. This implies that each of the terms in equation
(81) is 0, i.e.,
Σ2Eθ[F r,ρ(z, θ)
]=O, (84)
q2Eθ0[F r,ρ(z, θ)
]=O and (85)(
Eθ[zz>
]−Eθ0
[zz>
])Eθ0[g0(z, θ)
]=O. (86)
It is easy to verify that Σ = O simultaneously satisfies (84), (85) and (86). Besides Σ = O is the only
solution for r > r∗. This is because we have already established earlier that ∀r > r∗, 1 ≤ i ≤ k, ∀z ∈ Z

34
Eθ[F r,ρii (z, θ] > 0, ∀θ ∈ Θ. This proves that for any z ∈ Z , the degenerate distribution concentrated on z
given by θz = (z,0k×k)> is a potential limit point of the recursion. From (85), we have
Eθ0[F r,ρ(z, θ)
]=O =⇒ γ∗ρ(θ) =J (z∗).
Claim A: The only degenerate distribution which satisfies the above condition is θ∗ = (z∗,0k×k)>.
The above claim can be verified as follows: if there exists z′(∈ Z) 6= z∗ s.t. γ∗ρ(θz′) = J (z∗) is satisfied
(where θz′ represents the mixture distribution fθz′ ) , then from the definition of γ∗ρ(·) in (16) and (78), we
can find an increasing sequence {li}, where li >J(z′) s.t. the following property is satisfied:
limi→∞
li =J (z∗) and Pθ(J (z)≥ li)≥ ρ. (87)
But Pθz′ (J (z)≥ li) = (1− λ)Pθz′ (J (z)≥ li) + λPθ0(J (z)≥ li) and Pθz′ (J (z)≥ li) = 0, ∀i. Therefore
from (87), we get,
Pθz′ (J (z)≥ li)≥ ρ
⇒ (1−λ)Pθz′ (J (z)≥ li) +λPθ0(J (z)≥ li)≥ ρ
⇒ λPθ0(J (z)≥ li)≥ ρ
⇒ Pθ0(J (z)≥ li)≥ρ
λ< 1.
Recollect that li→J (z∗). Thus by the continuity of probability measures we get
0 = Pθ0(J (z)≥ J(z∗)) = limi→∞
Pθ0(J (z)≥ li)≥ρ
λ,
which is a contradiction. This proves the Claim A. Now the only remaining task is to prove θ∗ is a stable
attractor. This easily follows from the assumption regarding the existence of the Lyapunov function V in
the statement of the theorem. �
3.1. Computational Complexity
The computational load of this algorithm is Θ(k2) per iteration which comes from (41). Least squares al-
gorithms like LSTD and LSPE also require Θ(k2) per iteration. However, LSTD requires an extra operation
of inverting the k× k matrix AT which requires an extra computational effort of Θ(k3). (Note that LSPE

35
also requires a k× k matrix inversion). This makes the overall complexity of LSTD and LSPE to be Θ(k3).
Further in some cases the matrix AT may not be invertible. In that case, the pseudo inverse of AT needs
to be obtained in LSTD, LSPE which is computationally even more expensive. Our algorithm does not
require such an inversion procedure. Also even though the complexity of the first order temporal difference
algorithms such as TD(λ) and GTD2 is Θ(k), the approximations they produced in the experiments we con-
ducted turned out to be inferior to ours and also showed a slower rate of convergence than our algorithm.
Another noteworthy characteristic exhibited by our algorithm is stability. Recall that the convergence of
TD(0) is guaranteed by the requirements that the Markov Chain of Pπ should be ergodic and the sampling
distribution ν to be its stationary distribution. The classic example of Baird’s 7-star [10] violates those re-
strictions and hence TD(0) is seen to diverge. However, our algorithm does not impose such restrictions and
shows stable behaviour even in non-ergodic off policy cases such as the Baird’s example.
4. Experimental Results
We present here a numerical comparison of SCE-MSPBEM with various state-of-the-art algorithms in the
literature on some benchmark Reinforcement Learning problems. In each of the experiments, a random
trajectory {(st, rt, s′t)}∞t=0 is chosen and all the algorithms are updated using it. Each st in {(st, rt, s′t), t≥ 0}
is sampled using an arbitrary distribution ν over S. The algorithms are run on multiple trajectories and the
average of the results obtained are plotted. The x-axis in the plots is t/1000, where t is the iteration number.
In each case, the learning rates αt, βt are chosen so that the condition (39) is satisfied. The function S(·) is
chosen as S(x) = exp(rx), where r ∈R is chosen appropriately.
SCE-MSPBEM was tested on the following benchmark problems:
1. Linearized Cart-Pole Balancing [14]
2. 5-Link Actuated Pendulum Balancing [14]
3. Baird’s 7-Star MDP [10]
4. 10-state Ring MDP [33]
5. Large state space and action space with Radial Basis Functions
6. Large state space and action space with Fourier Basis Functions [5]

36
4.1. Experiment 1: Linearized Cart-Pole Balancing [14]
Setup: A pole with mass m and length l is connected to a cart of mass M . It can rotate 360◦ and the cart
is free to move in either direction within the bounds of a linear track.
Goal: To balance the pole upright and the cart at the centre of the track.
State space: The 4-tuple [x, x,ψ, ψ] where ψ is the angle of the pendulum w.r.t. the vertical axis, ψ is the
angular velocity, x the relative cart position from the centre of the track and x is its velocity.
Control space: The controller applies a horizontal force a on the cart parallel to the track. The stochastic
policy used in this setting corresponds to π(a|s) =N (a|β>1 s,σ21).
System dynamics: The dynamical equations of the system are given by
ψ=−3mlψ2 sinψ cosψ+ (6M +m)g sinψ− 6(a− bψ) cosψ
4l(M +m)− 3ml cosψ, (88)
x=−2mlψ2 sinψ+ 3mg sinψ cosψ+ 4a− 4bψ
4(M +m)− 3m cosψ. (89)
By making further assumptions on the initial conditions, the system dynamics can be approximated accu-
rately by the linear system
xt+1
xt+1
ψt+1
ψt+1
=
xt
xt
ψt
ψt
+ ∆t
ψt
3(M+m)ψt−3a+3bψt4Ml−ml
xt
3mgψt+4a−4bψt4M−m
+
0
0
0
z
, (90)
where ∆t is the integration time step, i.e., the time difference between two transitions and z is a Gaussian
noise on the velocity of the cart with standard deviation σ2.
Reward function: R(s, a) = R(ψ, ψ, x, x, a) =−100ψ2−x2− 110a2.
Feature vectors: φ(s∈R4) = (1, s21, s
22 . . . , s1s2, s1s3, . . . , s3s4)> ∈R11.
Evaluation policy: The policy evaluated in the experiment is the optimal policy π∗(a|s) =N (a|β∗1>s,σ∗12).
The parameters β∗1 and σ∗1 are computed using dynamic programming. The feature set chosen above is a
perfect feature set, i.e., V π∗ ∈ {Φz|z ∈ Rk}. The table of the various parameter values we used in our

37
x
ψ
aM
y
x
g
m
l
Figure 4 The Cart-Pole System. The goal is to keep the pole in the upright position and the cart at the center of the track by
pushing the cart with a force a either to the left or the right. The system is parameterized by the position x of the cart,
the angle of the pole ψ, the velocity x and the angular velocity ψ.
experiment is given below.
Gravitational acceleration (g) 9.8ms2
Mass of the pole (m) 0.5kg
Mass of the cart (M ) 0.5kg
Length of the pole (l) 0.6m
Friction coefficient (b) 0.1N(ms)−1
Integration time step (∆t) 0.1s
Standard deviation of z (σ2) 0.01
Discount factor (γ) 0.95
αt t−1.0
βt t−0.6
ct 0.01
ε1 0.95
The results of the experiments are shown in Figure 5.
4.2. Experiment 2: 5-Link Actuated Pendulum Balancing [14]
Setup: 5 independent poles each with mass m and length l with the top pole being a pendulum connected
using 5 rotational joints.
Goal: To keep all the poles in the upright position by applying independent torques at each joint.
State space: The state s= (q, q)> ∈R10 where q= (ψ1,ψ2,ψ3,ψ4,ψ5)∈R5 and q= (ψ1, ψ2, ψ3, ψ4, ψ5)∈
R5 where ψi is the angle of the pole i w.r.t. the vertical axis and ψi is the angular velocity.
Control space: The action a = (a1, a2, . . . , a5)> ∈ R5 where ai is the torque applied to the joint i. The

38
0 20 40 60 80 100
0
200
400
600
800
1000‖Σt‖
(a) ‖Σt‖F (where ‖ · ‖F is the Frobenius norm)
0 20 40 60 80 100−60
−50
−40
−30
−20
−10
0
γt
(b) γ∗t
0 100 200 300 400 500 600 700 800
−1.0
−0.5
0.0
0.5
1.0 0.95
Tt
(c) Tt
0 20 40 60 80 100
0
5
10
15
20
25
30
√MSPBE
(d)√
MSPBE(µt)
Figure 5 The Cart-Pole setting. The evolutionary trajectory of the variables ‖Σt‖F (where ‖ · ‖F is the Frobenius norm), γ∗t ,
Tt and√
MSPBE(µt). Note that both γ∗t and√
MSPBE(µt) converge to 0 as t→∞, while ‖Σt‖F also converges
to 0. This implies that the model θt = (µt, Σt)> converges to the degenerate distribution concentrated on z∗. The
evolutionary track of Tt shows that Tt does not cross the ε1 = 0.95 line after the model θt = (µt, Σt)> reaches a
close neighbourhood of its limit.
stochastic policy used in this setting corresponds to π(a|s) =N (a|β>1 s,σ21).

39
System dynamics: The approximate linear system dynamics is given by
qt+1
qt+1
=
I ∆t I
−∆t M−1U I
qtqt
+ ∆t
0
M−1
a+ z (91)
where ∆t is the integration time step, i.e., the time difference between two transitions,M is the mass matrix
in the upright position whereMij = l2(6−max(i, j))m andU is a diagonal matrix withUii =−gl(6−i)m.
Each component of z is a Gaussian noise.
ψ1
ψ2
ψ3
a1
a2
a3
g
x
y
Figure 6 3-link actuated pendulum setting. Each rotational joint i, 1≤ i≤ 3 is actuated by a torque ai . The system is parame-
terized by the angle ψi against the vertical direction and the angular velocity ψi. The goal is to balance the pole in the
upright direction, i.e., all ψi should be as close to 0 as possible.
Reward function: R(q, q, a) =−q>q.
Feature vectors: φ(s∈R10) = (1, s21, s
22 . . . , s1s2, s1s3, . . . , s9s10)> ∈R46.
Evaluation policy: The policy evaluated in the experiment is the optimal policy π∗(a|s) =N (a|β∗1>s,σ∗12).
The parameters β∗1 and σ∗1 are computed using dynamic programming. The feature set chosen above is a
perfect feature set, i.e., V π∗ ∈ {Φz|z ∈Rk}.

40
The table of the various parameter values we used in our experiment is given below. Note that we have
used constant step-sizes in this experiment.
Gravitational acceleration (g) 9.8ms2
Mass of the pole (m) 1.0kg
Length of the pole (l) 1.0m
Integration time step (∆t) 0.1s
Discount factor (γ) 0.95
αt 0.001
βt 0.05
ct 0.05
ε1 0.95
The results of the experiment are shown in Figure 7.
0 5 10 15 20 25
Time
0
50
100
150
200
√ MSE
TDLSTDSCE-MSPBE
(a)√
MSPBE(µt)
0 5 10 15 20 25
Time
0
50
100
150
200
√ MSE
TDLSTDSCE-MSPBE
(b)√
MSE(µt)
Figure 7 5-link actuated pendulum setting. The respective trajectories of the√
MSPBE and√
MSE generated by TD(0),
LSTD(0) and SCE-MSPBEM algorithms are plotted. The graph on the left is for√
MSPBE , while on the right is
that of√
MSE. Note that√
MSE also converges to 0 since the feature set is perfect.
4.3. Experiment 3: Baird’s 7-Star MDP [10]
Our algorithm was also tested on Baird’s star problem [10] with |S|= 7, |A|= 2 and k= 8. We let ν be the
uniform distribution over S and the feature matrix Φ and the transition matrix Pπ are given by

41
Φ =
1 2 0 0 0 0 0 0
1 0 2 0 0 0 0 0
1 0 0 2 0 0 0 0
1 0 0 0 2 0 0 0
1 0 0 0 0 2 0 0
1 0 0 0 0 0 2 0
2 0 0 0 0 0 0 1
Pπ =
0 0 0 0 0 0 1
0 0 0 0 0 0 1
0 0 0 0 0 0 1
0 0 0 0 0 0 1
0 0 0 0 0 0 1
0 0 0 0 0 0 1
0 0 0 0 0 0 1
.
The reward function is given by R(s, s′) = 0, ∀s, s′ ∈ S. The Markov Chain in this case is not ergodic and
hence belongs to an off-policy setting. This is a classic example where TD(0) is seen to diverge [10]. The
performance comparison of the algorithms GTD2, TD(0) and LSTD(0) with SCE-MSPBEM is shown in
Figure 9. The performance metric used here is the√MSE(·) of the prediction vector returned by the
corresponding algorithm at time t. The algorithm parameters for the problem are given below:
1
2
3
4
5
6
7
Figure 8: Baird’s 7-star MDP
αt 0.001
βt 0.05
ct 0.01
ε1 0.8
A careful analysis in [34] has shown that when the discount factor γ ≤ 0.88, with appropriate learning
rate, TD(0) converges. Nonetheless, it is also shown in the same paper that for discount factor γ = 0.9,
TD(0) will diverge for all values of the learning rate. This is explicitly demonstrated in Figure 9. However
our algorithm SCE-MSPBEM converges in both cases, which demonstrates the stable behaviour exhibited
by our algorithm.
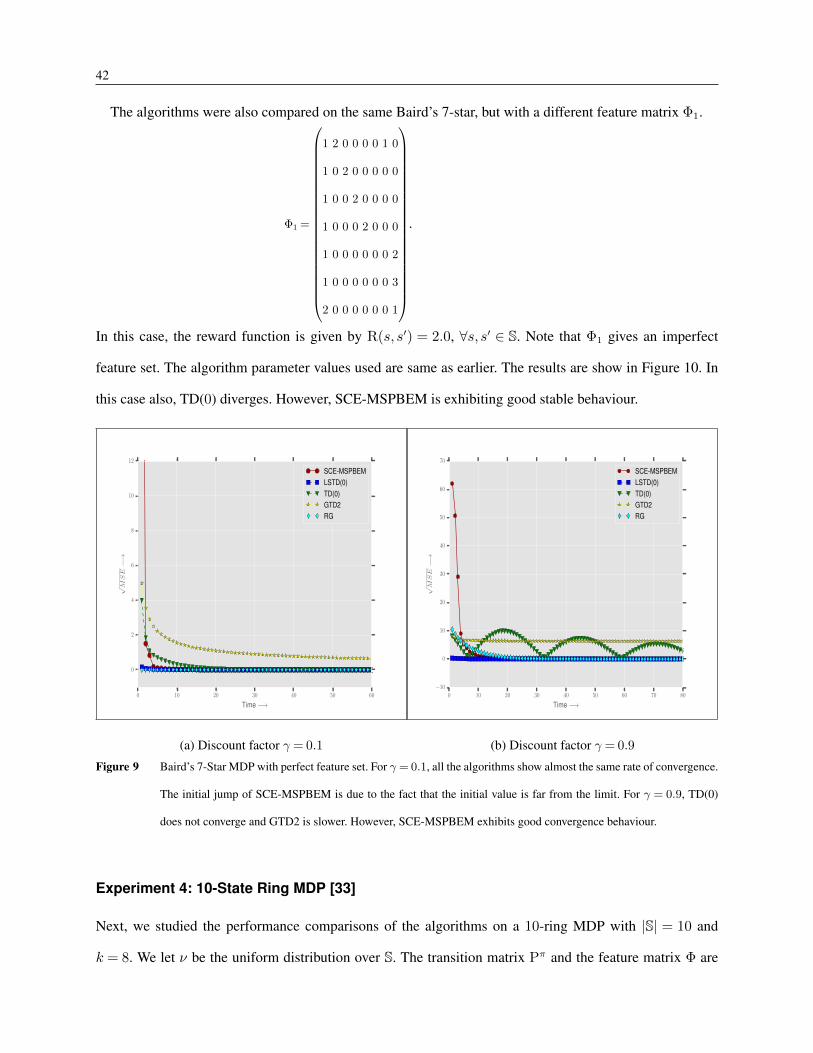
42
The algorithms were also compared on the same Baird’s 7-star, but with a different feature matrix Φ1.
Φ1 =
1 2 0 0 0 0 1 0
1 0 2 0 0 0 0 0
1 0 0 2 0 0 0 0
1 0 0 0 2 0 0 0
1 0 0 0 0 0 0 2
1 0 0 0 0 0 0 3
2 0 0 0 0 0 0 1
.
In this case, the reward function is given by R(s, s′) = 2.0, ∀s, s′ ∈ S. Note that Φ1 gives an imperfect
feature set. The algorithm parameter values used are same as earlier. The results are show in Figure 10. In
this case also, TD(0) diverges. However, SCE-MSPBEM is exhibiting good stable behaviour.
0 10 20 30 40 50 60
Time −→
0
2
4
6
8
10
12
√MSE−→
SCE-MSPBEMLSTD(0)TD(0)GTD2RG
(a) Discount factor γ = 0.1
0 10 20 30 40 50 60 70 80
Time −→
−10
0
10
20
30
40
50
60
70
√MSE−→
SCE-MSPBEMLSTD(0)TD(0)GTD2RG
(b) Discount factor γ = 0.9
Figure 9 Baird’s 7-Star MDP with perfect feature set. For γ = 0.1, all the algorithms show almost the same rate of convergence.
The initial jump of SCE-MSPBEM is due to the fact that the initial value is far from the limit. For γ = 0.9, TD(0)
does not converge and GTD2 is slower. However, SCE-MSPBEM exhibits good convergence behaviour.
Experiment 4: 10-State Ring MDP [33]
Next, we studied the performance comparisons of the algorithms on a 10-ring MDP with |S| = 10 and
k = 8. We let ν be the uniform distribution over S. The transition matrix Pπ and the feature matrix Φ are

43
0 20 40 60 80 100 120
Time −→
0
20
40
60
80
100
120
140
160
√MSE−→
SCE-MSPBEMLSTD(0)TD(0)GTD2RG
(a)√
MSE.
0 20 40 60 80 100 120 140 160
Time −→
0
10
20
30
40
50
60
70
√MSPBE−→
SCE-MSPBEM
(b)√
MSPBE.
Figure 10 Baird’s 7-Star MDP with imperfect feature set. Here the discount factor γ = 0.99. In this case, TD(0) method
diverges. However,√
MSE of SCE-MSPBEM and LSTD(0) converge to the same limit point (=103.0), while RG
converges to a different limit (= 1.6919). This is because the feature set is imperfect and also due to the fact that
RG minimizes MSBR, while SCE-MSPBEM and LSTD minimize MSPBE. To verify this fact, note that in (b),√MSPBE(µt) of SCE-MSPBEM converges to 0.
given by
Pπ =
0 1 0 0 0 0 0 0 0 0
0 0 1 0 0 0 0 0 0 0
0 0 0 1 0 0 0 0 0 0
0 0 0 0 1 0 0 0 0 0
0 0 0 0 0 1 0 0 0 0
0 0 0 0 0 0 1 0 0 0
0 0 0 0 0 0 0 1 0 0
0 0 0 0 0 0 0 0 1 0
0 0 0 0 0 0 0 0 0 1
1 0 0 0 0 0 0 0 0 0
, Φ =
1 0 0 0 0 0 0 00 1 0 0 0 0 0 00 0 1 0 0 0 0 00 0 0 1 0 0 0 00 0 0 0 1 0 0 00 0 0 0 0 1 0 00 0 0 0 0 0 1 00 0 0 0 0 0 0 10 0 0 0 0 0 0 10 0 0 0 0 1 0 0
.
1
2
3
4
56
7
8
9
10
Figure 11: 10-Ring MDP
The reward function is R(s, s′) = 1.0,∀s, s′ ∈ S. The performance comparisons of the algorithms GTD2,
TD(0) and LSTD(0) with SCE-MSPBEM are shown in Figure 12. The performance metric used here is the√MSE(·) of the prediction vector returned by the corresponding algorithm at time t.

44
The algorithm parameters for the problem are as follows:αt 0.001
βt 0.05
ct 0.075
ε1 0.85
0 10 20 30 40 50 60 70
Time −→
0
20
40
60
80
100
120
140
√MSE−→
SCE-MSPBEMLSTD(0)TD(0)GTD2RG
(a) Discount factor γ = 0.99
0 10 20 30 40 50 60 70 80
Time −→
0
20
40
60
80
100
120
140
√MSE−→
SCE-MSPBEMLSTD(0)TD(0)GTD2RG
(b) Discount factor γ = 0.1
Figure 12 10-Ring MDP with perfect feature set: For γ = 0.1, all the algorithms exhibit almost the same rate of convergence.
For γ = 0.99, SCE-MSPBEM converges faster than TD(0), GTD2 and RG.
4.4. Experiment 5: Large State Space Random MDP with Radial Basis Functions and
Fourier Basis
These experiments were designed by us. Here, tests were performed by varying the feature set to prove that
the algorithm is not dependent on any particular feature set. Two types of feature sets are used here: Fourier
Basis Functions and Radial Basis Functions (RBF).
Figure 13 shows the performance comparisons when Fourier Basis Functions are used for the features
{φi}ki=1, where
φi(s) =
1 if i= 1,
cos (i+1)πs
2if i is odd,
sin iπs2
if i is even.
(92)

45
Figure 14 shows the performance comparisons when RBF is used instead for the features {φi}ki=1, where
φi(s) = e− (s−mi)
2
2.0v2i (93)
with mi and vi fixed a priori.
In both the cases, the reward function is given by
R(s, s′) =G(s)G(s′)
(1
(1.0 + s′)0.25
), ∀s, s′ ∈ S, (94)
where the vector G∈ (0,1)|S| is initialized for the algorithm with G(s)∼U(0,1),∀s∈ S.
Also in both the cases, the transition probability matrix Pπ is generated as follows
Pπ(s, s′) =
(|S|s′
)b(s)s
′(1.0− b(s))|S|−s′ , ∀s, s′ ∈ S, (95)
where the vector b ∈ (0,1)|S| is initialized for the algorithm with b(s)∼U(0,1),∀s ∈ S. It is easy to verify
that the Markov Chain defined by Pπ is ergodic in nature.
In the case of RBF, we have set |S|= 1000, |A|= 200, k= 50,mi = 10+20(i−1) and vi = 10, while for
Fourier Basis Functions, |S|= 1000, |A|= 200, k= 50. In both the cases, the distribution ν is the stationary
distribution of the Markov Chain. The simulation is run sufficiently long to ensure that the chain achieves
its steady state behaviour, i.e., the states appear with the stationary distribution.
The algorithm parameters for the problem are as follows:Both RBF & Fourier Basis
αt 0.001
βt 0.05
ct 0.075
ε1 0.85
Also note that when Fourier basis is used, the discount factor γ = 0.9 and for RBFs, γ = 0.01. SCE-
MSPBEM exhibits good convergence behaviour in both cases, which shows the non-dependence of SCE-
MSPBEM on the discount factor γ. This is important because in [35], the performance of TD methods is
shown to be dependent on the discount factor γ.
To get a measure of how well our algorithm performs on much larger problems, we applied it on a large
MDP where |S|= 215, |A|= 50, k= 100 and γ = 0.9. The reward function R and the transition probability

46
0 10 20 30 40 50
Time −→
0
10
20
30
40
50
60
70
√ MSE−→
SCE-MSPBEMLSTD(0)LSPE(0)TD(0)GTD2RG
Figure 13 Fourier Basis Function: Here, |S|= 1000, |A|= 200, k= 50 and γ = 0.9. In this case, SCE-MSPBEM shows good
convergence behaviour.
0 20 40 60 80 100 120
20
30
40
50
60
√MSE
SCE-MSPBEMLSTD(0)TD(0)GTD2LSPE(0)
Figure 14 Radial Basis Function. Here, |S|= 1000, |A|= 200, k = 50 and γ = 0.01. In this case, SCE-MSPBEM converges
to the same limit point as other algorithms.

47
matrix Pπ are generated using the equations (94) and (95) respectively. RBFs are used as the features in this
case. Since the MDP is huge, the algorithms were run on Amazon cloud servers. The true value function
V π was computed and the√MSEs of the prediction vectors generated by the different algorithms were
compared. The performance results are shown in Table 2.
Ex# SCE-MSPBEM LSTD(0) TD(0) RLSTD(0) LSPE(0) GTD2
1 23.3393204 23.3393204 24.581849219 23.3393204 23.354929410 24.93208571
2 23.1428622 23.1428622 24.372033722 23.1428622 23.178814326 24.75593565
3 23.3327844 23.3327848 24.537556372 23.3327848 23.446585398 24.88119648
4 22.9786909 22.9786909 24.194543862 22.9786909 22.987520761 24.53206023
5 22.9502660 22.9502660 24.203561613 22.9502660 22.965571900 24.55473382
6 23.0609354 23.0609354 24.253239213 23.0609354 23.084399716 24.60783237
7 23.2280270 23.2280270 24.481937450 23.2280270 23.244345617 24.83529005
Table 2 Performance comparison of various algorithms with large state space. Here |S|= 215, |A|= 50, k= 100, and γ = 0.9.
RBF is used as the feature set. The feature set is imperfect. The entries in the table correspond to the√
MSE values obtained from
the respective algorithms on 7 different random MDPs. While the entries of SCE-MSPBEM, LSTD(0) and RLSTD(0) appear to
be similar, they actually differed in decimal digits that are not shown here for lack of space.
5. Conclusion and Future Work
We proposed, for the first time, an application of the Cross Entropy (CE) method to the problem of pre-
diction in Reinforcement Learning (RL) under the linear function approximation architecture. This task
is accomplished by remodelling the original CE algorithm as a multi-timescale stochastic approximation
algorithm and using it to minimize the Mean Squared Projected Bellman Error (MSPBE). The proof of
convergence to the optimum value using the ODE method is also provided. The theoretical analysis is sup-
plemented by extensive experimental evaluation which is shown to corroborate the claim. Experimental
comparisons with the state-of-the-art algorithms show the superiority in the accuracy of our algorithm while
being competitive enough with regard to computational efficiency and rate of convergence.

48
The algorithm can be extended to non-linear approximation settings also. In [36], a variant of the TD(0)
algorithm is developed and applied in the non-linear function approximation setting, where the convergence
to the local optima is proven. But we believe our approach can converge to the global optimum in the
non-linear case because of the application of a CE-based approach, thus providing a better approximation
to the value function. The algorithm can also be extended to the off-policy case [8, 9], where the sample
trajectories are developed using a behaviour policy which is different from the target policy whose value
function is approximated. This can be achieved by appropriately integrating a weighting ratio [37] in the
recursions. TD learning methods are shown to be divergent in the off-policy setting [10]. So it will be
interesting to see how our algorithm behaves in such a setting. Another future work includes extending
this optimization technique to the control problem to obtain an optimum policy. This can be achieved by
parametrizing the policy space and using the optimization technique in SCE-MSPBEM to search in this
parameter space.
References
[1] R. S. Sutton and A. G. Barto, Introduction to reinforcement learning. MIT Press, New York, USA, 1998.[2] D. J. White, “A survey of applications of Markov decision processes,” Journal of the Operational Research Society, pp. 1073–
1096, 1993.[3] D. P. Bertsekas, Dynamic programming and optimal control, vol. 2. Athena Scientific Belmont, USA, 2013.[4] M. G. Lagoudakis and R. Parr, “Least-squares policy iteration,” The Journal of Machine Learning Research, vol. 4, pp. 1107–
1149, 2003.[5] G. Konidaris, S. Osentoski, and P. S. Thomas, “Value Function Approximation in Reinforcement Learning Using the Fourier
Basis.,” in AAAI, 2011.[6] M. Eldracher, A. Staller, and R. Pompl, Function approximation with continuous valued activation functions in CMAC. Cite-
seer, 1994.[7] R. S. Sutton, “Learning to predict by the methods of temporal differences,” Machine learning, vol. 3, no. 1, pp. 9–44, 1988.[8] R. S. Sutton, H. R. Maei, and C. Szepesvari, “A convergent o(n) temporal-difference algorithm for off-policy learning with
linear function approximation,” in Advances in neural information processing systems, pp. 1609–1616, 2009.[9] R. S. Sutton, H. R. Maei, D. Precup, S. Bhatnagar, D. Silver, C. Szepesvari, and E. Wiewiora, “Fast gradient-descent meth-
ods for temporal-difference learning with linear function approximation,” in Proceedings of the 26th Annual InternationalConference on Machine Learning, pp. 993–1000, ACM, 2009.
[10] L. Baird, “Residual algorithms: Reinforcement learning with function approximation,” in Proceedings of the twelfth interna-tional conference on machine learning, pp. 30–37, 1995.
[11] S. J. Bradtke and A. G. Barto, “Linear least-squares algorithms for temporal difference learning,” Machine Learning, vol. 22,no. 1-3, pp. 33–57, 1996.
[12] J. A. Boyan, “Technical update: Least-squares temporal difference learning,” Machine Learning, vol. 49, no. 2-3, pp. 233–246,2002.
[13] A. Nedic and D. P. Bertsekas, “Least squares policy evaluation algorithms with linear function approximation,” Discrete EventDynamic Systems, vol. 13, no. 1-2, pp. 79–110, 2003.
[14] C. Dann, G. Neumann, and J. Peters, “Policy evaluation with temporal differences: A survey and comparison,” The Journalof Machine Learning Research, vol. 15, no. 1, pp. 809–883, 2014.
[15] J. N. Tsitsiklis and B. Van Roy, “An analysis of temporal-difference learning with function approximation,” Automatic Control,IEEE Transactions on, vol. 42, no. 5, pp. 674–690, 1997.
[16] R. J. Williams and L. C. Baird, “Tight performance bounds on greedy policies based on imperfect value functions,” tech. rep.,Citeseer, 1993.

49
[17] B. Scherrer, “Should one compute the Temporal Difference fix point or minimize the Bellman Residual? the unified obliqueprojection view,” in 27th International Conference on Machine Learning-ICML 2010, 2010.
[18] M. Zlochin, M. Birattari, N. Meuleau, and M. Dorigo, “Model-based search for combinatorial optimization: A critical survey,”Annals of Operations Research, vol. 131, no. 1-4, pp. 373–395, 2004.
[19] J. Hu, M. C. Fu, and S. I. Marcus, “A model reference adaptive search method for global optimization,” Operations Research,vol. 55, no. 3, pp. 549–568, 2007.
[20] E. Zhou, S. Bhatnagar, and X. Chen, “Simulation optimization via gradient-based stochastic search,” in Simulation Conference(WSC), 2014 Winter, pp. 3869–3879, IEEE, 2014.
[21] M. Dorigo and L. M. Gambardella, “Ant colony system: a cooperative learning approach to the traveling salesman problem,”Evolutionary Computation, IEEE Transactions on, vol. 1, no. 1, pp. 53–66, 1997.
[22] H. Muhlenbein and G. Paass, “From recombination of genes to the estimation of distributions i. binary parameters,” in ParallelProblem Solving from NaturePPSN IV, pp. 178–187, Springer, 1996.
[23] J. Hu, M. C. Fu, and S. I. Marcus, “A model reference adaptive search method for stochastic global optimization,” Communi-cations in Information & Systems, vol. 8, no. 3, pp. 245–276, 2008.
[24] I. Menache, S. Mannor, and N. Shimkin, “Basis function adaptation in temporal difference reinforcement learning,” Annals ofOperations Research, vol. 134, no. 1, pp. 215–238, 2005.
[25] R. Y. Rubinstein and D. P. Kroese, The cross-entropy method: a unified approach to combinatorial optimization, Monte-Carlosimulation and machine learning. Springer Science & Business Media, 2013.
[26] P.-T. De Boer, D. P. Kroese, S. Mannor, and R. Y. Rubinstein, “A tutorial on the cross-entropy method,” Annals of operationsresearch, vol. 134, no. 1, pp. 19–67, 2005.
[27] J. Hu and P. Hu, “On the performance of the cross-entropy method,” in Simulation Conference (WSC), Proceedings of the2009 Winter, pp. 459–468, IEEE, 2009.
[28] V. S. Borkar, “Stochastic approximation: A dynamical systems viewpoint,” Cambridge University Press, 2008.[29] H. J. Kushner and D. S. Clark, Stochastic approximation for constrained and unconstrained systems. Springer Verlag, New
York, 1978.[30] H. Robbins and S. Monro, “A stochastic approximation method,” The Annals of Mathematical Statistics, pp. 400–407, 1951.[31] T. Homem-de Mello, “A study on the cross-entropy method for rare-event probability estimation,” INFORMS Journal on
Computing, vol. 19, no. 3, pp. 381–394, 2007.[32] C. Kubrusly and J. Gravier, “Stochastic approximation algorithms and applications,” in 1973 IEEE Conference on Decision
and Control including the 12th Symposium on Adaptive Processes, no. 12, pp. 763–766, 1973.[33] B. Kveton, M. Hauskrecht, and C. Guestrin, “Solving factored mdps with hybrid state and action variables.,” J. Artif. Intell.
Res.(JAIR), vol. 27, pp. 153–201, 2006.[34] R. Schoknecht and A. Merke, “Convergent combinations of reinforcement learning with linear function approximation,” in
Advances in Neural Information Processing Systems, pp. 1579–1586, 2002.[35] R. Schoknecht and A. Merke, “TD(0) converges provably faster than the residual gradient algorithm,” in ICML, pp. 680–687,
2003.[36] H. R. Maei, C. Szepesvari, S. Bhatnagar, D. Precup, D. Silver, and R. S. Sutton, “Convergent temporal-difference learning
with arbitrary smooth function approximation,” in Advances in Neural Information Processing Systems, pp. 1204–1212, 2009.[37] P. W. Glynn and D. L. Iglehart, “Importance sampling for stochastic simulations,” Management Science, vol. 35, no. 11,
pp. 1367–1392, 1989.