a critical review of physical models in high temperature
TRANSCRIPT

Nishan JainDepartment of Aerospace Engineering,
University of Maryland,
College Park, MD 20742
e-mail: [email protected]
Alexandra Le MoineDepartment of Aerospace Engineering,
University of Maryland,
College Park, MD 20742
email: [email protected]
Geoffroy ChaussonnetInstitute of Thermal Turbomachinery,
Karlsruhe Institute of Technology,
Karlsruhe 76131, Germany
e-mail: [email protected]
Alison FlatauDepartment of Aerospace Engineering,
University of Maryland,
College Park, MD 20742
e-mail: [email protected]
Luis BravoVehicle Technology Directorate,
U.S. Army Research Laboratory,
Aberdeen Proving Ground, MD 21005
e-mail: [email protected]
Anindya GhoshalVehicle Technology Directorate,
U.S. Army Research Laboratory,
Aberdeen Proving Ground, MD 21005
e-mail: [email protected]
Michael J. WalockVehicle Technology Directorate,
U.S. Army Research Laboratory,
Aberdeen Proving Ground, MD 21005
e-mail: [email protected]
Muthuvel MuruganVehicle Technology Directorate,
U.S. Army Research Laboratory,
Aberdeen Proving Ground, MD 21005
e-mail: [email protected]
Prashant KhareDepartment of Aerospace Engineering,
University of Cincinnati,
Cincinnati, OH 45221-0070
e-mail: [email protected]
A Critical Review of PhysicalModels in High TemperatureMultiphase Fluid Dynamics:Turbulent Transport andParticle-Wall InteractionsThis review article examines the last decade of studies investigating solid, molten, andliquid particle interactions with one another and with walls in heterogeneous multiphaseflows. Such flows are experienced in state-of-the-art and future-concept gas turbineengines, where particles from the environment, including volcanic ash, runway debris,dust clouds, and sand, are transported by a fluid carrier phase and undergo high-speedcollisions with high-temperature engine components. Sand or volcanic ash ingestion ingas turbine engines is known to lead to power-loss and/or complete engine failure. Theparticle-wall interactions that occur in high-temperature sections of an engine involvephysics and intrinsic conditions that are sufficiently complex that they result in highly dis-parate and transient outcomes. These particles, which often times are made up of glassyconstituents called calcium–magnesium–alumino–silicate (CMAS), are susceptible tophase change at combustor temperatures (1650�), and can deposit on surfaces, undergoelastic and plastic deformation, rebound, and undergo breakup. Considerable researchhas been put into developing empirical and physics-based models and numerical strat-egies to address phase interactions. This article provides a detailed account of the con-ceptual foundation of physics-based models employed to understand the behavior ofparticle-wall interaction, the evolution of numerical methods utilized for modeling theseinteractions, and challenges associated with improving models of particle-particle andparticle-wall interactions needed to better characterize multiphase flows. It also includesdescription of a testbed for acquiring canonical data for model validation studies.[DOI: 10.1115/1.4051503]
1 Introduction
The objective of this review is to examine the last decade ofstudies investigating solid, molten, and liquid particle-wall inter-actions in systems with heterogeneous multiphase flows. Suchflows are experienced in state-of-the-art and future concept gasturbine engines, where particles from the environment, such as
volcanic ash, runway debris, dust clouds, and sand, are transportedby a fluid carrier phase and undergo high-speed collisions withhigh-temperature engine components. Sand or volcanic ash inges-tion in gas turbine engines is known to lead to power loss or com-plete engine failure. Guffanti et al. [1] report on over 79 incidentsin which aircraft encounters with volcanic ash clouds led to severeengine damage. Similarly, there have been a number of rotorcraftincidents, including the fatal V-22 Osprey crash landing in May2015 [2], due to engine failure attributed to excessive buildup onturbine blades that lead to degradation and spallation of materialsfrom ingested sand/dust particles.
Manuscript received September 11, 2020; final manuscript received June 16,2021; published online July 28, 2021. Assoc. Editor: Arezoo Ardekani.
This work is in part a work of the U.S. Government. ASME disclaims all interestin the U.S. Government’s contributions.
Applied Mechanics Reviews JULY 2021, Vol. 73 / 040801-1Copyright VC 2021 by ASME
Dow
nloaded from http://asm
edigitalcollection.asme.org/appliedm
echanicsreviews/article-pdf/73/4/040801/6733986/am
r_073_04_040801.pdf by University of C
incinnati user on 30 July 2021
This problem arises as particles having nominal dimensions ofless than �30 lm are too small to be blocked by the inlet particleseparation system, and are ingested into the engine. An inlet parti-cle separation system is designed to impart swirl to the enteringairflow and extract that part of the flow containing the centrifugedsand through a scavenge system. However, continued use has ledto engine performance penalties and thus its use is generallyreserved for the most severe conditions [3]. Of particular concernare ingested particles made of glassy constituents, the most com-mon of which are calcium–magnesium–alumino–silicates(CMAS) particles. CMAS particles are susceptible to phasechange at combustor temperatures [3], and can deposit on surfa-ces, undergo elastic and plastic deformation, rebound, and evenundergo breakup with slip/shear along the surface with possiblethermal and momentum dissipation. These particle-interactionprocesses are transient and occur over a wide range of spatio-temporal scales, thereby increasing its modeling complexity.
An enduring challenge for the aviation community is dealingwith particulate matter of less than 2.5 lm in numerous regionsacross the globe (see Fig. 1), including desert and urban environ-ments. Moreover, geographically dependent CMAS compositionleads to variations in shape, chemistry, and melting temperatewhich in turn may lead to increased damage. Figure 1 shows high-intensity regions of particulate matter less than 2.5 lm in diameter(PM2.5) extending across North Africa, South West Asia, andSouth East Asia [4,5].
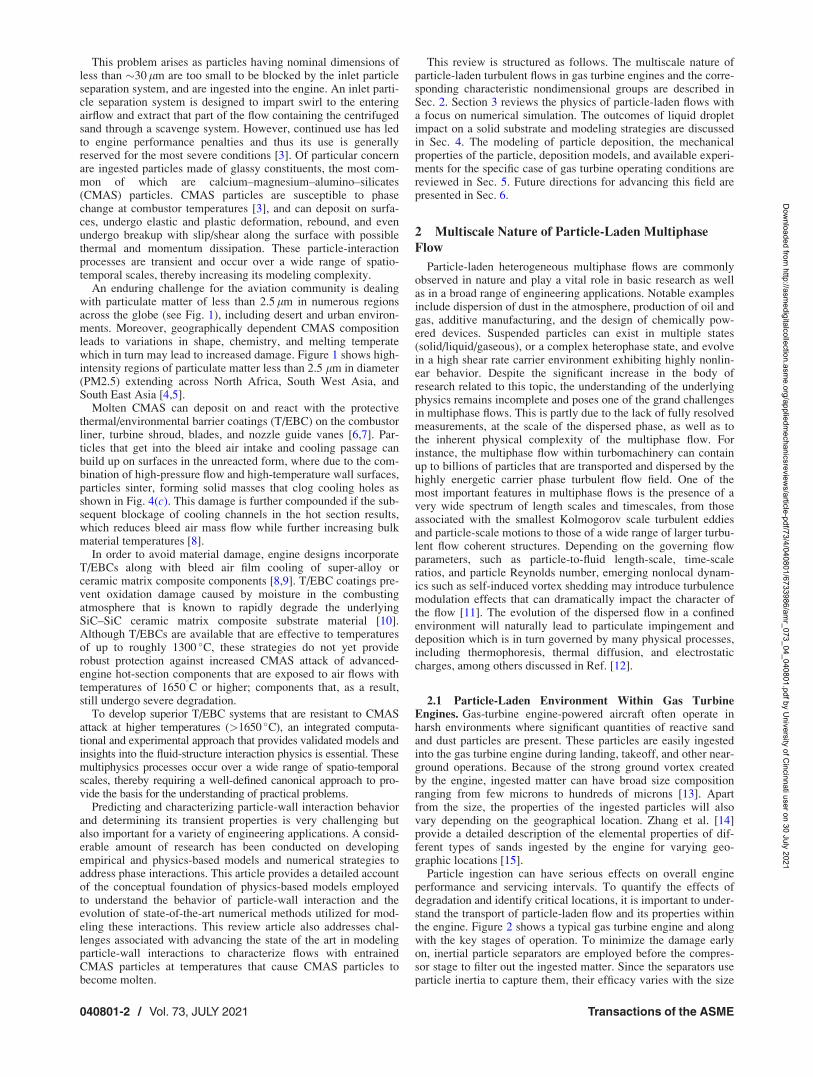
Molten CMAS can deposit on and react with the protectivethermal/environmental barrier coatings (T/EBC) on the combustorliner, turbine shroud, blades, and nozzle guide vanes [6,7]. Par-ticles that get into the bleed air intake and cooling passage canbuild up on surfaces in the unreacted form, where due to the com-bination of high-pressure flow and high-temperature wall surfaces,particles sinter, forming solid masses that clog cooling holes asshown in Fig. 4(c). This damage is further compounded if the sub-sequent blockage of cooling channels in the hot section results,which reduces bleed air mass flow while further increasing bulkmaterial temperatures [8].
In order to avoid material damage, engine designs incorporateT/EBCs along with bleed air film cooling of super-alloy orceramic matrix composite components [8,9]. T/EBC coatings pre-vent oxidation damage caused by moisture in the combustingatmosphere that is known to rapidly degrade the underlyingSiC–SiC ceramic matrix composite substrate material [10].Although T/EBCs are available that are effective to temperaturesof up to roughly 1300 �C, these strategies do not yet providerobust protection against increased CMAS attack of advanced-engine hot-section components that are exposed to air flows withtemperatures of 16508C or higher; components that, as a result,still undergo severe degradation.
To develop superior T/EBC systems that are resistant to CMASattack at higher temperatures (>1650 �C), an integrated computa-tional and experimental approach that provides validated models andinsights into the fluid-structure interaction physics is essential. Thesemultiphysics processes occur over a wide range of spatio-temporalscales, thereby requiring a well-defined canonical approach to pro-vide the basis for the understanding of practical problems.
Predicting and characterizing particle-wall interaction behaviorand determining its transient properties is very challenging butalso important for a variety of engineering applications. A consid-erable amount of research has been conducted on developingempirical and physics-based models and numerical strategies toaddress phase interactions. This article provides a detailed accountof the conceptual foundation of physics-based models employedto understand the behavior of particle-wall interaction and theevolution of state-of-the-art numerical methods utilized for mod-eling these interactions. This review article also addresses chal-lenges associated with advancing the state of the art in modelingparticle-wall interactions to characterize flows with entrainedCMAS particles at temperatures that cause CMAS particles tobecome molten.
This review is structured as follows. The multiscale nature ofparticle-laden turbulent flows in gas turbine engines and the corre-sponding characteristic nondimensional groups are described inSec. 2. Section 3 reviews the physics of particle-laden flows witha focus on numerical simulation. The outcomes of liquid dropletimpact on a solid substrate and modeling strategies are discussedin Sec. 4. The modeling of particle deposition, the mechanicalproperties of the particle, deposition models, and available experi-ments for the specific case of gas turbine operating conditions arereviewed in Sec. 5. Future directions for advancing this field arepresented in Sec. 6.
2 Multiscale Nature of Particle-Laden Multiphase
Flow
Particle-laden heterogeneous multiphase flows are commonlyobserved in nature and play a vital role in basic research as wellas in a broad range of engineering applications. Notable examplesinclude dispersion of dust in the atmosphere, production of oil andgas, additive manufacturing, and the design of chemically pow-ered devices. Suspended particles can exist in multiple states(solid/liquid/gaseous), or a complex heterophase state, and evolvein a high shear rate carrier environment exhibiting highly nonlin-ear behavior. Despite the significant increase in the body ofresearch related to this topic, the understanding of the underlyingphysics remains incomplete and poses one of the grand challengesin multiphase flows. This is partly due to the lack of fully resolvedmeasurements, at the scale of the dispersed phase, as well as tothe inherent physical complexity of the multiphase flow. Forinstance, the multiphase flow within turbomachinery can containup to billions of particles that are transported and dispersed by thehighly energetic carrier phase turbulent flow field. One of themost important features in multiphase flows is the presence of avery wide spectrum of length scales and timescales, from thoseassociated with the smallest Kolmogorov scale turbulent eddiesand particle-scale motions to those of a wide range of larger turbu-lent flow coherent structures. Depending on the governing flowparameters, such as particle-to-fluid length-scale, time-scaleratios, and particle Reynolds number, emerging nonlocal dynam-ics such as self-induced vortex shedding may introduce turbulencemodulation effects that can dramatically impact the character ofthe flow [11]. The evolution of the dispersed flow in a confinedenvironment will naturally lead to particulate impingement anddeposition which is in turn governed by many physical processes,including thermophoresis, thermal diffusion, and electrostaticcharges, among others discussed in Ref. [12].
2.1 Particle-Laden Environment Within Gas TurbineEngines. Gas-turbine engine-powered aircraft often operate inharsh environments where significant quantities of reactive sandand dust particles are present. These particles are easily ingestedinto the gas turbine engine during landing, takeoff, and other near-ground operations. Because of the strong ground vortex createdby the engine, ingested matter can have broad size compositionranging from few microns to hundreds of microns [13]. Apartfrom the size, the properties of the ingested particles will alsovary depending on the geographical location. Zhang et al. [14]provide a detailed description of the elemental properties of dif-ferent types of sands ingested by the engine for varying geo-graphic locations [15].
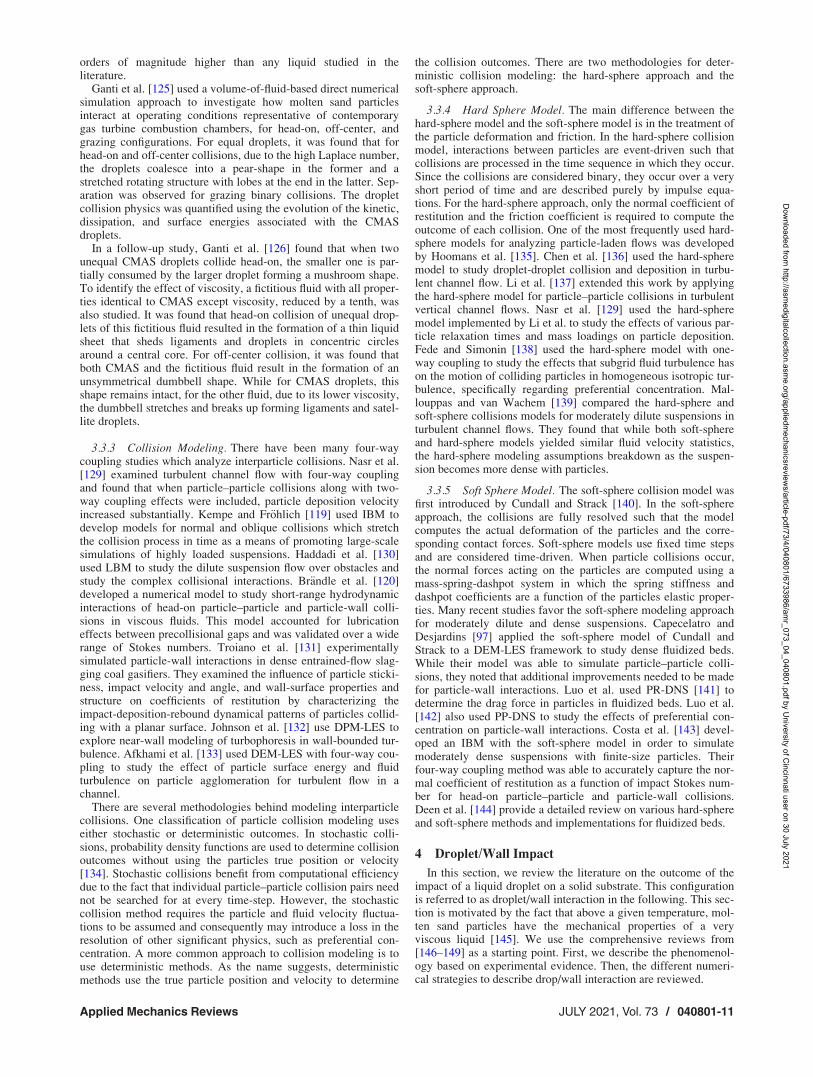
Particle ingestion can have serious effects on overall engineperformance and servicing intervals. To quantify the effects ofdegradation and identify critical locations, it is important to under-stand the transport of particle-laden flow and its properties withinthe engine. Figure 2 shows a typical gas turbine engine and alongwith the key stages of operation. To minimize the damage earlyon, inertial particle separators are employed before the compres-sor stage to filter out the ingested matter. Since the separators useparticle inertia to capture them, their efficacy varies with the size
040801-2 / Vol. 73, JULY 2021 Transactions of the ASME
Dow
nloaded from http://asm
edigitalcollection.asme.org/appliedm
echanicsreviews/article-pdf/73/4/040801/6733986/am
r_073_04_040801.pdf by University of C
incinnati user on 30 July 2021

of the particle. Inertial separators work well for particles greaterthan a certain size. Over the years, the particle separators havebecome increasingly efficient and this threshold of particle sizebeing filtered effectively has changed considerably. As such, anoticeable variation in the reported threshold size is found in theliterature. For example, Murugan et al. [16] stated that the separa-tors can adequately separate particles of size above 75 lm. Dunnet al. [17] investigated volcanic ash ingestion and they found outthat the particles with an average size of 38 lm were available atthe early stages of the compressor. Bojdo et al. [3] reported thatparticles below the size of 10 lm mostly escape inertial separa-tors. The significant variance in the reported threshold particlesize is also attributed to the manufacturers having their specificmetrics for determining the mean particle size. For the sake ofconsistency in the analysis presented in this review article, wehave selected the average threshold size to be 30 lm, above whichparticles are captured by the inertial separator with high effi-ciency. While the mean size of the particles reaching the compres-sor stage decreases substantially due to the presence of separators,the damage from the particles to the engine remains imminent.For each engine stage, the consequent behavior of the particlesand their interaction is investigated methodically by Bojdo et al.[3] through the development of reduced-order modeling.
Within the compressor stage, the trajectory of large particles isunaffected by the swirling turbulent flow owing to their high iner-tia. These particles impact directly on the component surfacescausing blade erosion and damage [18]. These impacts also causea breakdown of the particles, altering the distribution of particlesize. Particles larger than 10 lm are pulverized into many smallerparticles. Their breakdown makes later stages of the compressorless susceptible to erosive damage. A fraction of the mass flowalong with its dispersed particles is extracted at the later stages toserve as cooling flow at the turbine stage. Therefore in addition tofewer particles reaching the combustor stage, the average particlesize is predominantly less than 10 lm.
Because of high operating temperatures within the combustor,the smaller particles are likely to undergo partial to completemeltdown. As these particles soften, they exhibit strong adhesion.However, they do not readily deposit on combustor walls as mostparticles are propelled to the later stages of the engine by the ener-getic turbulent flow driven by the high-pressure turbines. Only alimited subset of particles are small enough to melt but are largeenough, i.e., have sufficient inertia, to not be transported by theflow. It is these particles that will be deposited, likely in the formof glazing, on combustor walls.
The particles reaching the turbine stage are substantiallysmaller in size compared to the primary ingested mixture but havea strong tendency to react chemically due to their melted andenergetic state. The particles will follow the flow initially due totheir low inertia but will tend to deposit on turbine surfaces asthey encounter sudden changes in flow through the early stages ofthe turbine.
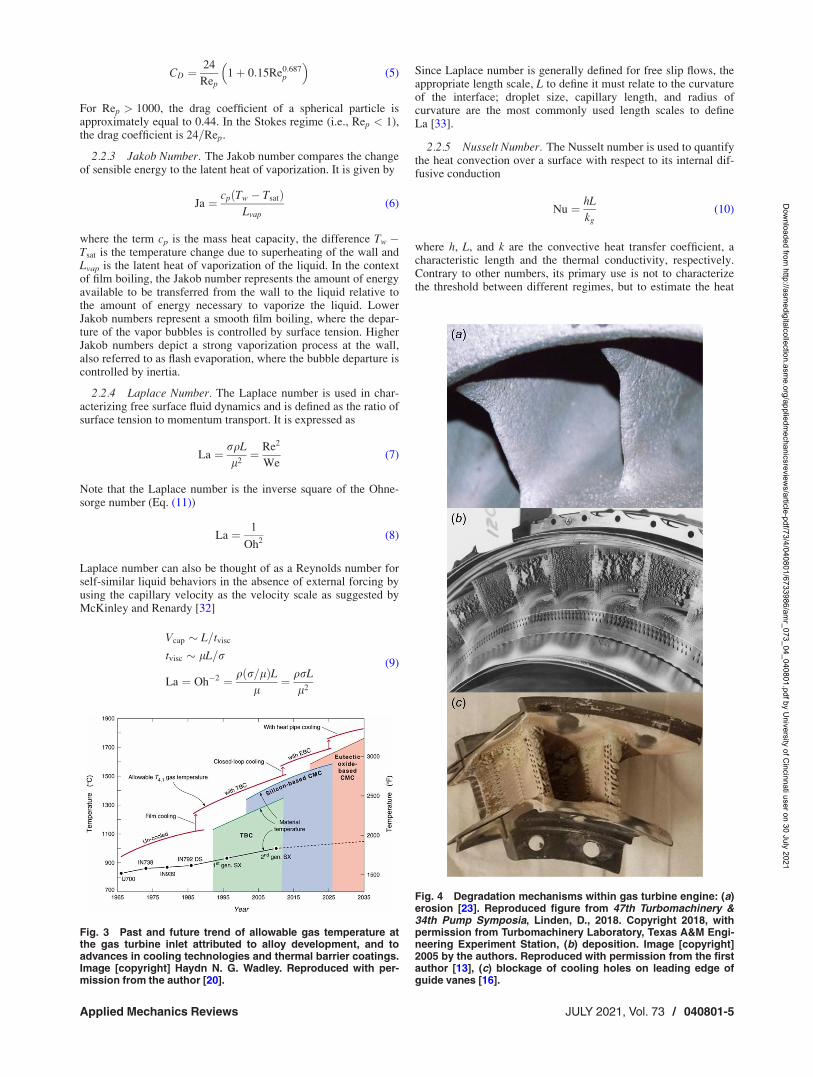
The core flow mixed with ingested particles goes through thecompressor and is heated in the combustor as the fuel mixture isburned. The resulting hot gas mixture is then directed to the tur-bine stages and finally exits the exhaust nozzle. The thermal effi-ciency and the thrust output of the engine increase directly withincrease in the flow temperature at the inlet to the turbine. Thisresults in a critical design constraint for modern gas-turbineengines arising due to the need to avoid inlet flow temperaturesexceeding the material limits of the components used in the tur-bine. As such, considerable research efforts have been put into thedevelopment of super alloys and thermal barrier coatings that canwithstand high temperatures. Active cooling technologies thatemploy air bled from the compressor are also continuously beingrefined [19]. Figure 3 provides a historical trend of allowable flowtemperature based on the materials available at the time. By con-sidering the advancement in promising material and cooling tech-nologies, the figure also predicts the future trend of the increase inallowable turbine inlet temperature [20].
The three main elements of a gas turbine engine, namely, thecompressor, combustor, and turbine, experience different forms ofdamage due to ingested particles. The primary mechanism ofdamage in the compressor (cold) section of the engine is erosion.Ingested particles directly erode compressor vane and blade surfa-ces, causing a reduction in their aerodynamic performance[21,22]. In the combustor, the particles are heated significantlyand, depending on their composition, they may become molten.Within the combustor section, the particulates could potentiallyblock the fuel injection nozzles causing inefficient combustionand performance degradation. This heated semimolten particle-laden hot gas mixture then enters the turbine section where, due tothe high temperature and high velocities, the primary mechanismof damage is particle deposition. This causes CMAS buildup andinfiltration along the surfaces of thermal barrier coatings (TBC)columnar gaps and open vertical cracks in the TBC. Particles aredeposited on the turbine blades thereby altering blade aerody-namic profiles and reducing the turbine efficiency. This depositioncan occur as a thin film over the hot surfaces of the gas turbine,known as glazing, and can build up over time. An example of this
Fig. 1 Global satellite-derived PM2.5 averaged over 2008–2016 showing local intensity of particulate matterless than 2.5 lm. White space indicates water or locations containing <50 measurements. Image [copyright]Aaron van Donkelaar. Reproduced with permission from the author [4].
Applied Mechanics Reviews JULY 2021, Vol. 73 / 040801-3
Dow
nloaded from http://asm
edigitalcollection.asme.org/appliedm
echanicsreviews/article-pdf/73/4/040801/6733986/am
r_073_04_040801.pdf by University of C
incinnati user on 30 July 2021

damage mechanism is shown in Fig. 4(b). Deposition of particlesin the turbine restricts the flow area and increases surface rough-ness, both of which lead to the decreased aerodynamic perform-ance of the turbine and result in loss of engine power [23].
The majority of reactive deposition under high temperatures ischemically comprised of CMAS [24]. The thermal barrier coatingover turbine blade surfaces is very susceptible to damage fromCMAS. At high temperatures, CMAS deposits melt, and theninfiltrate and degrade the TBC layer through a direct chemicalreaction with TBC constituents [25]. This process continues witheach repeated thermal gradient cycle. Studies [26,27] have shownthat these chemical interactions can lead to spallation of TBC fol-lowed by accelerated oxidation and corrosion of the underlyingmetallic bond coat. The thermal gradient between the coating andthe blade substrate can also lead to delamination of the TBC [28].Cooling air which is bled from the compressor also carriesingested particles to the internal cooling passages. Particlesimpacting cooling passage surfaces deposit as mostly unreactedCMAS where, because of the combination of high-pressure flowand the high temperatures at cooling-passage wall surfaces, depos-ited particles can sinter to one another and the surfaces of thecooling passages. Murugan et al. [16] used scanning acousticmicroscopy for subsurface imaging of the guide vanes shown inFig. 4(c). They determined that in addition to the buildup ofCMAS on vane surfaces and visible clogging of cooling holes,“the subsurface air channel was also significantly clogged bysand.” This reduces the cooling air mass flow, leading to furtherincreases in surface temperatures which further increases the rateof particle deposition and sintering and the blockage of flow [29].Within the internal passages of turbine blades, particles can alsodeposit on the ribs constructed for improving heat transfer [30]. Inaddition to reducing the cooling channel cross-sectional area, thelow thermal conductivity of these internal deposits can isolate thehot blade surface by acting as a thermal barrier between the bladeand the cooling flow. This further reduces heat transfer, com-pounding the reduction in air flow, and leading to increased bladetemperatures which can contribute directly to the structural failureof the blade.
2.2 Dimensionless Parameters. The process of particle-wallinteraction is dynamic and nonlinear. There are several forcesspanned across disparate scales that are involved during this pro-cess, including elastic-plastic stress, electrostatic forces, capillaryforces, and van der Waals adhesion forces. The outcome of suchinteractions will depend on a multitude of variables associatedwith the properties of the surface, the particles, and the continuumphase. Dimensionless parameters can help in reducing the dimen-sionality of such a system by developing fundamental relationsbetween system variables and identifying key behavioral regimesbased on the operating conditions. A large number of
dimensionless groups can be found in the literature that representthe multiphase flow characteristics through some form of correla-tion or predicted behavior. The dimensionless groups that aremost relevant to the multiphase particle-wall interaction problemare discussed (in alphabetical order) in this section. Note that thesubscripts p, d, and g refer to particle, droplet, and gas, respec-tively. In this section, a particle can be either liquid or solid whilea droplet is exclusively a liquid particle.
2.2.1 Coefficient of Restitution. The key parameter that gov-erns the outcome of collision of a particle with either another par-ticle or a surface is the coefficient of restitution. Mathematically,this coefficient defines the ratio of postcollision to precollision rel-ative velocity. The coefficient of restitution takes into account theeffect of energy losses during a collision. For gas–solid or “dry”collisions, the effects of interstitial fluid are negligible and theenergy dissipation of inelastic collisions is characterized solely bythe coefficient of restitution. If the collision is perfectly head-on,the normal dry coefficient of restitution is used
en;dry ¼uout;n
uin;n(1)
where uout;n and uin;n are the normal velocities between the twocolliding bodies during rebound and incidence, respectively. Foroblique collisions, the incident angles pre and postcollision mustbe considered and are commonly referred to as effective angles ofincidence and rebound
win ¼uin;t
uin;n(2)
wout ¼uout;t
uin;n(3)
where the subscript t indicates the tangential component of rela-tive velocity. Another common term that is used to address non-normal collisions is the kinematic coefficient of restitution, whichis the ratio of the magnitudes of the rebound and incidentvelocities.
2.2.2 Drag Coefficient. The drag coefficient of a particle isdefined as the ratio of the drag force exerted on the particle by thedynamic pressure over the particle cross-sectional area
CD ¼8Fd
pqgu2gd2
p
(4)
The drag coefficient is useful to estimate the drag force from thegas flow characteristics. It strongly depends on the particle Reyn-olds number (Eq. (12)). For Rep � 1000, the drag coefficient canbe estimated using the Schiller–Naumann correlation [31]
Fig. 2 Representative gas turbine engine [15]
040801-4 / Vol. 73, JULY 2021 Transactions of the ASME
Dow
nloaded from http://asm
edigitalcollection.asme.org/appliedm
echanicsreviews/article-pdf/73/4/040801/6733986/am
r_073_04_040801.pdf by University of C
incinnati user on 30 July 2021
CD ¼24
Rep1þ 0:15Re0:687
p
� �(5)
For Rep > 1000, the drag coefficient of a spherical particle isapproximately equal to 0.44. In the Stokes regime (i.e., Rep < 1),the drag coefficient is 24=Rep.
2.2.3 Jakob Number. The Jakob number compares the changeof sensible energy to the latent heat of vaporization. It is given by
Ja ¼ cp Tw � Tsatð ÞLvap
(6)
where the term cp is the mass heat capacity, the difference Tw �Tsat is the temperature change due to superheating of the wall andLvap is the latent heat of vaporization of the liquid. In the contextof film boiling, the Jakob number represents the amount of energyavailable to be transferred from the wall to the liquid relative tothe amount of energy necessary to vaporize the liquid. LowerJakob numbers represent a smooth film boiling, where the depar-ture of the vapor bubbles is controlled by surface tension. HigherJakob numbers depict a strong vaporization process at the wall,also referred to as flash evaporation, where the bubble departure iscontrolled by inertia.
2.2.4 Laplace Number. The Laplace number is used in char-acterizing free surface fluid dynamics and is defined as the ratio ofsurface tension to momentum transport. It is expressed as
La ¼ rqL
l2¼ Re2
We(7)
Note that the Laplace number is the inverse square of the Ohne-sorge number (Eq. (11))
La ¼ 1
Oh2(8)
Laplace number can also be thought of as a Reynolds number forself-similar liquid behaviors in the absence of external forcing byusing the capillary velocity as the velocity scale as suggested byMcKinley and Renardy [32]
Vcap � L=tvisc
tvisc � lL=r
La ¼ Oh�2 ¼ q r=lð ÞLl
¼ qrL
l2
(9)
Since Laplace number is generally defined for free slip flows, theappropriate length scale, L to define it must relate to the curvatureof the interface; droplet size, capillary length, and radius ofcurvature are the most commonly used length scales to defineLa [33].
2.2.5 Nusselt Number. The Nusselt number is used to quantifythe heat convection over a surface with respect to its internal dif-fusive conduction
Nu ¼ hL
kg(10)
where h, L, and k are the convective heat transfer coefficient, acharacteristic length and the thermal conductivity, respectively.Contrary to other numbers, its primary use is not to characterizethe threshold between different regimes, but to estimate the heat
Fig. 3 Past and future trend of allowable gas temperature atthe gas turbine inlet attributed to alloy development, and toadvances in cooling technologies and thermal barrier coatings.Image [copyright] Haydn N. G. Wadley. Reproduced with per-mission from the author [20].
Fig. 4 Degradation mechanisms within gas turbine engine: (a)erosion [23]. Reproduced figure from 47th Turbomachinery &34th Pump Symposia, Linden, D., 2018. Copyright 2018, withpermission from Turbomachinery Laboratory, Texas A&M Engi-neering Experiment Station, (b) deposition. Image [copyright]2005 by the authors. Reproduced with permission from the firstauthor [13], (c) blockage of cooling holes on leading edge ofguide vanes [16].
Applied Mechanics Reviews JULY 2021, Vol. 73 / 040801-5
Dow
nloaded from http://asm
edigitalcollection.asme.org/appliedm
echanicsreviews/article-pdf/73/4/040801/6733986/am
r_073_04_040801.pdf by University of C
incinnati user on 30 July 2021

flux transferred by natural or forced convection. The convectiveflux depends on many operating parameters of the surroundingfluids whereas heat conduction relies solely on the thermal proper-ties of the considered object.
2.2.6 Ohnesorge Number. The Ohnesorge number incorpo-rates the competition between the droplet inertia, viscosity, andsurface tension. It can be used to distinguish between conditionsthat lead to different modes of liquid jet breakup and droplet for-mation as well as to characterize the driving forces for initialdroplet spread upon impact with a solid substrate. The Ohnesorgenumber can be expressed as
Oh ¼ llffiffiffiffiffiffiffiffiffiffiffiffiffiqdDpr
p ¼ffiffiffiffiffiffiffiWep
Re(11)
Note that as no velocity appears in its expression, the Ohnesorgenumber only depends on the mechanical properties of the liquidcomposing the droplet and on its size. The Ohnesorge number canalso be regarded as the ratio of (i) the visco-capillarity time scalefor the thinning of a ligament lL=r dominated by viscosity and(ii) the Rayleigh breakup time scale for an inviscid jet
ffiffiffiffiffiffiffiffiffiffiffiffiffiqL3=r
p.
2.2.7 Particle Reynolds Number. The Reynolds number isused in predicting if a flow field is laminar or turbulent. Ranges ofReynolds numbers at which flow transitions from laminar to tur-bulent have been determined empirically for a wide variety ofinteractions, including internal flows, external flows, flows withan injected jet, flows with entrained particles, etc. The magnitudeof a Reynolds number can be found by taking the ratio of the fluidinertial and viscous forces. For particle-laden fluid flows in whichthe fluid is a gas and the particles are either solids or liquid drop-lets, inertial effects are dominated by particle properties [11]. Thisleads to the Reynolds number, or what is sometimes described asa particle Reynolds number, that is defined as
Re ¼qgUgpDp
lg
(12)
where qg, Ugp, and Dp are the gas density, relative velocitybetween the gas and particle phases, and the particle diameter,respectively, and the term lg is the gas viscosity.
2.2.8 Particle Volume Fraction. For dispersed multiphaseflows, the particle volume fraction describes the portion of a givenmultiphase fluid volume which is occupied by particles ordroplets
Up ¼NpVp
V(13)
where Np is the number of particles or droplets, Vp is the volumeof a single particle, and V is the volume occupied by particles andfluid.
2.2.9 Prandtl Number. The Prandtl number is used to charac-terize the relative contributions of convection and conduction inthe heat transfer processes that produce temperature gradients in afluid when the fluid moves past a surface at a different tempera-ture. The Prandtl number is defined using the ratio of the momen-tum diffusion rate to the thermal diffusion rate and is expressed as
Pr ¼ lcp
k(14)
where l is the dynamic viscosity, cp is specific heat and k is thethermal conductivity. Although the Prandtl number does notcontain a length scale and is dependent only on fluid properties(i.e., not flow field properties), the Prandtl number governs thethickness ratio of the thermal (conductive) boundary layer and themomentum (convective) boundary layer. In fluids with Pr values
much greater than 1, heat transfer to the fluid is dominated bymomentum-driven convective heat diffusion. In fluids with Pr val-ues of 1, convective and conductive heat diffusion rates are simi-lar. In fluids with Pr values of much less than 1, conductive heattransfer dominates. The Pr is used in characterizing heat transferin laminar flows. A related term that is used for turbulent flows isthe effective Prandlt number, which is the sum of the Prandlt num-ber and the turbulent Prandlt number. The turbulent Prandtl num-ber depends on flow field properties (rather than just on fluidproperties) and is given by the ratio of eddy viscosity and eddyheat diffusivity.
2.2.10 Stokes Number. The Stokes number is used to charac-terize the behavior of particle responses to the carrier-phase gasand is defined as the ratio of the dispersed-phase inertia to thecarrier-phase inertia
St ¼ sp
sg(15)
where sp is the particle response time and sg is the characteristictime scale of the gas phase. For particle-laden flows where theparticle-to-fluid density ratio qp=qg is high, the particle responsetime becomes
sp ¼qpD2
p
18lg
(16)
In general, the carrier-phase response time is defined as a charac-teristic length l0 divided by a characteristic velocity u0
sg ¼l0u0
(17)
When considering particle motion through a turbulent flow, theresponse time is typically defined as the integral time scale ofturbulence
sg �k
e(18)
where k is the turbulent kinetic energy and e is the dissipation rateof turbulent kinetic energy. Stokes numbers based on macroscopictime scale (Eq. (17)) and on turbulent time scale (Eq. (18)) arenoted Stm and Stt, respectively.
2.2.11 Weber Number. The Weber number is used to charac-terize the stability of droplets moving through a gas or liquid.Inertia forces due to droplet motion promote droplet deformation,which is opposed by surface tension forces. The Weber number isthe ratio of the destabilizing effect of the droplet inertia (resp. theaerodynamics stress) to the stabilizing effect of the droplet surfacetension. It is expressed as
Wep ¼qdU2
dDd
rresp: Weg ¼
qgU2gdDd
r(19)
where r is the surface tension coefficient. A Weber number lowerthan 12 indicates a stable droplet that will not (further) break up[34]. Depending on the type of application, Wep or Weg are pre-ferred. Typically, Wep is used for droplet/wall impacts and Weg
for atomization.
2.2.12 Nominal Values in the Different Aeroengine Compo-nents. The order of magnitude of the air properties in the differentsections of a gas turbine engine are given in Table 1. They wereestimated as follows. As particle ingestion occurs at low altitude,we assume typical inlet conditions at 1 atmosphere and 20 8C. Inthe compressor, we consider a polytropic compression of index1.4 and pressure ratio 30. We neglect pressure loss from the
040801-6 / Vol. 73, JULY 2021 Transactions of the ASME
Dow
nloaded from http://asm
edigitalcollection.asme.org/appliedm
echanicsreviews/article-pdf/73/4/040801/6733986/am
r_073_04_040801.pdf by University of C
incinnati user on 30 July 2021

compressor outlet to the turbine inlet. The mean temperature afterthe flame and upstream dilution is estimated to be 2000 K [35,36]and turbine inlet temperature is assumed to be 1800 K (Fig. 3).The velocity in the different components is taken from [37]. Con-cerning the particulate, the density and the specific heat are ratherconstant all along the stages. When the particulates are cold (up tothe combustor inlet) it can be considered as a solid and hence itsviscosity and surface tension are not applicable (N/A). After com-bustion, CMAS starts to melt and hence these quantities can beestimated. The mechanical properties are summarized in Table 2,based on data found in Refs. [38,39]. We consider here particu-lates from 3 to 30 lm diameter and we estimate their velocity tobe 80% of the surrounding gas. Studies have shown that commer-cial aircrafts flying through volcanic ash clouds may be exposedto particle concentrations up to 2 g/m3 [1]. In addition, a studywhich characterized brownout conditions for various helicoptersshowed particle concentrations at the rotor tip to be as high as3.5 g/m3 [40]. This range of particle concentrations corresponds toa particle volume fraction ranging from e-7 to e-6. Based on theseconsiderations, the nondimensional numbers are summarized inTable 3.
3 Solid Particle-Laden Fluid Flow
3.1 Flow Characterization. Dispersed multiphase flows areubiquitous in both nature and engineering with common examplesincluding atmospheric dispersal of pollutants, liquid sprays inengines, and sedimentation of sand particles in river beds. Univer-sally, these particle-laden fluid flows contain finite particles whichare distributed within a continuous fluid carrier phase. The par-ticles, classically referred to as the dispersed phase, can be gase-ous bubbles, liquid droplets, or solid particles. There are fiveclassifications of particle-laden fluid flows based on their carrier-dispersed phase composition: gas–solid, liquid–solid, gas-droplet,liquid-droplet, and liquid–gas [41]. For the application of hetero-geneous multiphase flows in gas turbine engines, this paper willfocus on solid and liquid dispersed phases. Since the underlyingphysics and mechanisms of particle-wall interactions are funda-mentally different for solid and liquid particles, this section willfocus on gas–solid and liquid–solid flows while Sec. 4 will focuson gas-droplet and liquid-droplet flows.
A classification system suggested by Elghobashi [42] presentsthree coupling strategies for particle-laden flows which offer vary-ing degrees of mathematical fidelity. These coupling regimes arebased on interaction mechanics and turbulence modulation. Thedispersed-phase volume fraction Up is used to delimit the fidelityrequirements for mathematical modeling. For particle-laden flowswith very low volume fractions (i.e., Up � 10�6), the one-waycoupling regime indicates that interparticle spacing is very largeand particle concentration is very low such that turbulence in thecarrier phase has dominating effects on the dynamics of the dis-persed phase. In the one-way coupling regime, momentum trans-fer is only considered from the carrier phase to the dispersedphase. For particle volume fractions between the range of 10�6 to10�3, the particle concentration becomes large enough to lead tomodifications in the carrier-phase turbulence. In this two-way cou-pling regime, turbulence can either be dissipated or enhanced as afunction of the particle diameter, requiring direct feedback ofmomentum transfer between the carrier and dispersed phases.
Both the one-way and two-way coupling regimes are classified asdilute suspensions where particle dynamics are mainly governedby surface and body forces acting on them through the carrierphase. As the particle volume fraction becomes even larger (i.e.,Up > 10�3), particle concentration becomes significantly largerand interparticle spacing becomes significantly smaller [41], lead-ing to the dense suspension classification which necessitates four-way coupling. In the four-way coupling regime, fluid-particlemomentum transfer, as well as particle–particle interactions, mustbe considered.
Section 2 and Table 3 illustrate typical particle concentrationsfound in the surrounding external flow of aircraft in criticalparticle-laden environments. However, there is no experimentaldata to indicate the particle concentrations present inside of thegas turbine. At best, estimates based on the external particle-ladenflow can be used to further classify particle-laden gas turbineflows. This range of particle concentrations corresponds to a parti-cle volume fraction ranging from e-7 to e-6. Based on the previ-ously outlined classification, this places the particle-laden flow ingas turbine engines on the boundary of the very dilute to moder-ately dilute regimes. A thorough review of particle transport anddeposition for very dilute mixtures with an emphasis on the one-way coupling regime can be found in the work by Guha [12]. Thecurrent review paper focuses on the two-way coupling regime formoderately dilute suspensions. In addition, the particles Stokesnumber range shows that particles are of the order of or largerthan the scales of dissipative carrier-phase eddies. In the range ofparticle volume fractions of interest, as described by Balachandarand Eaton [11], Lagrangian point-particle and fully resolvedapproaches are most appropriate. For further details on differentcomputational approaches to model particle-laden flows based onrelative particle sizes and/or Stokes number and appropriate cou-pling strategies, the readers are encouraged to refer to previousreview papers on the topic [11,43,44].
3.2 Particle Transport
3.2.1 Description of Particle Motion. Obtaining a completedescription of a particle-laden flow field requires the instantaneousstates of the dispersed and carrier phases to be known. For a sys-tem containing a total of Np particles, the position xi and velocityvi must be characterized for all particles from i ¼ f1;…;Npg. Theposition of particle i is characterized by the kinematic equation
dxi tð Þdt¼ vi (20)
and the velocity of particle i is characterized by
midvi tð Þ
dt¼ Fb þ Fs þ
XFint (21)
where mi is the mass of the ith particle and the right-hand side isthe sum of the body forces Fb, surface forces Fs, and interactionforces Fint acting on the particle. Equations 20 and 21 are thencoupled to the Navier–Stokes equations in order to fully character-ize the particle-laden flow field. Note that while both body andsurface forces are considered in the two-way and four-way cou-pling, the interaction forces are only considered in four-way
Table 1 Typical values of flow parameters at different location of the gas turbine [35–37]
Pressure(atm)
Temperature(K)
Density(kg/m3)
Viscosity(Pa s)
Thermalconductivity (W/(m K))
Heat capacity(J/(kg K)
Lengthscale (m)
Velocity(m/s)
Intake 1 300 1.2 1.8� 10�5 0.025 1007 1 180Combustor inlet 30 800 14 3.62� 10�5 0.058 1098 0.01 60Upstream dilution 30 2000 5.3 6.20� 10�5 0.11 1251 0.01 150Turbine inlet 30 1800 5.9 5.83� 10�5 0.099 1237 0.01 500
Applied Mechanics Reviews JULY 2021, Vol. 73 / 040801-7
Dow
nloaded from http://asm
edigitalcollection.asme.org/appliedm
echanicsreviews/article-pdf/73/4/040801/6733986/am
r_073_04_040801.pdf by University of C
incinnati user on 30 July 2021

coupling regimes. In addition, forces that would be introduced dueto rotation of translating particles (e.g., Magnus effect-induced trans-verse forces) have been shown to significantly affect heat, mass, andmomentum transfer in internal flows with a low Reynolds numberand high particle rotation rates. Kajisjima et al. [45] observed that inregions of cooling channels with low velocity, for particle Reynoldsnumbers of 300–400, particle clustering was impacted (both pro-moted and diminished) by Magnus force effects. As the currentreview largely focuses on engine regions with lower particle Reyn-olds numbers (Table 3) Magnus forces due to particle rotation arementioned as a factor that may merit further consideration, but thatwill not be discussed further in this work.
Particle-laden turbulent flows can exhibit various phenomenasuch as turbulence modulation, preferential concentration, and tur-bophoresis. Gore and Crowe [46] presented a summary of variousexperimental results of dilute particle-laden free shear flowswhich demonstrated a noticeable modification in turbulence inten-sity as a function of particle diameter. They found that particleslarger than the integral length scale cause an increase in turbu-lence intensity while smaller particles cause a decrease. Kulicket al. [47] found that in dilute channel flows, particles attenuatedturbulence when Stokes number, particle mass loading, and dis-tance from the wall increased. Squires and Eaton [48] found thatlighter particles are more susceptible to preferential concentrationin areas of high strain rate and low vorticity. They also showedthat heavier particles are more uniformly dispersed in turbulence.Turbophoresis is another phenomena which causes a nonuniformdistribution of particles in the near-wall region [49]. Turbophore-sis is driven by a differential in turbulent dispersion rates betweendifferent flow regimes. Marchioli et al. [50,51] found that stronglycoherent sweeps drive particles toward the wall while stronglycoherent ejections drive particles toward the outer flow. Thesestudies also found that deposition of heavy particles is stronglyinfluenced by the effects of turbophoresis.
3.2.2 Experimental Studies of Particle Transport in Engine-Like Conditions. Table 1 indicates that the carrier-phase flowwithin the turbine is turbulent given the high Reynolds number. Inaddition, the particle volume fraction range shows that the particletransport of CMAS through the turbine is somewhere on theboundary of dilute to moderately dilute. Balachandar and Eaton[11] recap experimental studies concerning fluid-particle interac-tions in turbulent channels but state that there is still a need todevelop experimental techniques that are capable of fully resolv-ing the flow surrounding the particle phase. Fong et al. [52] pro-vide a comparative table of gas–solid experiments over a range ofReynolds number, Stokes number, and particle volume fractions.However, they note that there still exists a gap in experimentaldata for particle-laden flows that sit on the boundary betweendilute and moderately dilute suspensions. In their research, theyexperimentally observe the velocity and spatial distributions of
monodispersed glass particles in a vertical turbulent channel.Their work considers volume fractions and Stokes numbers thatare expected to occur within the turbine of an aeroengine. How-ever, given the extreme conditions within the turbine, it remainsvery difficult to experimentally observe particle transport behaviorin engine-like conditions. As such, the remainder of this sectionwill focus on computational approaches that are being used tohelp study the transport properties of particle-laden turbulentflows.
3.2.3 Particle-Resolved Methods. Direct numerical simula-tion (DNS) is a first-principle approach used to establish a com-plete description of the carrier-phase flow dynamics at all scaleswithout the need for a closure model [53]. In particle-resolveddirect numerical simulation (PR-DNS), particles of finite size arecoupled to the carrier-phase flow field through the enforcement ofthe no-slip, no-penetration condition at the boundary of each parti-cle. The particle interface is discretized such that the fluiddynamic forces acting on the boundary of each particle are com-puted directly using the flow field solution. Particle positions andvelocities are then explicitly determined based on the surfaceforces and interaction forces acting on the particle [54].
In a review on turbulent dispersed multiphase flow, Balachandarand Eaton [11] recommended that future research should seek toadvance PR-DNS capabilities as a means of studying particle-ladenflows for particles larger than the Kolmogorov length scale. Theprimary advantage of PR-DNS is its capability to fully resolve theflow field surrounding the dispersed phase, exposing the underlyingphysics of particle-laden flows. In addition, PR-DNS can be used todevelop closure models for lower fidelity simulations [54]. Therehave been several notable works which offer a wide-variety of PR-DNS methods for particle-laden flows. These methods utilize astructured Eulerian grid for the carrier phase while implementingvarious techniques to resolve the dispersed phase.
The grid overset method attaches a body-fitted grid to the dis-persed phase particles and overlays this onto the carrier phasestructured grid, coupling these independent grids through interpo-lation. The advantage of this method comes from the carrier phasestructured grid which is capable of capturing the full range of tur-bulent scales while the body-fitted grid is capable of fully resolv-ing the effects of the no-slip condition on each particle. Earlywork by Bagchi and Balachandar [55] tested the validity of usinga body-fitted grid for a single particle in decaying isotropic turbu-lence. The earliest implementation of an overset grid for particle-laden flows was by Burton and Eaton [56] when they studied asingle, fixed particle in decaying isotropic turbulence. Vreman[57] extended their study by using the overset grid method formultiple stationary particles in stationary homogeneous isotropicturbulence. Recently, Koblitz et al. [58] applied an overset grid toa small number of moving particles in a quiescent flow to deter-mine the viability of this method for studying particle-laden flows.
Table 2 Mechanical properties of CMAS material at T 5 1523 K [38,39]
Density (kg/m3) Heat capacity (J/(kg K)) Viscosity (Pa s) Surf. tens. (N/m) Diameter (l m)
2700 800 5 0.35 3–30
Table 3 Typical values nondimensional parameters at different location of the gas turbine. Ranges correspond to particulatesbetween 3 and 30 lm
Reg Rep Wed Oh Stm Pr
�1000 �0:001Intake 12000 7.02–70.2 N/A N/A 0.0132–1.32 0.707Combustor inlet 225 13.5–135 N/A N/A 0.224–22.4 0.690Upstream dilution 130 7.69–76.9 333–3330 8.32–26.3 0.326–32.6 0.728Turbine inlet 500 30.2–302 3700–37000 7.42–23.5 1.16–116 0.728
040801-8 / Vol. 73, JULY 2021 Transactions of the ASME
Dow
nloaded from http://asm
edigitalcollection.asme.org/appliedm
echanicsreviews/article-pdf/73/4/040801/6733986/am
r_073_04_040801.pdf by University of C
incinnati user on 30 July 2021

Despite being able to produce highly resolved flow around eachparticle, the overset method suffers from major computational dis-advantages, namely, the expense of numerical interpolation andthe regeneration of the moving body-fitted mesh.
Fixed-grid methods use a stationary Eulerian grid with Lagran-gian points added to the surface of each particle. The no-slip con-dition is enforced on these surface points through an additionalsource term in the Navier–Stokes equations. The primary fixed-grid methods used in PR-DNS are fictitious domain methods andLattice Boltzmann methods. Glowinski et al. [59] developed afixed-grid fictitious domain method which used Lagrange multi-pliers to introduce a pseudo-body force inside the particles inorder to enforce rigid body motion. Various works expand on thismethod [60–62], with recent work by Yu et al. [63] implementingthis method in parallel to study the effects of particle inertia in aturbulent channel flow. Other fictitious domain methods includethose developed by Kajishima [45] and Takiguchi [64] which setthe velocity in the particle interior to the rigid particle velocityand used volume averaging near the boundary to study particle-laden homogeneous turbulent flow in vertical channels. For moredetail on the various fictitious domain implementations, see Haeriand Shrimpton [65].
A popular subset of the fictitious domain methods is theimmersed boundary method (IBM). Unlike the aforementioned fic-titious domain methods, IBM only considers the forces on the sur-face of the particle, as opposed to the interior. In IBM, a bodyforcing term is added to the Navier–Stokes equations at the Lagran-gian boundary points in order to enforce the no-slip condition. Uhl-mann [66] used IBM to study preferential concentration andparticle-induced flow structures in a vertical plane channel withthousands of solid particles at high Stokes numbers. Lucci et al.[67] expanded on this method to study the effects of solid particleson turbulence modulation in decaying isotropic turbulence. Picanoet al. [68] used a four-way coupled IBM to study neutrally buoyantspheres in solid–liquid dense suspensions. Mehrabadi et al. [69]quantified gas-phase velocity fluctuations due to mean slip velocityin dense gas–solid flows. Recent works have focused on improvingthe computational efficiency of IBM solvers [70,71], with an articleby Kajishima [72] detailing the specific developments for IBMmethods in particle-laden flows. It should be noted that IBM isknown to produce erroneous surface stresses when using imposedboundary conditions to determine surface forces [73].
Another popular technique for PR-DNS is the Lattice-Boltzmann method (LBM). This approach resolves the transportequation of the presence probability density function of gas par-ticles, the so-called Boltzmann equation. The collision termbetween the gas particles is modeled. The state variables such adensity, pressure, and temperature are reconstructed from thehigher moments of the distributions of particle number and veloc-ity. This method has the advantage of being computationally inex-pensive and appropriate for parallelization, hence allowingmassively parallel simulations [74] and finer spatial resolutions.LBM has been used to study the transport, collisions, and agglom-eration of dense particle suspension [75] as well as particle aggre-gation of solid–liquid suspensions in homogeneous isotropicturbulence [76]. H€olzer et al. [77] used LBM to quantify forcesand moments on particles with spherical and nonspherical shapeswhile allowing for particle rotation and linear fluid shear. Recentstudies [78–80] have applied LBM to the simulation of particle-laden, wall-bounded turbulent flow. In most of these studies,LBM uses the “bounce-back” rule to establish the surface bound-ary condition. In order to properly resolve the no-slip boundarycondition, the “bounce-back” rule requires a large number of lat-tice grids for each particle. To circumvent this issue, some studies[81,82] have combined LBM with IBM.
3.2.4 Lagrangian Methods. While the particle-resolved meth-ods are able to capture highly detailed flow around each particle,these approaches are limited by computational expense and thusonly applicable for a relatively small number of particles. For the
simulation of millions of particles, the Euler–Lagrange approach isoften employed. In this method, the carrier-phase is represented inan Eulerian reference frame while the dispersed phase is representedin a Lagrangian reference frame. At the core of the Lagrangianmethod is the point-particle assumption, which presumes that thedispersed-phase particles are smaller than the Kolomogorov lengthscale. Consequently, this allows them to be modeled as dimension-less point sources. In this representation, the boundary conditionaround each particle is not imposed and instead a model is requiredto represent the interphase transfer. The typical solution methodol-ogy for the Eulerian- Lagrangian solvers with four-way couplingcan be decomposed into four major steps. The first step is to solvethe unladen carrier-phase flow field with the Eulerian framework.The second step is to solve the particle motion with the Lagrangianframework by using the solution from the first step to determine therelevant forces acting on each particle. The third step is to recom-pute the carrier-phase flow field with updated source terms from thedispersed phase solution. The final step is to update the dispersedphase solution to include interparticle collisions.
For spherical particles that are smaller than the Kolomogorovlength scale, Maxey-Riley [83] and Gatignol [84] derived an expres-sion for the particle equation of motion which includes a descriptionof all of the relevant forces acting on the particle. These forcesinclude the buoyancy force, the force caused by the undisturbedvelocity field, the added mass force, the drag force, Basset historyforce, and Fax�en corrections. Additional studies have led to the mod-ification of this equation for applicability at higher Reynolds num-bers [85,86] and compressible flow regimes [87]. It has been shownthat for small and heavy particles (i.e., qp � qf ), the Basset force,added mass force, and undisturbed velocity field force is negligiblein comparison to the drag force and buoyancy force [88]. One of thekey challenges in using the Euler–Lagrange method for two-way andfour-way coupled systems comes from the dependency of the dragforce on the undisturbed or unladen carrier-phase flow field. Thecomputation of the Stokes drag on a particle depends on the particlevelocity along with the undisturbed carrier-phase velocity at the posi-tion of the particle. However, the presence of the particle inherentlyadds a disturbance to the undisturbed carrier-phase velocity field,consequently contaminating the flow field. Recent studies have pro-posed various methods to estimate the undisturbed carrier-phasevelocity field [89–91].
In regards to the accuracy of the Euler–Lagrange methods, it isimportant to note that there are various levels of modeling fidelityin terms of the carrier-phase flow field solution. As mentioned inthe previous section, DNS is capable of resolving all of the scalesof carrier-phase fluid motion. Thus, the highest-fidelityEuler–Lagrange method is known as point-particle direct numeri-cal simulation (PP-DNS). Unlike PR-DNS, the interphase transferbetween the dispersed and carrier phase must be modeled insteadof explicitly resolved. A review by Mehrabadi et al. [92] com-pares the efficacy of PP-DNS models to PR-DNS.
When a filtering function is applied to the Navier–Stokes equa-tions, the smallest scales of motion in the fluid phase are modeledwhile the larger scales are directly resolved. This method is com-monly referred to as a point-particle large eddy simulation (PP-LES). Aside from requiring a model to close the subgrid stresstensor in the Navier–Stokes equation, PP-LES has additionalterms which require subgrid models in the particle equation. Somestudies have suggested that the subgrid scales in the fluid velocitydo not significantly impact the motion of the particles, thus allow-ing the subgrid model in the particle equation of motion to beneglected [93,94]. However, Kuerten and Vreman [95] show thatfor larger particle relaxation times, the subgrid models cannot beneglected due to their significant impact on turbophoresis. Kuerten[96] provides a thorough review of the various subgrid models forPP-LES along with a review on PP-DNS methods.
The simplest of all the Euler–Lagrange methods is point-particle Reynolds-averaged Navier–Stokes (PP-RANS). In PP-RANS, a statistical description of the carrier-phase flow is usedand as such, significant computational savings are earned. While
Applied Mechanics Reviews JULY 2021, Vol. 73 / 040801-9
Dow
nloaded from http://asm
edigitalcollection.asme.org/appliedm
echanicsreviews/article-pdf/73/4/040801/6733986/am
r_073_04_040801.pdf by University of C
incinnati user on 30 July 2021

requiring significantly less computational efforts than PP-LES orPP-DNS, PP-RANS requires additional models to include theeffects of turbulence. Stoichastic dispersion models are requiredto determine the effects of turbulence on the particles motion.
The treatment of collision modeling is an additional method usedto categorize Euler–Lagrange methods. For moderately dilute anddense suspensions, the two Euler–Lagrange methods are the discreteparticle model (DPM) and the discrete element method (DEM).DPM makes use of the hard-sphere collision model whereas DEMmakes use of the soft-sphere model. Both hard-sphere and soft-sphere models will be discussed in detail in Sec. 3.3.
3.2.5 Eulerian Methods. While there have been some studieswhich have used the Lagrangian point-particle approach to simu-late particles that are larger than the Kolomogorov length scale,there still remains a question of its validity given the mathematicalformulation of the point-particle approach [97]. In addition, whileEuler–Lagrange simulations can give a detailed history of particletemperature and mass change, these methods become computa-tionally intractable for systems which have to track a very largenumber of particles. As such, the only other method aside fromparticle resolved methods which can simulate particles that arelarger than the Kolomogorov length scale and also have a rela-tively low computational cost are Euler-Euler methods. There aretwo distinct Euler-Euler methods for particle-laden flows: the one-fluid (equilibrium) method and the two-fluid model. In both ofthese Euler-Euler approaches, particles are no longer representedindividually but as a continuous fluid media. The Euler-Eulermodels are developed from a kinetic theory of gasses approach inwhich the molecules are handled statistically. This leads to a sys-tem of particle differential equations which represent the gas as acontinuum media. The downside to using an Euler-Euler approachis that it results in additional modeling requirements due to clo-sure problems as a result of the statistical problem formulation.
In the one-fluid approach, particles are assumed to be suffi-ciently small that their motion is dictated by the surroundingcarrier-phase fluid. The density of the fluid in this approachdepends on the mass-fraction of the dispersed phase and the veloc-ity is expressed as a function of the Stokes number and localcarrier-phase velocity. This method requires only the momentumand energy equations of the carrier-phase to be solved along withthe equation for particle concentration [11]. While this approachbenefits from its computational simplicity, it is limited to suspen-sions with very low Stokes numbers [98–100].
For larger Stokes number flows, the two-fluid approach is moreappropriate. In this approach, the dispersed phase is representedby particle concentration and velocity such that momentum andenergy equations are solved for both the carrier phase and the dis-persed phase. To couple the phases, source and sink terms areused to account for momentum and energy transfer. The two-fluidmodel approach is often employed to simulate fluidized beds[101–103] and riser columns [104,105]. Other studies, such as theone performed by Moreau et al. [106], developed an Euler-EulerLES approach to simulate dilute suspensions in homogeneous iso-tropic turbulence. Masi et al. [107] used an Euler-Euler DNSapproach to examine particle-laden turbulent flows in very dilutesuspensions. Kartushinsky et al. [108] applied a RANS-basedEulerian method to study finite-sized neutrally buoyant solid par-ticles in pipe flow. In a study by Chen and Wang [109], the effi-cacy of the two-fluid method for impinging gas–solid jets wasexamined in comparison to Euler–Lagrange approaches. Theydirectly compared the two-fluid method to both DPM and DEM,concluding that two-fluid model failed to predict the particle tra-jectory crossing effect in dilute systems.
3.3 Particle Collisions
3.3.1 Description of Particle Collision and Particle-WallInteractions. In moderately dilute suspensions, particle–particleand particle-wall collisions play an important role in the dynamic
behavior of the flow. It is, therefore, necessary to understand boththe primary transport mechanisms and collision mechanics thatoccur in particle-laden flows. For very small particles (i.e.,dp < 1lm), particle collisions occur primarily due to randomBrownian motion. For particles with a small Stokes number, colli-sions can occur due to particles following streamlines at differentpositions in the flow field. In laminar flows, particles with differ-ent settling velocities can lead to collisions. In turbulent flows,particle inertia can lead to particles deviating from streamlines,preferentially concentrating, and colliding. For large particleswith large Stokes numbers in turbulent flows, particle collisionsoccur as particles are displaced by the various turbulent eddies.While Meyer and Deglon [110] provide a comprehensive list ofthe various collision mechanisms and corresponding models, thefocus of collision modes in this paper is on accelerative mecha-nisms found in turbulent flows.
In this regime, early theoretical work by Davis et al. [111] indi-cates that the Stokes number is a key parameter governing particlecollisions. When oblique particle-wall collisions occur, Maw et al.[112] showed that particles can either fully stick to the surface,partially stick and slide over the surface, or completely slide overthe surface. As such, dry collisions require the coefficient of resti-tution as the primary input parameter to predict the outcomes ofparticle–particle and particle-wall interactions. Additional workby Yamamoto et al. [113] found that interparticle collisionsencourage transverse mixing which in turn leads to a flattening inthe particle velocity and particle concentration profiles. They alsofound that interparticle collisions play a significant role in thenear-wall region, specifically in the dispersion of particles in thetransverse direction.
For liquid–solid or “wet” collisions, the effects of interstitialfluid between colliding objects become significant and an effec-tive coefficient of restitution must be used to account for viscousdissipation and the kinetic energy that is required to displace thefluid between the colliding surfaces. Barnocky and David [114]studied the rebound of particles colliding with a wall overlaidwith a viscous fluid while Gondret et al. [115] examined particle-wall collisions of fully immersed walls. In these works, the coeffi-cient of restitution was presented as a function of Stokes number.It was shown that for low Stokes number, particle energy duringcollision is dissipated into the surrounding fluid, and no reboundis observed. However, for larger Stokes numbers the coefficient ofrestitution becomes strongly dependent on the particle Stokesnumber. Additional studies by Joseph et al. [116,117] examinedthe approach and rebound of heavy particle-wall collisions in vis-cous fluids and found the same Stokes number dependency ofcoefficient of restitution. Yang and Hunt [118] performed experi-mental studies of fully immersed particle–particle collisions andfound similar correlations to particle-wall collisions. Lubricationeffects caused by the interstitial fluids are difficult to numericallyresolve due to excessive grid refinement requirements, however,Glowinski et al. [59] were able to directly capture the motion ofthe interstitial fluid. Nevertheless, lubrication models are oftenused to quantify the short-term hydrodynamics in wet collisions[81,119,120].
3.3.2 Collision Physics of Molten Sand Particles. Droplet col-lision of liquids such as water and hydrocarbons relevant to pro-pulsion applications has been extensively studied in the past andthe detailed collision dynamics, atomization, and breakup regimesare fairly well established [121–124]. However, not much wasknown about the collision physics of molten sand particles untilthe recent studies on equal and unequal binary collision of CMASdroplets conducted by Ganti et al. [125,126]. The primary differ-ence between CMAS droplets and other fluids that have beeninvestigated in the past is the extremely high surface tension, den-sity, and viscosity of molten sand particles, and even though theeffect of viscosity on droplet collision has been studied in the past[127,128], CMAS viscosity and surface tension is at least two
040801-10 / Vol. 73, JULY 2021 Transactions of the ASME
Dow
nloaded from http://asm
edigitalcollection.asme.org/appliedm
echanicsreviews/article-pdf/73/4/040801/6733986/am
r_073_04_040801.pdf by University of C
incinnati user on 30 July 2021
orders of magnitude higher than any liquid studied in theliterature.
Ganti et al. [125] used a volume-of-fluid-based direct numericalsimulation approach to investigate how molten sand particlesinteract at operating conditions representative of contemporarygas turbine combustion chambers, for head-on, off-center, andgrazing configurations. For equal droplets, it was found that forhead-on and off-center collisions, due to the high Laplace number,the droplets coalesce into a pear-shape in the former and astretched rotating structure with lobes at the end in the latter. Sep-aration was observed for grazing binary collisions. The dropletcollision physics was quantified using the evolution of the kinetic,dissipation, and surface energies associated with the CMASdroplets.
In a follow-up study, Ganti et al. [126] found that when twounequal CMAS droplets collide head-on, the smaller one is par-tially consumed by the larger droplet forming a mushroom shape.To identify the effect of viscosity, a fictitious fluid with all proper-ties identical to CMAS except viscosity, reduced by a tenth, wasalso studied. It was found that head-on collision of unequal drop-lets of this fictitious fluid resulted in the formation of a thin liquidsheet that sheds ligaments and droplets in concentric circlesaround a central core. For off-center collision, it was found thatboth CMAS and the fictitious fluid result in the formation of anunsymmetrical dumbbell shape. While for CMAS droplets, thisshape remains intact, for the other fluid, due to its lower viscosity,the dumbbell stretches and breaks up forming ligaments and satel-lite droplets.
3.3.3 Collision Modeling. There have been many four-waycoupling studies which analyze interparticle collisions. Nasr et al.[129] examined turbulent channel flow with four-way couplingand found that when particle–particle collisions along with two-way coupling effects were included, particle deposition velocityincreased substantially. Kempe and Fr€ohlich [119] used IBM todevelop models for normal and oblique collisions which stretchthe collision process in time as a means of promoting large-scalesimulations of highly loaded suspensions. Haddadi et al. [130]used LBM to study the dilute suspension flow over obstacles andstudy the complex collisional interactions. Br€andle et al. [120]developed a numerical model to study short-range hydrodynamicinteractions of head-on particle–particle and particle-wall colli-sions in viscous fluids. This model accounted for lubricationeffects between precollisional gaps and was validated over a widerange of Stokes numbers. Troiano et al. [131] experimentallysimulated particle-wall interactions in dense entrained-flow slag-ging coal gasifiers. They examined the influence of particle sticki-ness, impact velocity and angle, and wall-surface properties andstructure on coefficients of restitution by characterizing theimpact-deposition-rebound dynamical patterns of particles collid-ing with a planar surface. Johnson et al. [132] use DPM-LES toexplore near-wall modeling of turbophoresis in wall-bounded tur-bulence. Afkhami et al. [133] used DEM-LES with four-way cou-pling to study the effect of particle surface energy and fluidturbulence on particle agglomeration for turbulent flow in achannel.
There are several methodologies behind modeling interparticlecollisions. One classification of particle collision modeling useseither stochastic or deterministic outcomes. In stochastic colli-sions, probability density functions are used to determine collisionoutcomes without using the particles true position or velocity[134]. Stochastic collisions benefit from computational efficiencydue to the fact that individual particle–particle collision pairs neednot be searched for at every time-step. However, the stochasticcollision method requires the particle and fluid velocity fluctua-tions to be assumed and consequently may introduce a loss in theresolution of other significant physics, such as preferential con-centration. A more common approach to collision modeling is touse deterministic methods. As the name suggests, deterministicmethods use the true particle position and velocity to determine
the collision outcomes. There are two methodologies for deter-ministic collision modeling: the hard-sphere approach and thesoft-sphere approach.
3.3.4 Hard Sphere Model. The main difference between thehard-sphere model and the soft-sphere model is in the treatment ofthe particle deformation and friction. In the hard-sphere collisionmodel, interactions between particles are event-driven such thatcollisions are processed in the time sequence in which they occur.Since the collisions are considered binary, they occur over a veryshort period of time and are described purely by impulse equa-tions. For the hard-sphere approach, only the normal coefficient ofrestitution and the friction coefficient is required to compute theoutcome of each collision. One of the most frequently used hard-sphere models for analyzing particle-laden flows was developedby Hoomans et al. [135]. Chen et al. [136] used the hard-spheremodel to study droplet-droplet collision and deposition in turbu-lent channel flow. Li et al. [137] extended this work by applyingthe hard-sphere model for particle–particle collisions in turbulentvertical channel flows. Nasr et al. [129] used the hard-spheremodel implemented by Li et al. to study the effects of various par-ticle relaxation times and mass loadings on particle deposition.Fede and Simonin [138] used the hard-sphere model with one-way coupling to study the effects that subgrid fluid turbulence hason the motion of colliding particles in homogeneous isotropic tur-bulence, specifically regarding preferential concentration. Mal-louppas and van Wachem [139] compared the hard-sphere andsoft-sphere collisions models for moderately dilute suspensions inturbulent channel flows. They found that while both soft-sphereand hard-sphere models yielded similar fluid velocity statistics,the hard-sphere modeling assumptions breakdown as the suspen-sion becomes more dense with particles.
3.3.5 Soft Sphere Model. The soft-sphere collision model wasfirst introduced by Cundall and Strack [140]. In the soft-sphereapproach, the collisions are fully resolved such that the modelcomputes the actual deformation of the particles and the corre-sponding contact forces. Soft-sphere models use fixed time stepsand are considered time-driven. When particle collisions occur,the normal forces acting on the particles are computed using amass-spring-dashpot system in which the spring stiffness anddashpot coefficients are a function of the particles elastic proper-ties. Many recent studies favor the soft-sphere modeling approachfor moderately dilute and dense suspensions. Capecelatro andDesjardins [97] applied the soft-sphere model of Cundall andStrack to a DEM-LES framework to study dense fluidized beds.While their model was able to simulate particle–particle colli-sions, they noted that additional improvements needed to be madefor particle-wall interactions. Luo et al. used PR-DNS [141] todetermine the drag force in particles in fluidized beds. Luo et al.[142] also used PP-DNS to study the effects of preferential con-centration on particle-wall interactions. Costa et al. [143] devel-oped an IBM with the soft-sphere model in order to simulatemoderately dense suspensions with finite-size particles. Theirfour-way coupling method was able to accurately capture the nor-mal coefficient of restitution as a function of impact Stokes num-ber for head-on particle–particle and particle-wall collisions.Deen et al. [144] provide a detailed review on various hard-sphereand soft-sphere methods and implementations for fluidized beds.
4 Droplet/Wall Impact
In this section, we review the literature on the outcome of theimpact of a liquid droplet on a solid substrate. This configurationis referred to as droplet/wall interaction in the following. This sec-tion is motivated by the fact that above a given temperature, mol-ten sand particles have the mechanical properties of a veryviscous liquid [145]. We use the comprehensive reviews from[146–149] as a starting point. First, we describe the phenomenol-ogy based on experimental evidence. Then, the different numeri-cal strategies to describe drop/wall interaction are reviewed.
Applied Mechanics Reviews JULY 2021, Vol. 73 / 040801-11
Dow
nloaded from http://asm
edigitalcollection.asme.org/appliedm
echanicsreviews/article-pdf/73/4/040801/6733986/am
r_073_04_040801.pdf by University of C
incinnati user on 30 July 2021

4.1 Phenomenology. One consideration for modelingdroplet/wall interaction is the implication of three differentphases: a liquid droplet impinges a solid substrate immersed into agaseous environment (Fig. 5). One of the greatest challenges is tocorrectly predict the physics at the circumferential locationswhere the three phases are in contact, the contact line. At all loca-tions along the contact line, the static state of the three-phase sys-tem is described by the Young equation
cSL þ cLG cosðhCÞ ¼ cSG (22)
where cSL, cLG, and cSG are the solid/liquid, liquid/gas, and solid/gas interfacial energies, respectively. The contact angle hC is theangle between the tangent of the liquid/gas interface on the con-tact line and the solid (see Fig. 5). It depends on the interfacialenergies and the geometrical state of the surface, which includesensitivity to the surface roughness. The liquid/gas interfacialenergy cLG is characterized by the surface tension of the phasepair, which is usually easy to determine experimentally. Thesolid/liquid interfacial energy cSL depends on each surface energyand their interaction. With large surface energy (metal, glass) theliquid usually wets the solid and has a contact angle lower than90 deg. Such surfaces are called hydrophilic surfaces. On the otherhand, on solids of low surface energy (polycarbonates, polymers),the liquid tends to minimize its contact surface and leads to a con-tact angle larger than 90 deg. These are called hydrophobic surfa-ces. As the surface energy of a dry gas is usually negligiblecompared to the surface energy of a solid, the solid/gas interfacialenergy cSG is assumed to be equal to the solid surface energy[150]. For dynamic systems, i.e., when the liquid is in motion, it isnecessary to take into account the usual terms of theNavier–Stokes equations, such as pressure, inertia, and viscosity,to accurately predict the motion of the contact line. Moreover,when the solid is heated, the liquid can vaporize, which addsanother degree-of-freedom. Also, in the case of continuous dropletimpingement, for example, when a spray impinges a surface, athin layer of liquid can already be present at the moment of theimpact.
Hence, we separate the outcomes of a single droplet impact ona wall into three main categories. First, if the temperature of thewall is lower than the boiling temperature Tb of the liquid and ifthere is no liquid on the solid prior to the impact, we define this asan impact on a cold dry wall. Second, for a wall temperature lowerthan Tb and in the presence of a layer of liquid on the wall prior tothe impact, we define this as an impact on a cold wet wall. Third,for a wall temperature larger than Tb, we define this as an impacton a hot wall. In order to illustrate all the subphenomena for thesethree impact regimes, we detail their typical sequence anddescribe each of the steps in the following.
4.1.1 Impact of a Single Droplet on a Cold Dry Wall. Weconsider here droplets of large Stokes number, i.e., with a velocitysignificantly different from the velocity of the surrounding gas.The relative velocity leads to the deformation of the droplet priorto the impact. The deformation depends mainly on the density andthe viscosity of the liquid and gas, and the surface tension of thedroplet. The shape of the droplet has a significant influence on theimpact [154]. When the distance between the droplet and the walltends to zero, a lubrication flow is established. This leads to astrong increase of the pressure (lubrication pressure) whichdeforms the droplet before it effectively touches the wall. An airpocket can be entrapped in this zone, leading to a bubble. Thiseffect was originally observed by Refs. [155] and [156] on a solidsurface and a liquid pool, respectively, and later extensivelyreviewed by Ref. [148]. When the velocity of the droplet is suffi-ciently low (We< 4) the droplet can even rebound on an air layerwithout effectively touching the substrate [157], even on hydro-philic surfaces [158].
Depending on the impact energy, several different scenarios arepossible. These are illustrated in Fig. 6. For sessile droplets, i.e.,
droplets gently deposited on the surface (Fig. 6(a)), the dropletsticks to the surface with a contact angle hC lower (resp. larger)than 90 deg on hydrophilic (resp. Hydrophobic) surfaces. For lowimpact energy (Fig. 6(b)), as the droplet moves toward the wall, itconstantly deforms and starts to spread on the substrate. Becausethis early phase of the impact is only determined by the kinematicconditions of the impact (droplet velocity and diameter) and is notaffected by the mechanical properties of the liquid, it is called thekinematic phase [159]. During this phase, the spreading surface isroughly equal to the area of a slice of the droplet in a horizontalplane at the contact surface while the droplet is predominatelymoving in a direction normal to the impacted surface, i.e., beforethe droplet starts to spread radially.
Then comes the spreading phase, in which the liquid furtherspreads away from the impact zone, but now in the form of a thinfilm, called the lamella. The outermost part of the lamella isthicker than the rest of the thin film and constitutes the lamellarim. The dynamics of the lamella and the rim where originallyinvestigated by Yarin and Weiss [160] and later by Roisman et al.[161]. Spreading is controlled by the mechanical properties of theliquid, the impact energy, and the wetting properties of the sub-strate such as the interfacial energy and the surface roughness.Within the spreading phase, there are different types of evolution.
First, we consider a rim free of instabilities for moderate impactenergy and a relatively smooth surface (Fig. 6(c)). When theimpact energy is dissipated, the rim can (i) further spread on thesurface due to capillarity effects for hydrophilic surface, or (ii)shrink and reduce the spread surface, in what is called the reced-ing phase. Extreme cases of the receding phase have beenobserved, in which the lamella retracts and reforms a sphericaldroplet and can even produce a partial or total rebound fromhydrophobic surfaces [159,162]. Note also that during the reced-ing phase, the liquid can fragment in what is called recedingbreakup.
With an additional increase in the impact energy, the surface ofthe rim can destabilize into digitations (fingering effect, Figs.6(c), 6(d)) [163]. The formation of fingers further dissipates theimpact energy. In turn, fingers can destabilize and produce drop-lets that stick to the surface. The fingering effect is typically theprecursor of splashing.
For still larger impact energy, splashing occurs, which corre-sponds to the fragmentation of the incident droplet and the partialremission of secondary droplets, with a partial liquid deposition.Note that for an engineering-oriented model, splashing re-injectsliquid into the cavity where the droplet comes from.
Splashing can be broken into several classes. First, the promptsplash is a disintegration within the first instants after impact(Fig. 6(d)). This regime is promoted by surface roughness overtwo different scales: small roughness amplitudes enhance lamelladestabilization while large amplitudes drive the disintegrationmechanism [163].
Finally, for much larger energies (Fig. 6(e)), the lamelladetaches from the substrate and destabilizes in the ambient gas,leading to a so-called crown, which disintegrates into the fingers.It is called the corona splash, and it is also promoted by a hydro-philic surface. In this regime, the viscosity has a major influenceon the outcome [164], as it avoids the detachment of lamella from
Fig. 5 Illustration of the contact angle hC and the interfacialforces at the contact line of a static droplet
040801-12 / Vol. 73, JULY 2021 Transactions of the ASME
Dow
nloaded from http://asm
edigitalcollection.asme.org/appliedm
echanicsreviews/article-pdf/73/4/040801/6733986/am
r_073_04_040801.pdf by University of C
incinnati user on 30 July 2021

the substrate. A decrease in the ambient pressure tends to suppressthe formation of the crown [165].
4.1.2 Impact of a Single Droplet on a Cold Wet Wall. When aliquid film already covers the substrate prior to the impact, it addsanother degree-of-freedom to the problem, and additional phe-nomena need to be considered. The characteristic parameter is thefilm thickness, usually given in a nondimensional form, asd ¼ hf =D. The ratio of film thickness to the roughness amplitudealso influences the outcome [166]. For d > 4, the effect of thewall is not visible and the film is referred to as a deep pool [167].By increasing the impact of energy, the succession of regimes isas follows [168]. At low impact energy, the droplet rebounds fromthe film. When the energy increases, the droplet is deposited andcoalesces with the film. An upward jet can be observed for a suffi-ciently deep pool. For larger energy, a crater is formed on the sur-face of the liquid, which can lead to a dry patch for hydrophobicsurfaces. The most visible effect is the onset of a crown of liquidwith a vertical upward velocity, also known as a jetting flow, orsymmetric uprising sheet. This crown then destabilizes in an azi-muthal instability and fragments into secondary droplets. Thistype of splash on a dry surface is called a corona splash (Fig. 7).At an equal level of energy, a central uprising jet can be alsoobserved.
4.1.3 Impact of a Single Droplet on a Hot Wall. When thesolid substrate is heated, the temperature of the wall Tw addsanother degree-of-freedom. Below the saturation temperature Tsat,no significant change of regime compared to the impact on a coldwall is observed, except the modifications of the liquid propertiesdue to the change of temperature. Above Tsat, the wall is usuallyconsidered to be dry, as the liquid remaining from a previousimpact is expected to have completely vaporized. When the tem-perature is between Tsat and the critical heat flux (CHF) tempera-ture TCHF, vaporization influences the outcome. In case of lowimpact energy, vaporization favors the droplet rebound. Duringthe spreading phase, the liquid film enters a nucleate boilingregime. This leads to a mixed regime where the film breaks updue to the dry patches and due to a possible receding phase. For ahigh-impact energy, the droplet splashes in this regime are similarto those of the impact on a cold wall. At TCHF, the heat flux fromthe substrate to the film is maximum. For a temperature betweenTCHF and the Leidenfrost temperature TL, the boiling regimeevolves to a transition boiling. For T TL, the evaporation is sostrong that it generates a cushion of vapor which insulates the liq-uid from the substrate. This is called the Leidenfrost regime. Inthis regime, the droplet rebounds and stabilizes onto the vaporcushion (Leidenfrost droplets) for low impact energy. For moder-ate impact energy, the droplet rebounds and boils at the sametime, leading to the regime of explosive detachment and reflectionrebound. For larger energy, the explosive rebound occurs with
tiny secondary droplets that are ejected upward [169]. For evenlarger impact energy, the droplet splashes. At these high tempera-tures, radiative heat transfer should be considered [147].
The duration for complete evaporation of a drop (the evapora-tion time) is representative of the strength of the heat transferprocess. It is a nonmonotonic function of the wall temperature(Fig. 8) where the local minimum and local maximum depict theCHF and the Leidenfrost point, respectively. TCHF is reported tobe insensitive to impact conditions whereas TL varies with theimpacting droplet diameter and velocity (magnitude and impactangle) and surface roughness. The droplet diameter is reported tohave negligible effects on TL [170] while some other authors[171] observe an increase of TL with drop size. Depending on itsmagnitude, the impact velocity decreases [172] or increases [173]TL.
4.1.4 Non-Newtonian Effects. When the impinging liquid hasNon-Newtonian rheological properties, most of the studies in theliterature focus on the spreading phase [174–176] or on antire-bound properties [177,178] for impacts on a dry cold wall. Indeed,the addition of a polymer to a Newtonian liquid can drasticallyreduce the occurrence of rebound on a hydrophobic surface andmodify the dynamics of the contact line [175], which is a competi-tion between surface tension and normal stress inside the liquid.Also, droplets of shear-thinning liquids have been studied [176]and shown to exhibit different receding motions than droplets of aNewtonian liquid.
4.1.5 Impact of a Real Spray, Droplet/Droplet Interaction.When a real spray impacts a wall, the mechanisms involved are acombination of isolated droplet/wall and droplet/droplet interac-tions. One difficulty when describing spray/wall interaction is thatno superposition principle can be applied to the spray droplets.Nonlinearities brought to the spray/wall impact by drop/dropinteraction prior to the impact [179], during the impact (lamellasinteraction leading to uprising jets, asymmetric corona splash[161]), and after the impact (secondary droplets coalescence)increase the complexity of the process.
Additional droplet-droplet parameters are derived to character-ize the spray regime. These are the length between two droplets attheir impact location lspacing and the normalizing time scalebetween two consecutive droplets sci. A phase parameter / ¼2psci determines if two consecutive droplets impact the wall atthe same time (/ ¼ 0 deg) [180] or one after each other(/ ¼ 180 deg) [160]. For lspacing> 0, two spreading lamella mayinteract, even though it was observed that for lspacing < 2D0 thecrown formation was inhibited. For lspacing < D0, the two dropletswould coalesce [181]. Interested readers are referred to [182].
Macroscopic models are used to recover the global spray/wallinteraction. The main values of interest are the deposited mass,secondary drop size distribution, and the extracted heat from the
Fig. 6 Overview of the different outcomes of droplet impacting a cold dry wall, depending on the impact energy, from[151–153]. Reprinted figures from Xu, L., Physical Review E, 75(5) p. 056316, 2007. Copyright 2007 by the American PhysicalSociety, and from International Communications in Heat and Mass Transfer, 88, Gao M., Kong P., Zhang L.-X and Liu J.-N., pp.262–268 Copyright 2007, with permission from Elsevier. Sphil and Sphob refer to a hydrophilic and hydrophobic surface,respectively.
Applied Mechanics Reviews JULY 2021, Vol. 73 / 040801-13
Dow
nloaded from http://asm
edigitalcollection.asme.org/appliedm
echanicsreviews/article-pdf/73/4/040801/6733986/am
r_073_04_040801.pdf by University of C
incinnati user on 30 July 2021

surface in the case of hot wall impacts. Correlations on these aregiven in the next sections.
4.1.6 Impact Regimes of CMAS Particulates in Engine-LikeConditions. Due to the extreme conditions of pressure, tempera-ture, and space constraints, it is extremely difficult to obtainexperimental visualizations of CMAS particulate impacts inengine-like conditions. Prior to the combustion chamber, particu-lates are too cold to behave like liquid so that droplet-like impactregimes of CMAS can be considered only for molten sand in thecombustion chamber and in the turbine. According to Table 3, forparticulates between 3 and 30 lm, the Weber number is between300 and 3000 and 3000 and 30000 in the combustor and turbine,respectively, which corresponds to very high impact energy andshould lead to corona splash, as depicted in Fig. 6.
However, recent numerical simulations [183] showed that amolten sand particle smoothly deforms during impact, barelyspread and does not splash at all, which corresponds to Fig. 6(a).The reason for this discrepancy is the extremely high viscosity ofmolten sand (�5Pas) which leads to a very large Ohnesorge num-ber (Oh � 30) compared to the usual experimental conditionswith water or oil droplet impact (Oh � 0:1).
The physics of a droplet impact characterized by very largeWeber and Ohnesorge numbers is that inertia overpowers surfacetension (large We) and that viscosity overpowers inertia and sur-face tension. Since these conditions are very rarely met, the litera-ture is rather scarce on this topic, and to the authors’ knowledge,no experimental observations of impacts for droplets with highWeber and high Ohnesorge number have been published. Con-cerning heat transfers, since the boiling point of sand (2500 K) isfar above the typical wall temperature of combustor tiles and tur-bine blades, the impact regime can be always considered as on adry cold wall.
4.2 Direct Numerical Simulation of Droplet/Wall Interac-tion. The main objective of the DNS of droplet/wall interactionsis to obtain detailed insights into the physics of droplet impact.Thus, DNS is regarded as a numerical experiment. In this case,the computational domain is limited to the close vicinity of theimpact. The dynamics of the liquid phase are captured bythe high-resolution solution of the Navier–Stokes equations andthe kinematics of the interface are described by interface captur-ing methods.
One of the greatest challenges in such direct numerical simula-tions is to predict correctly the moving contact line [184], whichupon the assumption of nonslip condition at the wall leads to adivergence of the stress, and needs to be relaxed by a slip velocity[185]. Moreover, the effect of the surface tension between the liq-uid, the gas, and the substrate must be accounted for. Theseaspects are governed by the balance of forces at the contact line.This requires that either the advancing/receding contact angles orthe interfacial energies of each pair of phases are known. Thedetermination of both of these is experimentally cumbersome.The surface roughness, which is of very small amplitude, is alsocomputationally expensive to resolve as it is necessary to decreasethe space resolution.
The two most popular approaches are the volume of fluid(VOF) and the Level-Set (LS) methods. In the VOF approach, the
Navier–Stokes equations are solved for a single-phase whosemechanical properties are a blend of the two phases based on thevolume fraction aV of the liquid. The volume fraction is then com-puted by a transport equation of aV. This approach has showngood qualitative agreement with experiments for the spreadingregime [186,187]. The VOF method can capture air entrapment[188] and the dynamic contact angle [189,190], and can beapplied to liquid films [191] or deeper pool [192] impingements.Also, the force generated on the wall by droplet impact has beenstudied [193], as has heat transfer, vaporization, and boiling[194]. The main advantage of this method are that it inherentlyconserves mass, whereas its main drawback is that the interface isnot explicitly computed. This is particularly detrimental forphysics related to the interface, which is the case for the surfacetension effects. Therefore the interface must be reconstructedbased on the distribution of aV, which leads to additional computa-tion costs [195].
In the LS approach, the interface is explicitly resolved by atransport equation of a signed-distance function / to the interface,which allows for accurate capture of interfacial effects. Thisapproach was originally developed by Sethian [196] and adaptedto ensure mass conservation with a moving contact line by Spelt[197]. The LS has been used to investigate the impact of a liquiddroplet on a solid cold wall [198–201] and a liquid film [202].Additionally, heat transfer was predicted [203–208] in which boil-ing and/or vaporization were taken into account.
The VOF and LS methods can be coupled to profit from theadvantages of both methods, with what is referred to as CLSVOF[209]. This has successfully been applied to impacts on solid walls[199] and on liquid film [210], with heat transfer [211–213].
In the last two decades, three new approaches have beenadapted to multiphase flows and successfully applied to droplet/wall impact. First, is the Lattice-Boltzmann Method (LBM,described in Sec. 3.2.3), in which the multiphase flows are takeninto account by several strategies [214–216]. As with the afore-mentioned approaches, LBM originally shows numerical
Fig. 7 Early phase of the corona breakup, from [151]
Fig. 8 Evaporation time versus the wall temperature, from[149]. Reprinted from International Journal of Heat and MassTransfer, 106, Liang G., Mudawar I., pp. 103–126 Copyright2007, with permission from Elsevier.
040801-14 / Vol. 73, JULY 2021 Transactions of the ASME
Dow
nloaded from http://asm
edigitalcollection.asme.org/appliedm
echanicsreviews/article-pdf/73/4/040801/6733986/am
r_073_04_040801.pdf by University of C
incinnati user on 30 July 2021

instabilities in case of large density or viscosity ratios [217], but anew approach has shown promising results for a density ratio ofup to 1000 [218]. Note that according to Tables 1 and 2, a densityratio of 1000 is sufficient to simulate CMAS particulates in all thecomponents of the gas turbine, except for the first stages of thecompressor where the gas density is too low. As it is a diffuseinterface approach, this method is not subject to a singularity dueto the moving contact line. Impacts on a drywall [219–224] aswell as on a liquid film [225] have been investigated. Heat transferas droplets impacts a solid surface has also been studied [226].
The second approach, the smoothed particle hydrodynamics(SPH) method, is a meshless approach where the discretizing ele-ments (referred to as particles) are points moving at the fluidvelocity [227]. Each element carries its physical quantities (mass,volume, energy). In this case, the motion of the particles is deter-mined by solving the Navier–Stokes equations for each particle inits Lagrangian frame of reference. In order to simulate multiphaseflows, each particle is given a specific type of fluid (e.g., liquid orgas) and the corresponding mechanical properties. These proper-ties are maintained throughout the simulation. The particles rear-range themselves according to the physics resolved by theNavier–Stokes equations. The interface is implicitly determinedas the frontier between ensembles of particles of a different types.The most popular approach for including surface tension is anadaptation of the Continuum Surface Force model [228] in theSPH formulation [229]. The advantage of the SPH method is thatno meshing step is required, and it can simulate large interfacedeformations without a priori knowledge of the deformations.Also, when the influence of the carrier gas is negligible, only theliquid and walls need to be simulated to study droplet/wallimpacts. One of the limitations of this method is that the interpar-ticle distance must be kept constant in order to achieve a highcomputing performance. This is equivalent to performing a simu-lation with a homogeneous mesh.
It is possible to implement this approach and allow for varyingparticle distances, but this leads to a more complicated implemen-tation of the method [230]. Moreover, as a Lagrangian method, itis subject to specific types of instabilities (tensile and pairinginstabilities) which require stabilization terms that can alter thephysics. Because it does not require any mesh, this method is con-venient for resolving the surface roughness. To this aim, thespreading of a sessile droplet was investigated by Li et al. [231]and by Shigorina and Tartakovsky [232] on porous and roughsurfaces, respectively. Concerning liquid film impingement, Xuet al. [233] studied the interaction of two droplets in parallel andin series, and the effect of the film thickness has been investigatedby Ma et al. [234] and by Yang et al. [235]. The shape and out-comes of the impinging droplet were investigated by Yang andKong [236] and Ray et al. [237]. Yang et al. [238] studied theinfluence of the wall temperature where the liquid vaporizationwas taken into account. The SPH method has also been employedto study viscoelastic effects, examining two-dimensional dropletsimpacting an inclined plate [239], and symmetric droplet impactsin three-dimensional [240]. Recently, the high-velocity impact ofmolten sand particulates having spherical and cubic shapes wasinvestigated with the SPH method [183].
Finally, the third approach is the phase-field approach, whichbelongs to the interface-capturing family of VOF and LS methods,where the indicator of the phase interface / (as in the LS method)is computed by a transport equation incorporating physical effectsat the thin interface [241]. In this approach, the indicator / isattributed physical properties, such as those derived from gradientflows of the Ginzburg-Landau-Wilson free energy functional,which offer interesting properties for two-phase flow modeling.Ding et al. [242] proposed an approach to use the phase-fieldmethod in two-phase flow of large density and viscosity ratio,illustrated by the simulation of rising bubbles and Rayleigh-Taylor instability. Mirjalili et al. [243] showed that VOF outper-forms phase field methods at the same resolution, but for the samecomputational cost, and both methods have comparable accuracy.
Very recently Mirjalili and Mani [244] proposed a consistent andenergy-conserving momentum transport and a promising free-energy surface tension force scheme. The three-dimensionalimpact of a liquid droplet on a solid surface was simulated withthe phase-field method by Zhang et al. [245], and additional solid-ification during the impact was taken into account by Shen et al.[246].
4.3 Lower-Order Models. The objectives of using lower-order models are to model the outcome of droplet/wall interac-tions without a strong focus on the phenomenon itself, but ratherto facilitate having the outcome of the phenomenon embeddedinto a larger simulation involving a cascade of physical phenom-ena including droplet/wall interactions. A typical example is thecase of a spray flame in a combustion chamber or a piston engine,which requires that a large spectrum of physics, such as atomiza-tion, turbulence, phase change, thermal transfers, chemistry, andcombustion, be taken into account. In this case, the liquid dropletsof the fuel spray may impact the piston as well as the walls of thecylinder and may create a liquid film. Due to the different lengthscales, which range from a few micrometers (smallest droplets) todozens of centimeters (diameter of the cylinder for a regular carengine), the DNS of this configuration is prohibitive for current-day supercomputer capabilities. Hence, the droplet/wall interac-tion must be modeled.
4.3.1 State of the Art. The typical approach is an Euler/Lagrangian simulation where the carrier phase and the dropletsare represented by an Eulerian field and Lagrangian particles,respectively. When a particle impacts the wall, the outcome isgiven based on ad hoc models or correlations presented later.Depending on the conditions of the impacting droplet (kineticenergy, viscosity) and on the local surface state (temperature,presence of liquid film, roughness), the ad hoc model will predictdifferent outcomes. These are mainly rebound (only the particlevelocity is modified), splashing (new particles are created), andspreading. In the later case, a thin liquid film is formed and needsto be modeled. Very often, the film is thin enough that its attrib-utes can be averaged over its height, leading to a two-dimensionalmodel. It can be described by either Lagrangian or Eulerianapproaches. In the former, the film is described by film particlesthat carry the conservative quantities, while in the latter, addi-tional local wall variables are used to store the characteristic quan-tities of the film. In both cases, a specific wall film solver isrequired. Such models are typically used in internal combustionengines where the spray is treated as Lagrangian particles and thefilm is either Eulerian [247–249] or Lagrangian [179,250–253].Depending on their level of sophistication, these models accountfor phenomena related to mass conservation (boiling, dropletimpact, film striping), momentum conservation (inertia, transferwith gas, and impacting droplets), and energy conservation (heattransfer, boiling). Wall film and splashing low order models havealso been applied to gas turbine configurations [254]. From anumerical point of view, it is important to take into account that ina Lagrangian framework, one parcel (i.e., a numerical particle) isrepresentative of a large number Np of physical droplets sharingthe same properties. This is done to limit computational overhead,which would be prohibitive if all droplets were represented indi-vidually. On the other hand, if Np is too large, then the simulationwould be made of very few parcels, and the dispersion of thespray properties (mainly size and velocity) would be under-resolved. Hence, Np must be chosen to reach a tradeoff betweencomputational cost and statistical resolution of the spray and itsoutcome after impingement. Note that due to the discrete natureof the wall splashing, an approach based on an Euler descriptionof the liquid phase is tedious. Nevertheless, such attempts arefound in the context of wing impingement by subcooled droplets[255–257]. Note that in principle, the same approach could beused to investigate impacts of subcooled droplets on rotating fanblades.
Applied Mechanics Reviews JULY 2021, Vol. 73 / 040801-15
Dow
nloaded from http://asm
edigitalcollection.asme.org/appliedm
echanicsreviews/article-pdf/73/4/040801/6733986/am
r_073_04_040801.pdf by University of C
incinnati user on 30 July 2021

4.3.2 Regime Maps. In order to rationalize the outcome ofdroplet/wall interactions, regime maps are drawn based on theimpact energy, the wall temperature, and the film thickness, withthreshold values used to set the limit between different outcomes.The most complete regime map, shown in Fig. 9, is from work byMa et al. [253]. The different regimes described in Sec. 4.1 arerepresented. The main parameters are the impact energy (y-axis)and the wall temperature (x-axis). (In this figure the Leidenfrosttemperature TL is given as Tleid and nondimensional wall filmdepth d is given as H). On the right part of the regime map,where the regimes related to wet surfaces are depicted, the filmthickness is used instead of the surface temperature for the x-axis.The threshold criteria between regimes are expressed in terms ofcorrelations depending on droplet properties and the state of thesurface. There is strong consensus for some of the thresholds,while both the values and expressions of others remain the subjectof much debate. Here, we review the most used/agreed-uponthresholds.
In the dry case, at Tw < Tsat, the limit between stick and spreadis usually found around We¼ 5 [248,253]. From an engineeringperspective, the separation between spread and splash (K1) is themost important and consequently, it was thoroughly investigated.Its main correlations are given in Table 4, where R refers to thenondimensional roughness (Ra=Dp). As mentioned, there are sev-eral different expressions of this threshold.
The threshold K2 is found when the value of the Ohnesorgenumber is constant and equal to 0.00446 [253] whereas otherauthors stated it depends on the ambient pressure and surfaceroughness [152]. This question is thoroughly treated in Ref. [148].For impacts of hot surfaces (Tw > Tsat), the map from [253](Fig. 9) assumed a threshold between spread and splash as inde-pendent of temperature. However, a more sophisticated thresholddepending on temperature is proposed by Staat et al. [260], asdepicted in Fig. 10. It can be approximated as
K1 ¼ We ¼ f1ðTwÞ for Tw < Tleid (23a)
K3 ¼ We ¼ f2ðTwÞ for Tw > Tleid (23b)
where f1 and f2 are arbitrary functions. Note that the value ofK3ðTw > TLÞ still varies significantly depending on authors, asillustrated in Table 5.
On a wet wall, the nondimensional liquid film thickness d ¼hf=D is substituted for the surface temperature as a driving param-eter. The rebound/deposition threshold was investigated by Panet al. [264] and is summarized in Table 6.
There is a continuous transition between the regimes of deposi-tion and corona splash, where more and more droplets are ejectedwhen the Weber number increases. Hence, the threshold K5 showslarge variability in terms of values and expressions (Table 7),which can be explained by the dependence of K5 on the film thick-ness [262]. Some authors [253] also define a threshold (K4¼1400)to mark the beginning of the smooth transition.
4.3.3 Correlations based on Spreading. The maximum spreadquantifies the contact surface between the substrate and theimpacting liquid. When a chemical reaction between the twophases is expected, the spread is of primary importance because itdetermines the progress of the chemical reaction occurringbetween the impacting matter and the substrate. It has been inves-tigated in the literature experimentally and theoretically, based onenergy or momentum conservation. An extensive list is providedin Ref. [149]. The main correlations are given in Table 8 for acold dry wall where the maximum spread bmax is expressed in thenondimensional form normalized by the impacting droplet diame-ter. Note that some correlations provide an implicit definitions ofbmax.
4.3.4 Correlations based on Rebound and Splashing. Duringthe rebound, only the velocity is modified. The simplest approach
assumes an elastic rebound which consists of changing the sign ofthe wall-normal component and conserving the tangential compo-nent. Some authors take the dissipation of the kinetic energy intoaccount by introducing a restitution factor which depends on theWeber number [261]. The outcome of splashing is more complex.It is described by the number, the velocity, and the size of theejected droplets. An extensive list of correlations from [161,179,248,249,272–275] is provided in the review by Moreira et al.
Hence, the focus given here is on the input and output parame-ters. These models are usually built on fundamental conservationlaws. Mass is conserved, momentum is dissipated due to viscouseffects, and energy is modified to take into account the change ofsurface energy during breakup or heat transfer. Most of thesemodels predict the outcome in terms of attributes following den-sity of probabilities with coefficients that depend on the impactconditions. In this case, it is possible to obtain an acceptable sta-tistical representation of the splashing, providing a small parcelnumber Np. All of these models take as input the properties of theimpacting droplet, plus (i) the surface roughness [274] in case ofdry impact, and (ii) the film thickness [273,274] in case of wet thesurface. The velocity of secondary droplets is determined fromhybrid models based on momentum conservation and empiricalconstants related to the restitution coefficient. The typical geomet-rical basis used to express the outcome velocity consists of thewall-normal, the tangential, and the transverse component [252].Some authors also use random sample attributes drawn fromwithin a cone [248] or within an empirical reflection angle [249].The diameter of secondary droplets is expressed with a probabilitydensity function whose mean diameter and dispersion factor arecomputed based on empirical or semi-empirical correlations. Thenumber of droplets is usually chosen after the other quantities sothat the mass is conserved during the impact.
4.3.5 Correlations Based on Mass Deposited After Splashing.As an extensive list of correlations of mass deposited after splash-ing can be found in Ref. [147], we focus here on the type of inputparameters. First, the correlations depend on the impacting energy[275]. Then, depending on whether the substrate is dry [258] orwet [179,249,273,274,276,277], the roughness or the film thick-ness are taken into account, respectively. In case of hot surfaces,the temperature can be taken into account [276].
4.3.6 Correlations Based on Heat Transfer. From a macro-scopic point of view, energy conservation leads to the global heat-ing of re-emitted droplets, based on knowing the heat is extractedfrom the surface and the evaporation rate. In order to quantify theheat extracted from the wall and transferred to the secondary
Fig. 9 Regime map for droplet-based wall impingement mod-els from Ref. [253]. Reprinted from International Journal of Heatand Mass Transfer, 112, Ma T., Feng L., Wang H., Liu H. and YaoM., pp. 401–412 Copyright 2017, with permission from Elsevier.
040801-16 / Vol. 73, JULY 2021 Transactions of the ASME
Dow
nloaded from http://asm
edigitalcollection.asme.org/appliedm
echanicsreviews/article-pdf/73/4/040801/6733986/am
r_073_04_040801.pdf by University of C
incinnati user on 30 July 2021

droplets, a correlation for the Nusselt number is given. Thegeneric form of the Nusselt correlation found in Ref. [147] is
Nu ¼ a Prb Rec Wed Jae (24)
where Pr and Ja are the Prandtl and Jakob numbers. Table 9 sum-marizes the constants derived from various experiments. Note thatthese correlations were derived in the case of a complete sprayimpacting a wall, not in a single droplet/wall interaction.
5 Particle Deposition at Gas Turbine Operating
Conditions
Ingestion of sand and dust particles by gas turbine engines andparticle deposition in the hot sections of the engine is a criticalissue [282–284]. At high operating temperatures, inertial impac-tion of ingested particulates leads to melting of the particles withtheir deposition on blade surfaces as well as blade surface erosionand corrosion. Large amounts of melted deposits lead not only tostructural blade damage [16,285] (Fig. 4(a)) but also to degrada-tion of the flow path (Fig. 4(b)) and aerodynamic performanceand to blockage of the turbine blade cooling holes [13] (Fig. 4(c)).As a result, aircraft engines operating in dusty environments maybe vulnerable to significant loss of operability.
5.1 Deposition Models. The interaction of particles withsurfaces is accompanied by a range of physical processes thatdetermine the outcome of the interaction. As a particle hits thesurface, it can experience electrostatic and fluid dynamic forces.The outcome may be rebound, deposition, or partial adhesion ofthe particle, and typically involves elastic and/or plastic particledeformations. In addition, if the particle is molten or semimolten,viscous deformation will also occur. One needs to account for vis-cous and thermal boundary layer effects near the surface to prop-erly determine particle properties right before particle-surfacecollisions occur. The coefficient of restitution (Eq. (1)) is a suita-ble parameter to quantify the energy exchange between a particleand the surface. A number of empirical and physics-based modelscan be found in the literature that can be used to augment thiscoefficient for study the problem of particle-surface interactionoccurring under many different conditions. Recently, in Ref.[286] the authors showed the effect of varying Stokes number onthe impact of millions of CMAS particulates on turbine blade attransonic conditions. Physics-based models rely on material prop-erties and have relatively broad applicability to different problemtypes. However, most of these models require underlying geomet-rical assumptions to simplify computations. Empirical models onthe other hand provide a direct formulation for rebound/depositioncharacteristics and are easier to integrate with any stochasticapproach. The accuracy of an empirical model, however, is lim-ited to the configuration/data it is derived from. The early modelsdeveloped by Hamed et al. [287,288] are the classic example of
Table 4 Criterion for splashing on a dry surface
Expression Threshold References
K1 ¼We5=8 Oh�1=4 57.7 [258]K1 ¼We Oh�2=5 649þ 3:76=R0:63 [168]K1 ¼We Oh�2=5 3000 [259]K1 ¼We5=4 Oh�1=2 1500þ 650=R0:42 [179]K1 ¼ OhRe 17 [234]
Fig. 10 Detail regime map of droplet of ethanol impacting ahot dry surface, adapted from [149]. Reprinted from Interna-tional Journal of Heat and Mass Transfer, 106, Liang G., Muda-war I., pp. 103–126 Copyright 2007, with permission fromElsevier.
Table 5 Criterion for splashing on a dry hot surface
K3 ¼We References
K3 ¼ 30 [261]K3 � 23–40 [262]K3 � 14 [263]K3 < 10 [169]
Table 6 Criterion for rebound/deposition on wet surface,derived from [264]
d K6 ¼We
< 0.5 15d – 30.5–0.8 150.8–1.2 15d – 3> 1.2 15
Table 7 Criterion for splashing on a wet surface
d K5 References
– 2100þ 5880 d1:44 [168]– K1 � ½1þ 0:1
ffiffiffiffiffiffiRep
�minðd; 0:5Þ� [179]<0.1 450 [262]0.1<d <1 1043:8þ 232:6d�1
d >1 1043:8þ 232:6d�1
�1094:4d�2 þ 1576:6d�3
Table 8 Correlations on maximum spread from the literature
Expression References
ð3b2max=WeÞ þ ðbmax=1:2941Þ5=Re ¼ 1 [265]a
We/2¼ 1:5b2max½1þ 3We=Reðb2
maxlnbmax �ðb2max � 1Þ=2Þ
ðld=lwÞ0:14� � 6
[266]a
bmax ¼ffiffiffiffiffiffiffiffiffiffiffiffiffiffiffiffiffiffiffiffiffiffiffiffiffiffiffiffiffiffiffiffiffiffiffiffiffiffiffiffiffiffiffiffiffiffiffiffiffiffiffiffiffiffiffiffiffiffiffiffiffiffiffiffiffiffiffiffiffiffiffiffiffiffiffiffiffiffiffiffiffiffiffiffiðWeþ 12Þ=ð3ð1� cos haÞ þ 4ðWe=
ffiffiffiffiffiffiRepÞÞ
q[267]a
ðWeþ 12Þbmax ¼ 8þ b3max½4We=
ffiffiffiffiffiffiRep
þ 3ð1� cos hdÞ� [268]b
bmax ¼ ð0:87Re0:2 � 0:4Re0:4=ffiffiffiffiffiffiffiWep
Þ [269]c
bmax ¼ 0:61ðRe2OhÞ0:166 [270]c
bmax ¼ 1:27ðRe2OhÞ0:122ðriso=rx liso=lxÞ0:11 [271]c
Superscriptsa,b and c correspond to a correlation based on energy balance,momentum balance, and regression, respectively.
Applied Mechanics Reviews JULY 2021, Vol. 73 / 040801-17
Dow
nloaded from http://asm
edigitalcollection.asme.org/appliedm
echanicsreviews/article-pdf/73/4/040801/6733986/am
r_073_04_040801.pdf by University of C
incinnati user on 30 July 2021

empirical models designed for specific turbomachinery applica-tions. Some of the pertinent models are discussed next, with thegoal of focusing on understanding particle deposition behaviorunder hot temperature conditions like those in high-pressure gasturbine engines.
5.1.1 Critical Velocity Model. The critical velocity modelwas developed by Brach and Dunn [289]. It defines a criticalimpact velocity below which the kinetic energy of the incomingparticle is too low to overcome the adhesion bond resulting in aparticle sticking to a surface with no restitution. The criticalvelocity criteria perform reasonably well at low-velocity impactswhere adhesion forces dominate energy exchange mechanisms.The criteria however do not predict accurate particle behavior forhigh-velocity impacts [290]. Brach and Dunn [289] computed thecritical velocity using the relation
Vc ¼2Eeff
/
� �107
(25)
where Eeff is the combined elastic modulus derived from the elas-tic properties of both particle and the surface. / is the diameter ofthe particle under the assumption that the particles are spherical inshape. Critical velocity models suitable for high-temperature dep-osition in gas turbine engines are also available in the literature[291,292].
5.1.2 High-Temperature Critical Viscosity Model. A proba-bilistic critical viscosity model developed by Sreedharan and Tafti[293] can be used to identify stochastic deposition criteria for par-ticles in high-temperature conditions. The model defines a thresh-old temperature and any interacting particle with a temperatureabove the threshold temperature will stick to the surface. Whenthe temperature of the particle is below the threshold temperature,the stick probability is given by
Pstick ¼lthreshold
lT
(26)
where lthreshold is the viscosity of the particle at the threshold tem-perature and lT is the viscosity of the particle at the given temper-ature. The stick probability is governed entirely by thetemperature-dependent behavior of the particle viscosity. ForCMAS-constituted particles, there are a number of empiricalcomposition-based formulas available in the literature [294–296]that provide a good estimate of viscosity as a function of tempera-ture. Similar studies for feldspar melts [297] and coal ash [298]can also be found in the literature. Most of these studies havefound the following relationship between temperature andviscosity
loglT
T
� �¼ Aþ B
T(27)
where A and B are empirical constants that are dependent on parti-cle composition. This model is limited in its application because itdoes not account for key parameters such as particle impact veloc-ity, size, and shape while determining the criteria for sticking.Also the model does not provide any information on particle
rebound and deformation properties. Singh and Tafti [299] devel-oped a variant of this model which accounts for additional physicsby including the coefficient of restitution in the calculation ofsticking probability. This contribution to sticking probability isgiven by
Pc ¼ e�6:5c (28)
where they define c as the total coefficient of restitution deter-mined using a separate physics-based model.
5.1.3 Elastic Plastic Deformation Model. This model wasproposed by Singh and Tafti [300] and it can be used to computethe coefficient of restitution by using particle material propertiesand a combined elastic modulus. The model assumes that the par-ticle is spherical in shape and is pressed into a flat plate. The firststep of the model is to determine the distance w into the plate thatthe sphere must be pressed to exceed the particle elastic deforma-tion limit and cause the onset of plastic deformation [301]
w ¼ pCr2Eeff
� �2
rp (29)
C ¼ 1:295e0:736�p (30)
where w is the particle deflection at the onset of plastic deforma-tion, r is the particle elastic yield strength and rp is the radius ofthe particle. An energy balance is then used to obtain maximumdeflection during deformation. The two deflection parameters anda separate formulation for adhesion are then used to compute thecoefficient of restitution. The main challenge lies in the determi-nation of model parameters for application to gas turbine enginesconsidering the complexities due to the size and chemical compo-sition of particulate matter in the hot gas mixture. The particlesare also not necessarily spherical in shape [302]. Under thismodel, the criteria for sticking is determined stochastically in amanner similar to the critical velocity model with some degree ofrandomization. To predict whether the particle will stick or not,the sticking probability is defined such that it increases exponen-tially with a decrease in coefficient of restitution value. The stick-ing probability becomes unity when the coefficient of restitutionbecomes zero. A revised version of this model can be found inRef. [303]. More recently, Bons et al. [304] developed a variant ofthis model with the assumption that particles are cylindrical inshape that takes into account angular and fluid shear effects.
5.1.4 Rebounding-Sticking Model. This composite model isextended from the stochastic empirical model by Hamed et al.[287,288] to include additional physics pertaining to high-temperature deposition. The model accounts for particletemperature, size, and the impact angle to determine the behaviorof particles upon impact. This model first determines stickingprobability by constructing detailed polynomial functions basedon particle size, temperature, and normal and tangential velocity.The constants in the polynomial functions are determined throughseparate numerical simulations. More details about the stickingprobability calculations can be found in Barker et al. [305]. Onceit is determined that the particle will rebound, the model deter-mines the rebounding characteristics using a separate set offormulations.
5.2 Particle and Surface Characterization. To determinethe properties of ingested sand at engine operating conditions andpredict particulate behavior on interaction within hot sections ofthe engine, it is important to understand the sand composition.The ingested particulate matter is comprised of metal oxides andmineral compounds. Depending on the operating environment, thefollowing key dust types have been identified in the literature andtheir composition determined: volcanic ash [306,307], coal ash
Table 9 Nusselt number correlation coefficients
a b c d e References
2 0 0 0 0 [278]3.32 0.33 0 0 0 [278]4.7 0.32 0.61 0 0 [279]0.34 �0.33 �0.53 0.94 0 [280]3.4 10– 5 0 1.51 0 0.254 [281]
040801-18 / Vol. 73, JULY 2021 Transactions of the ASME
Dow
nloaded from http://asm
edigitalcollection.asme.org/appliedm
echanicsreviews/article-pdf/73/4/040801/6733986/am
r_073_04_040801.pdf by University of C
incinnati user on 30 July 2021

[302], and Arizona road dust [308]. A comprehensive technicalreport on characterization of CMAS airborne particulates [309]provides extensive experimental data on particle composition,size, and morphology. This report includes a chapter on X-ray dif-fraction (XRD) analysis for determining particle hardness andmelting point to aid in evaluating erosive potential and depositionpotential. Typically, Arizona road dust and a synthetic sand equiv-alent AFRL02 are used in experiments to simulate the behavior ofnatural sand. The temperature can reach up to 1650 �C in theengine combustor and up to 1450 �C in the initial high-pressureturbine stage creating a strongly energetic and reactive hot gasmixture. At these temperatures, the ingested particulates melt andform CMAS compounds that deposit on the hot components[27,310]. The reactive CMAS mixture is highly detrimental to theblade components. TBCs are applied to blades to protect them inthe hot gas path. These coatings are designed to have high in-plane compliance to reduce thermal stresses and low thermal con-ductivity to reduce heat transfer to the blades. Considerableresearch has been put into the development of TBC materials andtheir composition is known. TBCs developed from Yttria stabi-lized zirconia [26,311,312] are state-of-the-art and best known fortheir thermal properties. Nonetheless, molten CMAS can pene-trate into the cooler region of the coating and crystallize to alterthe desirable properties of the coating. The composition of CMASis well understood [313] and thereby multiple synthetic composi-tions are available [26] for use in experiments with desired crys-tallization properties.
5.2.1 Temperature-Dependent Properties. The accuracy ofphysics-based models depends strongly on the accuracy of proper-ties used in the models for the surface and the particles interactingwith it. The surface properties used are for the thermal barriercoatings used to protect the blade material. Considerable researchhas gone into the development of these thermal barrier coatingsand their mechanical properties are well known under a widerange of operating temperatures. However, the determination ofthe mechanical properties of ingested particle mixtures is nontri-vial. To reproduce the austere environmental conditions for theengines under laboratory settings, synthetic dust equivalents areused. The components that make up synthetic sand are derivedfrom equivalent dust/sand samples and are mainly comprised ofmetal oxides and other mineral compounds [314–317]. The bulkproperties of the synthetic sand can be obtained through a suitablyweighted summation of the individual constituent properties. Thisis an apt approach at low temperatures when the components existin a solid-state with defined mechanical properties. At high tem-perature, the components start to form molten CMAS and interactwith turbine coating surface. Availability of the mechanical prop-erties of these metal oxides in the temperature range of interest islimited. The properties of selected components such as quartz canbe found in Ref. [318,319]. They recorded the variation in density,Poisson ratio, and elastic modulus in the temperature range of20 �C to 1050 �C. Similarly, properties of Halite (sodium chlorideor rock salt) are available from selected studies [320–322].
5.3 Available Experimental Data. Different aspects of theproblem of sand ingestion have been investigated through experi-mental studies with many complemented by parallel numericalinvestigation. For example, Singh et al. [323] conducted experi-ments to investigate the impingement behavior of sand-laden flowthrough a two-pass cooling duct with ribs present. In their experi-ment, they used a particle composition equivalent to Arizona roaddust and fed the entrained flow to the duct to obtain the impinge-ment pattern on surfaces covered with an adhesive used to providea perfectly inelastic surface. The authors then conducted a numeri-cal simulation on the same duct domain for a comparative evalua-tion. They utilized wall-modeled large eddy simulation for thefluid field and Lagrangian tracking for the suspended particleswith one-way coupling between the phases. Good agreementbetween experimental and numerical impingement patterns was
obtained which helped them understand the particle flow pathsaccurately and identify higher impingement-prone surfaces withinthe duct. The survey conducted by Singh et al. [323] outlines anumber of experimental studies capable of characterizing theproblem of sand ingestion and potentially aiding in developingphysics-based deposition/erosion models to predict behavior andlosses pertaining to particle-wall interaction. The review con-ducted by Hamed et al. [13] is another thorough compilation ofthe studies covering important aspects of particle-induced erosionand deposition. Their review cites studies that have attempted todetermine the pattern of erosion, identify components most sus-ceptible to erosion, and investigate multiple factors affecting boththe rate and extent of erosion. A detailed list of erosion studies uti-lizing different blade/coating materials and various impact param-eters is also included. Their review includes numerical studiesthat have simulated particle trajectories to predict deposition char-acteristics based on empirical correlations and stochastic data.The development process of particle delivery models and deposi-tion models has been summarized alongside a discussion of parti-cle delivery and deposition rates. The authors also provided vitalinsights on engine performance deterioration associated with dep-osition and erosion backed by relevant studies. Citations fromboth these sources are significant to the scope of the current workand are discussed from here on.
Tabakoff et al. [18] computed trajectories of particles throughthe compressor and the inlet separator region of the helicopterengine. For their calculation, they utilized governing equations ofthe particle motion in the rotating frame coupled with empiricalcorrelations to determine restitution characteristics. In their analy-sis, they identified the frequency and distribution of particleimpact on the blade surfaces of stator and rotor at different stagesof the compressor. Their analysis crucially helped in locating thezones within the compressor that are most prone to erosion.Richardson et al. [324] investigated the key damage mechanismsassociated with the high-pressure compressor and established ananalytical model to predict performance losses associated withcomponent wear. Among damage mechanisms, they quantifiedthe performance reduction as the blade tip is abraded with time.They also evaluated the impact of surface smoothness degradationin their study.
Matching actual gas turbine operating conditions in experimen-tal settings is expensive with limited functionality of measurementcapabilities. Some experimental investigations of particle deposi-tion can be found at relatively moderate temperature conditionsand atmospheric pressure conditions. Lundgreen et al. [325] per-formed deposition tests at a gas temperature of 1350 �C and acombustor pressure of 135.1 kPa. Investigation of particle deposi-tion over cooled surfaces was also performed by Layrock andFletcher [326], and Crosby et al. [327] at the flow temperature ofapproximately 1400 �C and 1200 �C, respectively. Reagle et al.[328] collected high-velocity impact data for particle sizes of20� 40 lm at various impingement angles and went up to 800 �C.More recently, Bons et al. [329] carried out detailed experimentsto establish rebound characteristics of quartz particles over an alu-minum surface for a range of impact velocity and angles. A simi-lar study was carried out by Whitaker and Bons [330] to obtainthe restitution properties of coal ash and to evaluate the perform-ance of relevant particle impact models using the experimentaldata. The study done by Sacco et al. [331] investigated the effectof extreme pressure on the extent of deposition. They went up to14.6 atmospheric pressures and found that elevated pressure leadsto a decrease in a deposition. The blockage of cooling holes hasalso been investigated at the low temperatures of the order of1000 �C when some of the constituents of the sand start to meltand are susceptible to sticking.
Kim et al. [332] studied the deposition behavior of volcanicmaterials ingested in the gas turbine engine and examined howthe deposition is affected by the melting characteristics of theingested particles. They determined that the deposition rate at thevane surface increases as it starts to accumulate the material. They
Applied Mechanics Reviews JULY 2021, Vol. 73 / 040801-19
Dow
nloaded from http://asm
edigitalcollection.asme.org/appliedm
echanicsreviews/article-pdf/73/4/040801/6733986/am
r_073_04_040801.pdf by University of C
incinnati user on 30 July 2021

also observed that the deposition rate increases at elevated inlettemperature conditions due to particles undergoing partial melt-ing. Vane surface temperature was also found to play a crucialrole in governing the deposition behavior. Dunn et al. [22] arrivedat a similar conclusion when they tested series of aircraft enginesunder conditions resembling operation within dust-laden clouds.The particulate mixtures used in the testing were comprised ofsoil types mixed with volcanic ash at different proportions. Theyidentified a threshold turbine inlet temperature of 2000 �F(1093 �C) beyond which the response of the engine became signif-icantly adverse to the dust ingestion and the deposition of materialin the high-pressure turbine vanes resulted in a rapid surge inburner pressure. After the tests, the researchers noticed consider-able deposition on the leading edge of the high-pressure turbinevanes at the pressure side. Severe degradation in the form of over-heating of the vanes was also observed due to the blockage ofcooling holes.
Research conducted by Walsh et al. [283] focused primarily onflow blockages occurring in the blade and combustor liner due tothe deposition of ingested sand particles. They compared theblockage behavior at ambient and elevated temperatures in theirstudy and established a relationship between blockage extent andthe operating temperature. Compared to ambient temperatures, theresearchers observed significant blockage in film-cooling holes.They attributed the blockage to the increased stickiness of thesand due to the partial meltdown. They also found that by varyingthe pattern of the film cooling holes with respect to the impinge-ment holes, the impact of the deposition can be mitigated to a cer-tain extent. Schneider et al. [333] conducted experimentalinvestigations with accompanying numerical simulations of theflow path of ingested particles in the internal cooling air system.In their test rig, they found extensive deposits of particles in thecooling holes located in the outer cavity surrounding the rotordespite substantial centrifugal forces. The strong adhesion forceswere attributed to the van der Waals forces that relate directlywith the centrifugal forces. They used Lagrangian particle track-ing for numerically simulating the solid particles with one-waycoupling between the continuum and dispersed phases. Forsmaller particles that will follow the trajectory of the fluid flow,they were able to identify stagnation points that agreed with parti-cle deposits observed in the experiment.
5.4 Universal Model: Key Challenges. Ingestion of particu-late matter into gas turbine engines is an inevitable process that ishighly detrimental to engine performance and service life. Thesedetrimental effects will continue to grow, as the operation ofengines at higher temperatures is needed to extract greater thermalefficiency from the engine. A substantial number of experimentalstudies have been conducted to date in order to understand theparticle deposition behavior as a function of one or more systemparameters related to the particle, the surface, and the confiningenvironment. These studies have helped greatly in understandinghow specific parameters affect the deposition/restitution behaviorof the particle. These studies have also led to the development ofrelevant empirical models that have provided promising predic-tions for the specific cases they are conditioned for. However,empirical models require condition-relevant experimental investi-gations, and replicating particle-wall interactions at the extremeoperating conditions of turbomachinery in laboratory settingscomes with a considerable cost. The measurement techniquesavailable under such conditions are also expensive and limited.
Physics-based models that can be integrated with availablecomputational fluid dynamics techniques present an affordablealternative to experimental studies. A validated physics model canprovide detailed descriptions of the particle deposition behaviorincluding deformation, temporal, and sticking properties. Thisinformation can guide the development of better material coatingsand aid in the prediction of component life expectancy and per-formance gradients due to deposition with much better accuracy
than is currently possible. By augmenting physics-based modelswith modern uncertainty quantification tools, relevant particleproperties responsible for deposition and susceptible regions inthe components can also be identified and used to accelerate thecomponent design cycle. However, it is not trivial to developphysics-based models for particle-surface interaction problems thatinvolve coupling between multiple physical processes. The prob-lem becomes more complicated at high-temperature conditionswhere the material properties of the particle are not well establishedand the particle size is several orders of magnitude smaller than theenvironment with which they interact. Moreover, depending on thecomposition, the particulate matter can undergo a phase transitionto a molten/semimolten state. When in a semimolten state, particlesmay exhibit viscous behaviors with non-Newtonian properties post-crystallization [334]. To determine properties right before the colli-sion, the model itself needs to be multiregime by accommodatingseparate formulations for modeling phase change. The data pertain-ing to the properties of particles at such high temperatures is veryscarce. Typically, physics-based models are limited to standard par-ticle properties without much scope for variation in theirtemperature-dependent properties or phase. An integrated effort torefine existing physics-based models from data obtained throughlimited but specialized experimental investigations of particleimpact and properties at extreme conditions seem to be the mostfeasible path forward toward obtaining a universal predictiveframework for particle-laden flows within turbomachinery.
6 Perspectives and Outlook
In light of the advances presented in this review, there stillexists ample opportunities for predictive modeling of multiphasefluid dynamics. Research directions where multiphase fluid mod-eling can exert an important impact are as follows:
6.1 Model Development for Particle–Particle and Particle-Wall Interactions Using Machine Learning Techniques. Sig-nificant progress has been made in the past decade on the develop-ment of machine-learned (ML) models for the prediction ofgaseous and multiphase fluid dynamic flows, a detailed review ofwhich can be found in the recent review paper by Brunton et al.[335]. The goal of such developments can be classified into twocategories: (1) surrogate models to facilitate parametric sweepsduring design space exploration or to inform real-time decisionmaking; and (2) closure models for key physical phenomena thatcan be integrated in computational codes to improve solutionaccuracy and/or accelerate the computations.
Multiple research groups have developed surrogate modelsusing different machine learning techniques. These includeBayesian-based algorithms, such as Gaussian processes [336,337],auto-encoders [338], and kriging [339], and data-driven andphysics-informed artificial neural networks (often discussed usingeither ANN for artificial neural networks and/or PINN forphysics-informed artifical neural networks) [340–344].
Some of the recent work on closure models includes machinelearning-based subgrid models for chemical kinetics closure insimulations of turbulent reacting flows [345–347], and Reynoldsstress closure in nonreacting flows [348–354].
While a number of ML-based surrogates and closure modelsfor single-phase gaseous flows have been developed in the recentpast, apart from a few recent research efforts [336,337,355], theliterature is lean with respect to ML models for multiphase flows.Currently, existing particle-wall interaction models [251,356,357]fail to accurately predict the physical processes because they arenot universal. Most of them are based on empirical evidence andlikely cover only a particular regime. As detailed in a recentreview paper by Moreira et al. [147], because of the extremelycomplex and diverse nature of particle-wall physics that is likelygoverned by different parameters in different regimes and periodsduring an injection cycle, it may not even be possible to developgeneralized models for this phenomena using traditional methods.
040801-20 / Vol. 73, JULY 2021 Transactions of the ASME
Dow
nloaded from http://asm
edigitalcollection.asme.org/appliedm
echanicsreviews/article-pdf/73/4/040801/6733986/am
r_073_04_040801.pdf by University of C
incinnati user on 30 July 2021

There have been a few research efforts in the past that haveattempted to develop generalized models spanning multipleregimes for droplet breakup phenomena using ad hoc statisticalanalyses [358,359], but the integration of state of the art machinelearning techniques with high-fidelity experimental and computa-tional data is still in its infancy.
This presents a unique opportunity for the development ofphysics-informed and data-driven ML algorithms for liquid/gas/solid flows. Specifically, machine-learning-based generalized clo-sure models to predict particle–particle and particle-wall interac-tions using data-driven or physics-informed techniques should bedeveloped such that they can be incorporated in multiphase com-putational frameworks to accurately model the phenomenon andsignificantly accelerate the flow solutions. The absence of suchmodels is one of the critical bottlenecks preventing the under-standing of turbulent multiphase fluid dynamics in a full-scaleengine configurations, both because of a lack of model accuracyand a lack of computational efficiency. In a gas-turbine engine, inaddition to the liquid ligaments and droplets created during fuelatomization, there might also exist hundreds of thousands of solidsand particles that are ingested, especially in desert environments.This is an example of the type of simulation problems that willbenefit greatly from advances in ML approaches.
6.2 Novel Analysis of Turbulence Dynamics Using Non-Local Methods. Turbulence dynamics are governed by the solu-tion of the Navier Stokes Equations, and generally exhibit largestatistical deviations from Gaussian behavior. This is especiallythe case at scales where small-scale structures in the form of self-organized, intense vortex filaments develop [360]. It is generallyaccepted that energy cascades from large eddies to successivelysmaller eddies until length scales are such that energy is dissipatedby kinetic energy turning into heat. Normal scaling behavior asso-ciated with the Kolmogorov 1941 (K41) classical theory of turbu-lence [361] is based on Kolmogorov’s hypothesis that, unlikelarge-scale turbulent motions, small-scale or local turbulentmotions are statistically isotropic. The connection between turbu-lent structures of different time and length scales and the cascadeof energy transfer in turbulent flows has been widely reported intextbooks such as [361]. Although this theory underpins manywidely adopted turbulence model closures (e.g., eddy viscosity)[362], it still lacks a complete description of the interactionphysics. Recent findings suggest that non-Gaussian behaviors atthe smaller scales are the result of nonlocal interactions betweenenergy-containing structures. In Refs. [361] and [360], researchersreported on the significant role nonlocal interactions have in gen-erating intense vortices leading to intermittency, as well as therole of local interactions in dissipating energy via turbulent vis-cosity. By using numerical simulations, they also determined thatnonlocal interactions dominate local effects by several orders ofmagnitude. In Ref. [363], they reported that spatially filtering ofthe Navier Stokes equations, as is often done for large eddy simu-lations, enhances the existing nonlocality emerging in the corre-sponding subgrid-scale fluid motions. These findings furtherhighlight the need for the development of new nonlocal closuremodels that obey the non-Gaussian statistics of turbulent flows.
Remarkable progress has been made recently in the area of non-local modeling of turbulent flows. The models have been enabledby recent breakthroughs in mathematical methods based onfractional-order calculus theory and its applications [364–366].The main advantage of fractional models compared to their classi-cal counterparts is known to be their ability to incorporate theinherent nonlocalities and non-Gaussian statistics of multiscaleproblems in the integro-differential operators. A prime example ofthis is the pioneering work by Chen [367] that formulated the useof a fractional Laplacian model to represent the Reynolds stressesin wall-bounded flows with a fixed fractional order. Although itwas restrictive, it inspired a wide array of new methods includingnovel formulations that allowed the fractional order of the model
to vary with distance from the wall [368], as well as integratingthe use of fractional operators with deep neural networks to obtainuniversal scaling laws for the total shear stress using variableorder fractional derivatives [364]. More recently, a nonlocalsubgrid-scale model was introduced for large eddy simulation,based on the compact expressivity of fractional derivative opera-tors in the eddy viscosity closure [366]. Based on fixed variableorder, a priori testing with DNS demonstrated that nonlocal mod-els provide a more realistic prediction of turbulence statisticscompared to the classical local eddy viscosity models. Theseworks demonstrate the importance of fractional order methods fornonlocal modeling of Reynolds stress, subfilter stress, andresolved-scale fluid dynamics. Hence, this emerging field providesan interesting capability and the potential for a new class of largeeddy simulation analysis tools.
Continued development of nonlocal models extended to com-plex multiphase high-temperature flows will be important to reli-ably predict the multiscale nature of its interactions and evolution.
6.3 Introduction of Uncertainty Quantification MethodsInto the Modeling Framework. Uncertainty quantification (UQ)and uncertainty-based sensitivity analysis (SA) are growing areasof research in computational engineering and of increasing impor-tance in analysis of multiphase flows. The inherent complexity ofmultiphase fluid systems, such as those reviewed in this article,implies the predictions depend on several input and phenomenologi-cal parameters such as the Stokes, Weber, and Reynolds numbers,particle shape, material properties, and surface morphology (smooth,rough, curved surface), to name a few. Moreover, most of the modelspresent a strongly coupled nonlinear relationship between input andresponse variables often defined through constitutive relationships[369]. To increase the reliability of simulation results, strategies thataccount for the influence of the variability associated with inputparameters being used to characterize the multiscale and multiphasefluid system are highly desirable. Uncertainty quantification analysisprovides an effective tool for tracing the effects of uncertainty associ-ated with different parameters used in a model as well as with themodel itself. Such uncertainties are often classified into two catego-ries, aleatory or epistemic.
(1) Aleatory uncertainty is due to randomness related to aphysical process. This type of uncertainty is consideredreducible, provided that an adequate statistical descriptionis available. Probability theory is used for modeling thistype of uncertainty, and there are well-established samplingor stochastic expansion methods for the UQ and SA ofresponse quantities involving aleatory uncertainties [370].
(2) Epistemic uncertainty is due to a lack of information orunderstanding of the process being modeled [371]. Theoret-ically, this type of uncertainty might also be considered tobe reducible, provided that new information, such as what adomain expert might provide, can be used to supplement orin some way improve the fidelity of the model itself [372].In the absence of new knowledge, however, this type ofuncertainty is irreducible, and the use of probability distri-butions to characterize what is unknown is significantlymore challenging, often involving probability strategiesthat bound what is not known.
Here, we draw heavily on observations from a recent (2020)case study by Enderle et al. [373], which provides a thoughtfulassessment of the state of the art and challenges associated withthe applications of UQ and SA in the simulation of a turbulentcombusting spray. Enderle et al. note that the computational costsof high fidelity spray simulations become “prohibitive for largescale simulation” when standard approaches for capturing theeffects of variability are employed, even if relevant probabilitydensity distributions are well known. Their approach uses sensi-tivity analysis to reduce the stochastic dimensions of the problemto be simulated, and then they employ surrogate models or sto-chastic expansions in lieu of high fidelity simulation models. They
Applied Mechanics Reviews JULY 2021, Vol. 73 / 040801-21
Dow
nloaded from http://asm
edigitalcollection.asme.org/appliedm
echanicsreviews/article-pdf/73/4/040801/6733986/am
r_073_04_040801.pdf by University of C
incinnati user on 30 July 2021

identify the most influential parameters for their study a prioriusing a Morris One At a Time sensitivity analysis, and a posteri-ori, using Sobol’ indices. They use the class of stochastic expan-sion methods known as the polynomial chaos expansion approach[374] to develop their surrogate model and the Latin HypercubeSampling [375] approach to bound model input uncertainties.Both of these methods are drawing increased attention for theiruse in UQ [376,377].
Although there are several uncertainty quantification analysisstudies pertaining to computational fluid dynamics available in theliterature [378,379], the cited work by Enderle et al. [373] is thefirst we are aware of that incorporates multiphase combustionregimes and represents an important first step toward directlyfocusing on establishing uncertainties comprehensively in a multi-scale/multiphase/multiphysics framework. The authors believe thatincorporating UQ–SA-based approaches is critical for the develop-ment of a predictive multiscale, multiphase modeling framework.
6.4 Hot Particulate Ingestion Rig (HPIR) for Community-Wide Multiphase Flow Canonical Studies. Sand laden particu-late flow and molten sand deposition onto target specimens can besimulated using the Army Research Laboratory’s Hot ParticulateIngestion Rig (HPIR) experimental facility, that is shown in Fig.11. The HPIR is a canonical laboratory-scale combustor systemthat is capable of operating with gas temperatures up to 16508C,gas velocities up to a Mach number of 0.8, and mass flow rates upto 0.34 kg/s. In addition, various sands/dust/ash particle concentra-tions can be directly fed (up to 200 g/min) into the combustor torealistically simulate sand transport and CMAS formation. Oncethe particle clusters exit the combustor they travel further down-stream, impact and deposit on a material substrate (often a thermalbarrier coating). During operation, particle image velocimetry orlaser doppler velocimetry (LDV) can be used to track particle tra-jectory in the hot gas flow field as well as the rebound velocities.Thermal Barrier Coatings can be exposed to a high velocity(Mach 0.3), high temperature (14008C) gas flow that is laden withsynthetic sand (fed at 1 g/min) simulating gas turbine engine-likeoperating condition. Each sample can be exposed to cyclic hot/cold conditions with sand ingestion. In addition to this “dry” test,a high humidity test using a water fogger can be conducted to sim-ulate a water vapor attack.
Infrared (IR) cameras, pyrometers, and thermocouples areavailable to monitor the thermal profile across the coated substrateboth on the front and back side of the specimens. Microstructuralcharacterization and mechanical properties of the coatings areevaluated before and after CMAS exposure. Also, accumulatedsand weight, deposition thickness, weight/volumetric analysis,micro-indentation, nano-indentation (hardness, elastic modulus),X-ray diffraction, thermal gravimetric analysis, and scanning elec-tron microscopy can be conducted. This facility can be used tocorrelate the developed multiphysics model at all levels to be ableto assess the CMAS resistance of newly developed coatings. Fur-ther information about this facility is found in Ref. [380].
7 Conclusion
Significant success has been achieved in multiphase flow mod-eling in terms of capturing its turbulent transport and splashing/breakup due to particle-wall interactions. Modeling approachestoday are able to describe strongly coupled interactions betweenturbulence and discrete particulates at a wide range of regimes.The number of seminal publications and validated models is astrong indicator of its success having a wide range of applicabil-ity. Indeed, these models have played a strong role in enablingdiscoveries and new technologies. However, the literature alsoreveals a significant amount of empiricism in the models thatoften leads to a calibration process when conducting validationstudies. Uncertainties in model physical properties, boundary con-ditions, turbulence, and particle-wall interaction modeling havebeen shown to require additional recalibration. Models tend to bedeveloped with numerical constants that allow control of a spe-cific process (such as deposition or rebound) that has been vettedbased on experimental relationships. Multiphase fluid dynamicmodels, such as the ones reviewed in this article, remain largelybased on simplified modeling assumptions hence lack a completedescription. Because of this, ample opportunities exist for makingsignificant contributions to the development and validation of pre-dictive models that are based on first principles and benefit fromthe use of uncertainty quantification methods. Equally exciting arethe opportunities for use of these next generation of models inconducting reliable, high-fidelity integrated computer simulationsof heterogeneous multiphase flows in engineering systems, andspecifically for the design of new T/EBC systems that resistCMAS attack at even higher temperatures than encountered intoday’s gas turbine engines.
Nomenclature
Non-Dimensional Numbers
Ja ¼ Jakob numberLa ¼ Laplace numberNu ¼ Nusselt numberOh ¼ Ohnesorge numberPr ¼ Prandtl numberRe ¼ Reynolds numberSt ¼ Stokes number
We ¼ Weber number
Subscripts
d ¼ dropletf ¼ film
G ¼ gasL ¼ leidenfrostP ¼ particle
sat ¼ saturationw ¼ wall
Acronyms
CoR ¼ coefficient of restitutionCHF ¼ critical heat fluxDNS ¼ direct numerical simulationLBM ¼ lattice Boltzmann method
LS ¼ level setSPH ¼ smoothed particle hydrodynamics
T/EBC ¼ thermal and environmental barrier coatingTBC ¼ thermal barrier coatingVOF ¼ volume of fluid
Latin Letters
cp ¼ heat capacityD ¼ diameterF ¼ force
Fig. 11 Schematic of Army Research Laboratory’s Hot Particu-late Ingestion Rig (HPIR) [380]
040801-22 / Vol. 73, JULY 2021 Transactions of the ASME
Dow
nloaded from http://asm
edigitalcollection.asme.org/appliedm
echanicsreviews/article-pdf/73/4/040801/6733986/am
r_073_04_040801.pdf by University of C
incinnati user on 30 July 2021

H ¼ thicknessK ¼ generic thresholdK ¼ thermal conductivityL ¼ latent heatm ¼ mass
Np ¼ Parcel numberRa ¼ mean wall roughness amplitudeT ¼ temperatureU ¼ velocity (Eulerian)V ¼ velocity (Lagrangian)
Greek Symbols
aV ¼ liquid volume fractionbmax ¼ non-dimensional maximum spread
d ¼ non-dimensional lengthVolumel ¼ dynamic viscosity
Up ¼ particle volume fractionW ¼ angleq ¼ densityr ¼ surface tensions ¼ characteristic time
ha, hr ¼ advancing, receding contact anglehC ¼ static contact angle
Funding Data
Army Research Office (Grant No. W911NF1910225; FunderID: 10.13039/100000183) .
Helmholtz-Gemeinschaft (Grant No. 34.14.02; Funder ID:10.13039/501100001656).
National Science Foundation (Grant No. 2018617; FunderID: 10.13039/100000001).
U.S. Army Research Laboratory (Grant Nos.ARLAP44862H70 and W911QX-16-D-0014; Funder ID:10.13039/100006754).
Vertical Lift Research Center of Excellence (Grant No.W911W61120012; Funder ID: 10.13039/100006769).
References[1] Guffanti, M., Casadevall, T. J., and Budding, K., 2010, “Encounters of Air-
craft With Volcanic Ash Clouds; a Compilation of Known Incidents, 1953-2009,” Tech. rep., U.S. Geological Survey Data Series 545, ver. 1.0.
[2] Seck, H. H., 2016, “Billows of Dust, a Sudden ‘Pop’ and an Osprey Falls Fromthe Sky,” accessed May 24, 2021, https://www.military.com/daily-news/2016/01/29/billows-of-dust-a-sudden-pop-and-an-osprey-falls-from-the-sky.html
[3] Bojdo, N., and Filippone, A., 2019, “A Simple Model to Assess the Role ofDust Composition and Size on Deposition in Rotorcraft Engines,” Aerospace,6(4), p. 44.
[4] van Donkelaar, A., Martin, R., Brauer, M., Kahn, R., Levy, R., Verduzco, C.,and Villeneuve, P., 2010, “Global Estimates of Ambient Fine Particulate Mat-ter Concentrations From Satellite-Based Aerosol Optical Depth: Developmentand Application,” Environ. Health Perspectives, 118(6), pp. 847–855.
[5] Hammer, M. S., van Donkelaar, A., Li, C., Lyapustin, A., Sayer, A. M., Hsu,N. C., Levy, R. C., Garay, M. J., Kalashnikova, O. V., Kahn, R. A., Brauer,M., Apte, J. S., Henze, D. K., Zhang, L., Zhang, Q., Ford, B., Pierce, J. R., andMartin, R. V., 2020, “Global Estimates and Long-Term Trends of Fine Partic-ulate Matter Concentrations (1998–2018),” Environ. Sci. Technol., 54(13), pp.7879–7890.
[6] Walock, M., Barnett, B., Ghoshal, A., Murugan, M., Swab, J., Hopkins, M.,Gazonas, G., Rowe, C., and Kerner, K., 2017, “Micro-Scale Sand ParticlesWithin the Hot Section of a Gas Turbine Engine,” Mechanical Properties andPerformance of Engineering Ceramics and Composites XI, J. Salem, D. Singh,M. Fukushima, and A. Gyekenyesi, eds., John Wiley & Sons, Hoboken, NJ,Vol. 37, pp. 159–170.
[7] Neito, A., Walock, M., Ghoshal, A., Zhu, D., Gamble, W., Barnett, B., Muru-gan, M., Pepi, M., Rowe, C., and Pegg, R., 2018, “Layered, Composite, andDoped Thermal Barrier Coatings Exposed to Sand Laden Flows Within a GasTurbine Engine: Microstructural Evolution, Mechanical Properties, andCMAS Deposition,” Surf. Coat. Technol., 349, pp. 1107–1116.
[8] Ghoshal, A., Murugan, M., Walock, M. J., Nieto, A., Barnett, B. D., Pepi, M.S., Swab, J. J., Zhu, D., Kerner, K. A., Rowe, C. R., Shiao, C.-Y. (M. )., Hop-kins, D. A., and Gazonas, G. A., 2018, “Molten Particulate Impact on TailoredThermal Barrier Coatings for Gas Turbine Engine,” J. Eng. Gas TurbinesPower, 140(2), p. 022601.
[9] Murugan, M., Ghoshal, A., Walock, M., Barnett, B., Pepi, M., and Kerner, K.,2017, “Sand Particle Induced Deterioration of Thermal Barrier Coatings onGas Turbine Blades,” Adv. Aircr. Spacecr. Sci., 4(1), pp. 37–52.
[10] Fehrenbacher, L., Kroliczek, D., Kutsch, J., Vesnovsky, I., Fehrenbacher, E.,Ghoshal, A., Walock, M., and Nieto, A., 2019, “Advanced Environmental Bar-rier Coatings for SiC CMCs,” Adv. Ceram. Environ., Funct., Struct., EnergyAppl. II, 26, pp. 83–93.
[11] Balachandar, S., and Eaton, J. K., 2010, “Turbulent Dispersed MultiphaseFlow,” Annu. Rev. Fluid Mech., 42(1), pp. 111–133.
[12] Guha, A., 2008, “Transport and Deposition of Particles in Turbulent and Lam-inar Flow,” Annu. Rev. Fluid Mech., 40(1), pp. 311–341.
[13] Hamed, A., Tabakoff, W. C., and Wenglarz, R., 2006, “Erosion and Deposi-tion in Turbomachinery,” J. Propuls. Power, 22(2), pp. 350–360.
[14] Zhang, F., Liu, Z., Liu, Z., and Diao, W., 2020, “Experimental Study of SandParticle Deposition on a Film-Cooled Turbine Blade at Different Gas Temper-atures and Angles of Attack,” Energies, 13(4), p. 811.
[15] Federal Aviation Administration, 2016, Airplane Flying Handbook (FAA-H-8083-3B), Skyhorse Publishing Inc, New York.
[16] Murugan, M., Ghoshal, A., Walock, M., Nieto, A., Bravo, L., Barnett, B.,Pepi, M., Swab, J., Pegg, R. T., Rowe, C., Zhu, D., and Kerner, K., 2017,“Microstructure Based Material-Sand Particulate Interactions and Assessmentof Coatings for High Temperature Turbine Blades,” ASME Paper No.GT2017-64051.
[17] Dunn, M. G., Padova, C., and Adams, R., 1987, “Operation of Gas TurbineEngines in Dust-Laden Environments,” ASME. J. Turbomach. 134(5),p. 051001.
[18] Tabakoff, W., 1987, “Compressor Erosion and Performance Deterioration,”ASME J. Fluids Eng., 109(3), pp. 297–306.
[19] Chang, W.-R., and Ling, F. F., 1992, “Normal Impact Model of RoughSurfaces,” ASME J. Tribol., 114(3), pp. 439–447.
[20] Wadley, H. N. G., 2013, “High Temperature Coatings,” accessed May 26,2021, https://www2.virginia.edu/ms/research/wadley/high-temp.html
[21] Dahneke, B., 1975, “Further Measurements of the Bouncing of Small LatexSpheres,” J. Colloid Interface Sci., 51(1), pp. 58–65.
[22] Dunn, M. G., Baran, A. J., and Miatech, J., 1996, “Operation of Gas TurbineEngines in Volcanic Ash Clouds,” ASME J. Eng. Gas Turbines Power, 118(4),pp. 724–731.
[23] Linden, D., 2018, “Know Your Turbomachinery’s Operating Environment!,”Houston, TX, accessed May 26, 2021, https://oaktrust.library.tamu.edu/bit-stream/handle/1969.1/175022/10_Linden.pdf?sequence¼1&isAllowed¼y
[24] Borom, M. P., Johnson, C. A., and Peluso, L. A., 1996, “Role of EnvironmentDeposits and Operating Surface Temperature in Spallation of Air PlasmaSprayed Thermal Barrier Coatings,” Surf. Coat. Technol., 86–87, pp.116–126.
[25] Jackson, R. W., Zaleski, E. M., Poerschke, D. L., Hazel, B. T., Begley, M. R.,and Levi, C. G., 2015, “Interaction of Molten Silicates With Thermal BarrierCoatings Under Temperature Gradients,” Acta Mater., 89, pp. 396–407.
[26] Kr€amer, S., Yang, J., Levi, C. G., and Johnson, C. A., 2006, “ThermochemicalInteraction of Thermal Barrier Coatings With Molten CaO–MgO–Al2O3–SiO2
(CMAS) Deposits,” J Am. Ceram. Soc., 89(10), pp. 3167–3175.[27] Mercer, C., Faulhaber, S., Evans, A. G., and Darolia, R., 2005, “A Delamina-
tion Mechanism for Thermal Barrier Coatings Subject toCalcium–Magnesium–Alumino-Silicate (CMAS) Infiltration,” Acta Mater.,53(4), pp. 1029–1039.
[28] Evans, A., Mumm, D., Hutchinson, J., Meier, G., and Pettit, F., 2001,“Mechanisms Controlling the Durability of Thermal Barrier Coatings,” Prog.Mater. Sci., 46(5), pp. 505–553.
[29] Kharaz, A. H., Gorham, D. A., and Salman, A. D., 1999, “Accurate Measure-ment of Particle Impact Parameters,” Meas. Sci. Technol., 10(1), pp. 31–35.
[30] Kim, J., Dunn, M. G., Baran, A. J., Wade, D. P., and Tremba, E. L., 1993,“Deposition of Volcanic Materials in the Hot Sections of Two Gas TurbineEngines,” ASME Paper No. 92-GT-219.
[31] Schiller, L., and Naumann, Z., 1933, “€Uber Die Grundlegende BerechnungBei Der Schwerkraftaufbereitung,” Z. Des Vereins Deutscher Ingenieure, 77,pp. 318–320.
[32] McKinley, G. H., and Renardy, M., 2011, “Wolfgang Von Ohnesorge,” Phys.Fluids, 23(12), p. 127101.
[33] Ruzicka, M., 2008, “On Dimensionless Numbers,” Chem. Eng. Res. Des.,86(8), pp. 835–868.
[34] Wierzba, A., 1990, “Deformation and Breakup of Liquid Drops in at NearlyCritical Weber Numbers,” Exp. Fluids, 9(1–2), pp. 59–64.
[35] Hannebique, G., Sierra, P., Riber, E., and Cuenot, B., 2013, “Large Eddy Sim-ulation of Reactive Two-Phase Flow in an Aeronautical Multipoint Burner,”Flow, Turbulence Combustion, 90(2), pp. 449–469.
[36] Jones, W., Marquis, A., and Vogiatzaki, K., 2014, “Large-Eddy Simulation ofSpray Combustion in a Gas Turbine Combustor,” Combust. Flame, 161(1), pp.222–239.
[37] Mattingly, J. D., 1996, Elements of Gas Turbine Propulsion, 1, McGraw-Hill,New York.
[38] Jain, N., Bravo, L., Bose, S., Kim, D., Murugan, M., Ghoshal, A., and Flatau, A.,2018, “Turbulent Multiphase Flow and Particle Deposition of Sand Ingestion forHigh-Temperature Turbine Blades,” Studying Turbulence Usinng NumericalSimulation Dabases - XVII, Proceedings of the 2018 Center for TurbulenceResearch Summer Program, Stanford University Press, Palo Alto, CA.
[39] Li, B., Chen, Z., Zheng, H., Li, G., Li, H., and Peng, P., 2019, “Wetting Mech-anism of CMAS Melt on Ysz Surface at High Temperature: First-PrinciplesCalculation,” Appl. Surf. Sci., 483, pp. 811–818.
Applied Mechanics Reviews JULY 2021, Vol. 73 / 040801-23
Dow
nloaded from http://asm
edigitalcollection.asme.org/appliedm
echanicsreviews/article-pdf/73/4/040801/6733986/am
r_073_04_040801.pdf by University of C
incinnati user on 30 July 2021

[40] Cowherd, C., 2007, “Sandblaster 2 Support of See-Through Technologies forParticulate Brownout,” Tech. Rep. 110565.1.005, Midwest Research Institute,Kansas City, MO, accessed May 26, 2021, https://apps.dtic.mil/sti/pdfs/ADA504965.pdf
[41] Sommerfeld, M., 2017, “Numerical Methods for Dispersed MultiphaseFlows,” Particles in Flows, Advances in Mathematical Fluid Mechanics, T.Bodn�ar, G. Galdi, and �S. Necasov�a, Birkh€auser, Cham, pp. 255–326, Vol. 6.
[42] Elghobashi, S., 1994, “On Predicting Particle-Laden Turbulent Flows,” Appl.Sci. Res., 52(4), pp. 309–329.
[43] Prosperetti, A., and Tryggvason, G., 2009, Computational Methods for Multi-phase Flow, Cambridge University Press, Cambridge, UK.
[44] Loth, E., 2000, “Numerical Approaches for Motion of Dispersed Particles,Droplets and Bubbles,” Prog. Energy Combustion Sci., 26(3), pp. 161–223.
[45] Kajishima, T., 2004, “Influence of Particle Rotation on the InteractionBetween Particle Clusters and Particle-Induced Turbulence,” Int. J. Heat FluidFlow, 25(5), pp. 721–728.
[46] Gore, R. A., and Crowe, C. T., 1989, “Effect of Particle Size on ModulatingTurbulent Intensity,” Int. J. Multiphase Flow, 15(2), pp. 279–285.
[47] Kulick, J. D., Fessler, J. R., and Eaton, J. K., 1994, “Particle Response andTurbulence Modification in Fully Developed Channel Flow,” J. Fluid Mech.,277, pp. 109–134.
[48] Squires, K. D., and Eaton, J. K., 1990, “Particle Response and TurbulenceModification in Isotropic Turbulence,” Phys. Fluids A, 2(7), pp. 1191–1203.
[49] Reeks, M. W., 1983, “The Transport of Discrete Particles in InhomogeneousTurbulence,” J. Aerosol Sci., 14(6), pp. 729–739.
[50] Marchioli, C., and Soldati, A., 2002, “Mechanisms for Particle Transfer and Seg-regation in a Turbulent Boundary Layer,” J. Fluid Mech., 468, pp. 283–315.
[51] Marchioli, C., Giusti, A., Salvetti, M. V., and Soldati, A., 2003, “DirectNumerical Simulation of Particle Wall Transfer and Deposition in UpwardTurbulent Pipe Flow,” Int. J. Multiphase Flow, 29(6), pp. 1017–1038.
[52] Fong, K., Amili, O., and Coletti, F., 2019, “Velocity and Spatial Distributionof Inertial Particles in a Turbulent Channel Flow,” J. Fluid Mech., 872, pp.367–406.
[53] Moin, P., and Mahesh, K., 1998, “Direct Numerical Simulation: A Tool inTurbulence Research,” Annu. Rev. Fluid Mech., 30(1), pp. 539–578.
[54] Tenneti, S., and Subramaniam, S., 2014, “Particle-Resolved Direct NumericalSimulation for Gas-Solid Flow Model Development,” Annu. Rev. FluidMech., 46(1), pp. 199–230.
[55] Bagchi, P., and Balachandar, S., 2003, “Effect of Turbulence on the Drag andLift of a Particle,” Phys. Fluids, 15(11), pp. 3496–3513.
[56] Burton, T. M., and Eaton, J. K., 2005, “Fully Resolved Simulations ofParticle-Turbulence Interaction,” J. Fluid Mech., 545(1), pp. 67–111.
[57] Vreman, A. W., 2016, “Particle-Resolved Direct Numerical Simulation ofHomogeneous Isotropic Turbulence Modified by Small Fixed Spheres,” J.Fluid Mech., 796, pp. 40–85.
[58] Koblitz, A. R., Lovett, S., Nikiforakis, N., and Henshaw, W. D., 2017, “DirectNumerical Simulation of Particulate Flows With an Overset Grid Method,” J.Comput. Phys., 343, pp. 414–431.
[59] Glowinski, R., Pan, T. W., Hesla, T. I., Joseph, D. D., and P�eriaux, J., 2001,“A Fictitious Domain Approach to the Direct Numerical Simulation of Incom-pressible Viscous Flow Past Moving Rigid Bodies: Application to ParticulateFlow,” J. Comput. Phys., 169(2), pp. 363–426.
[60] Patankar, N. A., Singh, P., Joseph, D. D., Glowinski, R., and Pan, T. W., 2000,“A New Formulation of the Distributed Lagrange Multiplier/FictitiousDomain Method for Particulate Flows,” Int. J. Multiphase Flow, 26(9), pp.1509–1524.
[61] Shao, X., Wu, T., and Yu, Z., 2012, “Fully Resolved Numerical Simulation ofParticle-Laden Turbulent Flow in a Horizontal Channel at a Low ReynoldsNumber,” J. Fluid Mech., 693, pp. 319–344.
[62] Diaz-Goano, C., Minev, P. D., and Nandakumar, K., 2003, “A FictitiousDomain/Finite Element Method for Particulate Flows,” J. Comput. Phys.,192(1), pp. 105–123.
[63] Yu, Z., Lin, Z., Shao, X., and Wang, L. P., 2016, “A Parallel FictitiousDomain Method for the Interface-Resolved Simulation of Particle-LadenFlows and Its Application to the Turbulent Channel Flow,” Eng. Appl. Com-put. Fluid Mech., 10(1), pp. 160–170.
[64] Kajishima, T., and Takiguchi, S., 2002, “Interaction Between Particle Clustersand Particle-Induced Turbulence,” Int. J. Heat Fluid Flow, 23(5), pp. 639–646.
[65] Haeri, S., and Shrimpton, J. S., 2012, “On the Application of ImmersedBoundary, Fictitious Domain and Body-Conformal Mesh Methods to ManyParticle Multiphase Flows,” Int. J. Multiphase Flow, 40, pp. 38–55.
[66] Uhlmann, M., 2008, “Interface-Resolved Direct Numerical Simulation of Ver-tical Particulate Channel Flow in the Turbulent Regime,” Phys. Fluids, 20(5),p. 053305.
[67] Lucci, F., Ferrante, A., and Elghobashi, S., 2010, “Modulation of IsotropicTurbulence by Particles of Taylor Length-Scale Size,” J. Fluid Mech., 650, pp.5–55.
[68] Picano, F., Breugem, W. P., and Brandt, L., 2015, “Turbulent Channel Flow ofDense Suspensions of Neutrally Buoyant Spheres,” J. Fluid Mech., 764, pp.463–487.
[69] Mehrabadi, M., Tenneti, S., Garg, R., and Subramaniam, S., 2015, “Pseudo-Turbulent Gas-Phase Velocity Fluctuations in Homogeneous Gas-Solid Flow:Fixed Particle Assemblies and Freely Evolving Suspensions,” J. Fluid Mech.,770, pp. 210–246.
[70] Tschisgale, S., Kempe, T., and Fr€ohlich, J., 2017, “A Non-Iterative ImmersedBoundary Method for Spherical Particles of Arbitrary Density Ratio,” J. Com-put. Phys., 339, pp. 432–452.
[71] Azis, M. H. A., Evrard, F., and van Wachem, B., 2019, “An Immersed Bound-ary Method for Flows With Dense Particle Suspensions,” Acta Mech., 230(2),pp. 485–515.
[72] Kajishima, T., 2019, “Immersed Boundary/Solid Method for the NumericalSimulation of Particle-Laden Flows,” Fluid Dyn. Res., 51(5), p. 051401.
[73] Goza, A., Liska, S., Morley, B., and Colonius, T., 2016, “Accurate Computa-tion of Surface Stresses and Forces With Immersed Boundary Methods,”Phys. Comput. Fluids, 321, pp. 860–873.
[74] Geneva, N., Peng, C., Li, X., and Wang, L. P., 2017, “A Scalable Interface-Resolved Simulation of Particle-Laden Flow Using the Lattice BoltzmannMethod,” Parallel Comput., 67, pp. 20–37.
[75] Ernst, M., Dietzel, M., and Sommerfeld, M., 2013, “A Lattice BoltzmannMethod for Simulating Transport and Agglomeration of Resolved Particles,”Acta Mech., 224(10), pp. 2425–2449.
[76] Derksen, J. J., 2012, “Direct Numerical Simulations of Aggregation of Mono-sized Spherical Particles in Homogeneous Isotropic Turbulence,” AICHE J.,58(8), pp. 2589–2600.
[77] H€olzer, A., and Sommerfeld, M., 2009, “Lattice Boltzmann Simulations toDetermine Drag, Lift and Torque Acting on Non-Spherical Particles,” Com-put. Fluids, 38(3), pp. 572–589.
[78] Gupta, A., Clercx, H., and Toschi, F., 2018, “Simulation of Finite-Size Par-ticles in Turbulent Flows Using the Lattice Boltzmann Method,” Commun.Comput. Phys., 23(3), pp. 665–684.
[79] Wang, L. P., Peng, C., Guo, Z., and Yu, Z., 2016, “Lattice Boltzmann Simula-tion of Particle-Laden Turbulent Channel Flow,” Comput. Fluids, 124, pp.226–236.
[80] Peng, C., and Wang, L. P., 2019, “Direct Numerical Simulations of TurbulentPipe Flow Laden With Finite-Size Neutrally Buoyant Particles at Low FlowReynolds Number,” Acta Mech., 230(2), pp. 517–539.
[81] Ten Cate, A., Derksen, J. J., Portela, L. M., and Van den Akker, H. E., 2004,“Fully Resolved Simulations of Colliding Monodisperse Spheres in ForcedIsotropic Turbulence,” J. Fluid Mech., 519, pp. 233–271.
[82] Feng, Z. G., and Michaelides, E. E., 2004, “The Immersed Boundary-LatticeBoltzmann Method for Solving Fluid-Particles Interaction Problems,” J. Com-put. Phys., 195(2), pp. 602–628.
[83] Maxey, M. R., and Riley, J. J., 1983, “Equation of Motion for a Small RigidSphere in a Nonuniform Flow,” Phys. Fluids, 26(4), pp. 883–889.
[84] Gatignol, R., 1983, “The Fax�en Formulae for aRigid Particle in an UnsteadyNon-Uniform Stokes Flow,” J. De Mec. Theorique, et Appliquee, 2, pp.143–160.
[85] Crowe, C., Schwarzkopf, J., Sommerfeld, M., and Tsuji, Y., 2011, MultiphaseFlows With Droplets and Particles, CRC Press, Boca Raton, FL.
[86] Lovalenti, P. M., and Brady, J. F., 1993, “The Hydrodynamic Force on a RigidParticle Undergoing Arbitrary Time-Dependent Motion at Small ReynoldsNumber,” J. Fluid Mech., 256(29), pp. 561–605.
[87] Parmar, M., Haselbacher, A., and Balachandar, S., 2012, “Equation of Motionfor a Sphere in Non-Uniform Compressible Flows,” J. Fluid Mech., 699, pp.352–375.
[88] Armenio, V., and Fiorotto, V., 2001, “The Importance of the Forces Acting onParticles in Turbulent Flows,” Phys. Fluids, 13(8), pp. 2437–2440.
[89] Horwitz, J. A., and Mani, A., 2016, “Accurate Calculation of Stokes Drag forPoint-Particle Tracking in Two-Way Coupled Flows,” J. Comput. Phys., 318,pp. 85–109.
[90] Gualtieri, P., Picano, F., Sardina, G., and Casciola, C. M., 2015, “Exact Regu-larized Point Particle Method for Multiphase Flows in the Two-Way CouplingRegime,” J. Fluid Mech., 773, pp. 520–561.
[91] Ireland, P. J., and Desjardins, O., 2017, “Improving Particle Drag Predictionsin Euler-Lagrange Simulations With Two-Way Coupling,” J. Comput. Phys.,338, pp. 405–430.
[92] Mehrabadi, M., Horwitz, J. A., Subramaniam, S., and Mani, A., 2018, “ADirect Comparison of Particle-Resolved and Point-Particle Methods in Decay-ing Turbulence,” J. Fluid Mech., 850, pp. 336–369.
[93] Wang, Q., and Squires, K. D., 1996, “Large Eddy Simulation of Particle Depo-sition in a Vertical Turbulent Channel Flow,” Int. J. Multiphase Flow, 22(4),pp. 667–683.
[94] Uijttewaal, W. S., and Oliemans, R. V., 1996, “Particle Dispersion and Depo-sition in Direct Numerical and Large Eddy Simulations of Vertical PipeFlows,” Phys. Fluids, 8(10), pp. 2590–2604.
[95] Kuerten, J. G., and Vreman, A. W., 2005, “Can Turbophoresis Be Predictedby Large-Eddy Simulation?,” Phys. Fluids, 17(1), pp. 011701–4.
[96] Kuerten, J. G., 2016, “Point-Particle DNS and LES of Particle-Laden Turbu-lent Flow - A State-of-the-Art Review,” Flow Turbul. Combust., 97(3), pp.689–713.
[97] Capecelatro, J., and Desjardins, O., 2013, “An Euler-Lagrange Strategy forSimulating Particle-Laden Flows,” J. Comput. Phys., 238, pp. 1–31.
[98] Shotorban, B., and Balachandar, S., 2006, “Particle Concentration in Homoge-neous Shear Turbulence Simulated Via Lagrangian and Equilibrium EulerianApproaches,” Phys. Fluids, 18(6), p. 065105.
[99] Shotorban, B., and Balachandar, S., 2007, “A Eulerian Model for Large-EddySimulation of Concentration of Particles With Small Stokes Numbers,” Phys.Fluids, 19(11), p. 118107.
[100] Shotorban, B., and Balachandar, S., 2009, “Two-Fluid Approach for Direct Numer-ical Simulation of Particle-Laden Turbulent Flows at Small Stokes Numbers,”Phys. Rev. E - Stat., Nonlinear, Soft Matter Phys., 79(5), pp. 1–8.
[101] Lindborg, H., Lysberg, M., and Jakobsen, H. A., 2007, “Practical Validationof the Two-Fluid Model Applied to Dense Gas-Solid Flows in FluidizedBeds,” Chem. Eng. Sci., 62(21), pp. 5854–5869.
040801-24 / Vol. 73, JULY 2021 Transactions of the ASME
Dow
nloaded from http://asm
edigitalcollection.asme.org/appliedm
echanicsreviews/article-pdf/73/4/040801/6733986/am
r_073_04_040801.pdf by University of C
incinnati user on 30 July 2021

[102] Ozel, A., Fede, P., and Simonin, O., 2013, “Development of Filtered Euler-Euler Two-Phase Model for Circulating Fluidised Bed: High Resolution Simu-lation, Formulation and a Priori Analyses,” Int. J. Multiphase Flow, 55, pp.43–63.
[103] Peirano, E., Delloume, V., Johnsson, F., Leckner, B., and Simonin, O., 2002,“Numerical Simulation of the Fluid Dynamics of a Freely Bubbling FluidizedBed: Influence of the Air Supply System,” Powder Technol., 122(1), pp.69–82.
[104] Cheung, S. C., Yeoh, G. H., Qi, F. S., and Tu, J. Y., 2012, “Classification ofBubbles in Vertical Gas-Liquid Flow: Part 2 - a Model Evaluation,” Int. J.Multiphase Flow, 39, pp. 135–147.
[105] Zeng, Z. X., and Zhou, L. X., 2006, “A Two-Scale Second-Order Moment Par-ticle Turbulence Model and Simulation of Dense Gas-Particle Flows in a Ris-er,” Powder Technol., 162(1), pp. 27–32.
[106] Moreau, M., Simonin, O., and B�edat, B., 2010, “Development of Gas-ParticleEuler-Euler LES Approach: A Priori Analysis of Particle Sub-Grid Models inHomogeneous Isotropic Turbulence,” Flow, Turbul. Combust., 84(2), pp.295–324.
[107] Masi, E., Simonin, O., Riber, E., Sierra, P., and Gicquel, L. Y., 2014,“Development of an Algebraic-Closure-Based Moment Method for UnsteadyEulerian Simulations of Particle-Laden Turbulent Flows in Very DiluteRegime,” Int. J. Multiphase Flow, 58, pp. 257–278.
[108] Kartushinsky, A., Tisler, S., Oliveira, J. L., and van der Geld, C. W., 2016,“Eulerian-Eulerian Modelling of Particle-Laden Two,” phase flow,”. PowderTechnol., 301, pp. 999–1007.
[109] Chen, X., and Wang, J., 2014, “A Comparison of Two-Fluid Model, DenseDiscrete Particle Model and CFD-DEM Method for Modeling Impinging Gas-Solid Flows,” Powder Technol., 254, pp. 94–102.
[110] Meyer, C. J., and Deglon, D. A., 2011, “Particle Collision modeling - AReview,” Miner. Eng., 24(8), pp. 719–730.
[111] Davis, R., Serayssol, J. M., and Hinch, E., 1986, “The ElastohydrodynamicCollision of Two Spheres,” J. Fluid Mech., 163, pp. 479–497.
[112] Maw, N., Barber, J. R., and Fawcett, J. N., 1976, “The Oblique Impact of Elas-tic Spheres,” Wear, 38(1), pp. 101–114.
[113] Yamamoto, Y., Potthoff, M., Tanaka, T., Kajishima, T., and Tsuji, Y., 2001,“Large-Eddy Simulation of Turbulent Gas-Particle Flow in a Vertical Chan-nel: Effect of Considering Inter-Particle Collisions,” J. Fluid Mech., 442, pp.303–334.
[114] Barnocky, G., and Davis, R. H., 1988, “Elastohydrodynamic Collision andRebound of Spheres: Experimental Verification,” Phys. Fluids, 31(6), p. 1324.
[115] Gondret, P., Lance, M., and Petit, L., 2002, “Bouncing Motion of SphericalParticles in Fluids,” Phys. Fluids, 14(2), pp. 643–652.
[116] Joseph, G. G., Zenit, R., Hunt, M. L., and Rosenwinkel, A. M., 2001,“Particle-Wall Collisions in a Viscous Fluid,” J. Fluid Mech., 433, pp.329–346.
[117] Joseph, G. G., and Hunt, M. L., 2004, “Oblique Particle-Wall Collisions in aLiquid,” J. Fluid Mech., 510(510), pp. 71–93.
[118] Yang, F. L., and Hunt, M. L., 2006, “Dynamics of Particle-Particle Collisionsin a Viscous Liquid,” Phys. Fluids, 18(12), p. 121506.
[119] Kempe, T., and Fr€ohlich, J., 2012, “Collision Modelling for the Interface-Resolved Simulation of Spherical Particles in Viscous Fluids,” J. Fluid Mech.,709, pp. 445–489.
[120] Br€andle de Motta, J. C., Breugem, W. P., Gazanion, B., Estivalezes, J. L., Vin-cent, S., and Climent, E., 2013, “Numerical Modelling of Finite-Size ParticleCollisions in a Viscous Fluid,” Phys. Fluids, 25(8), p. 083302.
[121] Qian, J., and Law, C., 1997, “Regimes of Coalescence and Separation in Drop-let Collision,” J. Fluid Mech., 331, pp. 59–80.
[122] Pan, K.-L., Law, C. K., and Zhou, B., 2008, “Experimental and MechanisticDescription of Merging and Bouncing in Head-on Binary Droplet Collision,”J. Appl. Phys., 103(6), p. 064901.
[123] Jia, X., Yang, J.-C., Zhang, J., and Ni, M.-J., 2019, “An Experimental Investi-gation on the Collision Outcomes of Binary Liquid Metal Droplets,” Int. J.Multiphase Flow, 116, pp. 80–90.
[124] Chen, X., Ma, D., Khare, P., and Yang, V., 2011, “Energy and Mass TransferDuring Binary Droplet Collision,” AIAA Paper No. 2011–771.
[125] Ganti, H., Khare, P., and Bravo, L., 2020, “Binary Collision of CMASDroplets - Part i: Equal Sized Droplets,” J. Mater. Res., 35(17), pp.2260–2274.
[126] Ganti, H., Khare, P., and Bravo, L., 2020, “Binary Collision of CMASDroplets - Part ii: Unequal Sized Droplets,” J. Mater. Res., 35(17), pp.2275–2287.
[127] Sommerfeld, M., and Kuschel, M., 2016, “Modelling Droplet CollisionOutcomes for Different Substances and Viscosities,” Exp. Fluids, 57(12), p. 187.
[128] Gotaas, C., Havelka, P., Jakobsen, H. A., Svendsen, H. F., Hase, M., Roth, N.,and Weigand, B., 2007, “Effect of Viscosity on Droplet-Droplet Collision Out-come: Experimental Study and Numerical Comparison,” Phys. Fluids, 19(10),p. 102106.
[129] Nasr, H., Ahmadi, G., and McLaughlin, J. B., 2009, “A DNS Study of Effectsof Particleparticle Collisions and Two-Way Coupling on Particle Depositionand Phasic Fluctuations,” J. Fluid Mech., 640, pp. 507–536.
[130] Haddadi, H., Shojaei-Zadeh, S., and Morris, J. F., 2016, “Lattice-BoltzmannSimulation of Inertial Particle-Laden Flow Around an Obstacle,” Phys. Rev.Fluids, 1(2), pp. 1–17.
[131] Troiano, M., Solimene, R., Salatino, P., and Montagnaro, F., 2016,“Multiphase Flow Patterns in Entrained-Flow Slagging Gasifiers: PhysicalModelling of Particle-Wall Impact at Near-Ambient Conditions,” Fuel Pro-cess. Technol., 141, pp. 106–116.
[132] Johnson, P. L., Bassenne, M., and Moin, P., 2020, “Turbophoresis of SmallInertial Particles: Theoretical Considerations and Application to Wall-Modelled Large-Eddy Simulations,” J. Fluid Mech., 883, pp. 1–38.
[133] Afkhami, M., Hassanpour, A., Fairweather, M., and Njobuenwu, D. O., 2015,“Fully Coupled LES-DEM of Particle Interaction and Agglomeration in a Tur-bulent Channel Flow,” Comput. Chem. Eng., 78, pp. 24–38.
[134] Sommerfeld, M., 2001, “Validation of a Stochastic Lagrangian ModellingApproach for Inter-Particle Collisions in Homogeneous Isotropic Turbulence,”Int. J. Multiphase Flow, 27(10), pp. 1829–1858.
[135] Hoomans, B. P. B., Kuipers, J. A., Briels, W. J., and Swaaij, W. P. M. V. A.N., 1996, “Discrete Particle Simulation of Bubble and Slug Formation in a 2DGas-Fluidised Bed: A Hard-Sphere Approach,” Chem. Eng. Sci., 51(1), pp.99–118.
[136] Chen, M., Kontomaris, K., and McLaughlin, J. B., 1999, “Direct NumericalSimulation of Droplet Collisions in a Turbulent Channel Flow. Part I: Colli-sion Algorithm,” Int. J. Multiphase Flow, 24(7), pp. 1079–1103.
[137] Li, Y., McLaughlin, J. B., Kontomaris, K., and Portela, L., 2001, “NumericalSimulation of Particle-Laden Turbulent Channel Flow,” Phys. Fluids, 13(10),pp. 2957–2967.
[138] Fede, P., and Simonin, O., 2006, “Numerical Study of the Subgrid Fluid Tur-bulence Effects on the Statistics of Heavy Colliding Particles,” Phys. Fluids,18(4), p. 045103.
[139] Mallouppas, G., and van Wachem, B., 2013, “Large Eddy Simulations of Tur-bulent Particle-Laden Channel Flow,” Int. J. Multiphase Flow, 54, pp. 65–75.
[140] Cundall, P. A., and Strack, O., 1979, “A Discrete Numerical Model for Granu-lar Assemblies,” Geotechnique, 29(1), pp. 47–65.
[141] Luo, K., Wu, F., Qiu, K., Wang, Z., and Fan, J., 2015, “Effects of PreferentialConcentration on Collision and Erosion Between Solid Particles and TubeBank in a Duct Flow,” Int. J. Heat Mass Transfer, 83, pp. 372–381.
[142] Luo, K., Tan, J., Wang, Z., and Fan, J., 2015, “Particle-Resolved DirectNumerical Simulation of Gas-Solid Dynamics in Experimental FluidizedBeds,” AICHE J., 61(3), pp. 857–866.
[143] Costa, P., Boersma, B. J., Westerweel, J., and Breugem, W. P., 2015,“Collision Model for Fully Resolved Simulations of Flows Laden With Finite-Size Particles,” Phys. Rev. E - Stat., Nonlinear, Soft Mat. Phys., 92(5), pp.1–14.
[144] Deen, N. G., Van Sint Annaland, M., Van der Hoef, M. A., and Kuipers, J. A.,2007, “Review of Discrete Particle Modeling of Fluidized Beds,” Chem. Eng.Sci., 62(1–2), pp. 28–44.
[145] Wiesner, V. L., Vempati, U. K., and Bansal, N. P., 2016, “High TemperatureViscosity of Calcium-Magnesium-Aluminosilicate Glass From SyntheticSand,” Scr. Mater., 124, pp. 189–192.
[146] Yarin, A., 2006, “Drop Impact Dynamics: Splashing, Spreading, Receding,Bouncing…,” Annu. Rev. Fluid Mech., 38(1), pp. 159–192.
[147] Moreira, A. L. N., Moita, A. S., and Pan~ao, M. R., 2010, “Advances and Chal-lenges in Explaining Fuel Spray Impingement: How Much of Single DropletImpact Research is Useful?,” Prog. Energy Combust. Sci., 36(5), pp. 554–580.
[148] Josserand, C., and Thoroddsen, S., 2016, “Drop Impact on a Solid Surface,”Annu. Rev. Fluid Mech., 48(1), pp. 365–391.
[149] Liang, G., and Mudawar, I., 2017, “Review of Drop Impact on Heated Walls,”Int. J. Heat Mass Transfer, 106, pp. 103–126.
[150] de Gennes, P. G., 1985, “Wetting: Statics and Dynamics,” Rev. Mod. Phys.,57(3), pp. 827–863.
[151] Rioboo, R., 2001, “Impact de Gouttes Sur Surfaces Solides et Seches,” Thesede doctorat, Paris 6, Jan.
[152] Xu, L., 2007, “Liquid Drop Splashing on Smooth, Rough, and TexturedSurfaces,” Phys. Rev. E, 75(5), p. 056316.
[153] Gao, M., Kong, P., Zhang, L.-X., and Liu, J.-N., 2017, “An ExperimentalInvestigation of Sessile Droplets Evaporation on Hydrophilic and Hydropho-bic Heating Surface With Constant Heat Flux,” Int. Commun. Heat MassTransfer, 88, pp. 262–268.
[154] Yun, S., and Lim, G., 2014, “Ellipsoidal Drop Impact on a Solid Surface forRebound Suppression,” J. Fluid Mech., 752, pp. 266–281.
[155] Pumphrey, H. C., and Elmore, P. A., 1990, “The Entrainment of Bubbles byDrop Impacts,” J. Fluid Mech., 220, pp. 539–567.
[156] Chandra, S., and Avedisian, C. T., 1991, “On the Collision of a Droplet With aSolid Surface,” Proc. R. Soc. London. Ser. A: Math. Phys. Sci., 432(1884), pp.13–41.
[157] de Ruiter, J., Mugele, F., and van den Ende, D., 2015, “Air Cushioning inDroplet Impact. I. Dynamics of Thin Films Studied by Dual WavelengthReflection Interference Microscopy,” Phys. Fluids, 27(1), p. 012104.
[158] Kolinski, J. M., Mahadevan, L., and Rubinstein, S. M., 2014, “Drops CanBounce From Perfectly Hydrophilic Surfaces,” EPL (Europhys. Lett.), 108(2),p. 24001.
[159] Rioboo, R., Marengo, M., and Tropea, C., 2002, “Time Evolution of LiquidDrop Impact Onto Solid, Dry Surfaces,” Exp. Fluids, 33(1), pp. 112–124.
[160] Yarin, A. L., and Weiss, D. A., 1995, “Impact of Drops on Solid Surfaces:Self-Similar Capillary Waves, and Splashing as a New Type of Kinematic Dis-continuity,” J. Fluid Mech., 283, pp. 141–173.
[161] Roisman, I. V., Horvat, K., and Tropea, C., 2006, “Spray Impact: Rim Trans-verse Instability Initiating Fingering and Splash, and Description of a Second-ary Spray,” Phys. Fluids, 18(10), p. 102104.
[162] Mao, T., Kuhn, D. C. S., and Tran, H., 1997, “Spread and Rebound ofLiquid Droplets Upon Impact on Flat Surfaces,” AIChE J., 43(9), pp. 2169–2179.
[163] Moita, A. S., and Moreira, A. L. N., 2007, “Drop Impacts Onto Cold andHeated Rigid Surfaces: Morphological Comparisons, Disintegration Limitsand Secondary Atomization,” Int. J. Heat Fluid Flow, 28(4), pp. 735–752.
Applied Mechanics Reviews JULY 2021, Vol. 73 / 040801-25
Dow
nloaded from http://asm
edigitalcollection.asme.org/appliedm
echanicsreviews/article-pdf/73/4/040801/6733986/am
r_073_04_040801.pdf by University of C
incinnati user on 30 July 2021

[164] Driscoll, M. M., Stevens, C. S., and Nagel, S. R., 2010, “Thin Film FormationDuring Splashing of Viscous Liquids,” Phys. Rev. E, 82(3), p. 036302.
[165] Xu, L., Zhang, W. W., and Nagel, S. R., 2005, “Drop Splashing on a DrySmooth Surface,” Phys. Rev. Lett., 94(18), p. 184505.
[166] Vander Wal, R. L., Berger, G. M., and Mozes, S. D., 2006, “The CombinedInfluence of a Rough Surface and Thin Fluid Film Upon the Splashing Thresh-old and Splash Dynamics of a Droplet Impacting Onto Them,” Exp. Fluids,40(1), pp. 23–32.
[167] Tropea, C., and Marengo, M., 1999, “The Impact of Drops on Walls Films,”Multiphase Sci. Technol., 11(1), pp. 19–36.
[168] Cossali, G. E., Coghe, A., and Marengo, M., 1997, “The Impact of a SingleDrop on a Wetted Solid Surface,” Exp. Fluids, 22(6), pp. 463–472.
[169] Liang, G., Shen, S., Guo, Y., and Zhang, J., 2016, “Boiling From Liquid DropsImpact on a Heated Wall,” Int. J. Heat Mass Transfer, 100, pp. 48–57.
[170] Makino, K., and Michiyopshi, I., 1979, “Effects of the Initial Size of WaterDroplet on Its Evaporation on Heated Surfaces,” Int. J. Heat Mass Transfer,22(6), pp. 979–981.
[171] Nishio, S., and Hirata, M., 1978, “Direct Contact Phenomenon Between a Liq-uid Droplet and High Temperature Solid Surface,” 6th International HeatTransfer Conference, Toronto, ON, Canada, Aug. 7–11, pp. 245–250.
[172] Celata, G. P., Cumo, M., Mariani, A., and Zummo, G., 2006, “Visualization ofthe Impact of Water Drops on a Hot Surface: Effect of Drop Velocity and Sur-face Inclination,” Heat Mass Transfer, 42(10), pp. 885–890.
[173] Bernardin, J. D., and Mudawar, I., 2004, “A Leidenfrost Point Model for Imping-ing Droplets and Sprays,” ASME J. Heat Transfer, 126(2), pp. 272–278.
[174] Rafa€ı, S., Bonn, D., and Boudaoud, A., 2004, “Spreading of non-NewtonianFluids on Hydrophilic Surfaces,” J. Fluid Mech., 513, pp. 77–85.
[175] Bartolo, D., Boudaoud, A., Narcy, G., and Bonn, D., 2007, “Dynamics ofNon-Newtonian Droplets,” Phys. Rev. Lett., 99(17), p. 174502.
[176] Moon, J. H., Kim, D. Y., and Lee, S. H., 2014, “Spreading and Receding Char-acteristics of a non-Newtonian Droplet Impinging on a Heated Surface,” Exp.Therm. Fluid Sci., 57, pp. 94–101.
[177] Bergeron, V., Bonn, D., Martin, J. Y., and Vovelle, L., 2000, “Controlling Drop-let Deposition With Polymer Additives,” Nature, 405(6788), pp. 772–775.
[178] Zang, D., Zhang, W., Song, J., Chen, Z., Zhang, Y., Geng, X., and Chen, F.,2014, “Rejuvenated Bouncing of non-Newtonian Droplet Via NanoparticleEnwrapping,” Appl. Phys. Lett., 105(23), p. 231603.
[179] Han, Z., Xu, Z., and Trigui, N., 2000, “Spray/Wall Interaction Models forMultidimensional Engine Simulation,” Int. J. Engine Res., 1(1), pp. 127–146.
[180] Cossali, G., Marengo, M., and Santini, M., 2004, “Drop Array Impacts onHeated Surfaces: Secondary Atomization Characteristics,” 19th Annual Meet-ing of ILASS, Nottingham, UK, 06-08/09/2004, ILASS Europe, pp. 1–8.
[181] Barnes, H., Hardalupas, Y., Taylor, A., Wilkins, J., et alet al 1999, “An Inves-tigation of the Interaction Between Two Adjacent Impinging Droplets,” Pro-ceedings of the 15th International Conference on Liquid Atomisation andSpray Systems (ILASS), Toulouse, pp. 1–7.
[182] Moreira, A., and Panao, M. O., 2011, “Spray-Wall Impact,” Handbook ofAtomization and Sprays, Springer Science and Business Media, LLC, Boston,MA, pp. 441–455.
[183] Chaussonet, G., Bravo, L., Flatau, A., Koch, R., and Bauer, H.-J., 2020,“Smoothed Particle Hydrodynamics Simulation of High Velocity ImpactDynamics of Molten Sand Particles,” Energies, 13(19), p. 5134.
[184] Shikhmurzaev, Y. D., 1997, “Moving Contact Lines in Liquid/Liquid/SolidSystems,” J. Fluid Mech., 334, pp. 211–249.
[185] Haley, P. J., and Miksis, M. J., 1991, “The Effect of the Contact Line on Drop-let Spreading,” J. Fluid Mech., 223(1), pp. 57–81.
[186] Bussmann, M., Mostaghimi, J., and Chandra, S., 1999, “On a Three-Dimensional Volume Tracking Model of Droplet Impact,” Phys. Fluids, 11(6),pp. 1406–1417.
[187] Bussmann, M., Chandra, S., and Mostaghimi, J., 2000, “Modeling the Splashof a Droplet Impacting a Solid Surface,” Phys. Fluids, 12(12), pp. 3121–3132.
[188] Mehdi-Nejad, V., Mostaghimi, J., and Chandra, S., 2003, “Air Bubble Entrap-ment Under an Impacting Droplet,” Phys. Fluids, 15(1), pp. 173–183.
[189] �Sikalo, �S., Wilhelm, H.-D., Roisman, I. V., Jakirlic, S., and Tropea, C., 2005,“Dynamic Contact Angle of Spreading Droplets: Experiments and Simu-lations,” Phys. Fluids, 17(6), p. 062103.
[190] �Sikalo, �S., Tropea, C., and Ganic, E. N., 2005, “Impact of Droplets OntoInclined Surfaces,” J. Colloid Interface Sci., 286(2), pp. 661–669.
[191] Nikolopoulos, N., Theodorakakos, A., and Bergeles, G., 2005, “NormalImpingement of a Droplet Onto a Wall Film: A Numerical Investigation,” Int.J. Heat Fluid Flow, 26(1), pp. 119–132.
[192] Shetabivash, H., Ommi, F., and Heidarinejad, G., 2014, “Numerical Analysisof Droplet Impact Onto Liquid Film,” Phys. Fluids, 26(1), p. 012102.
[193] Li, R., Ninokata, H., and Mori, M., 2011, “A Numerical Study of Impact ForceCaused by Liquid Droplet Impingement Onto a Rigid Wall,” Prog. Nucl.Energy, 53(7), pp. 881–885.
[194] Strotos, G., Gavaises, M., Theodorakakos, A., and Bergeles, G., 2008,“Numerical Investigation of the Cooling Effectiveness of a Droplet Impingingon a Heated Surface,” Int. J. Heat Mass Transfer, 51(19–20), pp. 4728–4742.
[195] Kim, D., Ivey, C., Frank, H., and Bravo, L., 2020, “An Efficient High-Resolution Volume-of-Fluid Method With Low Numerical Diffusion onUnstructured Grids,” J. Comput. Phys., epub.
[196] Sethian, J. A., 1996, “A Fast Marching Level Set Method for MonotonicallyAdvancing Fronts,” Proc. Natl. Acad. Sci., 93(4), pp. 1591–1595.
[197] Spelt, P. D. M., 2005, “A Level-Set Approach for Simulations of Flows WithMultiple Moving Contact Lines With Hysteresis,” J. Comput. Phys., 207(2),pp. 389–404.
[198] Caviezel, D., Narayanan, C., and Lakehal, D., 2008, “Adherence and Bounc-ing of Liquid Droplets Impacting on Dry Surfaces,” Microfluid. Nanofluid.,5(4), pp. 469–478.
[199] Yokoi, K., 2011, “Numerical Studies of Droplet Splashing on a Dry Surface:Triggering a Splash With the Dynamic Contact Angle,” Soft Matter, 7(11), pp.5120–5123.
[200] Patil, N. D., Gada, V. H., Sharma, A., and Bhardwaj, R., 2016, “On Dual-GridLevel-Set Method for Contact Line Modeling During Impact of a Droplet onHydrophobic and Superhydrophobic Surfaces,” Int. J. Multiphase Flow, 81,pp. 54–66.
[201] Shahmohammadi Beni, M., Zhao, J., and Yu, K. N., 2018, “Investigation ofDroplet Behaviors for Spray Cooling Using Level Set Method,” Ann. Nucl.Energy, 113, pp. 162–170.
[202] Yokoi, K., 2008, “A Numerical Method for Free-Surface Flows and Its Appli-cation to Droplet Impact on a Thin Liquid Layer,” J. Sci. Comput., 35(2–3),pp. 372–396.
[203] Selvam, R. P., Lin, L., and Ponnappan, R., 2006, “Direct Simulation of SprayCooling: Effect of Vapor Bubble Growth and Liquid Droplet Impact on HeatTransfer,” Int. J. Heat Mass Transfer, 49(23–24), pp. 4265–4278.
[204] Ding, H., and Spelt, P. D. M., 2007, “Inertial Effects in Droplet Spreading: AComparison Between Diffuse-Interface and Level-Set Simulations,” J. FluidMech., 576, pp. 287–296.
[205] Selvam, R. P., Bhaskara, S., Balda, J. C., Barlow, F., and Elshabini, A., 2005,“Computer Modeling of Liquid Droplet Impact on Heat Transfer During SprayCooling,” pp. 179–188.
[206] Chatzikyriakou, D., Walker, S. P., Hewitt, G. F., Narayanan, C., and Lakehal,D., 2009, “Comparison of Measured and Modelled Droplet–Hot Wall Inter-actions,” Appl. Therm. Eng., 29(7), pp. 1398–1405.
[207] Pournaderi, P., and Pishevar, A. R., 2012, “A Numerical Investigation ofDroplet Impact on a Heated Wall in the Film Boiling Regime,” Heat MassTransfer, 48(9), pp. 1525–1538.
[208] Choi, M., Son, G., and Shim, W., 2017, “Numerical Simulation of DropletImpact and Evaporation on a Porous Surface,” Int. Commun. Heat MassTransfer, 80, pp. 18–29.
[209] Sussman, M., and Puckett, E. G., 2000, “A Coupled Level Set and Volume-of-Fluid Method for Computing 3D and Axisymmetric Incompressible Two-Phase Flows,” J. Comput. Phys., 162(2), pp. 301–337.
[210] Guo, Y., Wei, L., Liang, G., and Shen, S., 2014, “Simulation of DropletImpact on Liquid Film With CLSVOF,” Int. Commun. Heat Mass Transfer,53, pp. 26–33.
[211] Liang, G., Mu, X., Guo, Y., and Shen, S., 2016, “Flow and Heat Transfer Dur-ing a Single Drop Impact on a Liquid Film,” Numer. Heat Transfer, Part B:Fundam., 69(6), pp. 575–582.
[212] Hong, W., and Wang, Y., 2017, “A Coupled Level Set and Volume-of-FluidSimulation for Heat Transfer of the Double Droplet Impact on a Spherical Liq-uid Film,” Numer. Heat Transfer, Part B: Fundam., 71(4), pp. 359–371.
[213] Li, D., Duan, X., Zheng, Z., and Liu, Y., 2018, “Dynamics and Heat Transferof a Hollow Droplet Impact on a Wetted Solid Surface,” Int. J. Heat MassTransfer, 122, pp. 1014–1023.
[214] Shan, X., and Chen, H., 1993, “Lattice Boltzmann Model for SimulatingFlows With Multiple Phases and Components,” Phys. Rev. E, 47(3), pp.1815–1819.
[215] Swift, M. R., Orlandini, E., Osborn, W. R., and Yeomans, J. M., 1996, “LatticeBoltzmann Simulations of Liquid-Gas and Binary Fluid Systems,” Phys. Rev.E, 54(5), pp. 5041–5052.
[216] He, X., Chen, S., and Zhang, R., 1999, “A Lattice Boltzmann Scheme forIncompressible Multiphase Flow and Its Application in Simulation ofRayleigh–Taylor Instability,” J. Comput. Phys., 152(2), pp. 642–663.
[217] Chen, L., Kang, Q., Mu, Y., He, Y.-L., and Tao, W.-Q., 2014, “A CriticalReview of the Pseudopotential Multiphase Lattice Boltzmann Model: Methodsand Applications,” Int. J. Heat Mass Transfer, 76, pp. 210–236.
[218] Liang, H., Li, Y., Chen, J., and Xu, J., 2019, “Axisymmetric Lattice Boltz-mann Model for Multiphase Flows With Large Density Ratio,” Int. J. HeatMass Transfer, 130, pp. 1189–1205.
[219] Mukherjee, S., and Abraham, J., 2007, “Investigations of Drop Impact on DryWalls With a lattice-Boltzmann Model,” J. Colloid Interface Sci., 312(2), pp.341–354.
[220] Hao, L., and Cheng, P., 2009, “Lattice Boltzmann Simulations of Liquid Drop-let Dynamic Behavior on a Hydrophobic Surface of a Gas Flow Channel,” J.Power Sources, 190(2), pp. 435–446.
[221] Gupta, A., and Kumar, R., 2010, “Droplet Impingement and Breakup on a DrySurface,” Comput. Fluids, 39(9), pp. 1696–1703.
[222] Shen, S., Bi, F., and Guo, Y., 2012, “Simulation of Droplets Impact on CurvedSurfaces With Lattice Boltzmann Method,” Int. J. Heat Mass Transfer,55(23–24), pp. 6938–6943.
[223] Zhang, D., Papadikis, K., and Gu, S., 2014, “Three-Dimensional Multi-Relaxation Time lattice-Boltzmann Model for the Drop Impact on a Dry Sur-face at Large Density Ratio,” Int. J. Multiphase Flow, 64, pp. 11–18.
[224] Raman, K. A., Jaiman, R. K., Lee, T.-S., and Low, H.-T., 2016, “Lattice Boltz-mann Simulations of Droplet Impact Onto Surfaces With VaryingWettabilities,” Int. J. Heat Mass Transfer, 95, pp. 336–354.
[225] Raman, K., Jaiman, R., Lee, T., and Low, H., 2015, “On the Dynamics ofCrown Structure in Simultaneous Two Droplets Impact Onto Stationary andMoving Liquid Film,” Comput. Fluids, 107, pp. 285–300.
[226] Taghilou, M., and Rahimian, M. H., 2014, “Lattice Boltzmann Model forThermal Behavior of a Droplet on the Solid Surface,” Int. J. Therm. Sci., 86,pp. 1–11.
040801-26 / Vol. 73, JULY 2021 Transactions of the ASME
Dow
nloaded from http://asm
edigitalcollection.asme.org/appliedm
echanicsreviews/article-pdf/73/4/040801/6733986/am
r_073_04_040801.pdf by University of C
incinnati user on 30 July 2021

[227] Shadloo, M. S., Oger, G., and Le Touz�e, D., 2016, “Smoothed Particle Hydro-dynamics Method for Fluid Flows, Towards Industrial Applications: Motiva-tions, Current State, and Challenges,” Comput. Fluids, 136, pp. 11–34.
[228] Brackbill, J. U., Kothe, D. B., and Zemach, C., 1992, “A Continuum Methodfor Modeling Surface Tension,” J. Comput. Phys., 100(2), pp. 335–354.
[229] Adami, S., Hu, X. Y., and Adams, N. A., 2010, “A New Surface-Tension For-mulation for Multi-Phase SPH Using a Reproducing Divergence Approx-imation,” J. Comput. Phys., 229(13), pp. 5011–5021.
[230] Barcarolo, D. A., Le Touz�e, D., Oger, G., and de Vuyst, F., 2014, “AdaptiveParticle Refinement and Derefinement Applied to the Smoothed ParticleHydrodynamics Method,” J. Comput. Phys., 273, pp. 640–657.
[231] Li, D., Bai, L., Li, L., and Zhao, M., 2014, “SPH Modeling of Droplet Impacton Solid Boundary,” Trans. Tianjin Univ., 20(2), pp. 112–117.
[232] Shigorina, E., Kordilla, J., and Tartakovsky, A. M., 2017, “Smoothed ParticleHydrodynamics Study of the Roughness Effect on Contact Angle and DropletFlow,” Phys. Rev. E, 96(3), p. 033115.
[233] Xu, X., Ouyang, J., Jiang, T., and Li, Q., 2014, “Numerical Analysis of theImpact of Two Droplets With a Liquid Film Using an Incompressible SPHMethod,” J. Eng. Math., 85(1), pp. 35–53.
[234] Ma, T., Zhang, F., Liu, H., and Yao, M., 2017, “Modeling of Droplet/WallInteraction Based on SPH Method,” Int. J. Heat Mass Transfer, 105, pp.296–304.
[235] Yang, X., Dai, L., and Kong, S.-C., 2017, “Simulation of Liquid Drop Impacton Dry and Wet Surfaces Using SPH Method,” Proc. Combust. Inst., 36(2),pp. 2393–2399.
[236] Yang, X., and Kong, S.-C., 2018, “3D Simulation of Drop Impact on Dry Sur-face Using SPH Method,” Int. J. Comput. Methods, 15(3), p. 1850011.
[237] Ray, M., Yang, X., Kong, S., Bravo, L., and Kweon, C., 2016, “High FidelitySimulation of Drop Collision and Vapor-Liquid Equilibrium of Van DerWaals Fluids,” Proc. Combust. Inst., 36, pp. 2385–2392.
[238] Yang, X., Ray, M., Kong, S.-C., and Kweon, C.-B. M., 2019, “SPH Simulationof Fuel Drop Impact on Heated Surfaces,” Proc. Combust. Inst., 37(3), pp.3279–3286.
[239] Jiang, T., Ouyang, J., Yang, B., and Ren, J., 2010, “The SPH Method for Sim-ulating a Viscoelastic Drop Impact and Spreading on an Inclined Plate,” Com-put. Mech., 45(6), pp. 573–583.
[240] Xu, X., Ouyang, J., Jiang, T., and Li, Q., 2012, “Numerical Simulation of 3D-Unsteady Viscoelastic Free Surface Flows by Improved Smoothed ParticleHydrodynamics Method,” J. Non-Newtonian Fluid Mech., 177–178, pp.109–120.
[241] Mirjalili, S., Jain, S. S., and Dodd, M., 2017, “Interface-Capturing Methodsfor Two-Phase Flows: An Overview and Recent Developments,” Cent. Turbul.Res. Annu. Res. Briefs, 2017, pp. 117–135.
[242] Ding, H., Spelt, P. D., and Shu, C., 2007, “Diffuse Interface Model for Incom-pressible Two-Phase Flows With Large Density Ratios,” J. Comput. Phys.,226(2), pp. 2078–2095.
[243] Mirjalili, S., Ivey, C. B., and Mani, A., 2016, “Cost and Accuracy ComparisonBetween the Diffuse Interface Method and the Geometric Volume of FluidMethod for Simulating Two-Phase Flows,” APS Division of Fluid DynamicsMeeting Abstracts, American Physical Society 69th Annual Division of FluidDynamics Annual Meeting, Portland, OR, Nov. 20–22, pp. R29–008.
[244] Mirjalili, S., and Mani, A., 2021, “Consistent, Energy-Conserving MomentumTransport for Simulations of Two-Phase Flows Using the Phase Field Equa-tions,” J. Comput. Phys., 426, p. 109918.
[245] Zhang, Q., Qian, T.-Z., and Wang, X.-P., 2016, “Phase Field Simulation of aDroplet Impacting a Solid Surface,” Phys. Fluids, 28(2), p. 022103.
[246] Shen, M., Li, B. Q., Yang, Q., Bai, Y., Wang, Y., Zhu, S., Zhao, B., Li, T., andHu, Y., 2019, “A Modified Phase-Field Three-Dimensional Model for DropletImpact With Solidification,” Int. J. Multiphase Flow, 116, pp. 51–66.
[247] Ahmadi-Befrui, B., Uchil, N., Gosman, A. D., and Issa, R. I., 1996, “Modelingand Simulation of Thin Liquid Films Formed by Spray-Wall Interaction,”SAE Paper No. 960627.
[248] Bai, C., and Gosman, A. D., 1995, “Development of Methodology for SprayImpingement Simulation,” SAE Paper No. 950283.
[249] Stanton, D. W., and Rutland, C. J., 1996, “Modeling Fuel Film Formation andWall Interaction in Diesel Engines,” SAE Paper No. 960628.
[250] O’Rourke, P., and Amsden, A. A., 1996, “A Particle Numerical Model forWall Film Dynamics in Port-Injected Engines,” SAE Paper No. 961961.
[251] O’Rourke, P. J., and Amsden, A. A., 2000, “A Spray/Wall Interaction Submo-del for the KIVA-3 Wall Film Model,” SAE Paper No. 2000-01-0271.
[252] Zhang, Y., Jia, M., Liu, H., Xie, M., Wang, T., and Zhou, L., 2014,“Development of a New Spray/Wall Interaction Model for Diesel Spray UnderPCCI-Engine Relevant Conditions,” Atomization Sprays, 24(1), pp. 41–80.
[253] Ma, T., Feng, L., Wang, H., Liu, H., and Yao, M., 2017, “A Numerical Studyof Spray/Wall Impingement Based on Droplet Impact Phenomenon,” Int. J.Heat Mass Transfer, 112, pp. 401–412.
[254] Chaussonnet, G., 2014, “Modeling of Liquid Film and Breakup Phenomena inLarge-Eddy Simulations of Aeroengines Fueled by Airblast Atomizers,” Ph.D.thesis, Institut National Polytechnique, Toulouse, France.
[255] Milanez, M., and Naterer, G. F., 2005, “Eulerian Cross-Phase DiffusiveEffects on Impinging Droplets and Phase Change Heat Transfer,” Int. Com-mun. Heat Mass Transfer, 32(3–4), pp. 286–295.
[256] Honsek, R., Habashi, W. G., and Aub�e, M. S., 2008, “Eulerian Modeling of in-Flight Icing Due to Supercooled Large Droplets,” J. Aircr., 45(4), pp. 1290–1296.
[257] Bilodeau, D. R., Habashi, W. G., Fossati, M., and Baruzzi, G. S., 2015,“Eulerian Modeling of Supercooled Large Droplet Splashing and Bouncing,”J. Aircr., 52(5), pp. 1611–1624.
[258] Mundo, C., Sommerfeld, M., and Tropea, C., 1995, “Droplet-Wall Collisions:Experimental Studies of the Deformation and Breakup Process,” Int. J. Multi-phase Flow, 21(2), pp. 151–173.
[259] Rosa, N. G., Villedieu, P., Dewitte, J., and Lavergne, G., 2006, “A NewDroplet-Wall Interaction Model,” Proceedings of the 10th International Con-ference on Liquid Atomization and Spray Systems, pp. 29–32. Tokyo, Japan,Vol. 27.
[260] Staat, H. J. J., Tran, T., Geerdink, B., Riboux, G., Sun, C., Gordillo, J. M., andLohse, D., 2015, “Phase Diagram for Droplet Impact on SuperheatedSurfaces,” J. Fluid Mech., 779, p. R3.
[261] Wachters, L. H. J., and Westerling, N. A. J., 1966, “The Heat Transfer From aHot Wall to Impinging Water Drops in the Spheroidal State,” Chem. Eng.Sci., 21(11), pp. 1047–1056.
[262] Wang, A.-B., Chen, C.-C., and Hwang, W.-C., 2002, “On Some New Aspectsof Splashing Impact of Drop-Liquid Surface Interactions,” Drop-SurfaceInteractions, M. Rein, ed., CISM International Centre for Mechanical Scien-ces, Springer, Vienna, Austria, pp. 303–306.
[263] Chen, R.-H., Chiu, S.-L., and Lin, T.-H., 2007, “On the Collision Behaviors ofa Diesel Drop Impinging on a Hot Surface,” Exp. Therm. Fluid Sci., 32(2), pp.587–595.
[264] Pan, K. L., and Law, C. K., 2007, “Dynamics of Droplet–Film Collision,” J.Fluid Mech., 587, pp. 1–22.
[265] Madejski, J., 1976, “Solidification of Droplets on a Cold Surface,” Int. J. HeatMass Transfer, 19(9), pp. 1009–1013.
[266] Yang, W. J., 1975, “Theory on Vaporization and Combustion of Liquid Dropsof Pure Substances and Binary Mixtures on Heated Surfaces,” Instiute ofSpace and Aeronautical Science, University of Tokyo, Report No. 535, pp.423–455.
[267] Pasandideh-Fard, M., Qiao, Y. M., Chandra, S., and Mostaghimi, J., 1996,“Capillary Effects During Droplet Impact on a Solid Surface,” Phys. Fluids,8(3), pp. 650–659.
[268] Vadillo, D. C., Soucemarianadin, A., Delattre, C., and Roux, D. C. D., 2009,“Dynamic Contact Angle Effects Onto the Maximum Drop Impact Spreadingon Solid Surfaces,” Phys. Fluids, 21(12), p. 122002.
[269] Roisman, I. V., 2009, “Inertia Dominated Drop Collisions. II. An AnalyticalSolution of the Navier–Stokes Equations for a Spreading Viscous Film,” Phys.Fluids, 21(5), p. 052104.
[270] Scheller, B. L., and Bousfield, D. W., 1995, “Newtonian Drop Impact With aSolid Surface,” AIChE J., 41(6), pp. 1357–1367.
[271] Seo, J., Lee, J. S., Kim, H. Y., and Yoon, S. S., 2015, “Empirical Model forthe Maximum Spreading Diameter of Low-Viscosity Droplets on a Dry Wall,”Exp. Therm. Fluid Sci., 61, pp. 121–129.
[272] Mundo, C., Sommerfeld, M., and Tropea, C., 1998, “On the Modeling of Liq-uid Sprays Impinging on Surfaces,” Atomization Sprays, 8(6), pp. 625–652.
[273] Samenfink, W., Els€aßer, A., Dullenkopf, K., and Wittig, S., 1999,“Droplet Interaction With Shear-Driven Liquid Films: Analysis of Depositionand Secondary Droplet Characteristics,” Int. J. Heat Fluid Flow, 20(5), pp.462–469.
[274] Senda, J., and Fujimoto, H. G., 1999, “Multidimensional Modeling of Imping-ing Sprays on the Wall in Diesel Engines,” ASME Appl. Mech. Rev., 52(4),pp. 119–138.
[275] Bai, C. X., Rusche, H., and Gosman, A. D., 2002, “Modeling of GasolineSpray Impingement,” Atomization Sprays, 12(1–3), pp. 1–3.
[276] Kuhnke, D., 2004, “Spray/wall interaction modelling by dimensionless dataanalysis,”. Ph.D. thesis, Techn. Univ., Darmstadt, Germany.
[277] Kalantari, D., and Tropea, C., 2007, “Spray Impact Onto Flat and Rigid Walls:Empirical Characterization and Modelling,” Int. J. Multiphase Flow, 33(5),pp. 525–544.
[278] Eckhause, J. E., and Reitz, R. D., 1995, “Modeling Heat Transfer to ImpingingFuel Spray in Direct-Injection Engines,” Atomization Sprays, 5(2), pp.213–242.
[279] Rybicki, J. R., and Mudawar, I., 2006, “Single-Phase and Two-Phase CoolingCharacteristics of Upward-Facing and Downward-Facing Sprays,” Int. J. HeatMass Transfer, 49(1–2), pp. 5–16.
[280] Arcoumanis, C., and Chang, J. C., 1993, “Heat Transfer Between a HeatedPlate and an Impinging Transient Diesel Spray,” Exp. Fluids, 16(2), pp.105–119.
[281] Pan~ao, M. R. O., and Moreira, A. L. N., 2007, “Interpreting the Influence ofFuel Spray Impact on Mixture Preparation for HCCI Combustion With Port-Fuel Injection,” Proc. Combust. Inst., 31(2), pp. 2205–2213.
[282] Tabakoff, W., Hamed, A., and Murugan, D. M., 1996, “Effect of Target Mate-rials on the Particle Restitution Characteristics for TurbomachineryApplication,” J. Propuls. Power, 12(2), pp. 260–266.
[283] Walsh, W. S., Thole, K. A., and Joe, C., 2006, “Effects of Sand Inges-tion on the Blockage of Film-Cooling Holes,” ASME Paper No. GT2006-90067.
[284] Zagnoli, D., Prenter, R., Ameri, A., and Bons, J. P., 2015, “Numerical Studyof Deposition in a Full Turbine Stage Using Steady and Unsteady Methods,”ASME Paper No. GT2015-43613.
[285] Ghoshal, A., Walock, M. J., Murugan, M., Hofmeister-Mock, C., Bravo, L.,Pepi, M., Nieto, A., Wright, A., Luo, J., Jain, N., Flatau, A., and Frehenbacher,L., 2019, “Governing Parameters Influencing CMAS Adhesion and InfiltrationInto Environmental/Thermal Barrier Coatings in Gas Turbine Engines,”ASME Paper No. GT2019-92000.
[286] Bravo, L., Jain, N., Khare, P., Murugan, M., Ghoshal, A., and Flatau, A.,2020, “Physical Aspects of CMAS Particle Dynamics and Deposition in GasTurbine Engines,” J. Mater. Res., 35, pp. 2249–2259.
Applied Mechanics Reviews JULY 2021, Vol. 73 / 040801-27
Dow
nloaded from http://asm
edigitalcollection.asme.org/appliedm
echanicsreviews/article-pdf/73/4/040801/6733986/am
r_073_04_040801.pdf by University of C
incinnati user on 30 July 2021

[287] Hamed, A., and Kuhn, T. P., 1995, “Effects of Variational Particle RestitutionCharacteristics on Turbomachinery Erosion,” ASME J. Eng. Gas TurbinesPower, 117(3), pp. 432–440.
[288] Hamed, A., Jun, Y. D., and Yeuan, J. J., 1995, “Particle Dynamics Simulationsin Inlet Separator With an Experimentally Based Bounce Model,” J. Propuls.Power, 11(2), pp. 230–235.
[289] Brach, R. M., and Dunn, P. F., 1992, “A Mathematical Model of the Impactand Adhesion of Microspheres,” Aerosol Sci. Technol., 16(1), pp. 51–64.
[290] Lawrence, M., Casaday, B., Lageman, D., Bons, J., and Whitaker, S., 2013,“Computational Modeling of High Temperature Deposition in GasTurbine Engines With Experimental Validation,” AIAA Paper No. AIAA2013-1112.
[291] Barker, B. J., 2010, “Simulation of Coal Ash Deposition on Modern TurbineNozzle Guide Vanes,” M.S. thesis, The Ohio State University, Columbus, OH.
[292] Ai, W., and Fletcher, T. H., 2012, “Computational Analysis of Conjugate HeatTransfer and Particulate Deposition on a High Pressure Turbine Vane,” ASMEJ. Turbomach, 134(4), p. 041020.
[293] Sreedharan, S. S., and Tafti, D. K., 2010, “Composition Dependent Model forthe Prediction of Syngas Ash Deposition With Application to a Leading EdgeTurbine Vane,” ASME Paper No. GT2010-23655.
[294] Giordano, D., Russell, J. K., and Dingwell, D. B., 2008, “Viscosity of Mag-matic Liquids: A Model,” Earth Planet. Sci. Lett., 271(1–4), pp. 123–134.
[295] Fluegel, A., 2007, “Glass Viscosity Calculation Based on a Global StatisticalModelling Approach,” Glass Technol., 48(1), p. 18.
[296] Bale, C. W., B�elisle, E., Chartrand, P., Decterov, S. A., Eriksson, G., Hack,K., Jung, I. H., Kang, Y. B., Melancon, J., Pelton, A. D., Robelin, C., andPetersen, S., 2009, “FactSage Thermochemical Software and Databases —Recent Developments,” Calphad, 33(2), pp. 295–311.
[297] N’dala, I., Cambier, F., Anseau, M. R., and Urbain, G., 1984, “Viscosity ofLiquid Feldspars. Part I: Viscosity Measurements,” Trans. J. Br. Ceram. Soc.,83, pp. 108–112.
[298] Senior, C. L., and Srinivasachar, S., 1995, “Viscosity of Ash Particles in Com-bustion Systems for Prediction of Particle Sticking,” Energy Fuels, 9(2), pp.277–283.
[299] Singh, S., and Tafti, D. K., 2016, “Prediction of Sand Transport and Deposi-tion in a Two-Pass Internal Cooling Duct,” ASME J. Eng. Gas TurbinesPower, 138(7), p. 72606.
[300] Singh, S., and Tafti, D., 2015, “Particle Deposition Model for ParticulateFlows at High Temperatures in Gas Turbine Components,” Int. J. Heat FluidFlow, 52, pp. 72–83.
[301] Jackson, R. L., and Green, I., 2005, “A Finite Element Study of Elasto-PlasticHemispherical Contact,” ASME J. Tribol., 127(2), pp. 343–354.
[302] Webb, J., Casaday, B., Barker, B., Bons, J. P., Gledhill, A. D., and Padture, N.P., 2013, “Coal Ash Deposition on Nozzle Guide Vanes—Part I: ExperimentalCharacteristics of Four Coal Ash Types,” ASME J. Turbomach, 135(2), pp.021033–1–021033-9.
[303] Yu, K., and Tafti, D., 2016, “Impact Model for Micrometer-Sized Sand Parti-cles,” Powder Technol., 294, pp. 11–21.
[304] Bons, J. P., Prenter, R., and Whitaker, S., 2016, “A Simple Physics-BasedModel for Particle Rebound and Deposition in Turbomachinery,” ASME J.Turbomach., 139(8), p. 084009.
[305] Barker, B., Hsu, K., Varney, B., Boulanger, A., Hutchinson, J., and Ng, W. F.,2017, “An Experiment-Based Sticking Model for Heated Sand,” ASME PaperNo. GT2017-64421.
[306] Gislason, S. R., Hassenkam, T., Nedel, S., Bovet, N., Eiriksdottir, E. S.,Alfredsson, H. A., Hem, C. P., Balogh, Z. I., Dideriksen, K., Oskarsson, N.,Sigfusson, B., Larsen, G., and Stipp, S. L. S., 2011, “Characterization ofEyjafjallaj€okull Volcanic Ash Particles and a Protocol for Rapid Risk Asses-sment,” PNAS, 108(18), pp. 7307–7312.
[307] Taylor, H. E., and Lichte, F. E., 1980, “Chemical Composition of Mount St.Helens Volcanic Ash,” Geophys. Res. Lett., 7(11), pp. 949–952.
[308] Power Technologies Inc., 2012, “Arizona Test Dust MSDS,” Power Technolo-gies Inc., Arden Hills, MN, accessed May 26, 2021, https://www.powdertech-nologyinc.com/msds/arizona-test-dust/
[309] Wood, C. A., Slater, S. L., Zonneveldt, M., Thornton, J., Armstrong, N., andAntoniou, R. A., 2017, “Characterisation of Dirt, Dust and Volcanic Ash: AStudy on the Potential for Gas Turbine Engine Degradation, Dst-Group-tr-3367,” Tech. rep., Aerospace Division, Defence Science Technology Group,Australian Government Department of Defense.
[310] Levi, C. G., Hutchinson, J. W., Vidal-S�etif, M.-H., and Johnson, C. A., 2012,“Environmental Degradation of Thermal-Barrier Coatings by Molten Depos-its,” MRS Bull., 37(10), pp. 932–941.
[311] Braue, W., 2009, “Environmental Stability of the YSZ Layer and the YSZ/TGO Interface of an in-Service EB-PVD Coated High-Pressure TurbineBlade,” J Mater Sci, 44(7), pp. 1664–1675.
[312] Mechnich, P., and Braue, W., 2015, “Solid-State CMAS Corrosion of an EB-PVD YSZ Coated Turbine Blade: Zr4þ Partitioning and Phase Evolution,” J.Am. Ceram. Soc., 98(1), pp. 296–302.
[313] Zaleski, E. M., Ensslen, C., and Levi, C. G., 2015, “Melting and Crystalliza-tion of Silicate Systems Relevant to Thermal Barrier Coating Damage,” J.Am. Ceram. Soc., 98(5), pp. 1642–1649.
[314] Sch€on, J., 2011, Physical Properties of Rocks: A Workbook, Elsevier,The Netherlands.
[315] Munro, R. G., 2002, “Elastic Moduli Data for Polycrystalline Oxide Ceram-ics,” NIST Interagency/Internal Report (NISTIR 6853), National Institute ofStandards and Technology, Gaithersburg, MD, accessed July 14, 2021, https://nvlpubs.nist.gov/nistpubs/Legacy/IR/nistir6853.pdf
[316] Chicot, D., Mendoza, J., Zaoui, A., Louis, G., Lepingle, V., Roudet, F., andLesage, J., 2011, “Mechanical Properties of Magnetite (Fe3O4), Hematite (a-Fe2O3) and Goethite (a-FeO�OH) by Instrumented Indentation and MolecularDynamics Analysis,” Mater. Chem. Phys., 129(3), pp. 862–870.
[317] Collaboration: Authors and Editors of the Volumes III/17B-22A-41B, 1999,“Calcium Oxide (CaO) Young’s, Shear and Bulk Modulus, Poisson’s Ratio,”II-VI and I-VII Compounds; Semimagnetic Compounds, O. Madelung, U.R€ossler, and M. Schulz, eds., 41B, Springer-Verlag, Berlin/Heidelberg, pp.1–2.
[318] Pabst, W., and Gregorov�a, E., 2013, “Elastic Properties of Silica Polymorphs– A Review,” Ceram. Silikaty, 53, pp. 167–184.
[319] Lakshtanov, D. L., Sinogeikin, S. V., and Bass, J. D., 2006, “High-Temperature Phase Transitions and Elasticity of Silica Polymorphs,” PhysChem Miner., 34(1), pp. 11–22.
[320] Lorenz, J., Haas, J. L., Clynne, M. A., Schafer, C. M., Potter, R. W., Schafer,C. M., Tomkins, R. P. T., Shakoor, A., Hume, H. R., Yang, J. M., Li, H. H.,and Matula, R. A., 1981, “Physical Properties Data for Rock Salt,” accessedMay 26, 2021, https://digital.library.unt.edu/ark:/67531/metadc13196/
[321] Rao, A. S. M., Narender, K., Rao, K. G. K., and Krishna, N. G., 2013,“Thermophysical Properties of NaCl, NaBr and NaF by c-Ray AttenuationTechnique,” JMP, 4(2), pp. 208–214.
[322] Meille, S., and Garboczi, E. J., 2001, “Linear Elastic Properties of 2D and 3DModels of Porous Materials Made From Elongated Objects,” Modell. Simul.Mater. Sci. Eng., 9(5), pp. 371–390.
[323] Singh, S., Tafti, D., Reagle, C., Delimont, J., Ng, W., and Ekkad, S., 2014,“Sand Transport in a Two Pass Internal Cooling Duct With Rib Turbulators,”Int. J. Heat Fluid Flow, 46, pp. 158–167.
[324] Richardson, J. H., and Sallee, G. P., and Smakula, F., 1979, “Causes of HighPressure Compressor Deterioration in Service,” AIAA Paper No. 6.1979-1234.
[325] Lundgreen, R., Sacco, C., Prenter, R., and Bons, J. P., 2016, “TemperatureEffects on Nozzle Guide Vane Deposition in a New Turbine Cascade Rig,”ASME Paper No. GT2016-57560.
[326] Laycock, R., and Fletcher, T. H., 2015, “Independent Effects of Surface andGas Temperature on Coal Fly Ash Deposition in Gas Turbines atTemperatures Up to 14008C,” ASME J. Eng. Gas Turbines Power, 138(2),p. 021402.
[327] Crosby, J. M., Lewis, S., Bons, J. P., Ai, W. G., and Fletcher, T. H., 2008,“Effects of Temperature and Particle Size on Deposition in Land BasedTurbines,” ASME J. Eng. Gas Turbines Power, 130(5), p. 051503.
[328] Reagle, C. J., Delimont, J. M., Ng, W. F., and Ekkad, S. V., 2013, “Study ofMicroparticle Rebound Characteristics Under High Temperature Conditions,”ASME Paper No. GT2013-95083.
[329] Bons, J. P., Blunt, R., and Whitaker, S., 2015, “A Comparison of Techniquesfor Particle Rebound Measurement in Gas Turbine Applications,” ASMEPaper No. GT2015-43766.
[330] Whitaker, S. M., and Bons, J. P., 2015, “Evaluation of Elastic-Plastic ReboundProperties of Coal Fly Ash Particles for Use in a Universal Turbine DepositionModel,” ASME Paper No. GT2015-43765.
[331] Sacco, C., Bowen, C., Lundgreen, R., Bons, J. P., Ruggiero, E., Allen, J., andBailey, J., 2017, “Dynamic Similarity in Turbine Deposition Testing and theRole of Pressure,” ASME Paper No. GTP-17-1475.
[332] Kim, J., Dunn, M. G., Baran, A. J., Wade, D. P., and Tremba, E. L., 1993,“Deposition of Volcanic Materials in the Hot Sections of Two Gas TurbineEngines,” ASME J. Eng. Gas Turbines Power, 115(3), pp. 641–651.
[333] Schneider, O., Dohmen, H. J., Benra, F.-K., and Brillert, D., 2009,“Investigations of Dust Separation in the Internal Cooling Air System of GasTurbines,” ASME Paper No. GT2003-38293.
[334] Vetere, F., Behrens, H., Holtz, F., Vilardo, G., and Ventura, G., 2010,“Viscosity of Crystal-Bearing Melts and Its Implication for Magma Ascent,”J. Mineralogical Petrological Sci., 105(3), pp. 151–163.
[335] Brunton, S. L., Noack, B. R., and Koumoutsakos, P., 2020, “Machine Learningfor Fluid Mechanics,” Annu. Rev. Fluid Mech., 52(1), pp. 477–508.
[336] Ganti, H., and Khare, P., 2020, “Data-Driven Surrogate Modeling of Multi-phase Flows Using Machine Learning Techniques,” Comput. Fluids, 211, p.104626.
[337] Ganti, H., Kamin, M., and Khare, P., 2020, “Design Space Exploration of Tur-bulent Multiphase Flows Using Machine Learning-Based Surrogate Model,”Energies, 13(17), p. 4565.
[338] Zhu, Y., and Zabaras, N., 2018, “Bayesian Deep ConvolutionalEncoder–Decoder Networks for Surrogate Modeling and UncertaintyQuantification,” J. Comput. Phys., 366, pp. 415–447.
[339] Wang, X., Yeh, S.-T., Chang, Y.-H., and Yang, V., 2018, “A High-FidelityDesign Methodology Using Les-Based Simulation and Pod-Based Emulation:A Case Study of Swirl Injectors,” Chin. J. Aeronautics, 31(9), pp. 1855–1869.
[340] Lye, K. O., Mishra, S., and Ray, D., 2020, “Deep Learning Observables inComputational Fluid Dynamics,” J. Comput. Phys., 410, p. 109339.
[341] Raissi, M., and Karniadakis, G. E., 2018, “Hidden Physics Models: MachineLearning of Nonlinear Partial Differential Equations,” J. Comput. Phys., 357,pp. 125–141.
[342] Raissi, M., Perdikaris, P., and Karniadakis, G. E., 2019, “Physics-InformedNeural Networks: A Deep Learning Framework for Solving Forward andInverse Problems Involving Nonlinear Partial Differential Equations,” J. Com-put. Phys., 378, pp. 686–707.
[343] Yang, L., Meng, X., and Karniadakis, G. E., 2021, “B-Pinns: BayesianPhysics-Informed Neural Networks for Forward and Inverse Pde ProblemsWith Noisy Data,” J. Comput. Phys., 425, p. 109913.
040801-28 / Vol. 73, JULY 2021 Transactions of the ASME
Dow
nloaded from http://asm
edigitalcollection.asme.org/appliedm
echanicsreviews/article-pdf/73/4/040801/6733986/am
r_073_04_040801.pdf by University of C
incinnati user on 30 July 2021

[344] Zhu, Y., Zabaras, N., Koutsourelakis, P.-S., and Perdikaris, P., 2019, “Physics-Constrained Deep Learning for High-Dimensional Surrogate Modeling andUncertainty Quantification Without Labeled Data,” J. Comput. Phys., 394, pp.56–81.
[345] Sen, B. A., and Menon, S., 2010, “Linear Eddy Mixing Based Tabulation andArtificial Neural Networks for Large Eddy Simulations of Turbulent Flames,”Combust. Flame, 157(1), pp. 62–74.
[346] Owoyele, O., Kundu, P., Ameen, M. M., Echekki, T., and Som, S., 2020,“Application of Deep Artificial Neural Networks to Multi-Dimensional Flame-let Libraries and Spray Flames,” Int. J. Engine Res., 21(1), pp. 151–168.
[347] Bhalla, S., Yao, M., Hickey, J.-P., and Crowley, M., 2020, “Compact Repre-sentation of a Multi-Dimensional Combustion Manifold Using Deep NeuralNetworks,” Machine Learning and Knowledge Discovery in Databases, U.Brefeld, E. Fromont, A. Hotho, A. Knobbe, M. Maathuis, and C. Robardet,eds., Springer International Publishing, Berlin, pp. 602–617.
[348] Pawar, S., San, O., Rasheed, A., and Vedula, P., 2020, “A Priori Analysis onDeep Learning of Subgrid-Scale Parameterizations for KraichnanTurbulence,” Theor. Comput. Fluid Dyn., 34(4), pp. 429–455.
[349] Wang, Z., Luo, K., Li, D., Tan, J., and Fan, J., 2018, “Investigations of Data-Driven Closure for Subgrid-Scale Stress in Large-Eddy Simulation,” Phys.Fluids, 30(12), p. 125101.
[350] Yao, S., Wang, B., Kronenburg, A., and Stein, O. T., 2020, “Modeling of Sub-Grid Conditional Mixing Statistics in Turbulent Sprays Using Machine Learn-ing Methods,” Phys. Fluids, 32(11), p. 115124.
[351] Xie, C., Yuan, Z., and Wang, J., 2020, “Artificial Neural Network-Based Non-linear Algebraic Models for Large Eddy Simulation of Turbulence,” Phys.Fluids, 32(11), p. 115101.
[352] Hasslberger, J., Engelmann, L., Kempf, A., and Klein, M., 2021, “RobustDynamic Adaptation of the Smagorinsky Model Based on a Sub-Grid ActivitySensor,” Phys. Fluids, 33(1), p. 015117.
[353] Nikolaou, Z., Chrysostomou, C., Minamoto, Y., and Vervisch, L., 2021,“Evaluation of a Neural Network-Based Closure for the Unresolved Stresses inTurbulent Premixed v-Flames,” Flow, Turbul. Combust., 106(2), pp. 331–356.
[354] Zhu, L., Zhang, W., Sun, X., Liu, Y., and Yuan, X., 2021, “Turbulence Clo-sure for High Reynolds Number Airfoil Flows by Deep Neural Networks,”Aerosp. Sci. Technol., 110, p. 106452.
[355] Siddani, B., Balachandar, S., Moore, W. C., Yang, Y., and Fang, R., 2020,“Machine Learning for Physics-Informed Generation of Dispersed MultiphaseFlow Using Generative Adversarial Networks,” arXiv e-Prints, May,p. arXiv:2005.05363.
[356] Tropea, C., and Roisman, I. V., 2000, “Modeling of Spray Impact on SolidSurfaces,” Atomization Sprays, 10(3–5), pp. 387–408.
[357] Santini, M., Cossali, G., and Marengo, M., 2005, “Single-Drop EmpiricalModels for Spray Impact on Solid Walls: A Review,” Atomization Sprays,15(6), pp. 699–736.
[358] Khare, P., and Yang, V., 2015, “Newtonian and Non-Newtonian Liquid DropletBreakup: Child Droplet Statistics,” 13th International Conference on LiquidAtomization and Spray Systems, ICLASS 2015, Tainan, Taiwan, Aug. 23–27.
[359] Khare, P., 2014, “Breakup of liquid droplets,”. Ph.D. thesis, Georgia Instituteof Technology, Atlanta, GA.
[360] Laval, J., Dubrulle, B., and Nazarenko, S., 2001, “Nonlocality and Intermittencyin Three Dimensional Turbulence,” Phys. Fluids, 13(7), pp. 1995–868.
[361] Egolk, P. W., and Hutter, K., 2013, “Nonlinear,” Nonlocal Fractional Turbu-lence, Springer Nature, Switzerland, Vol. 86, pp. 835–868.
[362] Germano, M., Piomelli, U., Moin, P., and Cabot, W. H., 1991, “A DynamicSubgrid-Scale Eddy Viscosity Model,” Phys. Fluids, 3(7), pp. 835–868.
[363] Samiee, M., Akhavan-Safaei, A., and Zayernouri, M., 2020, “A FractionalSubgrid Scale Model for Turbulent Flows: Theoretical Formulation and a-Priori Study,” Phys. Fluids, 32(5), pp. 055102–868.
[364] Mehta, P. P., Pang, G., Fangying, S., and Karniadakis, G. E., 2019,“Discovering a Universal Variable-Order Fractional Model for Turbulent Cou-ette Flow Using Physics-Informed Nueral Network,” Fractional CalculusAppl. Anal., 22(6), pp. 1675–1688.
[365] Mao, Z., Li, Z., and Karniadakis, G. E., 2019, “Nonlocal Flocking Dynamics:Learning the Fractional Order of Pdes From Particle Simulations,” Commun.Appl. Math. Computation, 1(4), pp. 597–619.
[366] Leoni, D., Patricio, C., Zaki, T. A., Karniadakis, G. E., and Meneveau, C.,2020, “Two-Point Stress-Strain Rate Correlation Structure and Non-LocalEddy Viscosity in Turbulent Flows,” J. Fluid Mech., 1, epub.
[367] Chen, W., 2006, “A Speculative Study of 2/3-Order Fractional LaplacianModeling of Turbulence: Some Thoughts and Conjectures,” Chaos, 16(2), pp.023126–868.
[368] Song, F., and Karniadakis, G., 2018, “A Universal Fractional Model of Wall-Turbulence,” Phys. Fluids, 16(2), pp. 835–868.
[369] Liang, B., and Mahadevan, S., 2011, “Error and Uncertainty Quantificationand Sensitivity Analysis in Mechanics,” Int. J. Uncertainty Quantif., 1(2), pp.147–161.
[370] Sudret, B., 2008, “Global Sensitivity Analysis Using Polynomial ChaosExpansions,” Reliab. Eng. Syst. Saf., 93(2), pp. 964–979.
[371] Hoffman, F., and Hammonds, J., 1994, “Propagation of Uncertainty in RiskAssessments: The Need to Distinguish Between Uncertainty Due to Lack ofKnowledge and Uncertainty Due to Variability,” Risk Anal., 14(5), pp.707–712.
[372] Jakeman, J., Eldred, M., and Xiu, D., 2010, “Numerical Approach forQuantification of Epistemic Uncertainty,” J. Comput. Phys., 229(12), pp.4648–4663.
[373] Enderle, B., Rauch, B., Grimm, F., Eckel, G., and Aigner, M., 2020, “Non-Intrusive Uncertainty Quantification in the Simulation of Turbulent SprayCombustion Using Polynomial Chaos Expansion: A Case Study,” Combust.Flame, 213, pp. 26–38.
[374] Le Maıtre, O., and Knio, O. M., 2010, “Spectral Methods for UncertaintyQuantification: With Applications to Computational Fluid Dynamics,”Springer Ser. Sci. Comput., 14(2), pp. 707–712.
[375] Fishman, G. S., 1996, “Monte Carlo: Concepts, Algorithms, andApplications,” Springer-Verlag, New York.
[376] Bravo, L., Murugan, M., Ghoshal, A., Simon, S., Koneru, R., Jain, N., Khare,P., and Flatau, A., 2021, “Uncertainty Quantification in Large Eddy Simula-tion of CMAS Attack and Deposition in Gas Turbine Engines,” AIAA PaperNo. 2021–0766.
[377] Turnquist, B., and Owkes, M., 2019, “Multiuq: An Intrusive UncertaintyQuantification Tool for Gas-Liquid Multiphase Flows,” J. Comput. Phys.,399(15), p. 108951.
[378] Roy, C., and Oberkampf, W., 2011, “A Comprehensive Framework for Verifi-cation, Validation, and Uncertainty Quantification in Scientific Computing,”Comput. Methods Appl. Mech. Eng., 200(25–28), pp. 2131–2144.
[379] Mishra, A. A., and Iaccarino, G., 2019, “Theoretical Analysis of Tensor Per-turbations for Uncertainty Quantification of Reynolds Averaged and SubgridScale Closures,” Phys. Fluids, 31(7), p. 075101.
[380] Nieto, A., Agrawal, R., Bravo, L., Hofmeister-Mock, C., Pepi, M., and Gho-shal, A., 2019, “Calcia-Magnesia-Alumina-Silicate (CMAS) Attack Mecha-nisms and Roadmap Towards Sandphobic Thermal and Environmental BarrierCoatings,” Int. Mater. Rev., 399(15), pp. 1–42.
Applied Mechanics Reviews JULY 2021, Vol. 73 / 040801-29
Dow
nloaded from http://asm
edigitalcollection.asme.org/appliedm
echanicsreviews/article-pdf/73/4/040801/6733986/am
r_073_04_040801.pdf by University of C
incinnati user on 30 July 2021