a creel census at chautauqua lake, new york
TRANSCRIPT

This article was downloaded by [Harvard Library]On 07 October 2014 At 1759Publisher Taylor amp FrancisInforma Ltd Registered in England and Wales Registered Number1072954 Registered office Mortimer House 37-41 Mortimer StreetLondon W1T 3JH UK
Transactions of the AmericanFisheries SocietyPublication details including instructions forauthors and subscription informationhttpwwwtandfonlinecomloiutaf20
A Creel Census at ChautauquaLake New YorkEmmeline Moore aa Biological Survey New York State ConservationDepartment Albany N Y USAPublished online 09 Jan 2011
To cite this article Emmeline Moore (1938) A Creel Census at Chautauqua LakeNew York Transactions of the American Fisheries Society 671 130-138 DOI1015771548-8659(1937)67[130ACCACL]20CO2
To link to this article httpdxdoiorg1015771548-8659(1937)67[130ACCACL]20CO2
PLEASE SCROLL DOWN FOR ARTICLE
Taylor amp Francis makes every effort to ensure the accuracy of allthe information (the ldquoContentrdquo) contained in the publications on ourplatform However Taylor amp Francis our agents and our licensorsmake no representations or warranties whatsoever as to the accuracycompleteness or suitability for any purpose of the Content Any opinionsand views expressed in this publication are the opinions and views ofthe authors and are not the views of or endorsed by Taylor amp FrancisThe accuracy of the Content should not be relied upon and should beindependently verified with primary sources of information Taylor andFrancis shall not be liable for any losses actions claims proceedingsdemands costs expenses damages and other liabilities whatsoeveror howsoever caused arising directly or indirectly in connection with inrelation to or arising out of the use of the Content
This article may be used for research teaching and private studypurposes Any substantial or systematic reproduction redistributionreselling loan sub-licensing systematic supply or distribution in anyform to anyone is expressly forbidden Terms amp Conditions of accessand use can be found at httpwwwtandfonlinecompageterms-and-conditions
Dow
nloa
ded
by [
Har
vard
Lib
rary
] at
17
59 0
7 O
ctob
er 2
014
A OldEEL CENSUS AT CHAUTAUQUA LAKE NEW YORK
EHHELINE lbull00RE AND STAFF ibullEIbullBERS
Biological Survey New York State Conservation Department Albany NY
-ABSTRACT
An important part of the biological survey of the Allegheny watershed in New York State during 1937 consisted of a study of angling conditions in Chautauqua Lake a highly productive comparatively shallow body of water of 13376 acres This lake is noted for its black bass and muskalonge fish- ing The main objective of the study was to lay a foundation for later more intensive investigations leading to a sound management program Owing to the popularity of the lake among fishermen on opening days and to the fbullct that July 4th fell on the first week-end a high concentration of anglers afforded a good opportunity for obtaining a large amount of the necessary data
During the first five days of the season (July i to 5) sixteen members of the Surveys scientific staff were stationed at strategic points around the lake such as the boat liveries and obtained data as to the kind number length and weight of the fish caught the number of hours of fishing and the type of gear and bait used by each fisherman contacted Scale samples for age determinations were obtained from 221 smallmouth bass 206 large- mouth bass and 73 muskalonge
The analysis of the creel census data for the five-day period showed that a total of 3732 legal fish were taken in 1488 fisherman-days or 6788 fisherman-hours an average of 055 fish per fisherman-hour Of the total number of fisherman-days reported 459 per cent showed no catch of legal fish The total catch enumerated consisted of 284 smallmouth bass (76 per cent) 212 largemouth bass (57 per cent) 80 muska]onge (21 per cent) 159 bullheads (43 per cent) and 2997 pan fishes (803 per cent) chiefly perch rock bass and sunfishes
INTRODUCTION
Fisheries administrators are beginning to recognize that an accu- rate knowledge of the size of the annual harvest is an essential factor in the management of wildlife resources In regions where the demand for sport fishing exceeds the supply the fishery man- ager is being called upon to farm the public waters to their fullest extent Stated in another way the managers aim should be to get the greatest yield annually that is compatible with the main- tenance of stocks at a steady level It would be considered highly unbusinesslike to run a commercial enterprise without keeping a record of the income expenditure and stock on hand Such a policy may work after a fashion as long as the returns are con- sidered to be satisfactory but in many of the fisheries it is becom- ing increasingly apparent that the returns are getting perceptibly less from year to year The recognition of this fact dictates a more businesslike approach to the problem of farming the waters Meas- uring from year to year the harvest or anglers take of fish will undoubtedly furnish a good deal of the data that are necessary to
130
Dow
nloa
ded
by [
Har
vard
Lib
rary
] at
17
59 0
7 O
ctob
er 2
014
A Creel Census at Chautauqua Lake New York 131
convert fisheries administration from a haphazard system based on inadequate knowledge to a businesslike enterprise
Fisheries biologists are doing some necessary spade-work in this field as shown by the number of technical papers that have ap- peared in recent years Judging from these contributions the creel-census method of estimating the harvest is apparently a useful agency in the hands of scientific investigators working on small lakes and streams but the practical application of the method is still in the pioneering stages
The New York State Biological Survey has been investigating the fact-finding possibilities of the creel-census method in the course of its recent survey studies An important part of the survey of the Allegheny watershed in 1937 consisted of an appraisal of the Chautauqua Lake sport fishery An opportunity was afforded to try out the census technique in the hands of trained biologists working on a large lake and at the same time to obtain informa- tion on the fishing effort the fishing drain and the relative abundance of the various species of sport fish Although the data obtained were limited and of a preliminary nature it seems de- sirable to publish them as a step toward a practical creel-census procedure
The field blank used in the Chautauqua Lake work is similar to the type used in the Michigan creel census (Eschmeyer 1936)
Chautauqua Lake is the largest and most important lake in the Allegheny watershed It has an area of about 13400 acres with a shoreline of approximately 42 miles It is a natural body of water with an annual vertical fluctuation of less than 4 feet The lake is divided into two nearly equal parts by a narrows The two areas differ considerably in depth the north end has a hum- per of pot-holes from 60 to 77 feet deep whereas the south end nowhere reaches a depth of 20 feet In the northern part of the lake there is an area of about 4000 acres where the water is over 35 feet deep and during much of the summer there is a lack of dissolved oxygen below a depth of about 40 feet The flora and fauna are abundant The lake has long been noted for its fish production
The number of boats available at the boat liveries around the lake was conservatively estimated at 300 ntilde 50 boats and there is probably an equal number of boats available for fishing owned by cottagers This gives a fairly high potential fishing popala- tion of one boat to 20 acres or about 14 boats per mile of shore- line exclusive of the fishing carried on from the shore ibullself The boat population is an important consideration in studying the fishing intensity on lakes but it has previously received little abull- tention from investigators
Owing to the fact that the census takers had to be drawn from their regular duties to undertake the workbull it was impossible to
Dow
nloa
ded
by [
Har
vard
Lib
rary
] at
17
59 0
7 O
ctob
er 2
014
132 American Fisheries Society
carry on the census for more than a few days In order to obtain as many data as possible in the limited time available the first five days of the bass and muskalonge season (July I to 5 inclusive) were selected because it was believed that these days would afford a high concentration of anglers at a convenient time Accordingly sixteen members of the survey staff bull were stationed at strategic points around the lake particularly the main boat liveries where they contacted the fishermen It is estimated that the workers sampled over half of the fishermen on the 1ake during this period
It should be pointed out also that the census provided an un- usually good opportunity for obtaining biological data on the game fish Scale samples length measurements and weights were ob- tained during the census from 73 muskalonge 221 smallmouth bass and 206 largemouth bass It would have been almost impos- sible to have obtained an adequate series of samples of the muska- longe in any other way As a rule the anglers are glad to assist in furnishing these data if a little explanation of the purpose of the material is given at the time The explanation that the scale samples are used for determining the age of the fish seldom fails to arouse the interest of the fishermen in the scientific work of the Department and the census therefore has an educational value that could have been achieved in no other way
ANALYSIS OF THE CENSUS IbullEPORTS
Analysis of the Fishing Effort A total of 1012 reports was turned in by the 16 persons taking the census records This repre- sents a return of 126 reports per census-taker per day which is evidently a very low number of returns in proportion to the cost of obtaining this information The cost per return could be cut down to a great extent however by sampling only the more popular boat liveries if this method proves to give samples representative of aver- age fishing effort Costs could be reduced further by utilizing volun- tary cooperators such as local sportsmen and boat livery proprie- tors It is essential however to provide sufficient skilled super- vision to insure training of each field worker in uniform methods of reporting returns
The reports returned represented a total of 1488 fisherman-days or 6788 fisherman-hours Some of the reports were made on a boat basis others were made out for each fisherman Where reports were made per boat and the number of fishermen was not reported an average of 18 persons per boat which was obtained from the more complete reports was used to compute the total fisherman-days and the total fisherman-hours
xThe following Survey members assisted in collecting and organizing the data for this paper R M Bailbullr S M Brown G E Burdick W R Duden Dr C W Greene Mrs O W Greene Dr W J Koster S J Makoaky Dr C Mcbull Mottley Dr J 1bull Mueller R W Odell Dr T T Odell Miss M E Pasco Dr R C Tasker Dr H K Townes Dr W L Tresslet and E H Wheeler
Dow
nloa
ded
by [
Har
vard
Lib
rary
] at
17
59 0
7 O
ctob
er 2
014
A Creel Census at Chautauqua Lake New York 133
Number Total bullumber of reports
number of Per- Number of of non- szlig rosidoaoO not reports centage residents residents reported
Males over 16 907 896 793 108 6 Males under 16 30 29 27 3
8 Males age not reported 8 08 Females over 16 29 29 27 2 Females under 16 11 11 8 2 1 Females age not reported 2 02 2 Sex not reported 25 25 25
Total 101bull 1000 855 115 42 Percentage 1000 - 845 114 41
Table 1 shows the age sex and residence of the anglers Resi- dents are considered as all persons eligible to fish with a New York State resldents license Chautauqua Lake being located near the western part of the State draws rather heavily from Pennsylvania and Ohio If the instances in which the residence is not reported are distributed proportionately among the residents and non-resi- dents results indicate that approximately 88 per cent of the anglers are residents of New York State Elkins (1937) found that 88 per cent of the anglers fishing in the Chequamegon Forest in Wiscon- sin were residents of Wisconsin Eschmeyer (1937) on the other hand found that only 65 per cent of the anglers fishing at Fife Lake Michigan were residents of Michigan
Table 2 shows the type of fishing and Table 3 the type of bait used by the fishermen
Still-fishing 482 Trolling 312 Casting 248 Shore or wading 25 Other 11 lbullot reported 103
Total 1012
476 308 245
25 11
102
1000
XIncludes reports indicating two or more types of fishing the total represents indi- vidual reports
A high percentage of the fisherman-days 1214 days or 816 per cent represented completed days of fishing at the time each report was made out These fishermen spent a total of 5782 hours or an average of 48 hours per day per fisherman The number of hours per day spent in fishing reported by other investigators is as fol- lows Needham (1937) California trout-lake 43 hours Elkins (op cit) 4 hours Eschmeyer (op cit) 25 hours The higher aver-
Dow
nloa
ded
by [
Har
vard
Lib
rary
] at
17
59 0
7 O
ctob
er 2
014
134 American Fgsheries Society
age reported for Chautauqua Lake may be partly due to the fact that the census was taken at a time when the days were longer the data for other lakes are based on information for the summer It is possible that daylight-saving time which is used on Chautauqua Lake may also affect the data since it allows more time for fishing in the evening
TABT-B 3 TYPB 01 bull BAXT XSbullD
Nw3xber or Tbulle or bait usebull reportsbull percentage
Plug 377 Worms 306 Crayfish 260 Spinner 177 Minnows 154 Fly 10 Other 4 Not reported 58
Total 1012
373 302 257 175 152
10 04 57
1000
XIncludes reports indicating the use of two or more types of bait the total represents individual reports
The characteristics of the fishing effort on Chautauqua Lake dur- ing the period under investigation may be stated as follows the fishing was carried on chiefly from boats by still-fishing and trolling and casting with artificial lures (plugs and spinners) and live baits (worms and crayfish) each boat contained on the average 18 fish- ermen and each fisherman spent on the average 48 hours in fishing
Analysis of the Catch Table 4 shows the number of legal fish
TABT-B 4 CampTC bull OX TBOAT- FXS bullr
Catch in northern Catch in southern Total oatohbull end of lake end of lake
Species of fish Number Per cent Number Per cent Number buller cent
Smallmouth bass 284 76 193 151 51 23 Largemouth bass 212 57 71 56 126 57 Muskalonge 80 21 49 38 26 12 Bullheads 159 43 62 48 84 38 Common sunfish 1528 409 342 268 1157 523 Yellow perch 648 174 195 153 397 179
Rock bass 539 144 315 247 193 87 Bluegill sunfish 198 53 36 28 152 69 Common or bluegill or
hybrid sunfish 49 13 2 01 6 02 Calico bass 30 08 13 10 16 07 Log perch 4 01 4 02 Carp 1 01 1 01
Total 3732 1000 1278 1000 2213 1000 Pan fish 2 2997 803 903 707 1926 870
bullhe total catch includes 241 fishes which were not segregated into north or south localities
bullPan fish here includes log perch and carp but not bullheads
Dow
nloa
ded
by [
Har
vard
Lib
rary
] at
17
59 0
7 O
ctob
er 2
014
Creel Census at Chautauqua Lake New York 135
taken during the five-day period and gives comparative figures for the north and south ends of the lake In this segregation it is of interest to note the ecological preferences shown by the various species The preponderance of largemouth black bass bullheads common sunfish bluegills and yellow perch in the shallow weedy mud-bottomed south end is statistically significant The north end characterized by deeper water fewer weeds and a greater percentage of hard bottom is evidently more favorable for smallmouth black bass and rock bass The total number of muskalonge taken was highest at the north end which is more suitable for trolling Suc- cess of fishing per unit of effort was slightly better in the south end however as the take of muskalonge per trolling-hour was only 0046 for the north end as against 0087 for the south end
In addition to the 3732 legal fish recorded in Table 4 the following fish were reported as being returned to the water 5 muskalonge (22 to 241bull inches) 111 smallmouth bass (6 to 11 inches) 38 largemouth bass (81bull to 10 inches) 18 bass species not indicated 6 bullheads 15 sunfish including bluegills 64 yellow perch and 17 rock bass It is believed that the identification of fish returned to the water was not always reliable and that such fish were not reported in many instances These figures are not given in the table Such data however are of great importance in evaluating the biological status of the various fish populations and the results point to the necessity of drilling the census-takers in obtaining this information
Eighty per cent of the total number of legal fish recorded were pan fish with the smallest of these common sunfish and yellow perch most abundant It should be mentioned here that the percentage given for calico bass is undoubtedly too low to be representative for the whole year since highly successful fishing for this species is experienced regularly during early May If the large Chautauqua Lake bullhead is included with the pan fishes as the species would ordinarily be treated in other waters this would bring the percent- age of pan fish up to 846 Of the three large game fishes caught
RELATIVE PROPORTION 0F GAMR FISK AND PAN FISK Ilq Tbullbull 0ATOK AT 0KAbullTAbullQbullA LA srn AS 00MbullABbullBD
Bpeciee of
Percentage Ohautauqua Lake lbulllfe bull-ake lbulllfo bull-ako
1937 1934 1935
Smallmouth bass 77 Largemouth bass 57 Pikes x 22 Pan fish bull 844
93 69 28 41 16 18
863 $72
XIncludes muskalonge from Chautauqua Lake northern pike and wall-eyed pike from Fife Lake
SIncludes sunfish bluegills rock bass perch and bullheads
Dow
nloa
ded
by [
Har
vard
Lib
rary
] at
17
59 0
7 O
ctob
er 2
014
136 Areethan Fisheries Society
the smallmouth slightly outnumbers the largemouth bass whereas the muskalonge contributes only 21 per cent of the total number of fish caught These figures are closely comparable with percentages for the same classification of the catch from Fife Lake as reported by Eschmeyer (1936 and 1937) The comparison of the percentages is shown in Table 5
An important calculation from the management point of view is the yield of fish per unit of fishing effort The catch per fisher- man-hour and the average number of fish per angler per day are shown in Table 6 Of the number of fisherman-days reported 459 per cent had no catch of legal fish The average number of fish per fisherman-hour for Chautauqua Lake was 055 This value may be compared with that obtained for other sport fisheries as follows Elkins (1937) records the average number of fish per fisherman- hour from four Wisconsin lakes as 081 Eschmeyer (1936 and 1937) gives the catch per fisherman-hour for Fife Lake as 172 fish in the summer of 1934 and 127 fish in the summer of 1935 Need- ham (1937) reports the catch for a California trout-lake as 021 trout per fisherman-hour Mottley (19bull38) reports the catch in a five- year average for a British Columbia trout-lake as 077 fish per fish- erman-hour
Average fish Average fish per Species of fish per hour angler per da7
Smallmouth bass 0040 Largemouth bass 0030 Muskalonge 0012 Bullheads 0023 Pan fish 0440
Total fish 0550
019 014 005 011 201
250
The value given for Chautauqua Lake is apparently rather low when compared with other sport fisheries It may be low as a result of factors other than a scarcity of fish at the time of the census Possible explanations of the low yields are (1) an unusual number of inexpert fishermen during the holiday period (2) concentration of fishing for muskalonge which would normally produce lower re- turns owing to the low incidence per hour for this species and (3) unfavorable weather on the first two days of the period The catch per hour for the five days was as follows July 1 027 July 2 040 July 3 075 July 4 063 July 5 060
With regard to the catch of muskalonge per fisherman-hour given in Table 6 this value represents the number of muskalonge divided
Dow
nloa
ded
by [
Har
vard
Lib
rary
] at
17
59 0
7 O
ctob
er 2
014
A Creel Census at Chautauqua Lake New York 137
by the total number of fisherman-hours Hence fishing effort con- fined to other species makes this figure much lower than it would have been if computed only from effort employing muskalonge tackle At the time of taking the census muskalonge was the prin- cipal fish caught by trolling and this was also the only important method of fishing for it later in the year however the fishermen use live bait Therefore a better index of the catch of muskalonge for this period would be the number of fish per trolling hour (Table 7) The catch of muskalonge per trolling hour was 0054 fish This is more clearly expressed as approximately 18 hours of trolling to catch one muskalonge Similar values could be worked out for the other species if it were known what species of fish each fisherman was trying to catch Where mixed populations of fish are present it would probably be much better to adopt a unit of effort based on the type of fishing employed or the species being sought The desig- nation of the catch per unit effort would then be stated in terms of trolling casting or still-fishing hours
Tdampbull r-m 7 DAbullA ON bullNbull DAyIbull AbullD NOX71bullIbull 0X bull TXOr-r xNG 4ND 0X bull MCTIbulllrAX0NGbull Xbull01bull bullNbull IbullXTbull DAyIbull 0X bull bullNbull OmNbullXYbull
Number of Number of Number of Number of fisherman-days trolling muskalonge muskalonge per
Date trolling hours caught trolling hour
July 1 64 July 2 25 July 3 59 July 4 77 July 5 67
Total bull92
317 13 0041 77 10 0130
264 18 0068 322 22 0068 331 8 0024
1311 71 0054
Whether there is a proper balance between the various popula- tions oœ fish in the lake cannot be settled by the census alone In a lake of this size and depth there may be a high proportion of pan fish species because pan fish other than the calico bass have a smaller average size than is usually found whereas the bass and muskalonge appear to be exceptionally large The muskalonge that were opened possessed unusual amounts of fat and 4-pound bass were relatively common These points need further checking by studies oœ the scale series and repeated census work over a period of years The average size of 221 smallmouth bass was 1261 inches 0œ 206 largemouth bass 1287 inches and of 71 muskalonge 323 inches The data for the bass compare favorably with those for Fife Lake reported by Eschmeyer (1937) Further data will be needed before it can be determined whether the game fish populations in Chautau- qua Lake are showing signs of depletion
Dow
nloa
ded
by [
Har
vard
Lib
rary
] at
17
59 0
7 O
ctob
er 2
014
138 American Fisheries Society
LITERATURE CITED
Elkins Winston A 1937 A fish yield[ stubull[y for certain lakes in the Chequamegon National
Forest Trans Am Fish Soe frac34ol 6otilde pp 30otilde-312
Esehmeyer R W 193otilde Analysis of the game fish catch in a Michigan Lake Trans Am
Fish Soe frac34ol 65 pp 207-223 1937 A seeonbull[ season of ereel census on Fife Lake Trans Am Fish
Soe Vol 66bull pp 324-334
Mottley C McC 1938 Does the full moon affect rainbow trout fishing Trans Am Fish
Sot VoL 67
Neebull[ham P R 1937 Methobull[s of measuring anglers catches in inland waters Copeta
No 1 IbullP 41-48
Dow
nloa
ded
by [
Har
vard
Lib
rary
] at
17
59 0
7 O
ctob
er 2
014
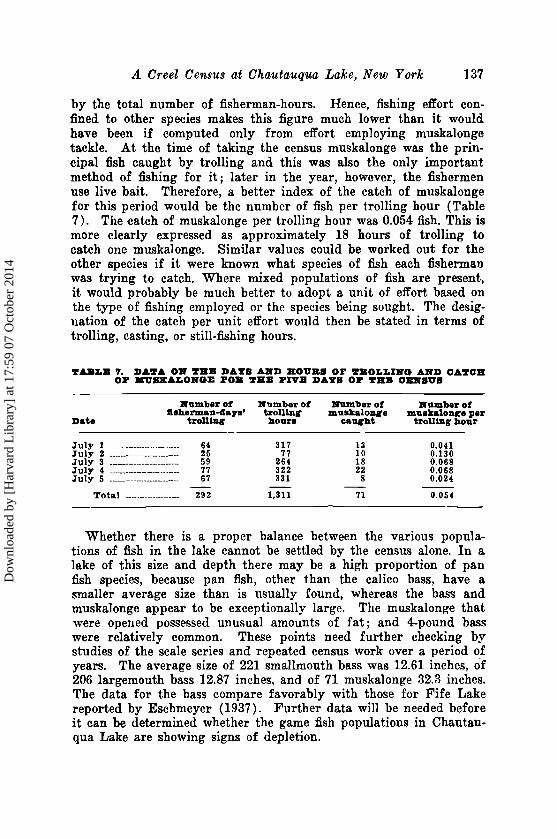