a crab swarm at an ecological hotspot: patchiness and...
TRANSCRIPT

Submitted 30 November 2015Accepted 16 February 2016Published 12 April 2016
Corresponding authorJesús Pineda, [email protected],[email protected]
Academic editorAlex Ford
Additional Information andDeclarations can be found onpage 17
DOI 10.7717/peerj.1770
Copyright2016 Pineda et al.
Distributed underCreative Commons CC-BY 4.0
OPEN ACCESS
A crab swarm at an ecological hotspot:patchiness and population density fromAUV observations at a coastal, tropicalseamountJesús Pineda1, Walter Cho2, Victoria Starczak1, Annette F. Govindarajan1,Héctor M. Guzman3, Yogesh Girdhar4, Rusty C. Holleman4,5, James Churchill6,Hanumant Singh4 and David K. Ralston4
1Biology Department, Woods Hole Oceanographic Institution, Woods Hole, MA, United States of America2Biology Department, Point Loma Nazarene University, San Diego, CA, United States of America3 Smithsonian Tropical Research Institute, Balboa Ancon, Panama4Applied Ocean Physics and Engineering Department, Woods Hole Oceanographic Institution, Woods Hole,MA, United States of America
5 San Francisco Estuary Institute, Richmond, CA, United States of America6Physical Oceanography Department, Woods Hole Oceanographic Institution, Woods Hole, MA, United Statesof America
ABSTRACTA research cruise to Hannibal Bank, a seamount and an ecological hotspot in thecoastal eastern tropical Pacific Ocean off Panama, explored the zonation, biodiversity,and the ecological processes that contribute to the seamount’s elevated biomass. Herewe describe the spatial structure of a benthic anomuran red crab population, usingsubmarine video and autonomous underwater vehicle (AUV) photographs. Highdensity aggregations and a swarm of red crabs were associated with a dense turbidlayer 4–10 m above the bottom. The high density aggregations were constrainedto 355–385 m water depth over the Northwest flank of the seamount, although thecrabs also occurred at lower densities in shallower waters (∼280 m) and in anotherlocation of the seamount. The crab aggregations occurred in hypoxic water, withoxygen levels of 0.04 ml/l. Barcoding of Hannibal red crabs, and pelagic red crabssampled in a mass stranding event in 2015 at a beach in San Diego, California, USA,revealed that the Panamanian and the Californian crabs are likely the same species,Pleuroncodes planipes, and these findings represent an extension of the southernendrange of this species. Measurements along a 1.6 km transect revealed three highdensity aggregations, with the highest density up to 78 crabs/m2, and that the crabswere patchily distributed. Crab density peaked in the middle of the patch, a densitystructure similar to that of swarming insects.
Subjects Ecology, Marine BiologyKeywords Swarms, Ecological hotspot, Patchiness, Panama, Eastern Pacific, Seamount,Pleuroncodes planipes, Hypoxic environment, Anomuran crabs
INTRODUCTIONSeamounts are distinct oceanic habitats found in all oceans (Wessel, Sandwell & Kim,2010), yet key first-order ecological processes are not well understood (Clark et al., 2010).
How to cite this article Pineda et al. (2016), A crab swarm at an ecological hotspot: patchiness and population density from AUV obser-vations at a coastal, tropical seamount. PeerJ 4:e1770; DOI 10.7717/peerj.1770

Communities of benthic species on seamounts are regionally isolated, with elevated,shallow rocky habitat patches surrounded by deep sedimentary plains. These twoenvironmental axes, type of substrate (hard vs. soft), and depth (gradients in food, light,and oxygen), create horizontal and vertical patterns in faunal zonation (Pitcher et al.,2008; Thresher et al., 2014). These patterns are likely determined regionally by circulationand larval dispersal, and vertically by physical factors and biological interactions. Inthe pelagic environment, the trapping and concentration of pelagic planktonic biomassaround seamounts, due to hydrodynamic and behavioral processes, result in local increaseof predators—such as fish and marine mammals (Klimley, Richert & Jorgensen, 2005;Morato et al., 2008;Morato et al., 2010). Thus, seamounts are ecological hotspots in thesense that many biological and physical processes combine to produce high benthicand pelagic biomass, and higher biodiversity. Seamounts are productive—their shallowsummits have been fished for centuries and the biomass of zooplankton is unusually high,but debate remains over the mechanism of pelagic biomass enrichment. A commonlycited hypothesis is that zooplankton and fish productivity result from phytoplanktongrowth due to topographic induced upwelling of nutrients to euphotic waters, but theimportance of this mechanism has been recently challenged (Genin & Dower, 2007).Seamounts harbor valuable yet slow-growing resources, such as reef-building corals(e.g., scleractinians), black corals (e.g., antipatharians), soft-corals (e.g., gorgonians), andfish, some of which can live over 100 years (e.g., orange roughy) (Koslow, 1997). Thesehabitats, however, have been undersampled and understudied, with less than 1% of allseamounts explored (Clark et al., 2010). The occurrence of seamounts in open oceansbeyond national jurisdiction, and advances in deep-sea fishing practices have resulted insevere anthropogenic pressure on seamount populations which, due to their life historycharacteristics, are among the least resilient populations in the marine environment(Koslow, 1997; Schlacher et al., 2010).
Pleuroncodes planipes Stimpson, 1860 (superfamily Galatheoidea, family Muninidae,Ahyong et al., 2010) adult crabs, also known as red crabs, tuna crabs, squat lobsters, and‘‘langostilla’’, occur in pelagic waters and in deep continental shelf and continental slopebenthic habitats. Larvae and small individuals (∼<2.6 cm standard carapace length)tend to dominate the pelagic fraction off western Baja California, with larger organismsoccurring exclusively in the benthos (Boyd, 1967).
Large individuals reproduce, but observations of pelagic ovigerous females and theirlarvae in waters over bathyal and abyssal depths (∼2,000–3,500 m) suggests that a fractionof the pelagic population can reproduce as well (Longhurst & Seibert, 1971). Pleuroncodesplanipes can be extremely abundant, with accounts of dense pelagic patches up to 7–10 km(Gómez-Gutiérrez et al., 2000). See also the casual account of a 16 km patch by B. Shimada,quoted in Boyd (1967). Off Baja California P. planipes is the main prey of large pelagicpredators such as yellowfin tuna and skipjack tuna (Alverson, 1963). P. planipes is welladapted to its pelagic lifestyle, where it can feed both on phytoplankton, by specializedfiltration, and on small zooplankton (Longhurst, Lorenzen & Thomas, 1967). On benthichabitats, galatheoid crabs are deposit feeders and scavangers (Nicol, 1932; Lovrich & Thiel,2011). Benthic P. planipes ingest particulate organic matter (detritus associated with
Pineda et al. (2016), PeerJ, DOI 10.7717/peerj.1770 2/23

sediments), phytoplankton cells, and small crustaceans, foraminiferans and radiolarians(Aurioles-Gamboa & Pérez-Flores, 1997). When feeding on bottom sediments containingdiatoms, detritus and small organisms, galatheoid crabs’ ‘‘third maxillipeds . . . act asbrooms’’ (Nicol, 1932), which would disturb and resuspend fine sediment.
Most studies on Pleuroncodes planipes have been done in pelagic waters, and haveprovided little information on the benthic habitat. Boyd (1967) found that benthic P.planipes ranged from ∼100 to 300 m water depth off western Baja California, with smallerindividuals found in shallower bottoms, and population densities up to 11/m2. Thesedistributions correlated with oxygen minima waters, with oxygen levels below 0.5 ml/l.Boyd (1967) and Robinson & Gómez-Gutiérrez (1998) found that some benthic individualstend to migrate from the bottom to the upper water column. The typical northerngeographic range end of P. planipes is somewhere in Baja California. Intermittently,particularly during the El Niño phase of the El Niño Southern Oscillation (ENSO), itsgeographic range expands northward to California (Longhurst, 1966; Smith, 1985). Thesouthernmost geographic end range of P. planipes appears to be somewhere in Costa Rica(Wicksten, 2012), where it is thought to overlap with the northern range of Pleuroncodesmonodon (Macpherson et al., 2010; Wehrtmann et al., 2010; Wicksten, 2012). The center ofabundance of pelagic P. planipes is in western Baja California (Longhurst, 1968; Brinton,1979; Gómez-Gutiérrez et al., 2000). The distribution and abundance of benthic P. planipesis not well documented, particularly south of Baja California.
We present findings from a research cruise to Hannibal Bank, a coastal seamount inthe Gulf of Chiriquí, Eastern Tropical Pacific coastal ocean off Panama (Fig. 1). Thiscruise explored the mechanisms that contribute to high densities of benthic and pelagicorganisms in an ecological hotspot and examined the seamount biodiversity and thebenthic community zonation along the depth gradient. Work included (a) submarine divesto collect, film and observe firsthand the benthic habitats, and onboard DNA extractionsof collected benthic invertebrates, (b) autonomous underwater vehicle (AUV) transects tomap population densities of abundant benthic fauna, and (c) hydrographic and velocitymeasurements over the seamount using a conductivity, temperature, depth (CTD) andoxygen profiler and a hull-mounted acoustic Doppler current profiler. Hannibal seamountand its shallow top, Hannibal Bank, are within the recently created Coiba National Park,a UNESCO World Heritage Site, off the Pacific coast of Panama. Hannibal Bank harborsabundant large fish sustaining artisanal fisheries, and is a destination for internationalsport fishermen. The flat-topped triangular-shaped seamount rises from 450 m to ∼40 moccupying an area of 83 km2 (Fig. 2). Proximate to the continental shelf edge, it is∼20 km west of Coiba Island, 60 km from the main coast, and centered at about 07◦24′N,82◦3′W(Cunningham, Guzman & Bates, 2013). Hannibal seamount communities are likelyinfluenced by several physical processes, including synoptic upwelling from December tolate April (D’Croz & O’Dea, 2007), low aragonite saturation state (Manzello et al., 2008),low oxygen sub-thermocline waters, low salinity from runoff and precipitation (∼3 myearly precipitation), sharp thermal stratification, large internal tides, and a 4 m tidal range(Dana, 1975; Pineda, Reyns & Starczak, 2009; Starczak et al., 2011).
Pineda et al. (2016), PeerJ, DOI 10.7717/peerj.1770 3/23

Figure 1 Map of the study area. The box in (B) encloses the left panel, and the small box in (A) encloses Hannibal Seamount. Bathymetry datafrom GEBCO.
420
300
180
60
Depth (m)
82°7.5'W 82°6.9'W7°23.7'N
7°24.3'N
Figure 2 Hannibal Seamount, with location of the AUV transect indicated with a red line. Insert onthe left delineates AUV transect, with end of transect near the blue cross. The blue cross indicates the lo-cation of the CTD cast, and the submarine positions are in white. Depth data from Cunningham, Guzman& Bates (2013).
On the last dive of the research cruise, we observed extraordinarily high densities ofanomuran galatheoid crabs near the bottom of the seamount, and an associated turbid layerover the bottom. The encounter was unexpected and mesmerizing, and we documentedthese observations with high-definition video, a photo transect, environmental water
Pineda et al. (2016), PeerJ, DOI 10.7717/peerj.1770 4/23

column measurements and genetic analysis of crab samples. Here we report on theseobservations, and address the following questions: What is the distribution of the crabsalong a transect? What are the patterns of variability in abundance within a patch? Isthere a relationship between the turbid layer and the crab aggregations? Are the crabsobserved over the Hannibal Seamount the same species as Pleuroncodes planipes found offof California?
METHODSThe cruise onboard the M/V Alucia from 31 March to 20 April 2015 focused on HannibalSeamount. The ‘‘Ministerio del Ambiente de Panama’’ provided research and exportpermits, and the US State Department assisted in obtaining cruise permits. Work includedecological surveys over all flanks of the seamount (Fig. 2), and fifteen submarine divesconducted with Nadir, a 3-person submarine, and 11 dives with RV2, a 2-person submarinewith more robust sampling capabilities than Nadir. On most missions, the submarinessurveyed starting from the bottom of the seamount and continued to the top, workingin tandem, within ∼150 m of each other. Twelve transects with the Seabed autonomousunderwater vehicle (AUV) complemented the diving missions and surveyed similar areas,collecting benthic imagery. On a typical cruise day, submarines were deployed during themorning and the Seabed AUV in the evening. Here we focus on observations completedon 18 and 19 April 2015, when crab aggregations were detected and studied. Furthersubmarine and AUV observations on crabs were not possible due to technical issues andthe cruise schedule. A conductivity, temperature, oxygen and depth profile was taken fromthe M/V Alucia using a Seabird SBE19 plus CTD in the vicinity of the submarine dive andSeabed AUV transect on 18 April 2015 (Fig. 2, blue cross in inset).
AUV observations and density estimationSeabed AUV conducted transects on the seamount, and obtained images to estimatedensities of bottom organisms. Designed specifically for optical imaging of the seafloor(Singh et al., 2004b), the Seabed AUV has been used extensively for coral reef ecology,and other high resolution imaging applications (Singh et al., 2004a; Williams et al., 2014).It is equipped with high-dynamic range cameras (Singh et al., 2007) to provide speciesdocumentation via imagery that can be corrected for the nonlinear attenuation of light inthe water. Seabed AUV navigated at a speed of∼20–25 cm/s andmean altitude of 3.5–4.5 mabove the bottom along a predefined track, adjusting its altitude using a high frequencyacoustic Doppler profiler. Seabed took 1,024 by 1,380 pixel images of the seafloor that wasilluminated with a strobe, and recorded temperature, conductivity, depth, and altitude.The camera pixels are square and the field of view is 45◦ in the horizontal and 33◦ in thevertical. Image width, x , is determined from altitude (height above bottom), z , by notingthat, 0.5(x/z)=Tan(45/2) which gives x = 0.828z . Because the pixels are square, the imageheight, y , is proportional to the number of pixels; i.e., y = x(1024/1380), AUV specificaltitude is used for every image, and image area is calculated as x ·y .
The Seabed AUV was programmed to take photographs every∼4 s, with image overlap.We examined every third image (12 s interval), which gave a sequence with no image
Pineda et al. (2016), PeerJ, DOI 10.7717/peerj.1770 5/23

overlap. The non-analyzed images were used to resolve ambiguities in identification.Images were inspected for crabs and other organisms by eye, and all organisms werecounted in each image.
Species identification of the crabs was confirmed by DNA barcoding of individuals inour samples (described below). Images from the Seabed AUV were light-corrected andinspected for organisms and type of substrate. A catalog of organisms was created fromthe photographs, and each morphospecies received a code. Pleuroncodes planipes wereeasily distinguished in the video recording taken from the submarine dives, and in theSeabed AUV images. To estimate crab density (#/m2), the number of crabs was divided byestimated image area in each photograph.
Patchiness estimatePatchiness of Pleuroncodes planipes was estimated with Imod using the formula of Bez(2000) modified by Décima, Ohman & De Robertis (2010). This index, based on Lloyd’sindex, considers a transect that does not sample the entire range of the species:
Imod=
∑iz2i
s(∑izi)2
N
where zi is the density of the crabs in a given image, s is the size of the sampling unit usedin the survey (mean quadrat size, 8.93 m2), and N is the number of images analyzed. Forcomparison, we also report the patchiness index of an unidentified stomatopod that waseasily detected in the photographs.
Seamount sample collection and genetic barcodingThe submarines collected benthic organisms opportunistically, using a roboticmanipulatorarm, a net and a sediment scoop. We had a Ministerio del Ambiente de Panama permit# SE/A-18-15. Collected specimens were stored in a compartmentalized honeycomb quiveror in a larger ‘‘biobox’’. After the submarine dives, the sampled organisms were held inchilled seawater until they were photographed and labelled (e.g., Fig. 3B), preliminarytaxonomic identification based on morphology was made, tissue was collected, andDNA extractions were performed onboard. Here, we focus on Pleuroncodes crabs. DNAwas extracted using the DNEasy extraction kits (Qiagen) following the manufacturer’sprotocol. Upon return to the laboratory at Woods Hole, we conducted a genetic barcodinganalysis on the crabs. A portion of the mitochondrial cytochrome c oxidase subunit I(COI) gene was amplified by PCR using the universal HCO-2198 and LCO-1490 primers(Folmer et al., 1994). PCR conditions were: 95 ◦C for 3 min; 35 cycles of 95 ◦C for 30 s,48 ◦C for 30 s, and 72 ◦C for 1 min; and 72 ◦C for 5 min. PCR products were visualizedon agarose gels stained with Sybr Safe (Life Technologies). PCR products were purifiedusing Qiaquick PCR purification kits (Qiagen) and sequenced in both directions (MWGEurofins Operon). Sequences were analyzed using the Geneious v. 7.1.7 software platform(Biomatters). Because morphological and video examination suggested that the crabswere Pleuroncodes planipes, we also sequenced COI from crabs identified as P. planipes
Pineda et al. (2016), PeerJ, DOI 10.7717/peerj.1770 6/23

A B
C D
Figure 3 Photographs and video still frames of Pleuroncodes planipes and its environment. (A) Im-age taken within Nadir as it approached the bottom, from about 6 m above the bottom, where P. planipesaggregations were first found. (B) Pleuroncodes planipes collected from the aggregation, with ruler scale incm and English units. (C) Still frame from HD video of a dense patch of P. planipes on the bottom. Thewhite PVC segment is about 20.5 cm long (D) Nearbed turbidity dropped at the edges of the Pleuroncodespatch. In the video the crabs were moving on the bottom towards the right, with a few crabs found beyondthe boundary of the patch lagging behind the main aggregation. The crab marked with a yellow arrow wasseparate from the large patch and then merged into the patch by advancing in a direction perpendicular tothe direction of patch movement.
from California for comparison (collection details below). Hannibal and California crabsequences were aligned with ClustalW (Larkin et al., 2007) using default parameters.The ends of the alignment were trimmed so that the dataset was complete for all taxa.Uncorrected p and Kimura 2-parameter distances were calculated and a neighbor-joiningtree was constructed in PAUP* (Swofford, 2003).
Sample collection in a mass stranding eventFrom January to August 2015 there were several mass stranding events of Pleuroncodesplanipes crabs on Southern California beaches, documented from news reports, the Lexis-Nexis database, and informal surveys (J Pineda, pers. obs., 2015, Table S1). In June 2015,crabs were observed in a San Diego beach (S Searcy, Univ. San Diego, pers. com., 2015,and J Pineda, pers. obs., 2015), and most of the crabs on the beach were still alive. At FalsePoint, La Jolla (32◦48′28.51′′N, 117◦15′54.96′′), we collected galatheoid crabs on 2–5 June2015, and preserved them in ethanol to provide reference specimens for DNA barcodingof seamount crabs.
Pineda et al. (2016), PeerJ, DOI 10.7717/peerj.1770 7/23
RESULTSSubmarine observations and AUV missionOn the last diving mission of the cruise, 18 April 2015, the two submarines dived to thebottom by the Northwestern flank of the seamount (Fig. 2). Upon approaching the bottom,a very dense cloud of sediment was encountered; on no other submarine or AUV divehad such a dense cloud been observed (Fig. 3A). Altitude soundings from the submarineindicated that the turbid cloud extended 4–10 m over the ocean floor. As the submarineapproached the bottom, a large number of galatheoid crabs were encountered. RV2 took13 min and 40 s high-definition video of the crabs. A few still photographs and other videowere taken from within the Nadir.
The video clips and photographs show that crabs were sometimes interacting amongthemselves (e.g., facing each other pulling out a dead crab) and with other organisms,including a sand eel. In some footage, crabs were sparsely distributed, and appeared to besedentary. In other footage, benthic crabs were very dense, touching adjacent crabs, withmost crabs moving broadly in the same direction (Figs. 3C and 3D) as a swarm (Video S1).In this footage, some crabs jumped and swam a few 10s of cm and landed in another spot.A crab outside of the patch moved towards, and merged with the main patch (Fig. 3D).Sand eel, small pelagic fish, shrimp, and a few stomatopods were in close proximity to thecrab aggregation.
The population observed in the footage was composed of relatively large crabs, withno visible smaller individuals, i.e., ∼<2.3 cm carapace length. (See Fig. 3B for typicalcrabs, with ∼2.7 cm carapace length; carapace length as measured by Gómez-Gutiérrez etal., 2000). For most of the footage, the submarine hovered 2–3 m above the bottom, andthe submarine and its lights did not appear to affect the behavior of the crabs. The highturbidity immediately above the bottom extended horizontally for at least 10s of m, and theturbid cloud appeared to be associated with the crab patch. As the two submarines movedup the seamount slope and abandoned the patch, the density of crabs decreased abruptly,and the turbid cloud disappeared (Fig. 3D).
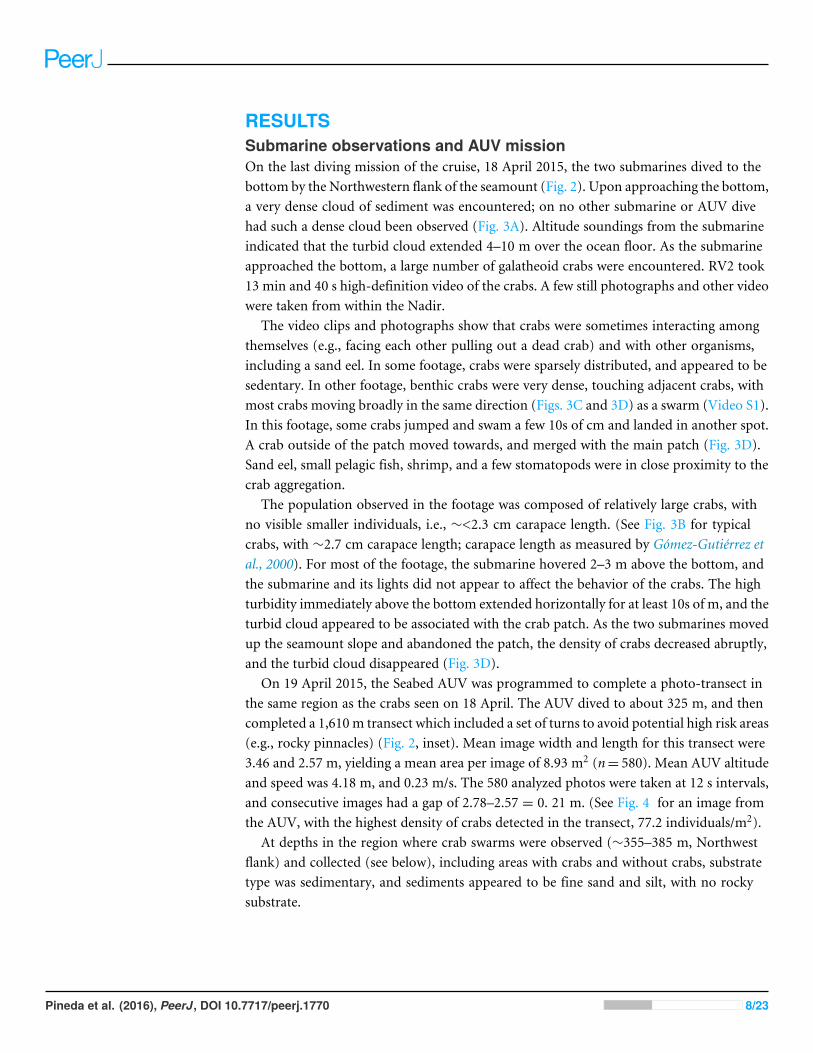
On 19 April 2015, the Seabed AUV was programmed to complete a photo-transect inthe same region as the crabs seen on 18 April. The AUV dived to about 325 m, and thencompleted a 1,610m transect which included a set of turns to avoid potential high risk areas(e.g., rocky pinnacles) (Fig. 2, inset). Mean image width and length for this transect were3.46 and 2.57 m, yielding a mean area per image of 8.93 m2 (n= 580). Mean AUV altitudeand speed was 4.18 m, and 0.23 m/s. The 580 analyzed photos were taken at 12 s intervals,and consecutive images had a gap of 2.78–2.57 = 0. 21 m. (See Fig. 4 for an image fromthe AUV, with the highest density of crabs detected in the transect, 77.2 individuals/m2).
At depths in the region where crab swarms were observed (∼355–385 m, Northwestflank) and collected (see below), including areas with crabs and without crabs, substratetype was sedimentary, and sediments appeared to be fine sand and silt, with no rockysubstrate.
Pineda et al. (2016), PeerJ, DOI 10.7717/peerj.1770 8/23

Figure 4 AUV photograph with the highest density of Pleuroncodes planipes.
Figure 5 Frequency distribution of quadrats with null and positive Pleuroncodes planipes counts. NoP. planipes occurred in null quadrats, whereas positive quadrats are those in which at least one P. planipeswas observed.
Pineda et al. (2016), PeerJ, DOI 10.7717/peerj.1770 9/23

Table 1 Pairwise distance comparisons for uncorrected p and K2P distance metrics.Minimum and maximum pairwise distances (for all com-parisons) and the mean distances for pairs within and between sampling localities are shown.
Minimum Maximum Within—Hannibal mean Within—California mean Hannibal—California mean
Uncorrected p 0.00168 0.01513 0.01042 0.00336 0.00732K2P 0.00168 0.01536 0.01055 0.00337 0.00734
Pleuroncodes planipes abundancePleuroncodes planipeswere detected in 12.2% of the Seabed AUV photographs. Images withcounts of P. planipes tended to center around 365 m water depth (Fig. 5). Crabs were rarein the shallowest and deepest images, with bins centered at 305 and 405 m, although thenumber of images from these depths was low. Peak densities, with up to 72.2 crabs/m2,occurred at 360–380 depths (Fig. 7). Three high-density patches were constrained to depthsbetween 362 and 381 m (Fig. 8A), and were separated from each other by over 100’s ofmeters along the northing (latitudinal) axis (Fig. 8B). The distribution of abundance inthese peaks indicates that densities were low at the periphery, and that the maxima densitiesoccur near the middle of the patch (Fig. 9). The distribution of crabs along the transectwas very patchy, with Imod = 5.34. Unidentified stomatopods that always occurred assingletons in the images had Imod= 3.54. The turbid layer was not apparent in the SeabedAUV images.
Galatheoid crabs DNA barcode IDWe obtained COI sequences for 6 specimens from Hannibal seamount and 4 specimensfrom the Pleuroncodes planipes stranding in California. Sequences were depositedin GenBank (Hannibal, KU179422, KU179423, KU179424, KU179425, KU179426,KU179431; La Jolla, KU179427, KU179428, KU179429, KU179430). Five out of the 6Hannibal specimens were obtained from the main crab swarm on 18 April 2015. The 6thspecimen was obtained on 3 April 2015, at a depth of 278 m, when crabs were observedon the bottom at the Northwest flank of the seamount (near 7◦21.21′N, 82◦1.37′W) atlow densities. The final alignment for the combined seamount and California dataset was595 base pairs. Inspection of the amino acid translation indicated that the sequences didnot represent pseudogenes. Sequences differed from each other by between 1–8 base pairs.Uncorrected p and Kimura 2-parameter distances were similar to each other and rangedfrom 0.00168–0.01363. There were no shared haplotypes and the mean pairwise distance(for bothmetrics) betweenHannibal specimenswas greater than themean distance betweenHannibal and California specimens (Table 1 and Fig. 6).
Water propertiesThe CTD cast revealed strong temperature, salinity, and oxygen stratification (Fig. 10). Thetemperature profile showed a sharp thermocline in the upper 40 m, with a temperaturedrop from 28.5 ◦C at the surface to 17.4 ◦C at 40 m, and a near-bottom temperature of11.1 ◦C at∼365 m. A halocline was also observed, with a salinity drop from 33.4 psu at thesurface to 34.8 psu at 40 m. Maximum salinity occurred at mid depths (34.9 psu at 180 m),with a slight freshening with increasing depth (to 34.8 psu at 365 m).
Pineda et al. (2016), PeerJ, DOI 10.7717/peerj.1770 10/23

Figure 6 Midpoint-rooted neighbor-joining topology based onmt COI Kimura 2-parameterdistances. Crab number 5 was found on 3 April at another location on Hannibal seamount, and wasnot in an aggregation.
Oxygen concentration decreased rapidly with depth, from over 4.8 ml/l at the surface to1.1 ml/l at 50 m, and was less than 1.0 ml/l deeper than 250 m. The lowest oxygen value,0.04 ml/l, was obtained from the deepest measurement, 365 m, ∼15 m above the bottom.Thus, Pleuroncodes planipes maximum densities occurred at depths where waters wereoxygen depleted. The vertical gradients of temperature and oxygen concentration changedabruptly at about 238 m, with larger gradients seen below 238 m. The vertical salinity alsochanged at around 238 m, but more subtly. Beam attenuation data from the SBE CTDrevealed a turbid layer around 365 m depth in which optical attenuation tripled.
DISCUSSIONBased on DNA barcoding, the Hannibal seamount crabs appear to be the same speciesas Pleuroncodes planipes from California. COI is the most typically used species barcodegene (Bucklin, Steinke & Blanco-Bercial, 2011), and sequence comparisons are frequentlybased on Kimura 2-parameter (K2P) distances (Da Silva et al., 2011). K2P distances maynot necessarily be the best distance metric for a given taxon (Srivathsan & Meier, 2012;Collins & Cruickshank, 2013), other metrics may not necessarily perform better and the
Pineda et al. (2016), PeerJ, DOI 10.7717/peerj.1770 11/23

3 0 0 3 2 0 3 4 0 3 6 0 3 8 0 4 0 01
1 0
1 0 0P l e u r o n c o d e s p l a n i p e s d e n s i t y w i t h d e p t h
Dens
ity + 1
(# / m
2 )
D e p t h ( m )Figure 7 Pleuroncodes planipes density with depth.
use of this metric permits straightforward comparisons with K2P distances from studies.Uncorrected p distances were similar to the K2P distances, and in both metrics, the meandistance between individuals at Hannibal Seamount was greater than the mean distancebetween Hannibal Seamount and California. Pairwise mitochondrial COI distances fellwithin the range of typical intraspecific distances for galatheoids (Da Silva et al., 2011). Thesouthern range limit of P. planipes is considered poorly known (Hendrickx & Harvey, 1999),although researchers have suggested Costa Rica (Wicksten, 2012), and our observationshere, supported by DNA sequences, may be the southernmost record.
Species have distinct patterns of variation in abundance over space, and understandingthe factors that determine these patterns and their diversity is a central goal in ecology.Spatial distribution patterns may reflect individual and population processes, includingsettlement, dispersal, migration (Roa & Tapia, 2000) and behavior. For example, gregariousbehavior and swarming in insects may produce characteristic spatial patterns of abundance(Okubo & Chiang, 1974). Whereas practically all organisms have patchy distributions atsome spatial scale of observation, the causes and consequences of patchiness can reflectfundamental ecological and life history characteristics (Marquet et al., 1993). For example,patchiness can be species-specific and vary ontogenetically (Hewitt, 1981; Décima, Ohman& De Robertis, 2010), and species that face different degrees of patchiness may have evolveddifferent life history strategies (e.g., Dagg, 1977). Patchiness, may be driven by external(‘‘vectorial’’, environmental), reproductive, social (e.g., behavioral) and competitive(‘‘coactive’’) processes (Hutchinson, 1953). Physical–biological interactions, such as the
Pineda et al. (2016), PeerJ, DOI 10.7717/peerj.1770 12/23

Figure 8 Along transect Pleuroncodes planipes density on depth (A), and 3-d plot of density with lati-tude and longitude. Arrow in (B) indicates the direction of the transect.
swimming up response of zooplankton and larvae to downwelling currents (Scotti &Pineda, 2007), might also produce patchiness (e.g., aggregation at fronts), and explain whyonly certain taxa aggregate in particular hydrodynamic settings.
The distribution of Pleuroncodes planipes was highly patchy, similar to other galatheoidpopulations (Freire, González-Gurriarán & Olaso, 1992; Roa & Tapia, 2000), and Imod
values were higher than those of a stomatopod that occurred at smaller densities thanP. planipes. The highP. planipes densities were constrained to a narrow subset of regions anddepth ranges on Hannibal seamount. From the 26 submarine dives (15 missions to distinct
Pineda et al. (2016), PeerJ, DOI 10.7717/peerj.1770 13/23

Figure 9 Pleuroncodes planipes abundance distribution in each of the three density peaks in Fig. 8.For peak correspondence, see along transect distance and maximum density.
Figure 10 Temperature, salinity and oxygen profile measurements taken with a CTD on 18 April 2015at a station a few tens of meters from the Seabed AUV transects.
Pineda et al. (2016), PeerJ, DOI 10.7717/peerj.1770 14/23

sites) and the 12 AUV transects, we observed dense aggregations of crabs in only one region,the Northwestern flank of the seamount, and these aggregations were constrained to∼355–385 m water depths. The AUV survey detected three peaks in abundance (Figs. 9A–9C),and in peak B, the observed density was 77 individuals/m2, one of the highest that have beenmeasured for galatheoid crabs (Lovrich & Thiel, 2011, Table 6.1). Our sampling protocolcannot resolve whether these density peaks are discrete patches or whether aggregationswere connected. It is unlikely, however, that crabs in density peak C were connected tocrabs in peak B, because crab distributions were observed to be constrained to 355–385 m,and the crabs in B and C were separated by shallower depths (Figs. 2 and 8).
The density distribution within each of the three abundance peaks detected in the surveyis consistent with a pattern where density increases towards the center of distribution(Fig. 9). However, we do not know whether the AUV surveyed the center of the patch. Thetwo high-density peaks at∼480 and 1,440 m along the transect (Figs. 9A and 9C) each havean adjoining lower-density peak. These lower-density peaks may represent budding, smallaggregations that have split from the main aggregation, and might grow into larger patches,or they might merge into the larger, adjacent patch. These density distribution patternsare likely due to aggregation driven by the crab’s gregarious behavior, and coordinatedmovement of the aggregation, a phenomenon that has been called swarming. Okubo,Grünbaum & Edelstein-Keshet (2001) describe swarming as a phenomenon where a groupof organisms move together. Swarms are arguably one of the few ecological phenomenathat possess emergent properties, where the characteristics of the aggregation cannotbe simply explained by adding the individual’s behaviors (Parrish & Edelstein-Keshet,1999). In these complex systems, a focus on individual behavior is unlikely to explain theproperties of the swarm. Whether all emergent properties in swarms are functional or not,is an open question (Parrish & Edelstein-Keshet, 1999). The increase in density towards thecenter is consistent with other organisms that form swarms and aggregations (e.g., insects,krill and schooling fish, Okubo & Chiang, 1974; Okubo, Grünbaum & Edelstein-Keshet,2001), and patterns of abundance in other gregarious benthic populations where densityincreases towards the middle of the distribution might reveal a swarming behavior. Twoother galatheoid species have patterns where density increases towards the middle ofthe patch (Freire, González-Gurriarán & Olaso, 1992) but in these European Munida spp.species, the scale of the patches is a few tens of kilometers, compared to the ∼100 m scaleobserved in our study. It is unclear whether the abundance structure of these Munidaspp. and Pleuroncodes planipes patches are caused by the same processes. Dense benthicaggregations of other species of anomuran and brachyuran crabs (king crabs, spider crabs,tanner crabs, lyre crabs) have been observed, and somewere related to reproduction (Powell& Nickerson, 1965; DeGoursey & Auster, 1992; Stevens, Donaldson & Haaga, 1992; Stevens,Haaga & Donaldson, 1994).
Crabs densities appeared to be higher and more clumped in the submarine videoobservations than in the AUV images (compare submarine video still frame Fig. 3 withAUV Fig. 4). The submarine video still frames in Fig. 3 were taken when Pleuroncodesplanipes were moving as a group, a swarm, and most organisms appeared to be orientedin the same direction. In the AUV images, a consistent crab orientation and the swarm
Pineda et al. (2016), PeerJ, DOI 10.7717/peerj.1770 15/23

motion were not obvious. Moreover, the turbid cloud observed from the submarine (Fig. 3)was not seen in any of the AUV images. The turbidity cloud was most likely produced byP. planipes activities, as the turbidity disappeared at the edge of the patch, and was notobserved outside of the patch or in any other submarine dive or AUV missions. Diurnalpatterns of activity might explain the differences in turbidity. Submarine observationswere early in the day, whereas the AUV survey was done in the evening. However, anotherpossibility is that crabs observed from the submarine were in a location with finer, andhence more easily suspended sediments than those surveyed by the AUV survey. However,the locations were not far from each other (Fig. 2).
The resuspension of sediment initiated by crab activity may affect the benthicenvironment over the Northwest seamount flank. Feeding of king crabs in waters ∼3 mdeep off Kodiak Island, Alaska, resulted in a dense cloud of turbid water (Stevens & Jewett,2014), and Yahel et al. (2008) found that bottom fish activity was an important mechanismfor sediment resuspension and remineralization of organic matter between water depthsof ∼60 and 140 m in Saanich Inlet (Vancouver Island, BC, Canada).
Pleuroncodes planipes occurred at water depths with very low oxygen (0.04 ml/l at∼15 mabove the bottom where the crabs were observed). The affinity of some galatheoids to lowoxygen waters, and P. planipes in particular, is known (Boyd, 1967; Lovrich & Thiel, 2011).Depth distribution of P. planipes and other galatheoidsmight be related to these low oxygenlevels (discussed by Lovrich & Thiel, 2011), but more study is needed to test this hypothesis.
Pleuroncodes planipes occurs in very high densities in the pelagic environment, and thisspecies mass strands yearly in shallow water and intertidal beaches near the center of itspelagic abundance, Bahía Magdalena, Baja California (Aurioles-Gaamboa, Castro-González& Pérez-Flores, 1994), and more occasionally on California beaches (Table 1, Longhurst,1966; Smith, 1985). While we were on hydrographic stations over Hannibal seamount andsurrounding areas, we occasionally observed organisms that appeared to be pelagic redcrabs swimming swiftly by the stern of the boat at night, illuminated by the vessel lights.Despite multiple attempts, we were not able to capture a specimen to assess its identity, sothe occurrence of P. planipes in the water column above Hannibal seamount is unknown.
Our observations in Panama were conducted at roughly the same time when massstranding events were registered in Southern California (Table S1), and the Hannibal andCalifornian individuals appear to be the same species based on their mtCOI sequences.Mass stranding of Pleuroncodes planipes in Southern California beaches has been linked toEl Niño (Smith, 1985). A full El Niño had not been declared for January–June 2015, whenmany stranding events were reported (Table S1). On the other hand, an unusually largepool of warm water developed in late 2013 and early 2014 in the coastal temperate easternPacific, and persisted through much of 2015 (Bond et al., 2015), apparently unrelated to ElNiño. The current forecast (February 2015, by NOAA Climate Prediction Center), indicatethat the anomalous warm-water pool condition has been followed by an El Niño, and that afull El Niño is currently in progress. The ‘‘pool of warm water’’ conditions in January–June2015 may be related to anomalously warm waters observed in Southern California’snearshore in fall 2014 (N Reyns, J Pineda & S Lentz, pers. obs., 2015). These conditionsmay help explain the appearance of P. planipes in Southern California, as speculated by
Pineda et al. (2016), PeerJ, DOI 10.7717/peerj.1770 16/23

some news outlets. Whereas it is unlikely that our observations of benthic aggregations atHannibal are connected with the California mass stranding events, it is significant that P.planipes can be simultaneously abundant at the two distant locations and at two differenthabitats. The high densities of P. planipes likely impacted local pelagic, intertidal, and deepseamount food webs.
Allochthonous supply of biomass, where resources from one habitat or ecosystemsubsidizes another system, influences local population community and dynamics (Polis,Anderson & Holt, 1997). Moreover, the episodic availability of large quantities of biomassto benthic and pelagic organisms and marine mammals, including the supply of terrestrialmaterial and whale carcasses to benthic deep sea communities, themass stranding of pelagicorganisms in shallow habitats, and the sudden availability of a new resource, representan opportunistic yet important source of nutrition to the ‘‘receiving’’ communities(Polis, Anderson & Holt, 1997), and can influence food web structure and demographicrates (Watt, Siniff & Estes, 2000). The massive availability of Pleuroncodes planipes mightinfluence diverse food webs.
Because of its pelagic and benthic lifestyle, and its abundance, Pleuroncodes planipes likelyplays an important role in some seamount, continental shelf and shallow water food websin the subtropical and subtemperate eastern Pacific. Several authors have noticed the keyrole of P. planipes in the pelagic environment, by virtue of its abundance and trophic role(Alverson, 1963; Longhurst, 1966; Longhurst, Lorenzen & Thomas, 1967; Gómez-Gutiérrezet al., 2000; Robinson, Anislado & Lopez, 2004). P. planipes was patchy but very abundantat Hannibal, and it might represent an important resource for pelagic predators at theseamount. More research is needed to assess the distribution and abundance of benthic P.planipes, as well as its potentially key role in subtropical and subtemperate eastern Pacificseamount and continental shelf habitats.
ACKNOWLEDGEMENTSWe would like to express gratitude for the help and logistical support of the Captain andthe crew of the M/V Alucia, the Alucia’s submarine team, Jeff Anderson, for programmingand running the AUV operations, and keeping it safe, Alex Bocconcelli, WHOI’s MarineOperations office support, and S Searcy (USD) for red crab stranding information in SanDiego. Bathymetric data in Fig. 1 derived from the GEBCO_2014 Grid, www.gebco.net.
ADDITIONAL INFORMATION AND DECLARATIONS
FundingThis work was sponsored by a grant from the Dalio Foundation, Inc, through the WoodsHole Oceanographic Institution. The funders had no role in study design, data collectionand analysis, decision to publish, or preparation of the manuscript.
Grant DisclosuresThe following grant information was disclosed by the authors:Dalio Foundation, Inc.
Pineda et al. (2016), PeerJ, DOI 10.7717/peerj.1770 17/23

Competing InterestsThe authors declare there are no competing interests.
Author Contributions• Jesús Pineda conceived and designed the experiments, performed the experiments,analyzed the data, contributed reagents/materials/analysis tools, wrote the paper,prepared figures and/or tables, reviewed drafts of the paper.• Walter Cho and Annette F. Govindarajan conceived and designed the experiments,performed the experiments, analyzed the data, contributed reagents/materials/analysistools, prepared figures and/or tables, reviewed drafts of the paper.• Victoria Starczak,HéctorM.Guzman, RustyC.Holleman and JamesChurchill conceivedand designed the experiments, performed the experiments, reviewed drafts of the paper.• Yogesh Girdhar conceived and designed the experiments, performed the experiments,contributed reagents/materials/analysis tools, reviewed drafts of the paper.• Hanumant Singh contributed reagents/materials/analysis tools.• David K. Ralston reviewed drafts of the paper.
Field Study PermissionsThe following information was supplied relating to field study approvals (i.e., approvingbody and any reference numbers):
The Ministerio del Ambiente de Panama provided permission (# SE/A-18-15).
DNA DepositionThe following information was supplied regarding the deposition of DNA sequences:
GenBank (numbers also listed in the paper):Pplanipes.sqn Hannibal_1402a KU179422Pplanipes.sqn Hannibal_1402b KU179423Pplanipes.sqn Hannibal_1402c KU179424Pplanipes.sqn Hannibal_1402d KU179425Pplanipes.sqn Hannibal_1402e KU179426Pplanipes.sqn CAcrab1 KU179427Pplanipes.sqn CAcrab2 KU179428Pplanipes.sqn CAcrab3 KU179429Pplanipes.sqn CAcrab4 KU179430Pplanipes.sqn Hannibal_1051 KU179431.
Data AvailabilityThe following information was supplied regarding data availability:
The raw data has been supplied as Data S1 and S2.
Supplemental InformationSupplemental information for this article can be found online at http://dx.doi.org/10.7717/peerj.1770#supplemental-information.
Pineda et al. (2016), PeerJ, DOI 10.7717/peerj.1770 18/23

REFERENCESAhyong ST, Baba K, Macpherson E, Poore GC. 2010. A new classification of the
Galatheoidea (Crustacea: Decapoda: Anomura). Zootaxa 2676:57–68.Alverson F. 1963. The food of yellowfin and skipjack tunas in the eastern tropical Pacific
Ocean. Inter-American Tropical Tuna Commission Bulletin 7:295–367.Aurioles-Gaamboa D, Castro-González MI, Pérez-Flores R. 1994. Annual mass strand-
ings of pelagic red crabs, Pleuroncodes planipes (Crustacea, Anomura, Galatheidae),in Bahia Magdalena, Baja California Sur, Mexico. Fishery Bulletin 92:464–470.
Aurioles-Gamboa D, Pérez-Flores R. 1997. Seasonal and bathymetric changes infeeding habits of the benthic red crab Pleuroncodes planipes (Decapoda, Anomura,Galatheidae) off the Pacific coast of Baja California Sur, Mexico. Crustaceana70:272–287 DOI 10.1163/156854097X00573.
Bez N. 2000. On the use of Lloyd’s index of patchiness. Fisheries Oceanography9:372–376 DOI 10.1046/j.1365-2419.2000.00148.x.
Bond NA, CroninMF, Freeland H, Mantua N. 2015. Causes and impacts of the 2014warm anomaly in the NE Pacific. Geophysical Research Letters 42: 2015GL063306DOI 10.1002/2015GL063306.
Boyd CM. 1967. The benthic and pelagic habitats of red crab Pleuroncodes planipes.Pacific Science 21:394–403.
Brinton E. 1979. Parameters relating to the distributions of planktonic organisms,especially Euphausiids in the eastern tropical Pacific. Progress in Oceanography8:125–189 DOI 10.1016/0079-6611(79)90001-6.
Bucklin A, Steinke D, Blanco-Bercial L. 2011. DNA barcoding of marine metazoa.Annual Review of Marine Science 3:471–508DOI 10.1146/annurev-marine-120308-080950.
ClarkMR, Rowden AA, Schlacher T,Williams A, Consalvey M, Stocks KI, RogersAD, O’Hara TD,White M, Shank TM, Hall-Spencer JM. 2010. The ecology ofseamounts: structure, function, and human impacts. Annual Review of MarineScience 2:253–278 DOI 10.1146/annurev-marine-120308-081109.
Collins R, Cruickshank R. 2013. The seven deadly sins of DNA barcoding.MolecularEcology Resources 13:969–975 DOI 10.1111/1755-0998.12046.
Cunningham SL, Guzman HM, Bates RC. 2013. The morphology and structure of theHannibal Bank fisheries management zone, Pacific Panama using acoustic seabedmapping. Revista de Biologia Tropical 61:1967–1979.
DaggM. 1977. Some effects of patchy food environments on copepods. Limnology andOceanography 22:99–107 DOI 10.4319/lo.1977.22.1.0099.
Dana TF. 1975. Development of contemporary Eastern Pacific coral reefs.Marine Biology33:355–374 DOI 10.1007/BF00390574.
Da Silva JM, Creer S, Dos Santos A, Costa AC, CunhaMR, Costa FO, Carvalho GR.2011. Systematic and evolutionary insights derived from mtDNA COI barcodediversity in the Decapoda (Crustacea: Malacostraca). PLoS ONE 6:e19449DOI 10.1371/journal.pone.0019449.
Pineda et al. (2016), PeerJ, DOI 10.7717/peerj.1770 19/23

D’Croz L, O’Dea A. 2007. Variability in upwelling along the Pacific shelf of Panama andimplications for the distribution of nutrients and chlorophyll. Estuarine, Coastal andShelf Science 73:325–340 DOI 10.1016/j.ecss.2007.01.013.
DécimaM, OhmanMD, De Robertis A. 2010. Body size dependence of euphausiidspatial patchiness. Limnology and Oceanography 55:777–788DOI 10.4319/lo.2009.55.2.0777.
DeGoursey RE, Auster PJ. 1992. A mating aggregation of the spider crab (Libiniaemarginata). Journal of Northwest Atlantic Fishery Science 13:77–82DOI 10.2960/J.v13.a6.
Folmer O, BlackM, HoehW, Lutz RA, Vrijenhoek R. 1994. DNA primers for ampli-fication of mitochondrial cytochrome c oxidase subunit I from diverse metazoaninvertebrates.Molecular Marine Biology and Biotechnology 3:294–299.
Freire J, González-Gurriarán E, Olaso I. 1992. Spatial distribution ofMunida intermediaandM. sarsi (Crustacea: Anomura) on the Galician continental shelf (NW Spain):application of geostatistical analysis. Estuarine, Coastal and Shelf Science 35:637–648DOI 10.1016/S0272-7714(05)80044-7.
Genin A, Dower JF. 2007. Seamount plankton dynamics. In: Pitcher T, Morato T, HartP, Clark M, Haggan N, Santos R, eds. Seamounts: ecology, fisheries, and conservation.Oxford: Blackwell, 85–100.
Gómez-Gutiérrez J, Domínguez-Hernández E, Robinson CJ, Arenas V. 2000.Hydroa-coustical evidence of autumn inshore residence of the pelagic red crab Pleuroncodesplanipes at Punta Eugenia, Baja California, Mexico.Marine Ecology Progress Series208:283–291 DOI 10.3354/meps208283.
HendrickxME, Harvey AW. 1999. Checklist of anomuran crabs (Crustacea: Decapoda)from the eastern tropical Pacific. Belgian Journal of Zoology 129:363–389.
Hewitt R. 1981. The value of pattern in the distribution of young fish. Rapports et Proces-Verbaux des Reunions Conseil International pour l’Exploration de la Mer 178:229–236.
Hutchinson GE. 1953. The concept of pattern in ecology. Proceedings of the Academy ofNatural Sciences of Philadelphia 105:1–12.
Klimley A, Richert JE, Jorgensen SJ. 2005. The home of blue water fish. AmericanScientist 93:42–49 DOI 10.1511/2005.51.954.
Koslow JA. 1997. Seamounts and the ecology of deep-sea fisheries. American Scientist85:168–176.
LarkinMA, Blackshields G, Brown N, Chenna R, McGettigan PA, McWilliamH,Valentin F, Wallace IM,Wilm A, Lopez R. 2007. Clustal W and Clustal X version2.0. Bioinformatics 23:2947–2948 DOI 10.1093/bioinformatics/btm404.
Longhurst AR. 1966. The pelagic phase of Pleuroncodes planipes Stimpson (Crustacea,Galatheidae) in the California Current. CalCOFI Reports XI:142–154.
Longhurst AR. 1968. The biology of mass occurrences of Galatheid crustaceans andtheir utilization as a fisheries resource. In: Mistakidis MN, ed. Proceeding of the worldscientific conference on the biology and culture of shrimps and prawns FAO fisheriesreports. Vol. 57. Mexico City: 95–110.
Pineda et al. (2016), PeerJ, DOI 10.7717/peerj.1770 20/23

Longhurst AR, Lorenzen CJ, ThomasWH. 1967. The role of pelagic crabs in the grazingof phytoplankton off Baja California. Ecology 48:190–200 DOI 10.2307/1933100.
Longhurst AR, Seibert DLR. 1971. Breeding in an oceanic population of Pleuroncodesplanipes (Crustacea, Galatheidae). Pacific Science 25:426–428.
Lovrich GA, Thiel M. 2011. Ecology, physiology, feeding and trophic role of squatlobsters. In: Poore GCB, Ahyong ST, Taylor J, eds. The biology of squat lobsters. BocaRaton: CRC Press 183–222.
Macpherson E, De Forges BR, Schnabel K, Samadi S, Boisselier MC, Garcia-RubiesA. 2010. Biogeography of the deep-sea galatheid squat lobsters of the PacificOcean. Deep-Sea Research Part I-Oceanographic Research Papers 57:228–238DOI 10.1016/j.dsr.2009.11.002.
Manzello DP, Kleypas JA, Budd DA, Eakin CM, Glynn PW, Langdon C. 2008. Poorlycemented coral reefs of the eastern tropical Pacific: possible insights into reefdevelopment in a high-CO2 world. Proceedings of the National Academy of Sciencesof the United States of America 105:10450–10455 DOI 10.1073/pnas.0712167105.
Marquet P, Fortin MJ, Pineda J, Wallin DO, Clark J, Wu Y, Bollens S, Jacobi C, HoltRD. 1993. Ecological and evolutionary consequences of patchiness: a marine-terrestrial perspective. In: Levin SA, Powell TM, Steele JH, eds. Patch dynamics.Berlin: Springer-Verlag, 277–304.
Morato T, Hoyle SD, Allain V, Nicol SJ. 2010. Seamounts are hotspots of pelagicbiodiversity in the open ocean. Proceedings of the National Academy of Sciences of theUnited States of America 107:9707–9711 DOI 10.1073/pnas.0910290107.
Morato T, Varkey DA, Damaso C, Machete M, Santos M, Prieto R, Santos RS, PitcherTJ. 2008. Evidence of a seamount effect on aggregating visitors.Marine EcologyProgress Series 357:23–32 DOI 10.3354/meps07269.
Nicol EAT. 1932. The feeding habits of the Galatheidae. Journal of the Marine BiologicalAssociation of the United Kingdom 18:87–106 DOI 10.1017/S0025315400051316.
Okubo A, Chiang HC. 1974. An analysis of the kinematics of swarming of Anaretepritchardi Kim (Diptera: Cecidomyiidae). Researches on Population Ecology 16:1–42DOI 10.1007/BF02514077.
Okubo A, GrünbaumD, Edelstein-Keshet L. 2001. The dynamics of animal grouping.In: Levin SA, ed. Diffusion and ecological problems: modern perspectives. New York:Springer, 197–237.
Parrish JK, Edelstein-Keshet L. 1999. Complexity, pattern, and evolutionary trade-offsin animal aggregation. Science 284:99–101 DOI 10.1126/science.284.5411.99.
Pineda J, Reyns N, Starczak VR. 2009. Complexity and simplification in understandingrecruitment in benthic populations. Population Ecology 51:17–32DOI 10.1007/s10144-008-0118-0.
Pitcher TJ, Morato T, Hart PJ, ClarkMR, Haggan N, Santos RS. 2008. Seamounts:ecology, fisheries & conservation. Oxford: Blackwell Publishing.
Polis GA, AndersonWB, Holt RD. 1997. Toward an integration of landscape and foodweb ecology: the dynamics of spatially subsidized food webs. Annual Review ofEcology and Systematics 28:289–316.
Pineda et al. (2016), PeerJ, DOI 10.7717/peerj.1770 21/23

Powell GC, Nickerson RB. 1965. Aggregations among juvenile king crabs (Paralithodescamtschatica, Tilesius) Kodiak, Alaska. Animal Behaviour 13:374-IN310.
Roa R, Tapia F. 2000. Cohorts in space: geostatistical mapping of the age structure ofthe squat lobster Pleuroncodes monodon population off central Chile.Marine EcologyProgress Series 196:239–251 DOI 10.3354/meps196239.
Robinson CJ, Anislado V, Lopez A. 2004. The pelagic red crab (Pleuroncodes planipes)related to active upwelling sites in the California Current off the west coast of BajaCalifornia. Deep Sea Research Part II: Topical Studies in Oceanography 51:753–766DOI 10.1016/j.dsr2.2004.05.018.
Robinson CJ, Gómez-Gutiérrez J. 1998. The red-crab bloom off the west coast of BajaCalifornia, Mexico. Journal of Plankton Research 20:2009–2016DOI 10.1093/plankt/20.10.2009.
Schlacher TA, Rowden AA, Dower JF, Consalvey M. 2010. Seamount sciencescales undersea mountains: new research and outlook.Marine Ecology 31:1–13DOI 10.1111/j.1439-0485.2010.00396.x.
Scotti A, Pineda J. 2007. Plankton accumulation and transport in propagating nonlinearinternal fronts. Journal of Marine Research 65:117–145DOI 10.1357/002224007780388702.
Singh H, Armstrong R, Gilbes F, Eustice R, Roman C, Pizarro O, Torres J. 2004a.Imaging coral I: imaging coral habitats with the SeaBED AUV. Subsurface SensingTechnologies and Applications 5:25–42 DOI 10.1023/B:SSTA.0000018445.25977.f3.
Singh H, Can A, Eustice R, Lerner S, McPhee N, Roman C. 2004b. Seabed AUV offersnew platform for high-resolution imaging. Eos, Transactions American GeophysicalUnion 85:289–296.
Singh H, Roman C, Pizarro O, Eustice R, Can A. 2007. Towards high-resolution imagingfrom underwater vehicles. The International Journal of Robotics Research 26:55–74DOI 10.1177/0278364907074473.
Smith PE. 1985. A case history of an anti-Niño transition plankton and nekton distribu-tion and abundances. In: Wooster WS, David LF, eds. El Niño North: Niño effects inthe eastern subarctic Pacific Ocean. Seattler: Washingthon Sea Grant, 121–142.
Srivathsan A, Meier R. 2012. On the inappropriate use of Kimura-2-parameter(K2P) divergences in the DNA-barcoding literature. Cladistics 28:190–194DOI 10.1111/j.1096-0031.2011.00370.x.
Starczak VR, Pérez-Brunius P, Levine HE, Gyory J, Pineda J. 2011. The role of seasonand salinity in influencing barnacle distribution in two adjacent coastal mangrovelagoons. Bulletin of Marine Science 87:275–299 DOI 10.5343/bms.2010.1022.
Stevens BG, DonaldsonWE, Haaga JA. 1992. First observations of podding behavior forthe Pacific Lyre crab Hyas lyratus (Decapoda: Majidae). Journal of Crustacean Biology12:193–195 DOI 10.2307/1549074.
Stevens BG, Haaga JA, DonaldsonWE. 1994. Aggregative mating of Tanner crabs,Chionoecetes bairdi. Canadian Journal of Fisheries and Aquatic Sciences 51:1273–1280DOI 10.1139/f94-127.
Pineda et al. (2016), PeerJ, DOI 10.7717/peerj.1770 22/23

Stevens BG, Jewett SC. 2014. Growth, molting, and feeding of king crabs. In: Bradley GS,ed. King crabs of the world biology and fisheries management . Boca Raton: CRC Press,315–362.
Swofford DL. 2003. PAUP*. Phylogenetic analysis using parsimony (*and other methods).Version 4. Sunderland: Sinauer Associates.
Thresher R, Althaus F, Adkins J, Gowlett-Holmes K, Alderslade P, Dowdney J, ChoW, Gagnon A, Staples D, McEnnulty F. 2014. Strong depth-related zonationof megabenthos on a rocky continental margin (∼700–4,000 m) off southernTasmania, Australia. PLoS ONE 9:e85872 DOI 10.1371/journal.pone.0085872.
Watt J, Siniff DB, Estes JA. 2000. Inter-decadal patterns of population and di-etary change in sea otters at Amchitka Island, Alaska. Oecologia 124:289–298DOI 10.1007/s004420000373.
Wehrtmann IS, Herrera-Correal J, Vargas R, P H. 2010. Squat lobsters (Decapoda:Anomura: Galatheidae) from deepwater Pacific Costa Rica: species diversity, spatialand bathymetric distribution. Nauplius 18:69–77.
Wessel P, Sandwell DT, Kim SS. 2010. The global seamount census. Oceanography23:24–33 DOI 10.5670/oceanog.2010.60.
WickstenMK. 2012. Decapod Crustacea of the Californian and Oregonian zoogeo-graphic provinces. Zootaxa 3371:1–307.
Williams G, Maksym T,Wilkinson J, Kunz C, Murphy C, Kimball P, Singh H. 2014.Thick and deformed Antarctic sea ice mapped with autonomous underwatervehicles. Nature Geoscience 8:61–67 DOI 10.1038/ngeo2299.
Yahel G, Yahel R, Katz T, Lazar B, Herut B, Tunnicliffe V. 2008. Fish activity: amajor mechanism for sediment resuspension and organic matter remineraliza-tion in coastal marine sediments.Marine Ecology Progress Series 372:195–209DOI 10.3354/meps07688.
Pineda et al. (2016), PeerJ, DOI 10.7717/peerj.1770 23/23