a cost assessment of ecosystem services …...a cost assessment of ecosystem services procurement...
TRANSCRIPT

A Cost Assessment of Ecosystem Services Procurement Using Three
Mechanisms: Outright Purchases, Conservation Easements, and
ALUS
Christopher Mallon
Marius Cutlac
Marian Weber
Prepared for:
Bryan Gilvesy
ALUS Canada
Contact Information:
Christopher Mallon
Researcher, Alberta Innovates Technology Futures
250 Karl Clark Rd.
Edmonton, Alberta
T6N 1E4
780.450.5080

ALBERTA INNOVATES – TECHNOLOGY FUTURES
PAGE I
EXECUTIVE SUMMARY
This project was commissioned by ALUS Canada to compare the costs of procuring
ecosystem services from agricultural land using the ALUS program model of annual payments with
the costs of alternative procurement through land securement via easements and purchases. The
project identifies the key cost drivers underlying the different procurement options.
Procurement costs were estimated using methods from the literature on agricultural
economics and ALUS data on actual program delivery costs. In addition an agricultural land value
model was developed to estimate the costs of procurement through easements and land purchase.
Interviews were used to validate assumptions.
The main difference between the procurement options is in fixed transaction and
administration costs as well as ongoing management costs and their distribution between procuring
agencies and farmers. Findings indicated that in most cases, ALUS projects carried lower costs for
average ALUS project sizes. However the marginal cost of each additional project acre was higher
for ALUS than for conservation easements, suggesting that conservation easements may be better
suited to conserving large tracts of land. Outright purchase of land was found to be more expensive
than either of the other two mechanisms.
The project illustrates the difficulty of comparing these mechanisms. While an ALUS
project can happen almost anywhere on an agricultural property, a conservation easement or
purchase is bound by legal land boundaries. ALUS can provide more spatial flexibility than typical
land procurement methods, enabling a more diffuse model of ecosystem services procurement to
occur.
The major conclusion of this report is that at the scale that ALUS currently operates – small,
diffuse projects that are incorporated into the working landscape – it generally has lower costs than
an easement or purchase would have at a comparable scale. Savings from lower transaction and
management costs generally outweigh the costs of an annual payment.
Since ALUS projects do not operate at the same scale as easements and purchases, there are
differences in the ecosystem services provided as well as the permanence and risks associated with
different securement options. Estimating benefits was outside the scope of the analysis. The cost
effectiveness of different procurement options applies to cost per hectare and cannot be assumed to

ALBERTA INNOVATES – TECHNOLOGY FUTURES
PAGE II
extend to cost per unit of ecosystem service. The key message is that ALUS can enable ecosystem
service procurement in areas that cannot be easily accessed using easements and purchases at a
comparable or lower cost. Conversely, ALUS projects are likely not ideal to conserve large areas of
land as economies of scale make easements more economical. For sensitive ecological areas which
require intensive management outright purchase is likely the best option.
In summary each mechanism has strengths and weaknesses and ultimately the best option
depends on program goals.

ALBERTA INNOVATES – TECHNOLOGY FUTURES
PAGE III
ACKNOWLEDGEMENTS
The authors would like to gratefully acknowledge the support of Bryan Gilvesy, Chris
Elder, Casey Whitelock, Kim Good, and the farmers and landowners who were willing to share
their experiences of the ALUS program.

ALBERTA INNOVATES – TECHNOLOGY FUTURES
PAGE IV
TABLE OF CONTENTS
A Cost Assessment of Ecosystem Services Procurement Using Three Mechanisms: Outright Purchases, Conservation Easements, and ALUS ...................................................................... 1
Executive Summary ................................................................................................................ i
Acknowledgements .............................................................................................................. iii
TABLE OF CONTENTS ............................................................................................................ iv
LIST OF TABLES ...................................................................................................................... v
LIST OF FIGURES .................................................................................................................... v
1 Introduction ................................................................................................................... 1
2 Methods ........................................................................................................................ 2
2.1 Study Sites .........................................................................................................................2
2.2 Input Data Preparation ......................................................................................................3
2.3 Calculation of Mechanism Costs .........................................................................................6
Outright Purchase .................................................................................................................................. 7 2.3.1
Conservation Easement ......................................................................................................................... 8 2.3.2
ALUS Program ...................................................................................................................................... 11 2.3.3
3 Results ......................................................................................................................... 13
4 Discussion .................................................................................................................... 18
5 Conclusion ................................................................................................................... 21
6 References ................................................................................................................... 22
7 Appendix I: Model Assumptions ................................................................................... 25
8 Appendix II: Theoretical Cost Benefit Framework .......................................................... 26
9 Appendix III: Interview Questions ................................................................................. 28
9.1 Land Trust Interview ........................................................................................................ 28
9.2 Farmer Interview ............................................................................................................. 28
9.3 ALUS Coordinator Interview ............................................................................................. 29
10 Appendix IV: Sample Calculation .................................................................................. 30

ALBERTA INNOVATES – TECHNOLOGY FUTURES
PAGE V
LIST OF TABLES Table 1 Representation of cost categories (Naidoo et al. 2006) used in the cost evaluation.. ........ 4
Table 2 Input data and sources for the farm budget model............................................................. 5
Table 3 Average conversion costs (𝜔𝑖) in dollars per acre, for each project type (k) in Alberta. .. 5
Table 4 Average conversion costs (𝜔𝑖) in dollars per acre, for each project type (k) in Ontario. .. 5
Table 5 Transaction costs for CAs purchasing land or purchasing rights to land. ......................... 8
Table 6 Costs associated with the management of a purchased property by a CA. ....................... 9
Table 7 Costs associated with maintaining a conservation easement. .......................................... 11
Table 8 Observed recidivism rates in Vermilion and Norfolk counties. ...................................... 12
Table 9 Average project sizes from ALUS project data. .............................................................. 13
Table 10 Project cost results.. ....................................................................................................... 15
LIST OF FIGURES Figure 1 The average costs of projects using different ES procurement mechanisms ................. 16
Figure 2 The impact of project size on the predicted cost of grassland projects .......................... 17
ALBERTA INNOVATES – TECHNOLOGY FUTURES
PAGE 1
1 INTRODUCTION
The amount of land protected through land trusts, which are non-profits dedicated to
holding and stewarding land, has been increasing rapidly in the United States for over 30 years
(Merenlender, Huntsinger, Guthey, & Fairfax, 2004; Parker, 2004; Silver, Attridge, MacRae, &
Cox, 1995). Canada has seen similar trends emerge (Silver et al., 1995). Permanent procurement
of conservation through land purchases and conservation easements is widely used in the United
States and Canada, though these mechanisms may cause conflict with local communities and it is
more difficult to get land owners to participate in permanent protection programs (Main, Roka,
& Noss, 1999; Merenlender et al., 2004).
The Alternative Land Use Services (ALUS) program has emerged as a potential
alternative method to procure ecosystem services (ES) from farmland. The ALUS program
delivers annual payments to farmers to convert marginal land from agricultural production to a
state for which its primary purpose is the provision of ES.
The goal of this study is to explore the costs to a conservation agency (CA) of converting
farmland to a native ecosystem using these three different mechanisms: outright purchases of
land (OP), conservation easements (CEs), and ALUS payments for project. The study areas are
Norfolk County, Ontario, and Vermilion County, Alberta.
The remainder of the report describes the study areas and the costs associated with each
procurement method, as well as how costs are categorized. A crop yield model is developed to
estimate the opportunity costs from lost production due to farmland conversion. Conversion and
other costs are obtained from ALUS project data and interviews. Results are provided and
discussed. The appendices contain details of the assumptions (Appendix 1), as well as the full
framework for the cost analysis (Appendix 2), the interview questions (Appendix 3), and a
sample cost calculation (Appendix 4).

ALBERTA INNOVATES – TECHNOLOGY FUTURES
PAGE 2
2 METHODS
2.1 STUDY SITES
The first study site, Norfolk County, Ontario is a primarily agricultural county with a land
area of 1,607.6 km2 and a population of 63,175 people (Statistics Canada, 2011a). There are
2,180 farms in Norfolk. Almost half are oilseed and grain farms, with the rest a mix of cattle,
livestock, vegetable, and greenhouse operations (Statistics Canada, 2011b). Norfolk’s largest
crop in terms of area is soybeans, followed by corn and then wheat. Norfolk County has a lower
number of cattle farms than the provincial average in Ontario, likely due to a history of tobacco
farming in the area1. There are currently over 1,000 ALUS projects in the county, including bird
habitats, constructed wetlands, shelterbelts, forests, water control structures, modified
agricultural practices, and native grasslands.
The second study site is Vermilion River County, in Alberta, Canada. Vermilion River’s
population is 7,905 on a land area of 5,518.18 km2 (Statistics Canada, 2011c). There are 1,029
farms in the county with just over half focused on oilseeds, grains, and other crops, and the
majority of the remaining farms focused on cattle ranching (Statistics Canada, 2011b).
Vermilion’s largest crop is canola, followed by wheat and then barley (Statistics Canada, 2011f).
There is also a much higher proportion of tame pasture, woodlands, and natural pasture land in
Vermilion than in Norfolk, in spite of the fact that roughly the same proportion of farms are
classified as cattle or livestock farms (Statistics Canada, 2011g).
Although both counties are primarily agricultural the average farm size in Alberta is
larger; Vermilion average farm size is 1,195 acres compare to Norfolk’s average farm size of
224 acres (Statistics Canada, 2011f). In spite of their smaller size, farms in Norfolk County have
higher total expenses than those in Vermilion (Statistics Canada, 2011e). Overall, these data
suggest that Vermilion County’s farms are larger than Norfolk’s farms, with lower per acre costs,
more natural areas and tame pastures, and different crop rotations.
1 Based on farmer interviews.
ALBERTA INNOVATES – TECHNOLOGY FUTURES
PAGE 3
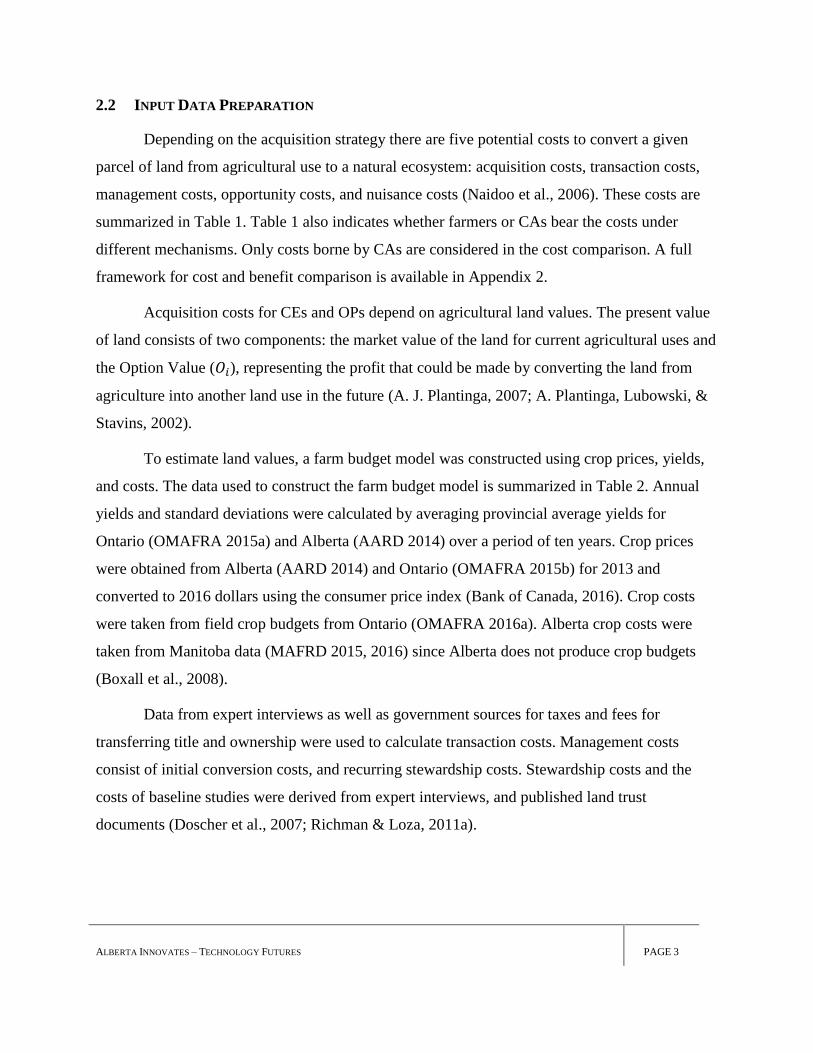
2.2 INPUT DATA PREPARATION
Depending on the acquisition strategy there are five potential costs to convert a given
parcel of land from agricultural use to a natural ecosystem: acquisition costs, transaction costs,
management costs, opportunity costs, and nuisance costs (Naidoo et al., 2006). These costs are
summarized in Table 1. Table 1 also indicates whether farmers or CAs bear the costs under
different mechanisms. Only costs borne by CAs are considered in the cost comparison. A full
framework for cost and benefit comparison is available in Appendix 2.
Acquisition costs for CEs and OPs depend on agricultural land values. The present value
of land consists of two components: the market value of the land for current agricultural uses and
the Option Value (𝑂𝑖), representing the profit that could be made by converting the land from
agriculture into another land use in the future (A. J. Plantinga, 2007; A. Plantinga, Lubowski, &
Stavins, 2002).
To estimate land values, a farm budget model was constructed using crop prices, yields,
and costs. The data used to construct the farm budget model is summarized in Table 2. Annual
yields and standard deviations were calculated by averaging provincial average yields for
Ontario (OMAFRA 2015a) and Alberta (AARD 2014) over a period of ten years. Crop prices
were obtained from Alberta (AARD 2014) and Ontario (OMAFRA 2015b) for 2013 and
converted to 2016 dollars using the consumer price index (Bank of Canada, 2016). Crop costs
were taken from field crop budgets from Ontario (OMAFRA 2016a). Alberta crop costs were
taken from Manitoba data (MAFRD 2015, 2016) since Alberta does not produce crop budgets
(Boxall et al., 2008).
Data from expert interviews as well as government sources for taxes and fees for
transferring title and ownership were used to calculate transaction costs. Management costs
consist of initial conversion costs, and recurring stewardship costs. Stewardship costs and the
costs of baseline studies were derived from expert interviews, and published land trust
documents (Doscher et al., 2007; Richman & Loza, 2011a).

ALBERTA INNOVATES – TECHNOLOGY FUTURES
PAGE 4
Table 1 Representation of cost categories (Naidoo et al., 2006) for ALUS (A), Conservation Easement (CE),
and Outright Purchase (OP). Far right columns assign the cost categories to the Conservation Authority (CA)
or farmer under each of the programs.
Cost
Category Included Costs Notation Data Sources
CA Farmer
OP CE A OP CE A
Acquisition
Costs Present value profits from land 𝑃(𝑖) See Table 3 ∙ ∙
Option value of land 𝑂𝑖 Plantinga et al. 2002, MLS data ∙ ∙
Estimated market value of land 𝑉(𝑖) 𝑃(𝑖) + 𝑂(𝑖) ∙ ∙
Present value ALUS annual
payments 𝑌(𝑖) ALUS data ∙
Management
Costs (m)
Fixed organizational overhead
(exclude) N/A Assume equivalency ∙ ∙ ∙
Conversion
Costs
Baseline Study
and Management
Plan 𝑏𝑖 Land Trust Interview ∙ ∙
Fencing 𝜔𝑖 ALUS data
Farmer Interview ∙ ∙ ∙ ∙
Planting 𝜔𝑖 ALUS data
Farmer Interview ∙ ∙ ∙ ∙
Wetland
Construction 𝜔𝑖 ALUS data ∙ ∙ ∙
Water System
Installation 𝜔𝑖
ALUS data
Farmer Interview ∙ ∙ ∙
Stewardship
Costs
Annual upkeep 𝑢𝑖 Farmer Interview ∙ ∙ ∙
Tax rate 𝑡𝑟 See Table 7 ∙ ∙ ∙
Annual
monitoring 𝛭𝑖
Land trust interview
ALUS coordinators interview
Richman and Loza 2011b ∙ ∙
Insurance insi
Land Trust Interview
Farmer Interview
Terrafirma 2016 ∙ ∙ ∙ ∙
Communications Comi Richman and Loza 2011b ∙ ∙
Enforcement Enfi Richman and Loza 2011b ∙
Recidivism R ALUS data ∙
Transaction
Costs (𝛼𝑖)
Appraisal 𝛼𝑖 Land Trust Interview ∙ ∙
Land Transfer Fees and Taxes 𝛼𝑖 Government of Ontario 2009;
Province of Alberta 2015 ∙ ∙
Negotiation Costs 𝛼𝑖 Land Trust Interview ∙ ∙ ∙
Nuisance
Costs
Pests N/A Farmer Interviews ∙ ∙
Wildlife damage N/A Farmer Interviews ∙ ∙
Weed removal N/A Farmer Interviews ∙ ∙
Extra Field Time N/A Farmer Interviews ∙ ∙
Opportunity
Costs Present value of land in crops N/A See Table 3 ∙ ∙ ∙
Present value of land in hay N/A See Table 3 ∙ ∙ ∙
Option Value of Land N/A Plantinga et al. 2002, MLS data ∙ ∙

ALBERTA INNOVATES – TECHNOLOGY FUTURES
PAGE 5
Table 2 Data for the farm budget model used to calculate farm profits and land value. All yields are in
bushels per acre and monetary values are CAD 2016.
Crop
Type County
Average Yield
(2004 – 2013)
Yield
Standard
Deviation
Crop Price Crop Costs
($ ac-1
)
Average
Profit
($ ac-1
)
Wheat Vermilion 45.51 bu ac-1
5.79 8.43 $ bu-1
201.36 182.29
Barley Vermilion 62.67 bu ac-1
7.27 6.17 $ bu-1
182.85 203.82
Canola Vermilion 36.01 bu ac-1
5.35 13.45 $ bu-1
256.98 227.36
Hay Vermilion 1.36 ton ac-1
0.36 231.54 $ ton-1
211.34 103.55
Winter
Wheat Norfolk 62.66 bu ac
-1 10.21 6.75 $ bu
-1 362.25 60.71
Grain
Corn Norfolk 145.07 bu ac
-1 17.48 6.19 $ bu
-1 514.25 383.73
Soybeans Norfolk 39.35 bu ac-1
5.55 14.39 $ bu-1
261.55 304.70
Hay Norfolk 2.46 ton ac-1
0.57 231.54 $ ton-1
316.69 252.90
Table 3 Average conversion costs (𝝎𝒊) in CAD 2016 dollars per acre for each project type (k) in Alberta.
Project Type Average Cost to
ALUS
Average Cost to
Farmer
Average Total
Project Cost
Total
Observations
Native Grassland 51.99 6.70 58.69 146
Shelterbelt/Trees 95.17 57.69 152.87 24
Wetland 55.34 55.34 110.68 238
Watering System 1409.67 1409.67 2819.33 3
Fencing 3.28 $ m-1 0 3.28 $ m-1 41
Table 4 Average conversion costs (𝝎𝒊) in CAD 2016 dollars per acre for each project type (k) in Ontario.
Project Type Average Cost
to ALUS
Average Cost
to Partner
Average Cost
to Farmer
Average
Total Project
Costs
Total
Observations
Native
Grassland 311.15 0.00 2.03 313.18 46
Forest/Trees 435.73 705.92 - 1141.65 71
Waterbody 10136.21 4964.81 1216.86 16317.87 24

ALBERTA INNOVATES – TECHNOLOGY FUTURES
PAGE 6
Conversion costs were derived from ALUS data, and are summarized in Tables 3 and 4.
Costs are separated based on the party that assumes them. In Alberta, costs for ALUS projects
are split between farmers and ALUS. In Ontario, costs are split between farmers, ALUS, and
other partner agencies that contribute to the projects. The data from Vermilion did not indicate
involvement of parties other than ALUS and the farmer, though there were examples in
Vermilion of farmers joining the ALUS program after having received funding through other
sources, though this was not captured in ALUS Vermilion’s data. Conversion costs were
assumed to be equivalent between all mechanisms, though ALUS does not hold any easements
or purchases. In the case of an OP, all conversion costs are assumed to be borne by the
organization, whereas in the case of a CE and an ALUS project, costs are split between the
farmer, partner organizations (in Ontario), and the CA.
2.3 CALCULATION OF MECHANISM COSTS
Consistent with Plantinga, Lubowski, and Stavins (2002), the estimated land value was
calculated from the present value of profit accrued from the land. As summarized in Equation 1,
profits (𝑃) from a plot of agricultural land (𝑖) are based on the price of the crops grown on that
land (𝑝𝑐), the crop yield (𝑦) for each year (𝑡), the costs associated with growing those crops (𝑥𝑐),
and the area of the plot (𝐴(𝑖)). In the case of a livestock farmer, 𝑝𝑐 is the price of hay which is a
proxy for the value of growing forage for livestock. The net present value of the profits (𝑃) is the
sum of the profits from each year discounted into the future (T) at the discount rate (𝑑).
𝑃(𝑖) = ∑(𝑝𝑐 ∙ 𝑦𝑡 − 𝑥𝑐) ∙ 𝐴(𝑖)
(1 + 𝑑)𝑡
𝑇
𝑡=0
(1)
Consistent with Plantinga et al. (2002), the option value is assumed to depend on the
population density of the area in question. Based on the population density and a survey of
values of undeveloped bare land in the provinces of Alberta and Ontario, the option value for
Vermilion River is assumed to be 0.01% of the agricultural land values, and the option value for

ALBERTA INNOVATES – TECHNOLOGY FUTURES
PAGE 7
Norfolk is assumed to be 10% of agricultural land values. The estimated market value of a plot
of agricultural land (𝑉(𝑖)) is given by Equation 2:
𝑉(𝑖) = 𝑃(𝑖) + 𝑂𝑖 (2)
All present values were calculated using a 30-year time horizon, and the discount rate
was 3.5% (OMB, 2015). Typically, an OP or CE could only be applied to a legal parcel of land,
the area of which far exceeds the average size of an ALUS project. Therefore all comparisons are
done on a project scale, assuming that the area of a CE or an OP is equivalent to the area of a
typical ALUS project. Certain fixed costs were adjusted to fit this assumption, explained in more
detail in the appropriate section.
Outright Purchase 2.3.1
An outright purchase is defined as a CA purchasing the deed to a piece of land and
managing that land for ES. In order to facilitate a cost comparison between a land purchase and
an ALUS project, the land area (Equation 1) was reduced to match the average areas of ALUS
projects. The cost to a CA (ca) for the outright purchase of a plot of land (𝑖) for ES procurement
(𝐶𝑖,𝑐𝑎𝑂𝑃 ) depended on the market value of the land (𝑉(𝑖)), the transaction costs (𝛼𝑖
𝑂𝑃), and the
management costs (𝑚𝑖𝑂𝑃). Management costs vary by project type (𝑘), summarized by Equation
3:
𝐶𝑖,𝑐𝑎𝑂𝑃 = 𝑉(𝑖) + 𝛼𝑖
𝑂𝑃 + 𝑚𝑖,𝑘𝑂𝑃 (3)
Transaction costs for outright purchase (𝛼𝑖𝑂𝑃
) are composed of three elements: the initial
appraisal of the land, the fees and taxes associated with purchasing the land, and the costs
associated with negotiating and preparing for the land transfer (Table 1). The negotiation cost
included the estimated effort to raise sufficient funds to purchase a property. The assumed values
and data sources are summarized in Table 5.
ALBERTA INNOVATES – TECHNOLOGY FUTURES
PAGE 8
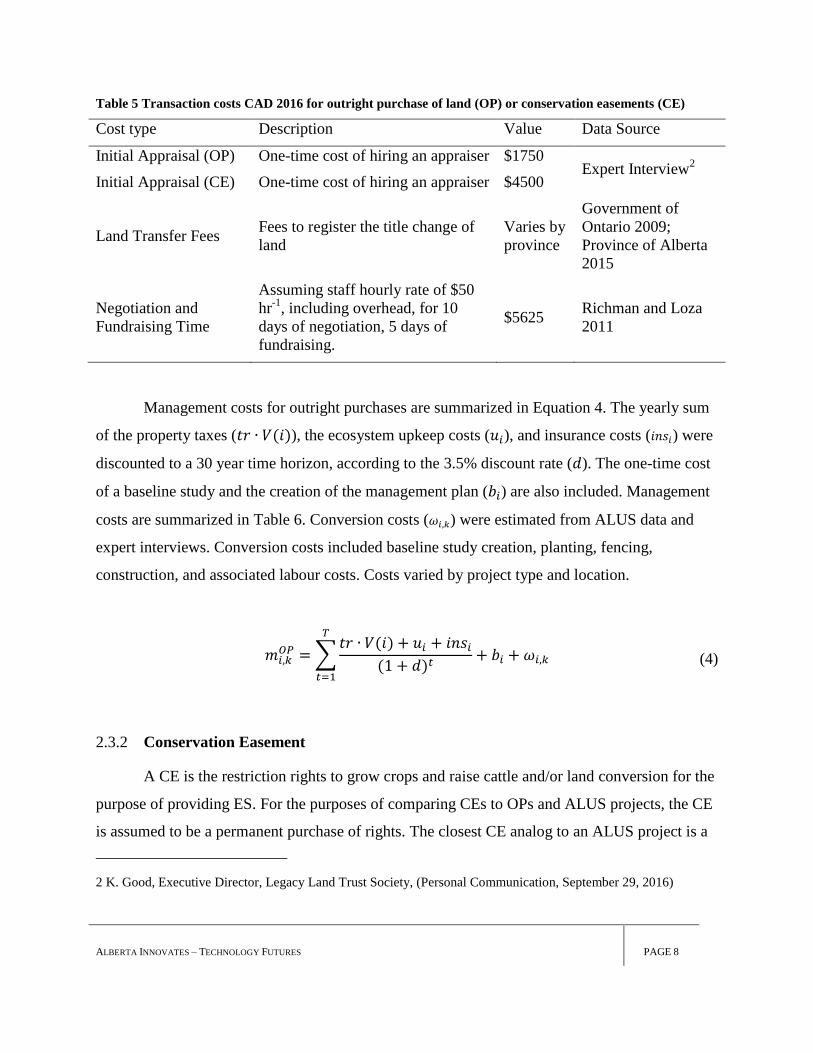
Table 5 Transaction costs CAD 2016 for outright purchase of land (OP) or conservation easements (CE)
Cost type Description Value Data Source
Initial Appraisal (OP) One-time cost of hiring an appraiser $1750 Expert Interview
2
Initial Appraisal (CE) One-time cost of hiring an appraiser $4500
Land Transfer Fees Fees to register the title change of
land
Varies by
province
Government of
Ontario 2009;
Province of Alberta
2015
Negotiation and
Fundraising Time
Assuming staff hourly rate of $50
hr-1
, including overhead, for 10
days of negotiation, 5 days of
fundraising.
$5625 Richman and Loza
2011
Management costs for outright purchases are summarized in Equation 4. The yearly sum
of the property taxes (𝑡𝑟 ∙ 𝑉(𝑖)), the ecosystem upkeep costs (𝑢𝑖), and insurance costs (𝑖𝑛𝑠𝑖) were
discounted to a 30 year time horizon, according to the 3.5% discount rate (𝑑). The one-time cost
of a baseline study and the creation of the management plan (𝑏𝑖) are also included. Management
costs are summarized in Table 6. Conversion costs (𝜔𝑖,𝑘) were estimated from ALUS data and
expert interviews. Conversion costs included baseline study creation, planting, fencing,
construction, and associated labour costs. Costs varied by project type and location.
𝑚𝑖,𝑘𝑂𝑃 = ∑
𝑡𝑟 ∙ 𝑉(𝑖) + 𝑢𝑖 + 𝑖𝑛𝑠𝑖
(1 + 𝑑)𝑡
𝑇
𝑡=1
+ 𝑏𝑖 + 𝜔𝑖,𝑘 (4)
Conservation Easement 2.3.2
A CE is the restriction rights to grow crops and raise cattle and/or land conversion for the
purpose of providing ES. For the purposes of comparing CEs to OPs and ALUS projects, the CE
is assumed to be a permanent purchase of rights. The closest CE analog to an ALUS project is a
2 K. Good, Executive Director, Legacy Land Trust Society, (Personal Communication, September 29, 2016)

ALBERTA INNOVATES – TECHNOLOGY FUTURES
PAGE 9
Table 6 Costs (CAD 2016) associated with the management of for outright purchase (OP) by a CA.
Cost type Description Value Data Source
Property
Taxes (𝑡𝑟) The tax paid on owned property.
Varies by
county
County of Norfolk
2016; County of
Vermilion River 2016
Upkeep
Costs (𝑢𝑖)
An amount set aside to steward the
ecosystem. Assume ½ day of staff time
each year, $20 per acre for supplies.
$200 Farmer Interviews
For fencing, add $0.33 m-1
year-1
. $0.33 m-1
y-1 Meyer and Olsen
2005
For forest projects, add $10 ac-1
y-1
every
three years after year 13. $10 ac
-1y
-1
Doran and Cubbage
2009
For grasslands, assume $300 y-1
for the
first three years (weed control) and
$11.94 ac-1
y-1
thereafter.
$300 y-1
, t<3;
$11.94 ac-1
y-
1,t>2
Farmer Interviews
Nykoluk 2013
Insurance
Costs (𝑖𝑛𝑠𝑖)
Assuming organization holds liability
insurance for land, and volunteer
insurance.
$150 Alliant Insurance
Services, 2010
Baseline
Study (𝑏𝑖)
A study to capture the baseline status of
the land. $4000 Expert Interview
1
“meets and bounds” easement, wherein the easement is applied to a full legal parcel and
stipulates that certain areas of that parcel are converted/managed to produce ES3. Based on
geospatial data for Vermilion County ALUS projects, there are on average six active ALUS
projects within each quarter-section of land (one quarter of a square mile). These projects occupy
an average of 27% of the area of the impacted quarter sections. For the purposes of comparing
easements to ALUS projects, it is assumed that six ALUS-type projects would be included in a
single meets and bounds easement. Therefore, with the exception of the acquisition, conversion,
and insurance costs, all easement costs were divided by six in the final calculations.
The cost of a single project within the CE to the CA (𝐶𝑖,𝑐𝑎𝐶𝐸 ) is shown in Equation 5:
3 K. Good, Executive Director, Legacy Land Trust Society, (Personal Communication, September 29, 2016)

ALBERTA INNOVATES – TECHNOLOGY FUTURES
PAGE 10
𝐶𝑖,𝑐𝑎𝐶𝐸 = 0.25 ∙ 𝑉(𝑖) + 𝛼𝑖
𝐶𝐸 + 𝑚𝑖,𝑘𝐶𝐸 (5)
Applying an easement to the land will reduce the land value, and the reduction in price is
the amount the CA pays to purchase the easement (A. J. Plantinga, 2007). The market price of
the land (𝑉(𝑖)) is assumed to be reduced by 25% as a result of the easement4. The CA
additionally incurs transaction costs (𝛼𝑖𝐶𝐸) and maintenance costs (𝑚𝑖
𝐶𝐸). CE transaction costs are
assumed to be equivalent to those summarized in Table 5. The initial appraisal for a CE is more
expensive than an appraisal for an OP, due to extra work the appraiser must do to find easements
upon which to base the value3. The cost of maintenance of the easement is given by Equation 6:
𝑚𝑖𝐶𝐸 = ∑
𝛭𝑖 + 𝐶𝑜𝑚𝑖 + 𝐸𝑛𝑓𝑖 + 𝑖𝑛𝑠𝑖
(1 + 𝑑)𝑡
𝑇
𝑡=1
+ 𝜔𝑖,𝑘 + 𝑏𝑖 (6)
Equation 6 includes the cost of monitoring (Μ𝑖), communication with farmers (𝐶𝑜𝑚𝑖),
enforcement of minor violations (𝐸𝑛𝑓𝑖), and insurance for major violations (𝑖𝑛𝑠𝑖). The initial
baseline study cost (𝑏𝑖) is also included. Other costs from Richman and Loza (2011b), such as
maintaining structures and signs, amending agreements, and agency overhead, are assumed to
not apply to the easement described in this study. The upkeep of the land itself remains the job of
the farmer and is therefore not a cost to the CA.
To account for six ALUS-type projects within a single CE, the costs associated with the
appraisal, baseline study, minor violation enforcement, monitoring, and communications are all
divided by six in the final calculations. The values cited in Table 7 reflect the costs to implement
an easement on a full parcel (such as a one-quarter mile section in Alberta) of land. All costs are
divided by six in the final calculation, with the exception of insurance costs which apply to the
specific projects within the parcel.
4 K. Good, Executive Director, Legacy Land Trust Society, (Personal Communication, September 29, 2016)

ALBERTA INNOVATES – TECHNOLOGY FUTURES
PAGE 11
Table 7 Costs associated with maintaining a conservation easement (Doscher et al., 2007; Richman & Loza,
2011a).
Cost type Description Value Data Source
Monitoring (Μ𝑖)
Site visits and remote monitoring,
assuming 7.5 hours of staff time at
$50 hr-1
.
$375 (Richman & Loza,
2011a)
Communication (𝐶𝑜𝑚𝑖)
Communications with the farmer,
assuming 1.7 hours of staff time
and $25.50 in material costs.
$110.50 (Richman & Loza,
2011a)
Enforcement of Minor
Violations (𝐸𝑛𝑓𝑖)
Correcting minor violations,
assuming 22.5 staff hours, with a
5% annual chance on each
easement.
$56.25 (Richman & Loza,
2011a)
Insurance (𝑖𝑛𝑠𝑖)
Insurance offered to CAs to
mitigate the risk of a litigated
dispute.
$60 Terrafirma 2016
Liability insurance $25 Expert Interview5
Initial baseline study and
management plan (𝑏𝑖)
The initial baseline study and
creation of a management plan3.
$4500 Expert Interview5
ALUS Program 2.3.3
The price of converting a plot of agricultural land to produce ES as part of the ALUS
program is calculated using Equation 7:
𝐶𝑖,𝑐𝑎𝐴 = 𝑌𝑖 + 𝑚𝑖,𝑘
𝐴 (7)
The cost (𝐶𝑖,𝑐𝑎𝐴 ) to ALUS is the sum of the present value of the annual payments (𝑌𝑖) and
the management costs of the project (𝑚𝑖,𝑘𝐴 ). The annual ALUS payment in Alberta is assumed to
be $50 per acre for wetlands, and $30 per acre for uplands, and in Ontario assumed to be $150
per acre. The maintenance costs are given by Equation 8:
5 K. Good, Executive Director, Legacy Land Trust Society, (Personal Communication, September 29, 2016)

ALBERTA INNOVATES – TECHNOLOGY FUTURES
PAGE 12
𝑚𝑖,𝑘𝐴 = ∑
𝛭𝑖
(1 + 𝑑)𝑡
𝑇
𝑡=1
+ 𝜔𝑖,𝑘 + ∑𝜔𝑖,𝑘 ∙ 0.07
(1 + 𝑑)𝑡
𝑇
𝑡=9,19,29
(8)
Equation 8 captures the costs of monitoring (Μ𝑖), the initial costs of establishing the
project (𝜔𝑖,𝑘), and the costs of recidivism. Monitoring costs and conversion costs were assumed
to be equivalent to the other two mechanisms, summarized in Tables 7, and 3 and 4, respectively.
ALUS projects do not incur a cost associated with a baseline study.
Recidivism is the withdrawal of projects from the ALUS program, which may occur
under increasing commodity prices (Hellerstein & Malcolm, 2011; Secchi & Babcock, 2007).
ALUS projects do not involve the legal transfer of ownership or rights to land, and so the
projects are more vulnerable to recidivism than OPs or CEs, which are considered permanent. In
the case of the ALUS program, when a project is withdrawn, the funding earmarked for that
project is re-directed to another area of land. The economic impact of a withdrawn project is the
costs ALUS incurs to establish a new project of equivalent type and size6. Table 8 summarizes
observed recidivism rates in the data from ALUS. The cost of recidivism is the net present value
of the percentage of the conversion costs (𝜔𝑖,𝑘) equivalent to the recidivism rate, applied every
ten years. Recidivism is assumed to continue unchanged for the duration of the study with
average recidivism of 7% and equal recidivism across project types.
Table 8 Recidivism rates in Vermilion and Norfolk counties from wetland, forest, and grassland projects.
Withdrawn projects may still be present on the landscape, removed projects have been destroyed.
County Total Projects Withdrawn Projects Removed
Projects
Recidivism
Rate
Vermilion 416 38 1 9%
Norfolk 195 9 1 5%
6 B. Gilvesy, Executive Director, ALUS Canada (Personal Communication, August 18, 2016)

ALBERTA INNOVATES – TECHNOLOGY FUTURES
PAGE 13
3 RESULTS
Projects were compared on the basis of their average size, which was taken from ALUS
data (Table 9). Project size distributions were skewed left; 71% of ALUS Vermilion’s projects
were less than 3 acres, and 90% of ALUS Norfolk’s projects were less than 3 acres. Higher
acreage projects were generally special projects that did not conform to the typical ALUS
payment rates.
Table 9 Average project sizes from ALUS project data. Shelterbelt projects were excluded from the Alberta
data.
Project Type County Average size (ac) Standard
Deviation Observations
Grassland Norfolk (ON) 3.73 6.48 46
Forest Patch Norfolk (ON) 1.57 1.68 71
Wetland
Construction Norfolk (ON) 0.43 0.36 24
Grassland Vermilion (AB) 15.49 31.99 146
Forest Patch Vermilion (AB) 16.97 - 1
Wetland
Rehabilitation Vermilion (AB) 1.66 3.56 238
Based on the project sizes in Table 9, the total project costs were compared between the
three mechanisms. Separate analyses were done for Ontario and Alberta, to account for different
crop prices, crop rotations, yields, and project costs (Tables 2, 3, and 4). Most farms in Norfolk
(52%) and Vermilion (73%) are classified as either producing cattle, or grains and oilseeds
(Statistics Canada, 2011c). Therefore, to capture the majority of farms in the analysis, project
costs were estimated for both crop-based and livestock-based farms. Projects selected for
comparison were those similar in nature between Norfolk and Vermilion: grasslands, forested
areas, and wetlands. Other projects such as water control structures, bird habitats, and pollinator
grass patches were not used in the analysis.
Interviews were conducted with farmers, ALUS staff, and a land trust expert to build the
comparison model and validate model assumptions. In addition, interviews with farmers
explored the motivation behind their participation in ALUS. Qualitative results indicate that the

ALBERTA INNOVATES – TECHNOLOGY FUTURES
PAGE 14
pre-existing environmental attitude of the farmers is an important motivator for participation in
ALUS. Most farmers were interested in quantifying both project costs and ecological returns,
and many had participated in other agri-environmental programs. Interview questions are
provided in Appendix 3.
Interviews revealed differences between projects in the two sites. In Vermillion, fencing
was an important cost. Fenced lowlands in the county of Vermilion will readily convert to
wetlands therefore excluding cattle from an area is the most cost effective way to rehabilitate
wetlands. In comparison, ALUS Norfolk wetland projects involve digging down to the water
table, and planting the area with aquatic plants. Because of the need for heavy equipment and
labour, the cost of wetland construction in Norfolk is much higher than wetland restoration in
Vermilion (Tables 3 and 4). Projects involving planting grasslands and forest patches also
showed higher costs in Norfolk. Interview results suggest that this is due to the higher use of
contract labour for Norfolk projects, while in Vermilion project establishment may be carried out
more frequently with volunteers7. Furthermore, Vermilion projects were typically undertaken on
cattle farms where fencing was already in place, reducing conversion costs. The results may have
also been impacted by differences in cost accounting procedures between ALUS Vermilion and
ALUS Norfolk7.
Results show that procurement using ALUS generally carried a lower project cost than a
CE or OP (Table 10, Figure 1)8. OP carried the highest cost due to high acquisition costs.
Maintenance costs were also high compared to other programs where these were at least partially
born by the farmer. CE costs were lower than OP costs. CEs had much lower acquisition costs,
and lower management costs. ALUS costs were generally lower than CEs due to a lower
management costs, an absence of transaction costs, and the acquisition costs being distributed
and discounted over time and not up-front. Since ALUS projects do not necessitate carrying
insurance, legal fees, or contract enforcement, stewardship costs consisted only of monitoring,
7 C. Whitelock, Program Coordinator, ALUS Norfolk, (Personal Communication, October 14, 2016); C. Elder,
ALUS Coordinator, County of Vermilion River, (Personal Communication, October 13, 2016)
8 A fully worked example calculation is provided in Appendix 4.

ALBERTA INNOVATES – TECHNOLOGY FUTURES
PAGE 15
and a cost for recidivism. Therefore, although ALUS projects had a recurring annual payment,
the overall costs the ALUS mechanism were usually the lowest (Table 10, Figure 1).
Table 10 Project costs under ALUS, CE and OP. Variance in costs results from the yield distribution which
impacts property values. Property values do not directly impact ALUS annual payments, therefore ALUS
costs do not have a variance.
Mechanism
ALUS CE OP
Project Type
Project
Size
(ac)
Farm
Type Mean
Standard
Deviation Mean
Standard
Deviation
Forest Patch
(Alberta) 16.97
Cattle 12,579 15,818 1,368 48,748 6,864
Crop 12,579 23,809 795 88,847 3,992
Forest Patch
(Ontario) 1.57
Cattle 6,366 8,264 220 12,821 926
Crop 6,366 8,285 163 12,908 688
Native
Grassland
(Alberta)
15.49
Cattle 10,848 14,322 1,169 45,707 5,864
Crop 10,848 22,051 822 84,498 4,124
Native
Grassland
(Ontario)
3.73
Cattle 13,029 11,687 634 25,822 2,676
Crop 13,029 11,685 254 25,814 1,069
Wetland
Construction
(Ontario)
0.43
Cattle 7,141 10,510 51 12,702 215
Crop 7,141 10,510 36 12,703 152
Wetland
Restoration
(Alberta)
1.66
Cattle 4,869 8,426 130 15,192 654
Crop 3,335 7,764 88 14,145 444
ALUS costs were higher than CE costs for native grassland projects in Ontario, for both
crop and cattle farms. Grasslands were the largest project type from Ontario (3.73 ac), so
although both conversion and stewardship costs were shown to be lower for ALUS than for the
CEs, the acquisition cost of ALUS was almost double that of the CE. Since the modeled profits
for cattle and crop farmers in Ontario were very close (Table 2), results for both farm types were
very similar. Other project types in Ontario had a smaller average size, which reduced
acquisition costs to the point that ALUS costs were lower than CE costs.
In Alberta total CE costs were higher than total ALUS costs. The annual payments ALUS
delivered to farmers in Alberta were lower than the annual payments in Ontario, allowing for

ALBERTA INNOVATES – TECHNOLOGY FUTURES
PAGE 16
lower acquisition costs. Conversion costs in Alberta were also lower. Unlike Ontario, Alberta’s
modeled land values were different between crop and cattle farms. The model created this
Figure 1 Average project costs (CAD 2016) under ALUS, CE, and OP. Error bars represent 95% confidence
intervals (N=20) based on yields, normally distributed through ten years of provincial average yields. ALUS
costs do not have a variance. Analyses captured show A) Alberta cattle farm, B) an Alberta crop farm
(canola, barley, wheat), C) an Ontario cattle farm, and D) an Ontario crop farm (corn, soybeans, wheat).
difference because the average yield of hay in Alberta is much lower than in Ontario, and
therefore profits from a single acre of grazing land are lower (Table 2). Since the property value
directly impacted the mechanisms costs, the results in Alberta showed lower costs on cattle
farms and higher costs on crop farms.
The results of the model were strongly impacted by project size. Figure 2 displays the
impact of project size on the cost of grassland projects under the three different mechanisms. For
grassland projects in Ontario, and on crop farms in Alberta, the marginal cost of each acre under

ALBERTA INNOVATES – TECHNOLOGY FUTURES
PAGE 17
a CE is less than the marginal cost of an acre in an ALUS project. Therefore, as project sizes
increase, initial savings on transaction and management costs are eclipsed by increased marginal
acquisition costs. For grassland projects on cattle farms in Alberta (Figure 2B), the ALUS annual
payment is low enough that the marginal costs of an acre in an ALUS project are lower than for a
CE.
Figure 2 The impact of project size on the predicted cost of grassland projects. Shaded areas represent 95%
confidence intervals based on stochastic yield. Conditions of analysis are A) an Alberta cattle farm, B) an
Alberta crop farm, C) an Ontario cattle farm, and D) an Ontario crop farm.
The time horizon used to compare the costs was also investigated. It was found that the
overall results did not change when the costs were projected to 50, 75, and 100-year horizons.
This result is not surprising given the substantial discount applied to future values.

ALBERTA INNOVATES – TECHNOLOGY FUTURES
PAGE 18
4 DISCUSSION
The three mechanisms examined though this study are not easily compared. They operate
at different scales, and have different goals. A purchase of land, for example, is most
advantageous when a large area of land must be closely managed by conservation professionals.
An easement, by comparison, is often used by land trusts to secure large tracts of pre-existing
natural areas, thus protecting that area from development9. ALUS is focused on converting
marginal pieces of agricultural land to a natural state in which they can be managed by the
farmer for ecosystem services alongside active agricultural operations10
. To enable comparison,
simplifying assumptions were applied (Appendix 1). In reality an OP and a CE cannot operate on
the same scale as an ALUS project. They must be applied to a legal parcel of land, and by
holding the project size constant between the three methods, the model under-estimates
acquisition costs of both purchases and easements. Therefore, costs calculated in this model, in
particular for CEs, are under-estimates for a per-acre comparison. The overall trends of the
comparison are the most important results, and the focus of this discussion.
Overall, the OP mechanism had the highest costs. Acquisition costs of purchasing lands
outright involve paying a sum equivalent to the entire land value, which alone exerts a strong
upward pressure on project costs. Management costs for OP were higher than for the other
mechanisms, because all establishment and upkeep done by farmers is transferred wholly to the
CA. For these reasons, OPs were found to be the most expensive mechanism. Purchasing land
has utility for protecting large areas of critical habitat that must be managed by conservation
professionals, and may not be the ideal tool to procure ES on a working farm.
CE costs were lower than costs associated with OPs, and generally higher than ALUS
costs. Though certain costs, such as land appraisals, are higher for conservation easements,
management and acquisition costs were lower. It was assumed based on expert interviews that
the price of an easement reflected 25% of the value of the land, meaning the acquisition cost of a
9 K. Good, Executive Director, Legacy Land Trust Society, (Personal Communication, September 29, 2016)
10 B. Gilvesy, Executive Director, ALUS Canada (Personal Communication, April 23, 2016); C. Elder., ALUS
Coordinator, County of Vermilion River, (Personal Communication, June 14, 2016)

ALBERTA INNOVATES – TECHNOLOGY FUTURES
PAGE 19
CE was lower than an OP. Furthermore, it was assumed that some establishment costs and all
upkeep costs remained with the farmer11
, meaning that CEs had a lower annual cost than OPs.
CEs in the model generally had a higher annual cost than ALUS projects due to extra costs of
insurance, communications, and other costs referenced in Table 1. CEs also bore transaction
costs, which did not apply to ALUS projects.
ALUS projects were generally found to have lower costs than the other two mechanisms.
ALUS projects and CEs were assumed to have identical conversion costs and monitoring costs,
so the difference between the two mechanisms originates from acquisition and stewardship costs.
Stewardship costs are higher for CEs than for ALUS projects, because CEs are required to carry
insurance and perform more extensive monitoring and enforcement. Instead of an upfront
acquisition cost, ALUS projects incur acquisition costs over time. The results show that even
with conservative estimates of CE costs, ALUS projects have lower costs in ten of the twelve
comparisons.
The size of the project strongly impacts the acquisition cost and the conversion cost. The
results suggest that CEs can become less costly than ALUS projects if the project size is
increased (Figure 2). Conversion costs are assumed to be equivalent between CEs and ALUS
projects, so the main impact of size is on the acquisition costs. CE acquisition costs are based on
25% of the cost of an acre, which means that under Ontario conditions, the model predicts that
for each marginal acre of land, the up-front acquisition cost to the CA is approximately $1,400
(an average annual profit of $249 per acre discounted to a 30-year time horizon). ALUS’s
marginal per-acre acquisition cost in Ontario is approximately $2,750. At larger project sizes, the
increased marginal acquisition costs outweigh the lower transaction and management fees. This
provides some insight into the ALUS business model: ALUS projects are small (over 90% of the
Ontario projects are less than 3 acres), and at this small size, they are highly cost efficient. In
contrast, CEs are more efficient with larger areas.
11 K. Good, Executive Director, Legacy Land Trust Society, (Personal Communication, September 29, 2016)

ALBERTA INNOVATES – TECHNOLOGY FUTURES
PAGE 20
An important limitation of the model was that all per-acre costs were assumed to be
independent of overall project size. Smaller projects typically have a higher per-acre cost, though
the model does not account for establishment or maintenance per-acre costs changing with
project size. Similarly, although project acquisition costs increase proportionately with the
project size, the per-acre cost is constant. In practice, the per-acre value of land decreases as the
parcel size increases. Since the project sizes considered were much smaller than most
agricultural land parcels, the per acre land value was assumed not to change as area was
increased.

ALBERTA INNOVATES – TECHNOLOGY FUTURES
PAGE 21
5 CONCLUSION
This study compares the costs of three different methods of ecosystem service
procurement. It was found that the cost of OPs was in each case higher than the costs of CEs and
ALUS projects. However the relative cost effectiveness between CE and ALUS depends on
project size. When applied at the average size of an ALUS project, CEs are more costly, though
the per-acre marginal costs of conservation easements are lower than those of an ALUS projects.
Conservation easements have economies of scale and cost effectiveness increases with project
sizes.
Wherever possible, this study attempted to be conservative in estimation of conservation
easement and purchase costs. Though some farmers accept payments below the ALUS baseline
rate, only baseline payment rates were used for ALUS costs. Even so, ALUS was less costly in
ten of the twelve comparisons. This suggests that the ALUS model can be a low-cost method for
procuring ecosystem services from small diffuse projects that are integrated into working farms.
ALUS can be applied in situations in which a purchase or an easement would be
impractical at a much lower cost. The ALUS program compliments the existing mechanisms by
enabling smaller, diffuse conservation projects to occur in areas where other mechanisms could
not operate. Despite using an annual payment system, by working with farmers on many small
projects the ALUS program enables low-cost ES procurement.

ALBERTA INNOVATES – TECHNOLOGY FUTURES
PAGE 22
6 REFERENCES
AARD. (2014). Agriculture Statistics Yearbook 2013. Edmonton, Alberta, Alberta: Alberta
Agriculture and Rural Development Information Management. Retrieved from
http://www1.agric.gov.ab.ca/$department/deptdocs.nsf/all/sdd15054/$file/2013-
yearbook.pdf?OpenElement
Bank of Canada. (2016). Inflation Calculator. Retrieved August 15, 2016, from
http://www.bankofcanada.ca/rates/related/inflation-calculator/
Boxall, P., Weber, M., Perger, O., Cutlac, M., & Samarawickrema, A. (2008). Results from the
Farm Behaviour Component of the Integrated Economic-Hydrologic Model for the
Watershed Evaluation of Beneficial Management Practices Program.
County of Norfolk. (2016). 2016 Final Tax Rates. Retrieved October 14, 2016, from
http://www.norfolkcounty.ca/download/government/propertytaxes/Tax-Rates-2016.pdf
County of Vermilion River. (2016). Understanding Your Taxes. Retrieved July 12, 2016, from
http://vermilion-river.com/departments/assessment_taxation/mill_rates.html
Doran, F. S., & Cubbage, F. W. (2009). Tree Crops for Marginal Farmland: Loblolly Pine.
Publication 446-604, Norris, TN: Virginia Cooperative Extension.
Doscher, P., Lind, B., Sturgis, E., & West, C. (2007). Determining Stewardship Costs and
Raising and Managing Dedicated Funds. Washington, DC: Land Trust Alliance.
Government of Ontario. (2009). Calculating Land Transfer Tax. Tax Bulletin LTT 2-2005,
Toronto: Government of Ontario. Retrieved from
http://www.fin.gov.on.ca/en/bulletins/ltt/2_2005.html
Hellerstein, D., & Malcolm, S. (2011). The Impact of Rising Corn Prices on the Conservation
Reserve Program: An Empirical Model (Vol. ERR-110).
Kosinski, S. (2012). The Value of Alberta’s Forage Industry A Multi-Level Analysis The Value
of Alberta’s Forage Industry, 48.
MAFRD. (2015). Crop Production Costs 2015. Winnipeg, Manitoba.
MAFRD. (2016). Hay Production Costs 2015 in Manitoba. Winnipeg, Manitoba.
Main, M. B., Roka, F. M., & Noss, R. F. (1999). Evaluating costs of conservation. Conservation
Biology, 13(6), 1262–1272. http://doi.org/10.1046/j.1523-1739.1999.98006.x
Merenlender, A. M., Huntsinger, L., Guthey, G., & Fairfax, S. K. (2004). Land Trust and
Concervation Easements: Who is Conservation What for Whom? Conservation Biology,
18(1), 65–75. http://doi.org/10.1111/j.1523-1739.2004.00401.x
Meyer, R., & Olsen, T. (2005). Estimated costs for livestock fencing. Iowa State University, Ag
Decision Maker. File …, (February), 1–4. Retrieved from
http://www.agrireseau.qc.ca/bovinsboucherie/documents/b1-75.pdf
Naidoo, R., Balmford, A., Ferraro, P. J., Polasky, S., Ricketts, T. H., & Rouget, M. (2006).
Integrating economic costs into conservation planning. Trends in Ecology and Evolution,

ALBERTA INNOVATES – TECHNOLOGY FUTURES
PAGE 23
21(12), 681–687. http://doi.org/10.1016/j.tree.2006.10.003
Nykoluk, C. (2013). What are Native Prairie Grasslands Worth? Retrieved from
http://www.pcap-sk.org/rsu_docs/documents/Native_Grassland_EGS_RSA-sm.pdf
OMAFRA. (2016). 2016 Field Crop Budgets, Publication 60. Guelph, ON.
OMB. (2015). 2016 Discount Rates for OMB Circular No.A-94. Washington, DC. Retrieved
from https://www.whitehouse.gov/omb/circulars_a094/a94_appx-c
Parker, D. P. (2004). Land trusts and the choice to conserve land with full ownership or
conservation easements. Natural Resources Journal, 44, 483–518. Retrieved from
http://lawlibrary.unm.edu/nrj/44/2/08_parker_trusts.pdf
Plantinga, A. J. (2007). The Economics of Conservation Easements. In G. Ingram & Y. H. Hong
(Eds.), Land Policies and their Outcomes, Proceedings of the 2006 Land Policy Conference
(pp. 90–125). Lincoln Institute of Land Policy.
Plantinga, A., Lubowski, R., & Stavins, R. (2002). The effects of potential land development on
agricultural land prices. Journal of Urban Economics. Retrieved from
http://www.sciencedirect.com/science/article/pii/S009411900200503X
Province of Alberta. Land Titles Act Tariff of Fees Regulation (2015). Canada.
Richman, E., & Loza, A. (2011a). Costs of Conservation. Retrieved from
http://conservationtools.org/guides/86-costs-of-conservation-easement-stewardship
Richman, E., & Loza, A. (2011b). Stewardship Costs Calculator. Excel Spreadsheet,
Pennsylvania Land Trust Association. Retrieved from
http://conservationtools.org/library_items/222
Secchi, S., & Babcock, B. A. (2007). Impact of high crop prices on environmental quality: A
case of Iowa and the Conservation Reserve Program. Center for Agricultural and Rural
Development, Iowa State University, (May), 20.
Silver, T., Attridge, I., MacRae, M., & Cox, K. (1995). Canadian legislation for conservation
covenants easements and servitudes. Ottawa.
Statistics Canada. (n.d.). Field Crop Reporting Series. Retrieved August 15, 2016, from
http://www23.statcan.gc.ca/imdb/p2SV.pl?Function=getSurvey&SDDS=3401
Statistics Canada. (2011a). A Census subdivision of Norfolk County, CY - Ontario. Retrieved
October 17, 2016, from https://www12.statcan.gc.ca/census-recensement/2011/as-sa/fogs-
spg/Facts-csd-eng.cfm?LANG=Eng&GK=CSD&GC=3528052
Statistics Canada. (2011b). A Census subdivision of Vermilion River County, MD - Alberta.
Retrieved October 17, 2016, from https://www12.statcan.gc.ca/census-
recensement/2011/as-sa/fogs-spg/Facts-csd-
eng.cfm?LANG=Eng&GK=CSD&GC=4810036
Statistics Canada. (2011c). Census of Agriculture, farms classified by the North American
Industry Classification System (NAICS), every 5 years (number), 2011 (table). Retrieved
October 17, 2016, from

ALBERTA INNOVATES – TECHNOLOGY FUTURES
PAGE 24
http://www5.statcan.gc.ca/cansim/a26?lang=eng&retrLang=eng&id=0040200&pattern=004
-0200..004-0242&tabMode=dataTable&srchLan=-1&p1=-1&p2=31
Statistics Canada. (2011d). Census of Agriculture, farms classified by total farm area, every 5
years (number), 2011 (Table). Retrieved October 14, 2016, from
http://www5.statcan.gc.ca/cansim/a03?lang=eng&pattern=004-0200..004-0242&p2=31
Statistics Canada. (2011e). Census of Agriculture, farms classified by total gross farm receipts in
the year prior to the census, every 5 years (number of farms reporting), 2011. Retrieved
October 14, 2016, from
http://www5.statcan.gc.ca/cansim/a26?lang=eng&retrLang=eng&id=0040233&pattern=004
-0200..004-0242&tabMode=dataTable&srchLan=-1&p1=-1&p2=31
Statistics Canada. (2011f). Census of Agriculture, hay and field crops, every 5 years, 2011.
Retrieved October 14, 2016, from
http://www5.statcan.gc.ca/cansim/a26?lang=eng&retrLang=eng&id=0040213&pattern=004
-0200..004-0242&tabMode=dataTable&srchLan=-1&p1=-1&p2=31
Statistics Canada. (2011g). Census of Agriculture, land use, every 5 years, 2011. Retrieved
October 14, 2016, from
http://www5.statcan.gc.ca/cansim/a26?lang=eng&retrLang=eng&id=0040203&pattern=004
-0200..004-0242&tabMode=dataTable&srchLan=-1&p1=-1&p2=31
Terrafirma. (2016). Costs and Discounts. Retrieved October 14, 2016, from
http://www.terrafirma.org/faq/costs
ALBERTA INNOVATES – TECHNOLOGY FUTURES
PAGE 25
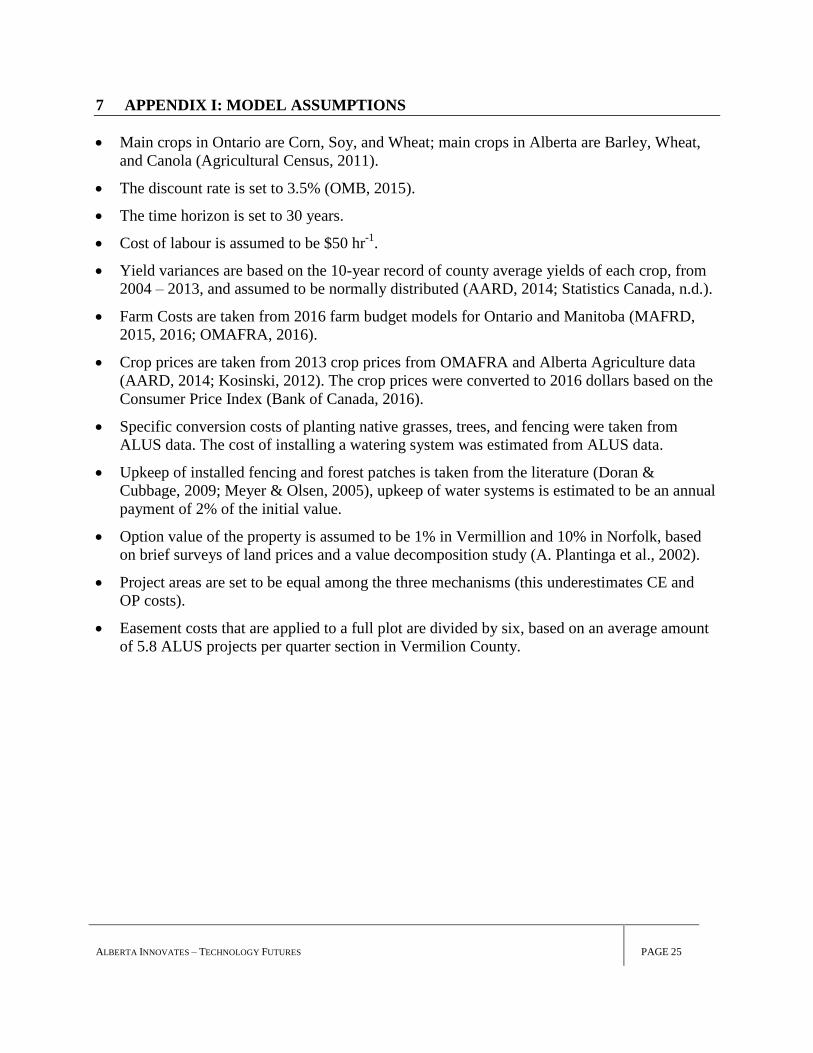
7 APPENDIX I: MODEL ASSUMPTIONS
Main crops in Ontario are Corn, Soy, and Wheat; main crops in Alberta are Barley, Wheat,
and Canola (Agricultural Census, 2011).
The discount rate is set to 3.5% (OMB, 2015).
The time horizon is set to 30 years.
Cost of labour is assumed to be $50 hr-1
.
Yield variances are based on the 10-year record of county average yields of each crop, from
2004 – 2013, and assumed to be normally distributed (AARD, 2014; Statistics Canada, n.d.).
Farm Costs are taken from 2016 farm budget models for Ontario and Manitoba (MAFRD,
2015, 2016; OMAFRA, 2016).
Crop prices are taken from 2013 crop prices from OMAFRA and Alberta Agriculture data
(AARD, 2014; Kosinski, 2012). The crop prices were converted to 2016 dollars based on the
Consumer Price Index (Bank of Canada, 2016).
Specific conversion costs of planting native grasses, trees, and fencing were taken from
ALUS data. The cost of installing a watering system was estimated from ALUS data.
Upkeep of installed fencing and forest patches is taken from the literature (Doran &
Cubbage, 2009; Meyer & Olsen, 2005), upkeep of water systems is estimated to be an annual
payment of 2% of the initial value.
Option value of the property is assumed to be 1% in Vermillion and 10% in Norfolk, based
on brief surveys of land prices and a value decomposition study (A. Plantinga et al., 2002).
Project areas are set to be equal among the three mechanisms (this underestimates CE and
OP costs).
Easement costs that are applied to a full plot are divided by six, based on an average amount
of 5.8 ALUS projects per quarter section in Vermilion County.

ALBERTA INNOVATES – TECHNOLOGY FUTURES
PAGE 26
8 APPENDIX II: THEORETICAL COST BENEFIT FRAMEWORK
ES
Procurement
Method
Converted Land
Cover
Benefits to Farmer Costs to Farmer Benefits to
Organization
Cost to Organization
Outright
Purchase
All
Productive value of the
land
Option value of land
Ownership
Inheritance for
future generations
Future flexibility
Permanence Productive value of the
land
Option value of the
land
Conversion costs
Taxes
Insurance
Maintenance
Administrative costs of
land transfer
Organizational
overhead
Conservation
Easement
All
Productive value of land
Possible use of land for
forage
Aesthetics?
Stewardship value?
Decrease in land
value
Annual Upkeep
Taxes
Insurance
Flexibility
Control
Nuisance
Permanence Productive value of the
land (potentially minus
forage value)
Negotiation costs (time)
Organizational
overhead
Monitoring
Enforcement (potential
legal action)
Riparian
Buffers
Conversion costs:
Fencing cost
Planting costs
Wetlands Conversion costs:
Waterer cost

ALBERTA INNOVATES – TECHNOLOGY FUTURES
PAGE 27
Fencing cost
Shelter Trees,
Native
Grasslands,
Pollinator
Habitats
Planting costs
ALUS
Program
All
ALUS payment income
(NPV)
½ conversion costs
Use of land for forage
Flexibility
Control
Aesthetics?
Stewardship value?
Value of optimal use
of land
Annual Upkeep
Taxes
Insurance
Nuisance
Annual payments
½ conversion costs
Negotiation costs (time)
Organizational
overhead
Monitoring
Riparian
Buffers
½ Conversion costs:
Fencing cost
Planting costs
½ Conversion costs:
Fencing cost
Planting costs
Wetlands
½ Conversion costs:
Waterer cost
Fencing cost
½ Conversion costs:
Waterer cost
Fencing cost
Shelter Trees,
Native
Grasslands,
Pollinator
Habitats
½ Conversion costs:
Planting costs
½ Conversion costs:
Planting costs

ALBERTA INNOVATES – TECHNOLOGY FUTURES
PAGE 28
9 APPENDIX III: INTERVIEW QUESTIONS
9.1 LAND TRUST INTERVIEW
1. What mechanisms are typically used to convert land from agriculture (or other uses) to
natural land for the purpose of ecosystem services procurement?
2. What are the pros and cons of a conservation easement versus a purchase?
3. Are easements used for purposes other than land conversion? What about BMPs?
4. What is the cost difference between a purchase of land and an easement on the land?
5. Do you need a real estate agent if you are a land trust purchasing an easement or a piece
of land? If so, can you estimate their fees?
6. How much do you pay in legal fees when purchasing land or an easement?
7. How long does it take to negotiate a typical conservation easement?
8. Do you allow the farmer to use the easement area? How would that impact the cost?
9. Do you lease land?
10. Does the price of a conservation easement include the conversion costs of the land?
11. How much would you estimate it costs to monitor a project every year?
12. Do you have trouble with compliance to conservation easement rules, and if so, at what
frequency? What remedial actions are necessary when the agreement is violated?
13. Under what circumstances are conservation easements terminated?
14. Are you required to carry any insurance on the lands or easements owned by the land
trust?
9.2 FARMER INTERVIEW
1. What motivated you to participate in the ALUS program?
a. Why specifically did you choose ALUS?
b. Are you interested in quantifiable ecological results from your work with ALUS?
c. If so, which ones? For example, air quality, water quality, carbon sequestration,
presence of wildlife, or others.
d. Do you participate or have you participated in other conservation programs?
2. What sort of management practices are you doing with the ALUS program?
a. Is there anything you would like to do, but are not doing yet?
b. Have you experienced any nuisance factors from your activities? For example,
animal predation, extensive time investment, spreading of weeds, or other
inconveniences.
c. Are you using conservation tillage, or other best management practices?
3. Can you tell us a bit about your farm?
a. What is the approximate size?
b. Approximately how many fields and pastures does it have?

ALBERTA INNOVATES – TECHNOLOGY FUTURES
PAGE 29
c. Approximately how much of your revenue comes from crops versus cattle? Do
you harvest other products as part of farm revenue?
d. What crop rotation do you typically use?
4. What kind of projects are you doing with ALUS right now?
a. Could you describe the changes to your farm that ALUS has facilitated?
b. Have you planted trees, created grasslands, or protected water bodies with ALUS?
c. Approximately how much land is involved in ALUS projects?
5. Roughly how much does it cost to maintain:
a. Fencing?
b. A solar watering system?
6. Can you estimate the cost of:
a. Installing a km of fencing?
b. Planting an acre of trees? Of native grass?
c. Installing a solar watering system?
7. Can you estimate the costs of:
a. Any pests, like gophers, that have occurred as a result of ALUS?
b. Any wildlife damage, such as herbivory, that have occurred as a result of ALUS?
c. Weed removal needed to maintain the ALUS project?
d. Extra plowing, seeding, and harvesting time due to needing to avoid the inactive
land?
8. Are you required to carry any insurance on the land you own?
9. What market conditions would motivate you to convert project land from ALUS to
another use (crops, hay, etc.)?
10. What value do you derive from managing the land yourself, as opposed to having to
conform to strict guidelines, or even relinquishing management entirely to a land trust?
9.3 ALUS COORDINATOR INTERVIEW
1. How much time would you estimate you spend monitoring a project each year?
2. How much time would you estimate you spend setting up a project?
3. Can you estimate your hourly rate of pay?

ALBERTA INNOVATES – TECHNOLOGY FUTURES
PAGE 30
10 APPENDIX IV: SAMPLE CALCULATION
This calculation assumes that a cattle farmer from Alberta has decided to allow a 4.4 ac riparian buffer to be put on their land. The
following calculations (Table 5) will demonstrate how the cost model derives costs from the input data and assumptions. The time
horizon is 30 years, the discount rate is 3.5%.
Table 11 Cost calculation examples
Variable Description Calculation
𝑃𝑖
The present value of a plot of land for a
cattle farmer is assumed to have an
average yearly profit of $106.14/ac, based
on the price of Hay in 2013 converted to
2016 dollars and a yield between 1-2
tonnes/ac.
𝑃𝑖𝑂𝑃 = ∑
$106.14 𝑎𝑐−1 ∙ 4.4 𝑎𝑐
(1 + 0.035)𝑡
29
𝑡=0
= $9,246.45
𝑃𝑖𝐶𝐸 = 𝑃𝑖
𝑂𝑃 ∙ 0.25 = $2,311.61
𝑂𝑖 The option value is assumed to be 1% of
the productive value of the land in
Alberta.
$9246.45 ∙ 0.01 = $92.47
𝜔𝑖,𝑘
A riparian project is assumed to have a
1126m perimeter, fencing is assumed to
cost $3.28/m (1.23/m for ALUS and CE),
planting is assumed to cost $152.87/ac
($95.17 for ALUS and CE), and the water
system is assumed to cost $2,819.33 to
install ($1409.67 for ALUS and CE).
There is also a cost to do a baseline study
and management plan ($750).
𝜔𝑖𝑂𝑃 = (1126𝑚 ∙ $3.28 𝑚−1) + ($152.87 𝑎𝑐−1 ∙ 4.4𝑎𝑐) + $2,819.33 + $750 = $7,935.24
𝜔𝑖𝐶𝐸 = (1126𝑚 ∙ $1.23 𝑚−1) + ($95.17 𝑎𝑐−1 ∙ 4.4𝑎𝑐) + $1409.67 + $750 = $3,963.39
𝜔𝑖𝐴𝐿𝑈𝑆 = (1126𝑚 ∙ $1.23 𝑚−1) + ($95.17 𝑎𝑐−1 ∙ 4.4𝑎𝑐) + $1409.67 = $3,213.40
𝛼𝑖 Transaction costs include an appraisal fee
($750 for an easement, 291.6 for a
purchase), a land transfer fee (in Alberta,
𝛼𝑖𝐶𝐸 = $750 + $50 + $875 + 6.71 = $1,681.71
𝛼𝑖𝑂𝑃 = $291.6 + $50 + $875 + 6.71 = $1,223.31

ALBERTA INNOVATES – TECHNOLOGY FUTURES
PAGE 31
$50 tariff, plus $1 for each $5000 of land
value), negotiation and fundraising costs
($875), and title insurance (0.1% of the
market value).
𝑚𝑖𝑂𝑃
The annual tax rate in Vermilion County
is 1.4%. Annual maintenance costs for
fencing is assumed to be $0.33/m. Annual
maintenance for the water system is
assumed to be 5% of its installation cost.
Liability insurance is assumed to cost $25.
∑($9246.45 + $92.47) ∙ 0.014 + 1126𝑚 ∙ $0.33𝑚−1 + $2819.33 ∙ 0.05 + 25
(1 + 0.035)𝑡
29
𝑡=1
= $11,645.53
𝑚𝑖𝐶𝐸
The maintenance cost for a conservation
easement is the sum of the monitoring
costs ($62.50), communications ($18.42),
enforcement ($9.38), liability insurance
($25), and conservation insurance ($60).
∑$62.50 + $18.42 + $9.38 + $25 + $60
(1 + 0.035)𝑡
29
𝑡=1
= $3,224.13
𝑚𝑖𝐴
The maintenance cost for ALUS is the
discounted sum of the annual monitoring
costs ($62.50), and the recidivism cost,
which is a cost equal to 7.25% of
𝜔𝑖𝐴𝐿𝑈𝑆every 10 years.
∑$62.50
(1 + 0.035)𝑡
29
𝑡=1
+ ∑$3,213.40 ∙ 0.0725
(1 + 0.035)𝑡
29
𝑡=9,19,29
= $1,454.36
𝑌𝑖 The ALUS annual payment rate is $50/ ac
for a wetland or riparian area. Recidivism
rate is 7% every 10 years.
∑$50/𝑎𝑐 ∙ 4.4𝑎𝑐
(1 + 0.035)𝑡
29
𝑡=0
+ ∑3,213.40 ∙ 0.07
(1 + 0.035)𝑡
29
𝑡=9,19,29
= $4,398.90
𝐶𝑖,𝑐𝑎𝑂𝑃 = $9,338.92 + $1,223.31 + $7,935.24 + $11,645.53 = $30,143.00
𝐶𝑖,𝑐𝑎𝐶𝐸 = $2,334.73 + $1,681.71 + $3,963.39 + $3,224.13 = $11,203.96
𝐶𝑖,𝑐𝑎𝐴 = $4,398.90 + $3,213.40 + $1,454.36 = $9,066.66