a correlation analysis of the noel-levitz instrument and ... · collected student satisfaction data...
TRANSCRIPT

A Correlation Analysis of the Noel-Levitz Instrument and Student Program
Retention Data at Chippewa Valley Technical College
Margo Keys
A Research Paper Submitted in Partial Fulfillment of the
Requirements for the Education Specialist Degree With a Major in
Career and Technical Education
Approved>6 Semester Credits
/
Dr. Howard Lee, Chair
' ~ r . Cynthia Gilberts
Dr. Katherine Lui
The Graduate School
University of Wisconsin-Stout
December, 2006

Table of Contents ....................................................................................................................................................Pa ge
................................................................................................................................... List of Tables i
. . ABSTRACT .................................................................................................................................... 11
Chapter I: Introduction; .................................................................................................................. 1
............................................................................................................. Background of the Study 1
Statement of the Problem: ........................................................................................................... 5
Purpose ofthe Study ................................................................................................................... 5
Objectives of the Study ................................................................................................................ 5
...................................................................................................... Assumptions and Limitations 6
Significance of the Study ............................................................................................................. 7
Definition of Terms ..................................................................................................................... 7
Chapter 11: Review of Literature .................................................................................................... 9
Summary ................................................................................................................................... 18
.......................................................................................... Chapter 111: Methods and Procedures 19
........................................................................................................................ Method of Study 19
....................................................................................................................... Sample Selection 19
Instrumentation ......................................................................................................................... 20
Procedures Followed ................................................................................................................ 22
Method of Analysis .................................................................................................................... 22
Chapter IV: Results and Discussion ............................................................................................ 24
Research Objective 1 ................................................................................................................ 25
Research Objective 2 ................................................................................................................ 26
Research Objective 3 ................................................................................................................ 28

........................................................ Chapter V: Summary. Conclusions and Recommendations 3 1
Summary ................................................................................................................................... 31
Conclusions ............................................................................................................................... 32
Recommendations Related to This Study .................................................................................. 33
........................................................................................ Recommendations for Further Study 34
References ..................................................................................................................................... 35
Appendix A: Binary Logistic Regresssion. Gap Scores for Retention ........................................ 39
Appendix B: Regression of SSI Gap Score on "Months Out" ..................................................... 45
Appendix C: SSI items predictability on Student Retention ....................................................... 53

List of Tables
......................................................... Table 1 : Constant variable related to satisfaction variable 15
Table 2: Binary Logistic Regression on Gap Scores for Retention (yes/no) ............................... 26
............................................................. Table 3: Regression of SSI Gap Score on "Months Out" 27
Table 4: Intermittent correlation matrix on SSI ............................................................................ 29

The Graduate School University of Wisconsin - Stout
Menomonie, WI
Author: Margo Keys
Title: A Correlation Analysis of the Noel-Levitz Instrument and Student Retention
Data at Chippewa Valley Technical College
Graduate Degreemajor: Ed.S. Career and Technical Education
Research Advisory: Howard Lee Ph.D.
MonthNear: December 2006
Number of Pages: 79
Style Manual Used: American Psychological Association, 5th edition
ABSTRACT
The purpose of this study was to analyze the relationship between student satisfaction and
program retention or graduation at Chippewa Valley Technical College. Using program data
from 2003, the study investigated three central objectives: (1) the inter-correlations between
survey items on Noel-Levitz Student Satisfaction Inventory (SSI) and student program retention
data at Chippewa Valley Technical College. (2) To investigate the correlation between student
dissatisfaction as expressed by a large gap score and tenure in student program of study and (3)
To determine if items within the Noel-Levitz instrument, or clusters of items within the
instrument, are predictive of student program retention. Considering the overall results of all
three research objectives, the Noel-Levitz Student Satisfaction Inventory could not be locally
validated through this study at Chippewa Valley Technical College.
Chapter I: Introduction
Background of the Study
For over 70 years, scholars and practitioners have studied why students leave higher
education and over the last 25 years, the works of Tinto, (1 975; 1987; 1993) and Braxton,
Sullivan, and Johnson (1997) has unraveled the complexity of the retention mystery. With
approximately 45 percent of students enrolled in two-year colleges departing during their first
year (American College Testing Program, 2001), administrators still struggle to understand their
college attrition rate and seek to provide the services that may lower that rate. The U.S.
Department of Education reports the expenditures in public 2-year institutions in 2002-03 was
34.9 billion dollars. This figure is projected to rise to 50.0 billion by 2013-14. As expenditures
rise, the pressure of increased accountability for academic institutions to retain their students is
expected to follow. In an attempt to proactively approach this problem, some academic
institutions are focusing their efforts to improve student retention by adding student services as
reported in the 2004 Summary Report from the Community College Survey of Student
Engagement (2004). The report highlights results from Sinclair Community College in Ohio,
who claims to have increased their student retention rates after better marketing of their learning
support and financial aid services (CCSSE, 2004). The report cites another example of Florida's
Valencia Community College, which has developed the LifeMap program that provides
developmental advising to support student planning and aims to strengthen self confidence and
decision making skills for students (CCSSE, 2004).
Other institutions seek expertise through consultants who provide assessments and
research capabilities that many smaller colleges do not have. One such company is Noel-Levitz,

Inc., a firm with 30-years of experience in enrollment management, recruitment, and student
retention. Their current client base includes over 1700 colleges and universities throughout North
America who use their services to examine student satisfaction. Clearly there is money to be
made as colleges and universities continue to grapple to turn their retention headaches into
student success stories. Levitz and Noel indicates that retention is an institutional performance
indicator or a measure of how effectively campuses deliver what students expect, need and want.
So how does student satisfaction relate to student persistence? While the subject of student
retention is as complicated as the students served, understanding the interrelations between
student retention and student satisfaction is valuable information for institutions. The Noel-
Levitz website provides tools to help organizations sort through student perspective on key
issues, such as retention consulting and satisfaction inventories (http://www.noellevitz.com).
While completing a series of questions, students place a value of importance and a level of
satisfaction on items and through careful analysis, academic institutions can begin to understand
their student's perceptions related to college life. With these results, college staff can identify
opportunities for improvement in an attempt to improve student satisfaction
(http:Nwww.noellevitz.com).
The body of knowledge related to student retention is vast, however, there is still much
to learn about why some students abandon their stated goals while other students persevere to
reach their academic goals. In this age of diminished funding, student retention draws even more
attention as institutions are challenged to keep their students enrolled. Some research examples
indicate colleges have found their answers to their retention issues, but the answers from students
in Wisconsin's Chippewa Valley region has yet to be discovered.

Chippewa Valley Technical College is one of those colleges focused on improving their
student retention rates (CVTC, 2005). Chippewa Valley Technical College (CVTC), part of the
Wisconsin Technical College System, is located in west-central Wisconsin, serving an eleven-
county area. Student enrollments exceed 6,000 credit students per year drawing students from a
variety of social and economic backgrounds. CVTC student profile consists of approximately 50
percent students whom are 23 years of age or under and a total student population age range
from 16 to 64. Approximately 66 percent of CVTC students work part-time, or not at all. Many
students, whom do work full-time, take classes on a part-time basis. Other reasons for enrolling
as a part-time student include family responsibilities andlor the desire to go at a slower pace.
Approximately 60 percent of full-time, first-time degree-seeking students receive financial aid
(CVTC 2006). Considering those demographics, many CVTC students may have life
circumstances that potentially jeopardize their ability to remain in college.
As a college, CVTC first began to formally assess the issue of student retention in 1994.
This initial investigation sparked several institutional projects to improve student retention rates,
including adoption of the Noel-Levitz Student Satisfaction Inventory (SSI), improvements in the
student orientation program and an institutional campaign to build awareness on the issues
related to student retention. Over the years, those efforts have persisted; however, no formal
program existed to manage and coordinate the efforts college-wide or steer ongoing evaluation
of the outcomes. CVTC Leadership is well aware of this void and has identified this initiative as
a quality improvement project through their accreditation process (CVTC, 2005).
Chippewa Valley Technical College is accredited by the Commission on Institutions of
Higher Education, North Central Association of Colleges and Schools. Within the parameters of
this accreditation, CVTC participates in ongoing quality monitoring through the Accreditation

Quality Improvement Program (AQIP) which directs institutions to identify quality improvement
projects for each academic year. This student retention initiative has been selected as one of
three projects CVTC will focus on for the coming year. Progress and outcomes of this project
will be incorporated into the CVTC AQIP 2006 Progress Report.
Currently, CVTC's student retention rate averages approximately 45 percent college-
wide based on program graduation rates according to Phil Palser, CVTCs
Curriculum~Assessment Specialist and Student Retention Steering committee member (personal
communication, April 5,2006). From an external perspective, CVTC's retention rate is higher
than other regional institutions as noted on data captured through the Integrated Postsecondary
Education Data Systems (IPEDs) reports (IPEDS, 2005). The IPEDs data is collected and
managed by the National Center of Education Statistics and reported annual to postsecondary
member institutions. In this report, CVTC was compared to other public, 2-year, degree-granting
colleges in the Great Lakes region of the country. CVTC's 58 percent retention rate was
considerably higher than peers in this region who averaged 34 percent (IPEDS, 2005). While
CVTC's college-wide student retention rate is favorable, one wonders if there is a correlation
between retention and satisfaction. If students remain satisfied, does the chance of retention
increase?
CVTC has collected student satisfaction data using the Noel -Levitz, Student Satisfaction
Inventory (SSI) for the past 10 years. Periodic assessments throughout this ten year period have
provided insight as to student's opinions related to over 100 data elements specific to
instructional effectiveness, counseling and advising, registration effectiveness, etcetera.
According to Joe Hegge, CVTCs Vice President of Education (personal communication, January

5,2006) this data provides insight to student satisfaction and is channeled back to program and
departments for analysis with occasional action planning based on Student Satisfaction results.
Statement of the Problem:
The relationship between student satisfaction and student retention has not been analyzed
at Chippewa Valley Technical College. Over the past 10 years, CVTC has systematically
collected student satisfaction data using a standardized tool developed by Noel-Levitz, Inc,
however, the relationship between student satisfaction and program retention has not been
determined.
Purpose of the Study
The purpose of this study is to analyze the relationship between student satisfaction with
program graduation. This field study will focus on Chippewa Valley Technical College program
data from 2003. In addition, this study will build a foundation for CVTC to identify potential
interventions related to faculty development, academic and student services, as well as serve as
the impetus for a formal college-wide retention program in alignment with their AQIP quality
improvement project.
Objectives of the Study
The objectives of this study are to:
1. Investigate the correlations between Noel-Levitz Student Satisfaction Inventory (SSI)
responses and student program retention data at Chippewa Valley Technical College.
2. Investigate the correlation between student dissatisfaction as expressed by a large gap
score and tenure in student program of study.

3. Determine if items within the Noel-Levitz instrument, or clusters of items within the
instrument, are predictive of student program retention.
Assumptions and Limitations
The assumptions of this study are:
1. Noel-Levitz Student Satisfaction Inventory (SSI) data from Chippewa Valley Technical
College in Fall term 2003 was the same data collected by CVTC staff in the Fall term
2003. No cross referencing was done of raw data reported to raw data submitted.
2. Program retention data reported for 2003 at Chippewa Valley Technical College was
retrieved from the internal database system without error. Data is compiled into one
source.
The limitations of this study are:
1. Sample was drawn from students who self-identified when reporting their Noel-Levitz
student satisfaction data in 2003. Student identification allowed matched data points to
program retention.
2. Sample represented 23 out of 30 of the Associate Degree programs at Chippewa Valley
Technical College with six of those programs with < 5 respondents.
3. The present study seeks a local validation of the predictive power of the Noel-Levitz
Satisfaction Inventory. As such, findings from this study may not generalize to career
and technical colleges that are unlike Chippewa Valley Technical College
SignlJicance of the Study
This research is significant for the following reasons:
1. This research will be used by the Chippewa Valley Technical College Leadership team
in collaboration with the Retention Steering Committee to justify the continued use of
Student Satisfaction Inventory data related to student retention.
2. Results of this research will be used to guide Chippewa Valley Technical College policy
and procedure for implementation of a formal student retention program college-wide.
Retention program will alignment with CVTC's Accreditation Quality Improvement
Program (AQIP) improvement project.
3. Results of this study may also be used to develop strategies to improve retention at
CVTC. Recommendations may deal with specific strategies that the student services and
program faculty can accomplish to increase retention.
4. Other colleges may benefit from the data analysis. Similar institutions may benefit from
understanding how student satisfaction correlates to student retention in the Community
or Technical college environment.
Definition of Terms
The following terms will be used throughout this research study:
Course retention - Number of students enrolled in each credit course after the course census date
and the number of students who successfully complete the course (CSCSR, 2005)
Persistence rate - Program students continuing from one semester to the next. (CVTC, 2005)
Program retentioduttrition - Full-time, first time student tracked over a period of time to
ascertain whether or not the student graduated in the intended major or entry. (Seidman
1996)
Student satisfaction - When student expectations are met or exceeded by an institution.
(Noel-Levitz, 2006)
Student retention - Whether or not the student attained hisher academic and/or personal goals
at exit. (Seidman, 1996)
Satisfaction inventory - A survey measuring student satisfaction and priorities showing how
satisfied students are as well as what issues are important to them. (Noel-Levitz, 2006)

Chapter 11: Review of Literature
The body of knowledge related to student retention is vast; however, there is still much to
learn about why some students abandon their stated academic goals while other students
persevere to reach those goals. The purpose of this study is to analyze the relationship between
student satisfaction and retention at Chippewa Valley Technical College. Over the next few
pages, this literature review will describe the main points relevant to this study. Initially,
describing the impact student retention has on students financially as well as governmental
expenditures for higher education. A historical perspective on the evolution of student retention
theories is provided, narrowing finally to research specific to student satisfaction and retention.
The US Department of Education reports the expenditures in public 2-year institutions in
2002-03 was 34.9 billion dollars. This figure is projected to rise to 50 billion by 2013-14. For 4-
year institutions, the expenditure in 2002-03 was 159 billion and is expected to increase to 223
billion by 2013-14. In the year 2000, the Department of Education also reported that nearly 44
percent of community college students left college without a credential within three years of
entering, representing a potential loss in human potential (NCES, 2005).
As these statistics indicate, the cost of higher education is increasing and a significant
number of students (44 percent) are leaving 2-year colleges without acquiring a credential. What
is the economic impact of acquiring that credential versus not acquiring the credential?
According to the National Center for Educational Statistics (NCES), the annual income for males
with Associate degrees in 2003 was 17.4 percent higher as compared to males with a high school
education only. Interestingly enough, the difference between woman with and without an

Associate degree was slightly higher at 20 percent. (NCES, table 386) The financial impact
when students are not retained can be felt at the personal level through decreased income over a
career, organizationally through decreased revenue from students not retained and
governmentally from high expenditures without goal attainment.
Beyond the financial impact, to students and higher educational institutions, there is also
an impact to the long term viability of the US workforce. Can the United States compete in a
global economy without a skilled workforce? According to Alan Greenspan, (2004, p. 9) the
United States is at risk. "And if we want to maintain an economy and a society which has been at
the cutting edge of technology . . . we have to enhance the capability or the skills of people
coming out of our schools. You cannot have a highly complex capital structure without skilled
people to essentially staff it." (www.competeamerica.org).
Providing an opportunity for students to access and complete a credential and/or degree
in post secondary education is important for the reasons already stated. At times, this acquisition
of a degree, and the concept of student retention, can be quite complicated with the multiple
variables involved. This field of study and the variables involved can, create ambiguous dialogue
on definitions, data interpretations, and resulting outcomes. In an effort to sort through the
research, this chapter will begin with a brief overview of student retention by identifying some of
the established student retention theories, and then narrow down to literature related to student
satisfaction and student retention.
When referring to student retention, colleges involved in formal retention programs are
advised by the Center for Study of College Student Retention to define their use of the terms,
communicate the definitions to staff and faculty, and collect data within the boundaries of that

definition. Individual institutions tend to define student retention specific to their unique
environment with additional clarification given to program, course, and semester to semester
student retention. According to the Center for Study of College Student Retention (2004),
program retention tends to track full-time students in a degree program and determines whether
the student has completed the program; course retention refers to the number of students enrolled
in each credit course after the course census date and the number of students who successfully
complete the course; semester-to-semester retention generally refers to students who remain at a
college from one semester to another but may have switched into another program area.
(CSCSR, 2004).
The American College Testing Program (ACT) is a nonprofit organization providing
assessment and research services in the fields of education and workforce development. After 20
years of data collection and reporting of college retention, the 2004 ACT Brief, The Role of
Academic and Non-academic Factors in Improving College Retention listed a combination of
Academic and Non-academic factors (socioeconomic status, high school GPA and ACT
assessment scores combined with institutional commitment, academic goals, social support,
academic self-confidence and social involvement) as 17 percent of the variability of college
retention across students. By simple subtraction, this leaves 83 percent of the variability in
college retention still unaccounted (ACT, 2004).
Student retention is a complicated field of research because multiple variables exist
among our students and institutions. Some students who terminate the relationship leave just the
college, while others leave the academic system completely. Some students leave voluntarily,
perhaps out of incompatibility, while others are forced out due to academic performance,
behavioral, familial or for health reasons (Tinto, 1987). Over the years, various theories have

been offered to explain student attrition factors. Psychological theories, dating back to the early
1960s, relate retention to the student's ability and characteristics (Tinto, 1975). Forty years later,
psychological theory support continues as seen through the work of Swail, Redd & Perna (2003),
which describes cognitive variables such as study skills, aptitude, and critical thinking ability
affecting problem solving, student persistence and success in goal attainment. Environmental
theories, evolving in the 1980s, relate to the social, economic and organizational forces within
the college environment that contribute to student departure (Bean & Metzner, 1985). Eventually
Tinto (1 987) developed a theory with a sociological conceptual orientation, an interactive model
of student departure with emphasis on a longitudinal process to student departure. Tinto
developed the Interactionalist Theory that seeks to explain how interactions between individuals
within the college environment, as well as the unique characteristics student exude, contributes
to the decision to withdraw from the institution prior to goal attainment. "An institution's
capacity to retain students is directly related to its ability to reach out and make contact with
students and integrate them into the social and intellectual fabric of institutional life" (Tinto,
p. 180). Tinto has been described by other scholars of college student departure, as one creating
"paradigmatic status" (Braxton, 2004) because of the considerable consensus among scholars in
this field concerning the probable certainty of his theory. Tinto's model consists of academic and
social integration as an influence to a student's subsequent commitment to the institution and
graduation (Tinto, 1987).
Braxton, Sullivan and Johnson (1 997) assessed the empirical validity of Tinto's theory
and determined that revisions were warranted. From Tinto's model, they were able to identify 13
testable propositions to be used in a variety of institution types (4-year, 2-year, commuter and
residential). Results for residential universities showed support for five of the thirteen

propositions. Commuter universities, in contrast, only showed support to two of the 13
propositions. For two-year colleges, they found only one of Tinto's propositions (student entry
characteristics directly affect the likelihood of students' persistence in college) showed robust
empirical affirmation. Therefore, the power of Tinto's theory in 2-year colleges remains
undetermined empirically. Braxton, Sullivan and Johnson (1 997) offered a revision of Tinto's
theory as it relates to commuter institutions, however, they also left the subgroup of 2-year
institutions out of their focus in the revision.
Tinto's theory implies that the more students integrate and interact with the college
environment, the higher the chance they will remain (Tinto, 1997). Specifically is integration and
interaction a cause or a consequent? Are there intermediary variables like satisfaction? Does
satisfaction precede (temporally) integration? Is student satisfaction a predictor of student
retention? If this connection is sound, colleges around the world could benefit from this
knowledge as a firm understanding of what makes students unsatisfied could lead to the answers
to student satisfaction, eventually leading to improved student retention. Is there a clear line
between student retention and satisfaction?
Searching the literature for confirmation of the relationship between student satisfaction
and retention uncovered few studies on the subject. One such study from a major university in
the Southeast United States, focused on student satisfaction A d retention. Patti, Tarpley, Goree
and Tice (1993) found three factors of statistical significance (.05 level) between student
satisfaction and student's plans to remain. An Enrolled Student Survey, was developed internally
to collect specific information on satisfaction with college facilities, programs and services. The
survey was administered with 3 13 survey respondents and using multiple regressions, three
factors (Counseling Center (5.2 percent), concern for you as an individual (4.5 percent), Career
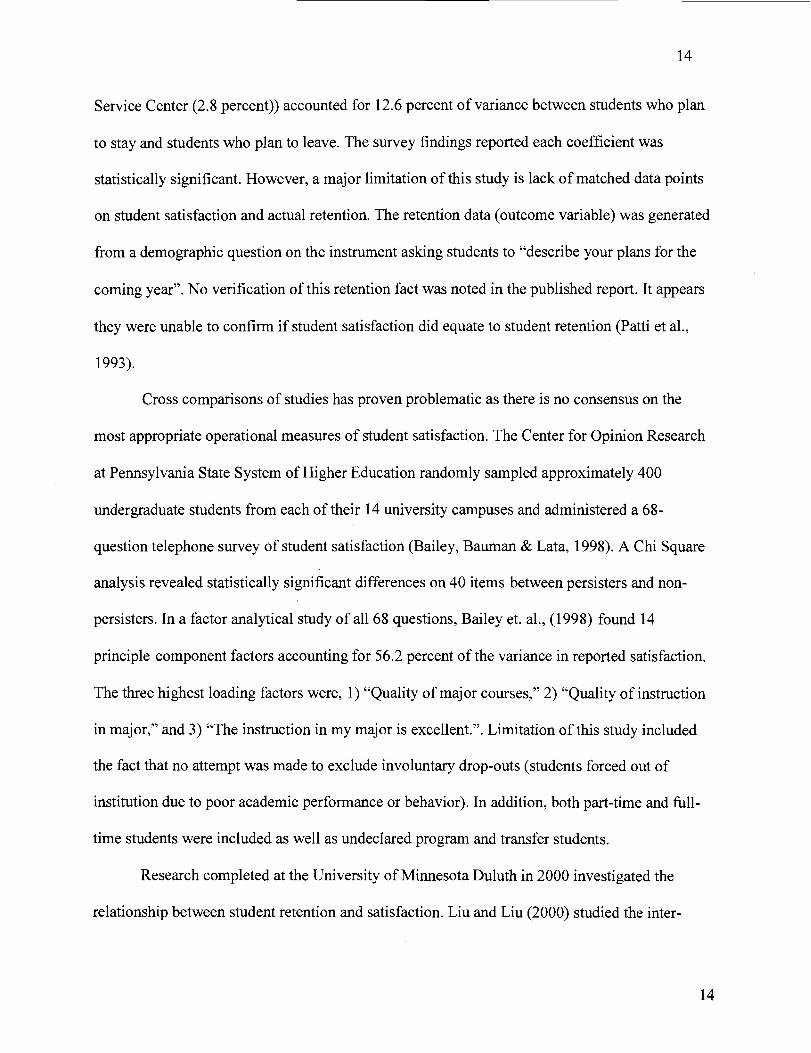
Service Center (2.8 percent)) accounted for 12.6 percent of variance between students who plan
to stay and students who plan to leave. The survey findings reported each coefficient was
statistically significant. However, a major limitation of this study is lack of matched data points
on student satisfaction and actual retention. The retention data (outcome variable) was generated
from a demographic question on the instrument asking students to "describe your plans for the
coming year". No verification of this retention fact was noted in the published report. It appears
they were unable to confirm if student satisfaction did equate to student retention (Patti et al.,
1993).
Cross comparisons of studies has proven problematic as there is no consensus on the
most appropriate operational measures of student satisfaction. The Center for Opinion Research
at Pennsylvania State System of Higher Education randomly sampled approximately 400
undergraduate students from each of their 14 university campuses and administered a 68-
question telephone survey of student satisfaction (Bailey, Bauman & Lata, 1998). A Chi Square
analysis revealed statistically significant differences on 40 items between persisters and non-
persisters. In a factor analytical study of all 68 questions, Bailey et. al., (1998) found 14
principle component factors accounting for 56.2 percent of the variance in reported satisfaction.
The three highest loading factors were, 1) "Quality of major courses," 2) "Quality of instruction
in major," and 3) "The instruction in my major is excellent.". Limitation of this study included
the fact that no attempt was made to exclude involuntary drop-outs (students forced out of
institution due to poor academic performance or behavior). In addition, both part-time and full-
time students were included as well as undeclared program and transfer students.
Research completed at the University of Minnesota Duluth in 2000 investigated the
relationship between student retention and satisfaction. Liu and Liu (2000) studied the inter-

correlations of social and academic integration on student satisfaction and retention. A sample of
378 freshman responded to an internally developed survey questionnaire and results revealed
academic integration, social integration and academic performance having positive and
statistically significant correlation with student satisfaction with social integration representing
the most important variable influencing satisfaction as noted in the table below.
Table 1
Constant variable related to satisfaction variable
Regression Coefficients
Constant t Significance
ETHNIC -0.1.1 0.919 SOCINT 7.327 0.000 ACADINT 2.871 0.004 SEX 0.675 0.500 GPA 5.45 8 0.000 AGE 0.533 0.595
Using logistic regression in the second stage of their analysis, Lui and Lui found that
academic integration, academic performance and satisfaction were predictive of student
retention. Their work, in general, partially validated Tinto's theory, though they did not find
social integration to have as much correlation to retention as Tinto's model suggested. While
there is some parallel between Liu and Liu's study and the new study this paper describes, there
is the obvious difference in 2-year and 4-year institutions and also variation in the definition of
persistence. In the present study at Chippewa Valley Technical College persistence is
operationally defined as program completion while persistence in this case was defined as
continued enrollment in the university after the quarter in which data was collected.
The Office of Institutional Research from Bowling Green State University also carried
out an analytical study of factors (e.g., student background, pre-college perceptions, college
experience, academic engagement perception, etc.) related to student retention in the year 1999.
Their study population was all new first year, full-time, degree seeking main campus students
(N=35 16) Their model explained 33 percent of the variance in freshman retention with the
strongest predictor of retention being student satisfaction. Again 66 percent of the variance is
still unexplained. Within the research report, a parallel is drawn between the current study and
those preceding it,
"The fact that research model explained 33 percent of the variance in student retention
represents a desirable outcome in applied educational research and this result compares
favorably with those of similar published academic studies" (e.g., Pascarella &
Chapman, 1983 [I 5 percent]; Pascarella & Terenzini, 1983 [18 percent]). The results
generally confirm Tinto's contention that students' academic and social integration into
college life have a stronger effect upon voluntary student retention than does their pre-
college academic ability."(p. 10)
Unfortunately, yet again this study by Bowling Green State University (200 1) was carried
out in a 4-year institution. However, one Community College study was uncovered during this
review. Florida's Valencia Community College was the site of a related study in 1998 on
academic and social integration of community college students. Borglum & Kubala (1998)
studied 462 second-semester degree-seeking community college students who completed the
college's Enrolled Student Satisfaction Survey. Results of those surveys were compared to
student's computerized placement tests (CPTs) for algebra, math, arithmetic, reading and
writing. This study attempted to validate Tinto's model therefore the satisfaction survey was
categorized into (a) Pre-entry attributes, (b) Goals and intentions (c) Social integration, and (d)
Academic integration. Descriptive statistics were used to report satisfaction results with overall
results showing students satisfied with the quality of the college (83 percent). One-way analysis
of variance (ANOVA) revealed no correlation between academic or social integration and
withdrawal rates. In addition, One-way ANOVAs also revealed significance between academic
skills and withdrawal patterns. A selection threat was noted in the design of this study as only the
surveys of second-semester students who had signed an informed consent form were used.
Another 2-year institution study authored by Rajasekhara and Hirsch (2000) examined
types of student retention (semester and annual) and as a separate data set, student satisfaction
using the Noel-Levitz Inventory instrument at the Community College of Baltimore City (MD).
At first blush, this study appeared to be the ideal comparison for the current research project,
however after close review, the parallels diminished as no matched data points were used in this
study. In the final analysis, the researchers implied major generalizations claiming it was clear to
them that demographics, student status and goals influenced retention rates, however, their report
did not include any statistical evidence of how this clear connection was obtained. No matched
data points were described in their report indicating a significant assumption on the correlation
between student satisfaction and retention.
There seems to be little empirical evidence on the relationship between student retention
and satisfaction, especially in the 2-year community or technical college institutions. Seeking
advice from an industry expert, Lana Low, a national consultant and former Noel-Levitz

executive was contacted. Lana (personal communication, June 5,2006) was not able to produce
any additional resources to support the correlation between retention and satisfaction and agreed
that more research was needed in this area, especially in the community and technical college
population.
An inquiry on instrument development was sent to Noel-Levitz, Inc., on two separate
occasions seeking to understand the research associated with their Student Satisfaction Inventory
development. To date, no response has been received (J. Bryant, personal communication,
September 10,2006). The Noel-Levitz Instrument is not listed in the 16' edition of the Burros
Mental Measurement Yearbook (2005).
Summary
In summary, the factors that account for student retention in higher education are
complicated and the documented empirical investigation of these factors sparse. However,
colleges have an obligation to their students' future incomes and the future economy of our
country, to understand the student retention issues within their institutions. As earlier stated, a
significant investment is being made in higher educational programs both at the 2-year and 4-
year levels and the expectations of accountability and the need for a strong return on investment
continues to grow.
The purpose of the present study is to investigate the empirical connection between
student self-reports of satisfaction and academic program retention. Lacking robust empirical
generalization from the literature, a local investigation of these correlations is warranted. For the
purpose of this study, explaining 50 percent of the variance in student retention would be highly
successful.

Chapter 111: Methods and Procedures
The methods and procedures used in this study of student retention and satisfaction are
explained in this chapter under the headings of (1) method of study, (2) sample selection, (3)
instrumentation, (4) procedures followed, and (5) method of analysis.
Method of Study
The purpose of the present study was to investigate the empirical connection between
student self-reports of satisfaction and academic program retention. At a global level, the
connection between student retention and satisfaction was ambiguous necessitating a local
validation. The data for this study was drawn from two data sources at Chippewa Valley
Technical College, (I) Noel-Levitz Student Satisfaction Inventory data file which holds all
student responses for biennial survey, and (2) Chippewa Valley Technical College's Student
information system (program student graduation report). Cross comparisons of studies has
proven problematic as there is no consensus on the most appropriate operational measures of
student satisfaction, however uncovering variation between graduates and nongraduates was a
common approach. Therefore, this study investigated if satisfaction scores, as operationalized
through the Noel-Levitz instrument, are predictive of those who graduate from 2-year programs
at Chippewa Valley Technical College versus those who do not.
Sample Selection
Chippewa Valley Technical College offers 23 two-year Associate degree programs in
varied industries such as healthcare, manufacturing, and business. In the Fall 2003 semester, over
1200 program students completed the Noel-Levitz Student Satisfaction Inventory (SSI) at

Chippewa Valley Technical College. From that group of students, 309 voluntarily self-reported
their student identification allowing their graduation outcome to be linked to this satisfaction
data. The demographics of this core group includes students ages 18-44, both part-time and full-
time students, GPA ranges from 1.99 or below to 3.5 or above, and both full-time and part-time
employment status. The respondents included students both with and without disabilities and
students who identified CVTC as their lSt, 2nd and 3rd choice of schools to attend. In addition,
ethnicity groups included Caucasian, American Indian, Asian, Hispanic or African American.
This sample included students from 23 of the 30 Associate Degree programs at Chippewa Valley
Technical College with six of those programs having < 5 respondents who voluntarily self
identified (AgriScience, Accounting, Hotel Restaurant Management, Computer Information
Systems-Network, Diagnostic Medical Sonography, Electrical Engineering).
Instrumentation
The Student Satisfaction Inventory is an instrument developed by Schreiner and Juillerat
(1993) through a series of phases. Initially, student and educational experts were interviewed to
determine important aspects of student satisfaction, followed by piloted random sample testing
and a series of reviews and revisions. In the 1993 version, the SSI was divided into 11 factor
analyzed scales similar to the version used today by Noel-Levitz, Inc.. The original 11 scales
included: Campus Climate, Campus Organizations and Activities, Responsiveness to Diverse
Populations, Curriculum and Instruction, Financial Aid, Campus Support Services, Academic
Advising, Resident Life, Student Acclimation, Safety and Security and Faculty Effectiveness
(Juillerat, 1993). Tests of validity on the SSI included convergent validity testing, construct
validity and predictive validity testing. The SSI instrument was copyrighted by the Noel-Levitz

company in 1994 and has continued to evolve over the past decade. Noel-Levitz, Inc. offers the
SSI instrument for four-year institutions and a version geared toward Community, Junior and
Technical Colleges, the latter of which CVTC began using in the mid 1990s. The current version
used by CVTC probes 11 3 survey questions asked in two ways. To each probe respondents are
asked to identify their level of importance and then respondents are asked to identify their level
of satisfaction. This survey is designed to create a gap score indicating the difference between
the level of importance and the level of satisfaction with each item. This Likert scale instrument
includes a large variety of questions grouped into 12 scales which included: Academic Advising
Effectiveness, Campus Climate, Campus Support Service, Concern for the Individual,
Instructional Effectiveness, Admissions and Financial Aid Effectiveness, Registration
Effectiveness, Responsiveness to Diverse Populations, Safety and Security, Service Excellence,
Student Centeredness, Academic Services,
The Noel-Levitz Student Satisfactory instrument is not listed in the 1 6 ~ ~ edition of the
Burros Mental Measurement Yearbook (2005). Apparently, the manufactures of the SSI
instrument have not submitted this instrument for inclusion in this resource, although their
Retention Measurement System is found in the edition of the yearbook.
Institutions using this instrument benefit from national benchmark comparisons by
institution type and are included in the annual National Student Satisfaction and Priorities
Report. Program students at Chippewa Valley Technical College participate in the satisfaction
survey biennially near the mid-term of the Fall semester. Chippewa Valley Technical College
has 10 years of experience with this instrument. All responses are collected and sent directly to
the Noel-Levitz Corporation where the data is aggregated and returned to CVTC. Upon receipt,
Chippewa Valley Technical College then disseminates the results to faculty and staff.

Procedures Followed
Data was collected from two separate databases at Chippewa Valley Technical College.
Normal operating procedure for facilitation of this satisfaction survey includes data collection at
the campus through paper surveys distributed to all program students on an identified date during
the Fall term All surveys are batch file transferred to Noel-Levitz, Inc. with final results
returned to CVTC within 4-6 weeks. The Noel-Levitz Student Satisfaction Inventory data disk
from the Fall 2003 term was accessed and self-identified student responses were partitioned into
a separate database using Minitab for statistical analysis. A cross reference was carried out
matching identifiable student satisfaction results to their program outcome data (1= graduate, 0=
did not graduate) along with college application and graduation dates. Program outcome and
application data is located within the enterprise information system (Banner) at Chippewa Valley
Technical College with each individual student account accessed by this researcher and one
assistant to retrieve data elements.
Method of Analysis
All statistical operations were conducted using Minitab statistical software version 14.0
(2005). Student graduation was coded as a binary variable (yeslno). Since the construct
underlying the Student Satisfaction Inventory (SSI) Likert questions are assumed continuous,
student reports of satisfaction and importance were treated as an interval measure (Crocker,
Algina, 1986). Since the dependent measure was binary, binary logistic regression was the only
form of analysis warranted (Pedhazur,1982). Binary logistic regression allows the dependent
variable to be dichotomous while the independent variables may be of many types. Binary
logistic regression was used to determine if gap scores (the difference between importance and

satisfaction), for any one of the 80 SSI items, were predictive of student graduation status
(yeslno). The alpha level for any given comparison was held to the p> .05 level. The alpha level
is the statistical probability that the size of the effect observed could be due to chance or Type I
error. The social sciences set the alpha level at or less than five chances in 100 that the effect
might be attributable due to chance before the null hypothesis (or its equivalent) is rejected.
Uncorrected, the Type I error rate (a true null hypothesis incorrectly rejected) on 80 comparisons
is extremely large. The probability of finding a statistically significant item is 80 x .05 equaling
4.00 meaning with 80 regression runs, there is a 400 percent chance of committing a Type I
error. Lacking a priori empirical and theoretical guidance for how to group and collapse items
into meaningful families of items, this study explored the predictive power of individual items
and corrections for Type I errors will be dealt with on a post hoc basis. Binary logistic regression
was conducted on individual comparisons to determine the pattern of results and the intent was
to aggregate SSI questions into empirically defensible groups to reduce the threat of a Type I
error.

Chapter IV: Results and Discussion
This research project has centered around three central objectives. (1) To investigate the
correlations between Noel-Levitz Student Satisfaction Inventory (SSI) responses and student
program retention data at Chippewa Valley Technical College. (2) To investigate the correlation
between student dissatisfaction as expressed by a large gap score and tenure in student program
of study and (3) To determine if items within the Noel-Levitz instrument, or clusters of items
within the instrument, are predictive of student program retention.
All statistical operations were conducted using Minitab statistical software version 14.0
(2005). Student graduation was coded as a binary variable (yeslno). Since the construct
underlying the SSI Likert questions were assumed continuous, student reports of satisfaction and
importance were treated as an interval measure (equal differences between measurements
represent equivalent intervals). Binary logistic regression was used to determine if there were
statistical differences between students who graduated and those who did not on their "gap
scores" for the 80 Likert questions in the SSI instrument. The alpha level for any given
comparison was held to the p> .05 level. Uncorrected, the Type I error rate on 80 comparisons is
considered extremely large. Binary logistic regression was conducted on individual comparisons
to determine the pattern of results and the intent was to aggregate SSI questions into empirically
defensible groups to reduce the threat of a Type I error. However, this second step was obviated
by the results discovered in the initial binary statistical runs. Specifically, no meaningful
suppressor or mediator relationships were found in multiple regression runs.
Data was gathered through the Noel-Levitz Student Satisfaction Inventory at Chippewa
Valley Technical College during Fall 2003 semester. Three hundred and nine students self-
reported their student identification allowing their graduation outcome to be linked to this

satisfaction data. The demographics of this core group includes students ages 18-44, both part-
time and full-time students, GPA ranges from 1.99 or below to 3.5 or above, and both hll-time
and part-time employment status. The respondents included students both with and without
disabilities and students who identified CVTC as their lSt, 2nd and 3rd choice of schools to attend.
In addition, ethnicity groups included Caucasian, American Indian, Asian, Hispanic or African
American
Research Objective 1
The first objective was to investigate the correlations between Noel-Levitz Student
Satisfaction Inventory (SSI) responses and student program retention data at Chippewa Valley
Technical College. Focusing on this first research objective, "gap scores" for students who
graduated were compared with gap scores for students who did not graduate on the 80 SSI Likert
questions. Among the 80 binary logistic regression runs, statistically significant differences were
discovered on only three survey questions as shown in the table on the next page. The table
shows the binary logistic regression on gap scores for retention on item 20 (Financial aid
counselors are helpful), item 34 (Computer labs are adequate and accessible), and item 38 (The
student center is a comfortable place for students to spend their leisure time). As noted in the
table, the p value for each item is below 0.05 showing statistical significance. The question
answered by binary logistic regression is if the pattern of values in the independent variable (in
this instance gap scores) is predictive of correctly identifying what group they would occupy in
the dependent measure (student graduation yeslno). The gap scores on SSI items #20,34 and 38
were statistically significant. However, these three items remain practically meaningless.

Table 2
Binary Logistic Regression on Gap Scores for Retention (yes/no)
Coe f Predictor - SE Coef - Z - P Odds Ratio
Constant 0.603 0.140 4.30 Gap 20 -0.132 0.066 -2.01 0.044* 0.88
Constant 0.288 0.133 2.16 0.03 1 Gap 34 0.152 0.066 2.30 0.022* 1.16
Constant 0.358 0.126 2.84 0.005 Gap 38 0.162 0.065 2.50 0.013* 1.013
* p < .05.
For a complete listing of all binary logistic regression runs on Gap scores for Retention, see
appendix A.
Straightforward mathematics reveals that (i.e., p = .05 x 80 comparisons = 4.00) the true
Type I error rate for this number of comparisons approached 400 percent. Stated alternatively,
with 80 regression runs, there is a 400 percent chance that difference on these variables is due to
the mathematical artifact of chance alone and that in reality no meaningful differences exist on
these three variables.
Research Objective 2
The second research objective was to investigate the correlation between student
dissatisfaction as expressed by a large gap score and tenure in student program of study. For this
objective the correlation between student dissatisfaction as expressed by a large gap score (the
difference between importance and level of satisfaction) and tenure in student program of study
provided the following results. Retention has been defined operationally as the student having

completed his or her program of study within 36 months (or 150 percent of the time allowed in a
24 month program). The variable success was delineated as yes or no and tenure as a ratio. In
this sample, however, 17 students were in pursuit of their degree but had not yet graduated. This
second research question investigated gap scores on the SSI instrument but this time regressed on
the number of months (2 36) students had been progressing toward their graduation or "months
out". Since the second variable is now a ratio level measure, the statistical analysis was
regression. The 80 SSI items were regressed on "months out" resulting in no statistically
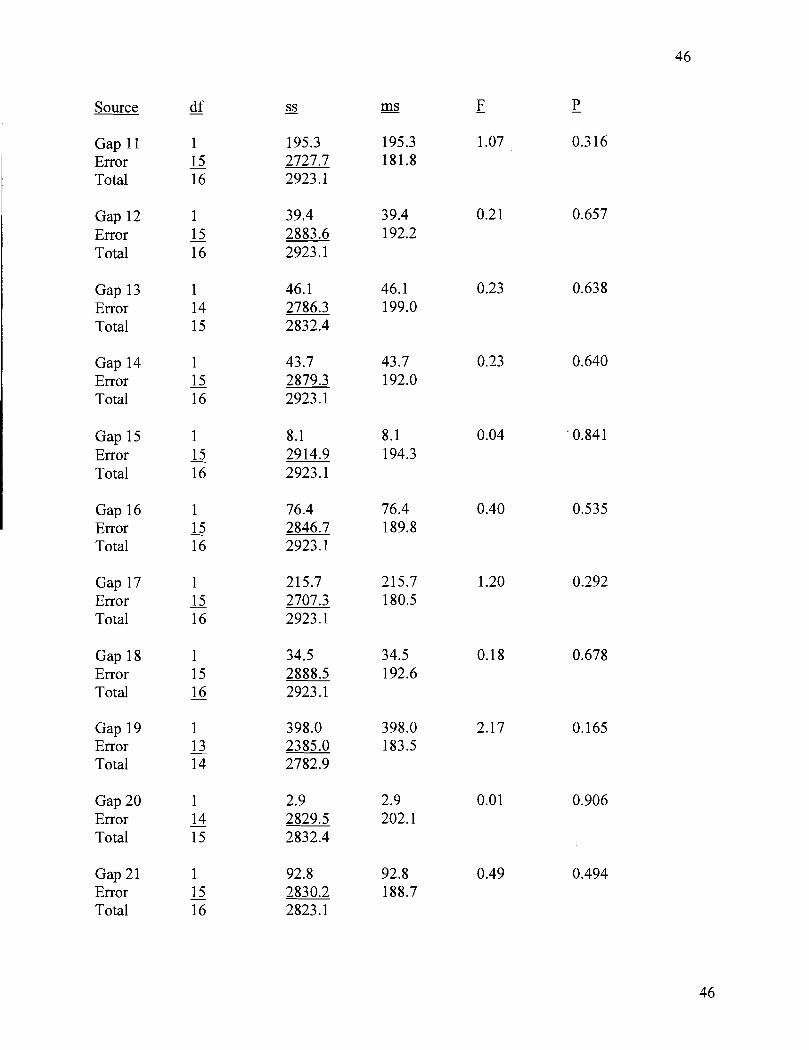
significance with any of the items. Sample data showing the regression of SSI gap scores on
"months out" is provided in Table 3 below.
Table 3
Regression of SSI Gap Score on "Months Out"
Source - d f
Gap 1 1 Error - 15 Total 16
Gap 2 1 Error - 15 Total 16
Gap 3 1 Error - 15 Total 16
* p<.05
For a complete listing of all regression runs on Gap Scores on Months Out, see appendix B.

In essence, student satisfaction scores did not decrease (larger gap scores) with extended
tenure in their academic program. It is noted that the sample size was small and the standard
error of measure was relative large, however, it was found that student satisfaction scores
remained constant regardless of tenure in their program for this sample.
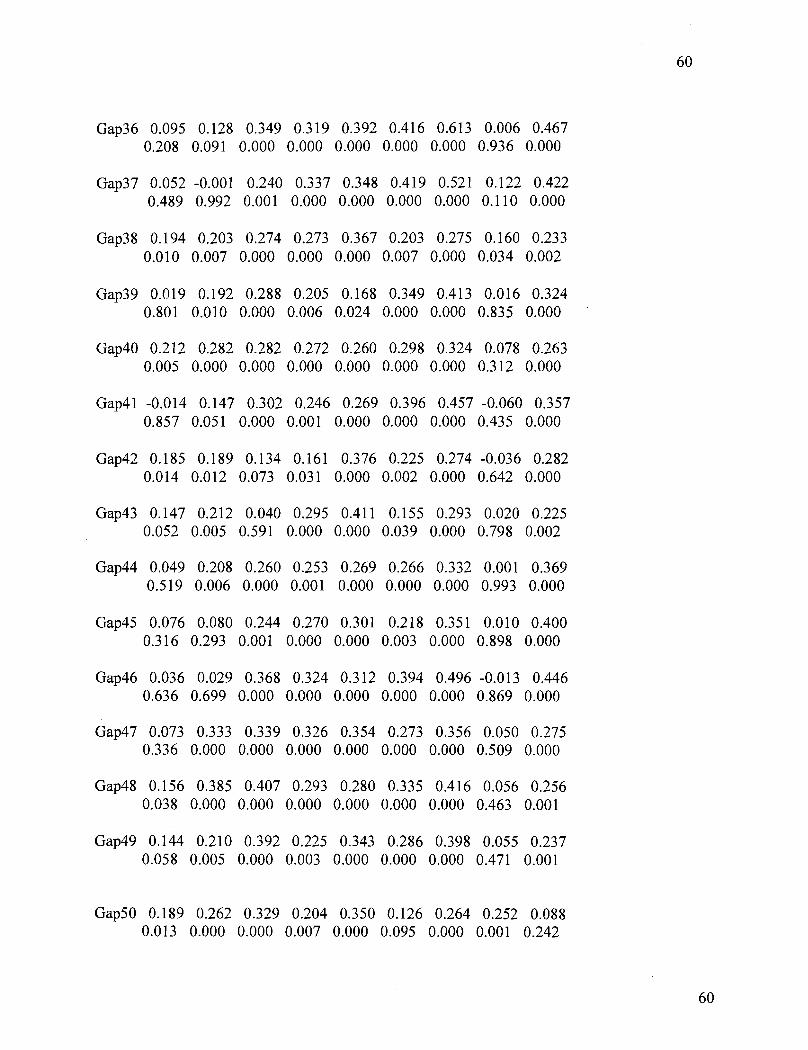
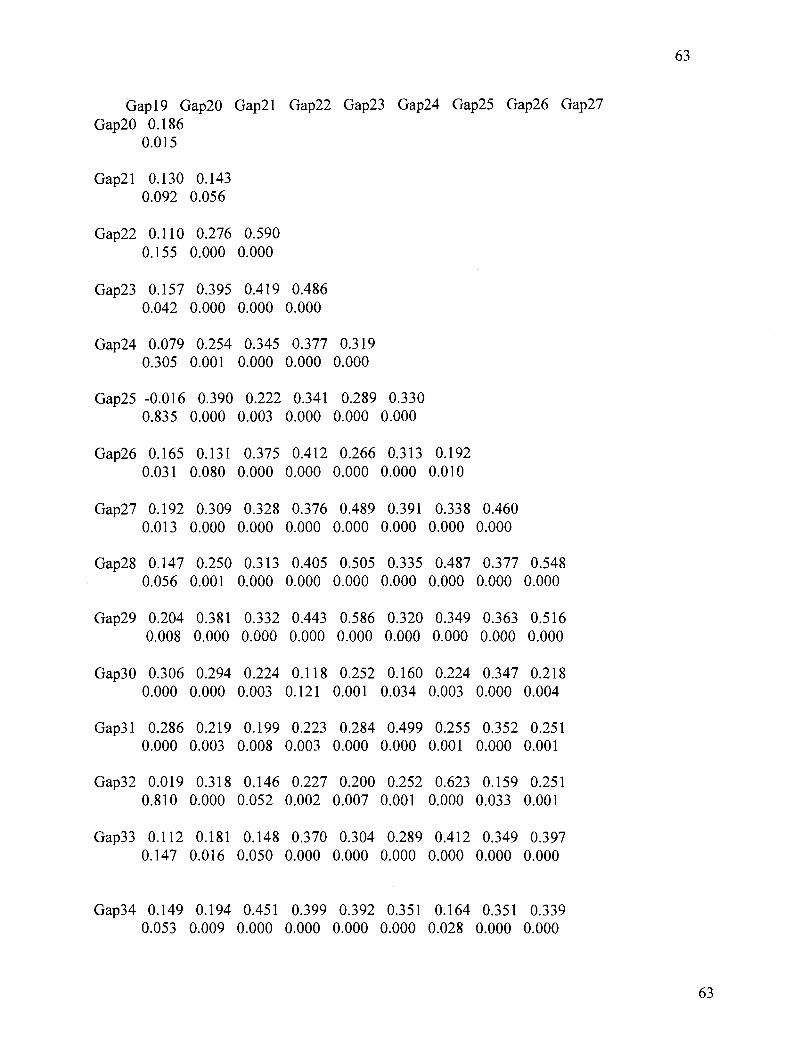
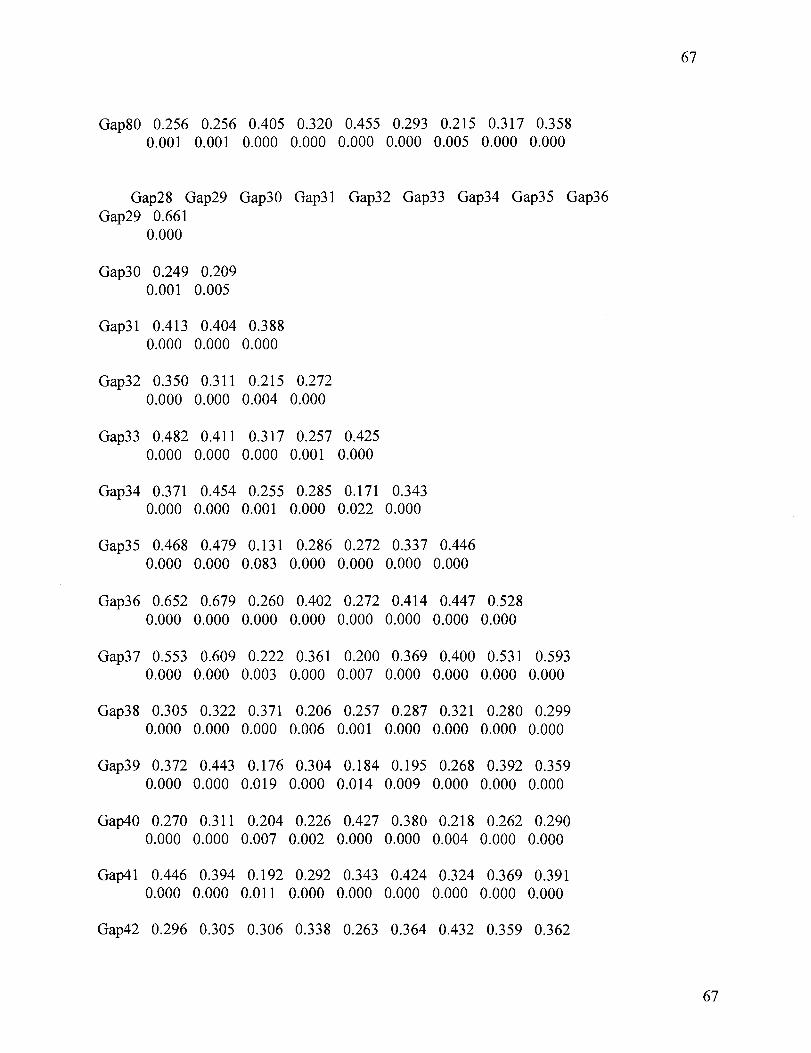
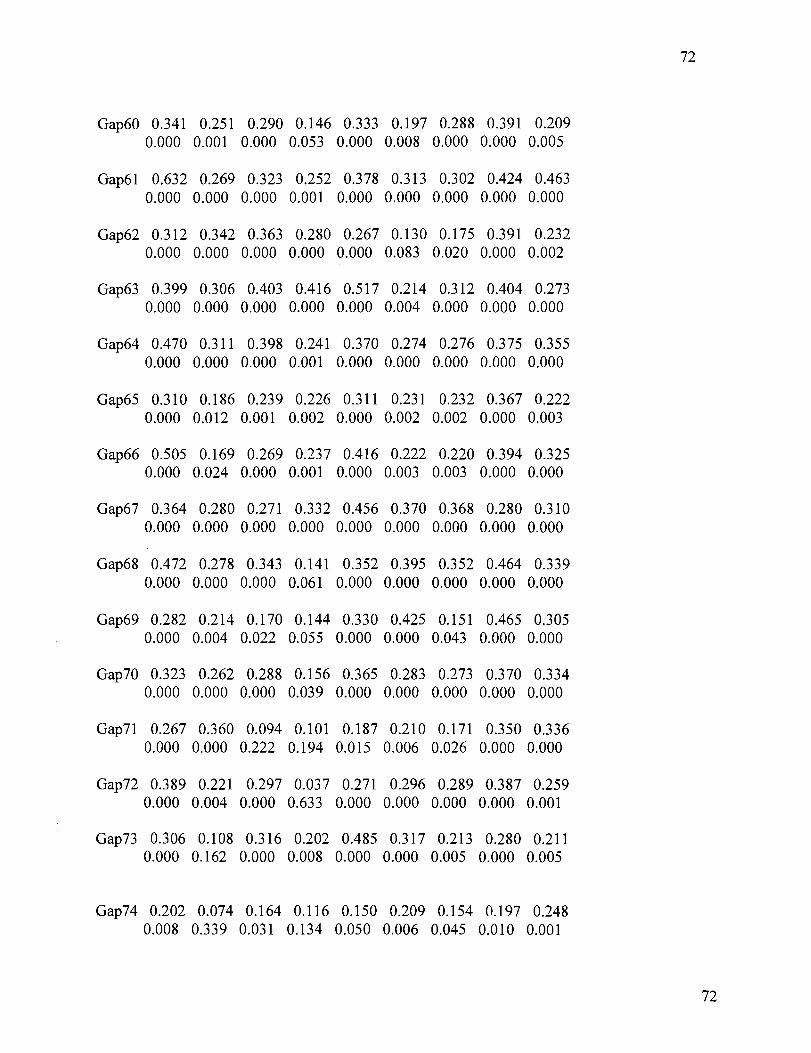
Research Objective 3
The third research objective was to determine if items within the Noel-Levitz instrument,
or clusters of items within the instrument, are predictive of student program retention. Every
combination of potential candidates was investigated. First order correlations were extremely
small as noted in the small sample table titled Intermittent correlation matrix on SSI shown on
the following page. See Appendix C for a complete listing of all gap score correlations. There
was hope that suppressor or moderator variables would reveal meaninghl relationships,
however, in the end no cluster of SSI items were predictive of student retention.

Table 4
Intermittent correlation matrix on SSI.
Sample Correlations: Gap1 - Gap7
The responses from this sample of students did not predict who would successfully
graduate from those who did not graduate. There is little reason to believe these findings are a
Type I1 error (a false null hypothesis can fail to be rejected) as the sample is relatively large and
statistical analysis robust.
The results of this statistical analysis did not bring forth the results expected. The bias of
this researcher was gained through the marketing strategies used by the proprietor of this
satisfaction instrument. Could it be that Chippewa Valley Technical College is not representative
of the colleges this instrument is targeted to? It is possible, that through this local validation we

have found that the local population of students, the large market share CVTC holds and the type
of programs offered at CVTC, create a unique situation. CVTC is the only college is this region
of Wisconsin that offers many of these occupational programming options, such that some
students have no other choice of college other than Chippewa Valley Technical College. If
students are geographically bound to this region or financially restricted to attend a low cost
college, CVTC is their only option for face-to-face instruction towards an Associate Degree. It
appears that program completion (graduation) and student satisfaction at Chippewa Valley
Technical College are not as related as some would lead us to believe. If students have
established goals to complete an Associate Degree program in a face-to-face learning
environment, combined with limited economic means and geographic restrictions, Chippewa
Valley Technical College is their only option and student satisfaction does not inter-correlate to
the achievement of that goal.

Chapter V: Summary, Conclusions and Recommendations
Summary
Chippewa Valley Technical College (CVTC) has spent over a decade attempting to
understand student satisfaction on its campus. The college has systematically collected student
satisfaction data using a standardized tool developed by Noel-Levitz, Incorporated. The results of
this survey have been funneled back to program and departmental areas of the college with some
effort focused on implementation of interventions to improve satisfaction. In 2005, CVTC
identified student retention as a focus for its accreditation quality improvement program (AQIP),
and devoted a multidisciplinary task force to the project with the ultimate goal of establishing a
comprehensive college program on student retention. Through this initiative, the task force began
to investigate the link between student satisfaction and student retention. Early within this
initiative, this researcher began to investigate the relationship between student satisfaction and
student retention.
Very little empirical evidence exists within the literature to explain the relationship
between student satisfaction and student retention, especially in the 2-year technical or
community college environment. Of the studies found, Patti, Tarpley, Goree & Tice (1993)
found that student satisfaction measures accounted for 12.6 percent of the variance in retention
while Bailey, Bauman & Lata (1 998) were able to account for 56.2 percent of the variance in a
similar investigation of predictive validity. Lacking robust inter-correlations between satisfaction
and retention fiom the literature, a local investigation of these correlations was warranted.
The purpose of the present study was to investigate three central objectives: (1) the inter-
correlations between survey items on Noel-Levitz Student Satisfaction Inventory (SSI) and
student program retention data at Chippewa Valley Technical College. (2) To investigate the
correlation between student dissatisfaction as expressed by a large gap score and tenure in
student program of study and (3) To determine if items within the Noel-Levitz instrument, or
clusters of items within the instrument, are predictive of student program retention.
In the Fall 2003 semester, over 1200 program students completed the Noel-Levitz
Student Satisfaction Inventory (SSI) at Chippewa Valley Technical College. From that group of
students, 309 voluntarily, self-reported their student identification allowing their graduation
outcome to be linked to this satisfaction data. A cross reference was carried out matching
identifiable student satisfaction results to their program outcome data (1= graduate, 0= did not
graduate) along with college application and graduation dates. The statistical analysis associated
with each of the research objectives was completed and reported below.
Conclusions
The first research objective was to investigate the correlations between Noel-Levitz
Student Satisfaction Inventory (SSI) responses and student retention at Chippewa Valley
Technical College. Binary logistic regression was used to determine if there were statistical
differences between students who graduated and those who did not, as determined by their "gap
scores" for the 80 Likert questions in the SSI instrument. Statistically significant differences
were discovered on only three survey questions (#20 - Financial aid counselors were helphl.
#34 Computer labs are adequate and accessible, and #38 Student center is a comfortable place
for students to spend their leisure time). However, it is clear that a Type I error correction for
multiple comparisons would render these three findings mathematically meaningless. The data,
from this sample of Chippewa Valley Technical College students, did not show an inter-
correlation between student satisfaction and student retention at Chippewa Valley Technical
College.
The second research objective, an investigation on the correlation between student
dissatisfaction as expressed by a large gap score and tenure in student program of study, revealed
yet more meaningless results. The 80 SSI items were regressed on "months out" resulting in no
statistically significance in any of the 80 items. Extended tenure (beyond 150 percent allowed in
twenty-four month program) did not reveal differences in student satisfaction as expressed by
large gap scores (the difference between importance and satisfaction) within this population of
students at Chippewa Valley Technical College.
The third research objective, to determine if items within the Noel-Levitz instrument or
clusters of items within the instrument, were predictive of student program retention, in the end
revealed no cluster of SSI items were predictive of student retention for this sample. The
responses from this sample of students at Chippewa Valley Technical College did not predict
who would successfully graduate from those who would not.
Considering the overall results of all three research objectives, the Noel-Levitz Student
Satisfaction Inventory could not be locally validated through this study at Chippewa Valley
Technical College.
Recommendations Related to This Study
Results of this study will be presented to the Chippewa Valley Technical College Leadership
team along with the following recommendations:
(1) It is recommended that Chippewa Valley Technical College suspend associating the
Noel-Levitz Student Satisfaction Inventory results with student retention
intervention planning until additional studies can prove a strong inter-correlation
between satisfaction and retention. The results of this study did not indicate a
correlation between student retention and student satisfaction, as noted by program
graduation data and results of Student Satisfaction Inventory.
(2) It is recommended that Chippewa Valley Technical College develop an instrument,
unique to this population, which could be used to predict student retention.. A unique
instrument developed to account for 50 percent of the variance between students who
achieve their academic goals and those who do not, would have the potential to
enhance student retention intervention planning and ongoing management of the
comprehensive retention program college-wide.
Recommendations for Further Study
(1) It is recommended that CVTC continue to research student satisfaction related to
student retention using matched data points of individual student satisfaction data
(SSI) and student program completion. An investigation of local variables is
warranted.
(2) It is recommended that CVTC collaborate with other Wisconsin Technical Colleges
on the issue of student retention and satisfaction. Facilitating a similar study across
the Wisconsin state technical college system would provide more breadth and depth
to future study.

References
American College Testing Program (2004). ACT Brief. The Role ofAcademic and Non-
academic Factors in Improving College Retention. Retrieved November 2005
from http://www.act.org.
Bailey, B.L., Bauman, C., & Lata, K.A. (1998) Student Retention and Satisfaction: The
Evolution of a Predictive Model, Proceedings of AIR 1998 Annual Forum Paper.
Minneapolis, MN. Retrieved March 8,2006 from ERIC database
(ED424797).
Bean, J.P., & Metzner, B.S. (1 985). A conceptual model of nontraditional undergraduate
student attrition. Review of Educational Research, 55,485-540.
Borglum, K., Kubala, T. (2000) Academic and Social Integration of Community College
Students: A Case Study. Retrieved June 1,2006 from Academic Search Elite
(Community College Journal of Research & Practice, 3508269).
Braxton, J.M., Hirschy A.S., & McClendon S.A. (2004). Understanding and reducing
college student departure. Hoboken, NJ: Wiley Periodicals, Inc.
Braxton, J.M., Sullivan, A.S., & Johnson, R.M. (1997). Appraising Tinto S Theory of
College Student Departure. In J.C. Smart (ed.) Higher education: A handbook of
theory and research, vo112, pp. 107-1 64. New York: Agathon Press.
Center for Study of College Student Retention (2004). Engagement by Design 2004
Findings. Retrieved Nov 2005 from http://www.cscsr.org.
Community College Survey of Student Engagement (2004). 2004 Summary Report
Retrieved Nov 2005 from http://www.ccsse.org.

Crocker, L., Algina, J., (1986). Introduction to Classical and Modern Test Theory. New
York: CBC College Publishing.
Greenspan, Alan. Former Chairman of the Federal Reserve, Testimony before the
House Financial Service Committee, U.S. House, February 11,2004,
"Semiannual Monetary Policy Report to the Congress". Retrieved on June 15,
2006 from www.competeamerica.orgz
Habley, W., & McClanahan, R., (2004). What Works in Student Retention? Two-Year
Public Colleges. ACT
Integrated Postsecondary Education Data System (IPEDS) Data Feedback Report 2005
for Chippewa Valley Technical College. National Center for Education Statistics.
(2005).
Juillerat, S. (1 995). Investigating a two-dimensional approach to the assessment of
student satisfaction: validation of the student satisfaction inventor. (Doctoral
dissertation. Temple University, 1995). Retrieved from Temple University
microfiche, printed September 20,2006.
Levitz R., Noel L. (2000). Tired of Moving Mountains? Getting Retention Results really
is Easy. Retrieved February 7,2006 from http://www.noellevitz.com.
Liu. R., Liu, E., (2000). Institutional Integration: An Analysis of Tinto's Theory.
Paper presented at the Annual Forum of the Association of Institutional Research
4oth, Cincinnati OH. Retrieved March 2006 from the ERIC database (ED445629).
National Center for Education Statistics. Pocket projections report: Projections of
Educational Statistics to 2014. Retrieved June 10,2006 from http://www.ed.gov

Office of Institutional Research (2001). An Analytic Study of First Year Student
Retention at Bowling Green State University. Retrieved June 15,2006 from
http://www.bgsu.edu.
Patti, M.V., Tarpley, R.S ., Goree, C.T., & Tice, G.E. The Relationship of College
Facilities and Services to Student Retention Proceedings of Mid-South
Educational Research Association. New Orleans LA. Retrieved March 9,2006
from the ERIC database (ED3683 12).
Pedhazur, E. (1982). Multiple Regression in Behavior Research. New York: CBC
College Publishing.
Rajasekhara. K., Hirsch. T., (2000) Retention and Its Impact on Institutional
EfSectiveness at a Large Urban Community College. Presented at 4oth
Association for Institutional Research (AIR) Annual Forum, Cincinnati OH.
Retrieved November 2005 from ERIC database (ED 446799).
Seidman, A. (1 996). Retention Revisited: RET=E Id + (E+I+C)Iv. College and
University, 71 (4), 18-20.
Swail W. Redd K. Perna L. (2003). Retaining Minority Students in Higher Education: A
Framework for Success. ASHE-ERIC Higher Education Report. (2003), 30(2),
75-1 12.
Tinto, V. (1975). Dropout from higher education: A theoretical synthesis of recent
research. Review of Educational Research, 65 (winter): 89-125.
Tinto, V. (1 987). Leaving college: Rethinking the causes and cures of student attrition.
Chicago: The University of Chicago Press.

Tinto, V. (1993). 2nd Edition. Leaving college: Rethinking the causes and cures of
student attrition. Chicago: The University of Chicago Press.

Appendix A: Binary Logistic Regresssion, Gap Scores for Retention
Binary Logistic Regression on Gap Scores for Retention (yeslno)
Predictor SE Coef Odds Ratio
0.99
.097
1.05
1.03
1.13
0.99
0.99
1.09
1.02
1.03
0.95
0.99
0.92
Constant Gap 1
Constant Gap 2
Constant Gap 3
Constant Gap 4
Constant Gap 5
Constant Gap 6
Constant Gap 7
Constant Gap 8
Constant Gap 9
Constant Gap 10
Constant Gap 11
Constant Gap 12
Constant Gap 13

Odds Ratio
Constant Gap 14
Constant Gap 15
Constant Gap 16
Constant Gap 17
Constant Gap 18
Constant Gap 19
Constant Gap 20
Constant Gap 2 1
Constant Gap 22
Constant Gap 23
Constant Gap 24
Constant Gap 25
Constant Gap 26
Constant Gap 27
Constant

Gap 28 Predictor
0.091 -0.2 1 SE Coef - Z
0.98 Odds Ratio
Constant Gap 29
Constant Gap 30
Constant Gap 3 1
Constant Gap 32
Constant Gap 33
Constant Gap 34
Constant Gap 35
Constant Gap 36
Constant Gap 37
Constant Gap 38
Constant Gap 39
Constant Gap 40
Constant Gap 4 1
Constant Gap 42
Constant

Gap 43
Constant Gap 44
Constant Gap 45
Constant Gap 46
Constant Gap 47
Constant Gap 48
Constant Gap 49
Constant Gap 50
Constant Gap 5 1
Constant Gap 52
Constant Gap 53
Constant Gap 54
Constant Gap 55
Constant Gap 56
Constant Gap 57
Constant Gap 58

SE Coef Odds Ratio
1.01
0.92
0.97
1.03
1 .oo
1.15
0.95
1.01
1 .oo
1.08
1.13
1.02
0.93
1.09
Predictor
Constant Gap 59
Constant Gap 60
Constant Gap 6 1
Constant Gap 62
Constant Gap 63
Constant Gap 64
Constant Gap 65
Constant Gap 66
Constant Gap 67
Constant Gap 68
Constant Gap 69
Constant Gap 70
Constant Gap 7 1
Constant Gap 72
Constant

Gap 73 Predictor
0.089 SE Coef
0.92 Odds Ratio
Constant Gap 74
Constant Gap 75
Constant Gap 76
Constant Gap 77
Constant Gap 78
Constant Gap 79
Constant Gap 80

Appendix B: Regression of SSI Gap Score on "Months Out"
Regression of SSI Gap Score on "Months Out"
Source
Gap 1 Error Total
Gap 2 Error Total
Gap 3 Error Total
Gap 4 Error Total
Gap 5 Error Total
Gap 6 Error Total
Gap 7 Error Total
Gap 8 Error Total
Gap 9 Error Total
Gap 10 Error Total
Source
Gap 11 Error Total
Gap 12 Error Total
Gap 13 Error Total
Gap 14 Error Total
Gap 15 Error Total
Gap 16 Error Total
Gap 17 Error Total
Gap 18 Error Total
Gap 19 Error Total
Gap 20 Error Total
Gap 2 1 Error Total

Source
Gap 22 Error Total
Gap 23 Error Total
Gap 24 Error Total
Gap 25 Error Total
Gap 26 Error Total
Gap 27 Error Total
Gap 28 Error Total
Gap 29 Error Total
Gap 30 Error Total
Gap 3 1 Error Total
Gap 32 Error Total

Source
Gap 33 Error Total
Gap 34 Error Total
Gap 35 Error Total
Gap 36 Error Total
Gap 37 Error Total
Gap 3 8 Error Total
Gap 39 Error Total
Gap 40 Error Total
Gap 41 Error Total
Gap 42 Error Total
Gap 43 Error Total

Source
Gap 44 Error Total
Gap 45 Error Total
Gap 46 Error Total
Gap 47 Error Total
Gap 48 Error Total
Gap 49 Error Total
Gap 50 Error Total
Gap 5 1 Error Total
Gap 52 Error Total
Gap 53 Error Total

Source
Gap 54 Error Total
Gap 55 Error Total
Gap 56 Error Total
Gap 57 Error Total
Gap 58 Error Total
Gap 59 Error Total
Gap 60 Error Total
Gap 61 Error Total
Gap 62 Error Total
Gap 63 Error Total
Gap 64 Error Total

Source
Gap 65 Error Total
Gap 66 Error Total
Gap 67 Error Total
Gap 68 Error Total
Gap 69 Error Total
Gap 70 Error Total
Gap 71 Error Total
Gap 72 Error Total
Gap 73 Error Total
Gap 74 Error Total
Gap 75 Error Total

Source
Gap 76 Error Total
Gap 77 Error Total
Gap 78 Error Total
Gap 79 Error Total
Gap 80 Error Total

Appendix C: SSI items predictability on Student Retention
Correlations: Gapl, Gap2, Gap3, Gap4, Gap5, Gap6, Gap7, Gap8, ...
Gapl Gap2 Gap3 Gap4 Gap5 Gap6 Gap7 Gap8 Gap9 Gap2 0.562
0.000


Gap10 Gapll Gap12 Gap13 Gap14 Gap15 Gap16 Gap17 Gap18 Gapll 0.399
0.000


000'0 000'0 000'0 000'0 ELZ'O OPP'O 9EP'O 08E'O 6Sd~9
000'0 000'0 1 OP'O L IP'O LSd?39
000'0 000'0 000'0 000'0 000'0 000'0 000'0 000'0 000'0 PIP'O 9LZ'O PPE'O ZZE'O EOE'O SEE'O E9E'O ZLZ'O EZE'O 086~9
000'0 6SO'O 000'0 000'0 100'0 100'0 100'0 LOO'O 000'0 EIE'O SPT'O 80E.0 692'0 ZSZ'O 8PZ'O 9SZ'O LOZ'O 91E.0 6Ld~9
SOO'O SZ8'0 ZOO'O 110'0 SZO'O 000'0 900'0 682'0 9Z1'0 ETZ'O L10'0- 9EZ'O S61'0 EL1'0 662'0 Z1Z'O 280'0 811'0 8LdW
000'0 000'0 000'0 £00'0 000'0 000'0 000'0 8PO'O 100'0 OLZ'O OEE'O 862'0 822.0 S6Z'O £82'0 9SE'O 1S1'O 6SZ'O LL~E~
Z10'0 ZOO'O SOO'O 801'0 000'0 POO'O 000'0 100'0 000'0 261.0 8EZ'O 812.0 PZ1'0 L6Z'O OZZ'O 9SE'O Z9Z'O 892'0 9LdW
100'0 100'0 620'0 622.0 SOO'O 010'0 000'0 SSE'O 6P1'O 9SZ'O SSZ'O 691'0 £60'0 PIZ'O 861'0 00E.0 1LO'O 111'0 SL~ED
SOO'O P90'0 000'0 100'0 OS1'0 ZOO'O ZS1'0 612'0 000'0 P1Z'O 1P1.O S9Z.0 LSZ'O 1 11'0 ZEZ'O 011'0 P60'0 EZE'O tLd~9
000'0 000'0 000'0 000'0 100'0 000'0 000'0 ZOO'O 000'0 ZPP'O 68E'O ZEP'O 6LE'O PSZ'O 1ZP'O 8LE'O SEZ'O OSE'O £Ld~9
000'0 000'0 000'0 Z10'0 ZOO'O 000'0 0oo:o 000'0 000'0 Z1P'O L9Z'O 6PE'O 161'0 SEZ'O SZE'O 692'0 6PE'O OLE'O ZL~E~
100'0 000'0 000'0 SEO'O 000'0 000'0 000'0 800'0 SIO'O LSZ'O 6LZ'O PEE'O 291.0 OZP'O SOP'O L6Z'O EOZ'O S81'0 1Ld~9

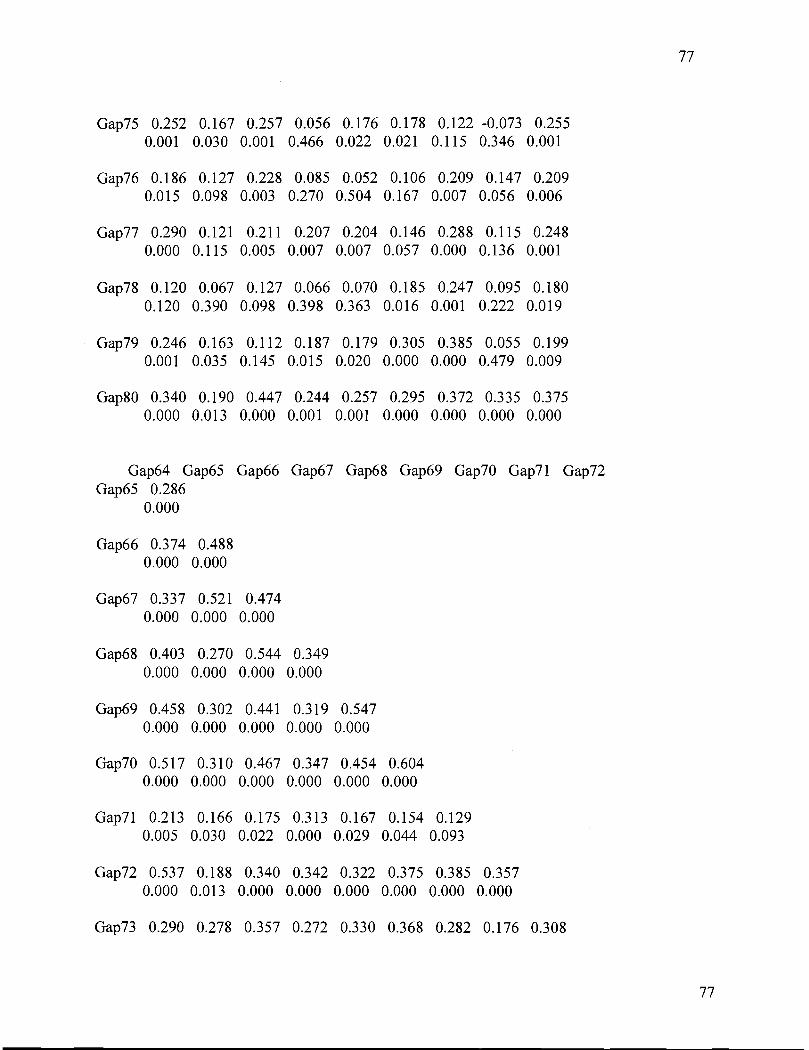


Cell Contents: Pearson correlation P-Value
Th esis Writin g Survival Skills Tuesday, February 7th 300-6:OOprn
11 1 Library Learning Center Reservations not Necessary
HANDS ON Workshop
*:* RefWorks o APA Style
o Research Paper Template o IRB/Human Subjects Overview
PRESENTER: Jana Reeg-Steidinger, Reference Librarian FOR MORE INFORMATION: JANA 1 XI553 1 [email protected]