a corporate valuation of dong energy - au...
TRANSCRIPT

Authors: Marc Nyvang Hassing: mh86702 Martin Nørgaard: mn87728 Master program: Finance & International Business Academic supervisor: Otto Friedrichsen Number of characters: 184,894 + 21 tables + 21 figures
A corporate valuation of DONG Energy An analysis of the appropriate IPO price
School of Business and Social Sciences – Aarhus University – Economic and Business’ - August 2014


I
ABSTRACT The purpose of this thesis is to construct an in depth corporate valuation analysis of DONG
Energy in the light of what would be an appropriate IPO price in the current market. A
valuation applying the DCF and Multiples approaches together with a research on IPO
discounts will be the main drivers in the process of estimating a final IPO price for DONG
Energy.
DONG Energy’s strategic position is analyzed through a strategic analysis focusing on
DONG Energy’s resources and competences as well as the over all outlook for the industry.
The strongest asset of DONG Energy is their high competences and strong position in the
growing offshore wind market. However, DONG Energy’s Exploration & Production
activities have also positive forecasts.
The trends of DONG Energy’s financial performance are analyzed through a financial
analysis including the period from 2007 to 2013. Despite a stable revenue growth no real
trends has been observed. However, recent years poor financial performance as well as a
heavy investment program in transforming the energy system has increased DONG
Energy’s credit riskiness. Despite recent poor financial performance the future outlook for
DONG Energy is positive as the investments made in the past are expected starting to
generate cash flows. Additional the equity injection of DKK 13 billion made in 2014 have
stabilize DONG Energy’s capital structure and secured the execution of transforming the
energy system.
Applying the comparable firm method, this thesis finds indications about underwriting
premiums in the Danish IPO market, which is not in line with existing empirical evidence
about IPO discounts. However, the results were not significant and must therefore be
interpreted with great caution. Discounts or premiums on the Danish IPO market was also
tested applying first day return as a proxy. These results were significant on a 10%
confidence level and provide evidence about an 11.34% discount on the Danish IPO
market. The thesis also tested if there was difference between the discount given inside and
outside an IOP wave. However, neither the comparable firm method nor the first day return
method found any significant results.
Combining the theoretical fair value estimate form the valuation approaches with an IPO
discount, DONG Energy’s equity value is estimated to DKK 52,525 million or DKK
123.45 per share.

II
LIST OF CONTENT
1"INTRODUCTION"____________________________________________________________________________________"1!
1.1!INTRODUCTION!___________________________________________________________________________________!1!
1.2!PROBLEM!STATEMENT!____________________________________________________________________________!2!
1.3!METHODOLOGY!___________________________________________________________________________________!2!
1.4!DESCRIPTION!OF!DATA!AND!ITS!VALIDITY!__________________________________________________________!3!
1.5!DELIMITATIONS! __________________________________________________________________________________!3!
1.6!STRUCTURE!_______________________________________________________________________________________!4!
2"DONG"ENERGY" _____________________________________________________________________________________"6!
2.1!DONG!ENERGY!AT!A!GLANCE! _____________________________________________________________________!6!
3"STRATEGIC"ANALYSIS"OF"DONG"ENERGY"______________________________________________________"9!
3.1!INTERNAL!ANALYSIS!OF!DONG!ENERGY!___________________________________________________________!9!
3.2!PESTEL!ANALYSIS!OF!DONG!ENERGY!___________________________________________________________!11!
3.3!PORTERS!FIVE!FORCES!ANALYSIS!OF!DONG!ENERGY!______________________________________________!18!
3.4!SWOT!ANALYSIS!DONG!ENERGY!________________________________________________________________!20!
3.5!CONCLUSION!ON!DONG!ENERGY’S!STRATEGIC!POSITION!__________________________________________!23!
4"DEFINING"VALUATION"APPROACHED"AND"THEIR"ELEMENT"FOR"DONG"ENERGY"____"24!
4.1!DISCOUNTED!CASH!FLOW!(DCF)!VALUATION!____________________________________________________!25!
4.2!THE!FREEECASHEFLOW!(FCF)!___________________________________________________________________!26!
4.3!THE!WEIGHTED!AVERAGE!COST!OF!CAPITAL!(WACC)! ___________________________________________!27!
4.4!RELATIVE!VALUATION!BY!MULTIPLES!_____________________________________________________________!34!
5"FINANCIAL"ANALYSIS"OF"DONG"ENERGY" ____________________________________________________"36!
5.1!REFORMULATING!OF!THE!FINANCIAL!STATEMENTS!_______________________________________________!36!
5.2!FREE!CASH!FLOW!(FCF)!_________________________________________________________________________!43!
5.3!ANALYSIS!OF!HISTORICAL!PERFORMANCE!IN!MORE!DETAILS!_______________________________________!44!
6"BUGETING"________________________________________________________________________________________"50!
6.1!REVENUE!________________________________________________________________________________________!51!
6.2!NOPLAT!________________________________________________________________________________________!52!
6.3!INVESTED!CAPITAL!_______________________________________________________________________________!54!
6.4!RIOC!____________________________________________________________________________________________!54!
6.5!FREE!CASH!FLOW!________________________________________________________________________________!55!
7"VALUATION"OF"DONG"ENERGY"________________________________________________________________"56!
7.1!DFC!VALUATION!_________________________________________________________________________________!56!
7.2!SENSITIVITY!ANALYSIS!___________________________________________________________________________!57!
7.3!RELATIVE!VALUATION!BY!MULTIPLES!_____________________________________________________________!60!

III
7.4!FAIR!VALUE!ESTIMATION!OF!DONG!ENERGY!_____________________________________________________!61!
8"INITIAL"PUBLIC"OFFERING"(IPO)" _____________________________________________________________"62!
8.1!INTRODUCTION!AND!MOTIVATION!________________________________________________________________!62!
8.2!REVIEW!OF!RELEVANT!THEORY!___________________________________________________________________!64!
8.3!REVIEW!OF!RELEVANT!EMPIRICAL!EVIDENCE!_____________________________________________________!67!
8.4!HYPOTHESIS!_____________________________________________________________________________________!69!
8.5!METHODOLOGY!__________________________________________________________________________________!71!
8.6!TEST!STATISTICS!_________________________________________________________________________________!77!
8.7!DATA!COLLECTION!_______________________________________________________________________________!79!
8.8!DESCRIPTIVE!STATISTICS!_________________________________________________________________________!82!
8.9!EMPIRICAL!EVIDENCE!____________________________________________________________________________!83!
8.10!CONCLUSION!___________________________________________________________________________________!88!
9"DONG"ENERGY’S"IPO"PRICE"____________________________________________________________________"89!
10"CONCLUSION,"DISCUSSION"AND"FURTHER"REASEARCH"_________________________________"90!
10.1!CONCLUSION!___________________________________________________________________________________!90!
10.2!DISCUSSION!AND!FURTHER!RESEARCH!__________________________________________________________!92!
11"BIBLIOGRAPHY"_________________________________________________________________________________"93!
12"APPENDICIES"___________________________________________________________________________________"97!

IV
LIST OF TABLES !
Table!1!(!Estimation!of!the!capital!structure!............................................................................................................................!28!
Table!2!(!Comparison!of!Cost!of!Debt!measures!.......................................................................................................................!30!
Table!3!(!Bottom(up!beta!calculation!..........................................................................................................................................!33!
Table!4!(!The!Danish!Corporate!tax!rate!....................................................................................................................................!34!
Table!5!(!The!WACC!for!DONG!Energy!.........................................................................................................................................!34!
Table!6!(!Highlights!of!2013!peer!group!data!...........................................................................................................................!36!
Table!7!(!Capitalization!of!operating!leases!..............................................................................................................................!42!
Table!8!(!Free!Cash!Flow!calculation!............................................................................................................................................!44!
Table!9!(!Forecasted!revenue!growth!...........................................................................................................................................!52!
Table!10!(!Forecasted!costs!of!sales!..............................................................................................................................................!53!
Table!11!(!Forecasted!operating!cash!tax!rate!for!DONG!Energy!....................................................................................!53!
Table!12!(!Forecasted!invested!capital!growth!rate!for!DONG!Energy!.........................................................................!54!
Table!13!(!Expected!future!ROIC!for!DONG!Energy!................................................................................................................!55!
Table!14!(!Expected!future!free!cash!flow!for!DONG!Energy!..............................................................................................!55!
Table!15!(!The!effect!of!a!ROIC!at!10%!in!2016!and!12%!in!2020!...................................................................................!60!
Table!16!(!Fair!value!estimate(model!...........................................................................................................................................!62!
Table!17!(!Financial!report!associated!with!the!month!of!IPO!.........................................................................................!74!
Table!18!(!Search!strategy!(!Initial!sample!form!Zephyr!.....................................................................................................!80!
Table!19!(!Descriptive!statistics!from!the!comparable!firm!approach!..........................................................................!82!
Table!20!(!Descriptive!statistics!for!first!day!return!..............................................................................................................!83!
Table!21!(!Results!of!test!statistics!and!critical!values!.........................................................................................................!85!

V
LIST OF FIGURES !
Figure!1!(!The!thesis!structure!............................................................................................................................................................!5!
Figure!2!(!PESTEL!analysis!of!DONG!Energy!.............................................................................................................................!12!
Figure!3!(!GCP,!CO2,!and!gross!energy!consumption!in!the!Danish!market!................................................................!13!
Figure!4!(!Historical!development!in!selected!commodity!prices!.....................................................................................!14!
Figure!5!(!Conclusion!on!Porters!Five!Forces!............................................................................................................................!19!
Figure!6!(!SWOT!analysis!of!DONG!Energy!................................................................................................................................!21!
Figure!7!(!Comparison!of!Business!Performance!and!IFRS!.................................................................................................!38!
Figure!8!(!The!development!in!DONG!Energy's!equity!(2007(2013)!..............................................................................!40!
Figure!9!(!DONG!Energy's!historical!ROIC!..................................................................................................................................!45!
Figure!10!(!Breakdown!of!Invested!Capital!(average!numbers)!......................................................................................!46!
Figure!11!(!Revenue!growth!analysis!...........................................................................................................................................!47!
Figure!12!(!Trend!and!common!size!analyses!for!segment!revenue!...............................................................................!47!
Figure!13!(!Analysis!of!costs!as!a!percentage!of!revenue!.....................................................................................................!49!
Figure!14!(!Common!size!analysis!of!EBITDA!on!segment!level!.......................................................................................!49!
Figure!15!(!Calculating!the!value!of!DONG!Energy!................................................................................................................!56!
Figure!16!(!Sensitivity!analysis!on!NOPLAT(drivers!..............................................................................................................!57!
Figure!17!(!Sensitivity!to!change!in!the!WACC!.........................................................................................................................!58!
Figure!18!(!Sensitivity!to!change!in!RONIC!................................................................................................................................!59!
Figure!19!(!Summery!of!multiples!valuation!.............................................................................................................................!61!
Figure!20!(!Number!of!Danish!IPOs!previous!trailing!twelve!months!from!1997!to!2014!....................................!84!
Figure!21!(!IPO!pricing!model!..........................................................................................................................................................!89!

1
1 INTRODUCTION
1.1 introduction The purpose of this thesis is to construct an in depth corporate valuation analysis of DONG
Energy in the light of what would be an appropriate IPO price in the current market.
Different valuation approaches, and a research on IPO discounts will be the main drivers in
the process of estimating a final IPO price for DONG Energy. Both authors have a great
interest within the field of finance, and particular in corporate valuation and investment
banking. This thesis is seen as an excellent opportunity to use the knowledge acquired
throughout the years of studying, and to get the chance to dig deeper into the field of
corporate valuation and investment banking.
Recently global stocks have increased in value and indices such as S&P500 and the Danish
C20 are now traded around its nominal all time highs. This is a strong indication of a high
demand for equity investments, and as every economist should know, a high demand is best
satisfied with a lager supply. Thus, it might be a good time to put some new products on the
shelves. An increase in IPO activity has already been observed in 2013 and the IPO outlook
for 2014 is positive due to an overall positive global macroeconomic outlook (Pinelli,
Kelley, Choi, Steinbach, & Suszuki, 2013). Despite a high demand for equity, going public
is not an easy task and hiring an investment bank as the middlemen between companies and
the investing public is mandatory. The investments bank’s job is besides advisory, to set an
introduction price. In regard to IPO’s, this thesis will assess how much value is left on the
table in the IPO underwriting process. The Danish IPO market is the primarily interest for
this thesis, where we recently have seen introductions of Matas, ISS and OW Bunker.
DONG Energy is chosen as the case company for this thesis for more reasons. Firstly the
recent media debate about DONG Energy and its involvement with Goldman Sachs make it
an interesting and actual case. Further, DONG Energy is an interesting case from a
valuation point of view, as it works within multiple business units and is in a
transformation process. Finally, DONG Energy is interesting because it is expected to go
public listed within a few years.

2
1.2 Problem statement Estimating the value of a non-listed company is subject to uncertainty above the normal, as
it cannot be verified by the market’s opinion. The task of valuing an upcoming IPO is
complicated further by strategic price aspects, such as market sentiment. Thus, this
corporate valuation analysis of DONG Energy will apply different valuation methods to
determine a fair value price. An additional element to the valuation will be a research on
IPO discounts, in particular on the Danish market. Further, this thesis will review empirical
evidence on IPOs, including benefits and challenges linked to IPOs, and finally evaluate the
effect on the Initial Public Offering price for DONG Energy.
Thus, the overall goal is to give an answer to what would be the appropriate Initial Public
Offering price for DONG Energy primo 2014, and the key objectives are to answer the
following research questions:
E How is DONG Energy’s strategic situation?
E Which valuation approaches are most appropriate for valuing DONG Energy?
E What is the best estimate for DONG Energy’s cost of capital?
E What is the theoretical correct fair value estimate of DONG Energy?
E What are the general benefits and challenges of an IPO?
E How much if any value is left on the table in the IPO underwriting process?
E Does IPO discounts vary inside and outside of IPO waves?
1.3 Methodology This thesis works within the field of social sciences, meaning that there is no objective truth
about what is the right price for DONG Energy or other companies for that matter.
However, whether you believe in the efficient market hypothesis (EMH) or not, the market
price must be the closes to an objective price. Market prices fluctuate on a daily basis, and
reflect the data available to the market participants. DONG Energy is not yet a public
traded company, and has therefore no direct observable market value. Hence, the purpose
of this thesis is based on valuation approaches and IPO market sentiment aspects, to
estimate a final offering price for DONG Energy. This process will involve a large amount
of information and data. Thus, assumptions about how to handle this information and data,
in the best suitable way, have to be established. Information about DONG Energy and the
energy sector in general will be obtained through large, and competent sources such as
MarketLine, Energistyrelsen, and the European commission. For the financial analysis

3
DONG Energy’s published annual reports will be used as raw data. This data will be
reformulated in order to satisfy the requirements needed for the data input to the actual
valuation. The transformed data will primarily be applied in the discounted cash flow
(DCF) valuation approach in order to contribute to estimating a theoretical fair value for
DONG Energy. The corporate valuation will mainly be conducted after the method stated
in Koller et al. (2005). Secondary inputs are conducted from Damadoran (2012) and
Penman (2013). Thus, a solid theoretical basis forms the foundation for a reliable valuation.
The information and data about DONG Energy, the energy sector and corporate valuation
approaches were obtained without significant challenges. However, finding data on the
Danish IPO market was much more challenging and complex. This is elaborated on in more
details in section 8.
1.4 Description of data and its validity The data used for the corporate valuation of DONG Energy rely on public available
information; i.e. reports, webpages and articles. These sources all contribute to a detailed
knowledge about DONG Energy and their operating markets from a historical and future
point of view. In general these sources are considered objective, as independent parties
verify them. However, the authors are aware that information from DONG Energy’s
webpages and to some extent the information presented in their annual reports can be
biased. After all it must be kept in mind that DONG Energy are preparing for an IPO, and
thus want to look as good as possible.
The knowledgebase about corporate valuation, are obtained through Koller et al. (2005),
Damadoran (2012), and Penman (2013). All works are broadly accepted within the field of
valuation and are often used as textbooks at universities all over the world. As a supplement
various articles and empirical research data will contribute to complete the knowledgebase
about corporate valuation. The literature about IPO is obtained through academic article
databases, such as Business Source Complete and ScienceDirect. Thus, their results are
considered valid as they are based on broadly accepted research methods. The data input
for the analysis of the Danish IPO market is retrieved from Thomson One, which is one of
the world’s major data providers. Thus, these data are also considered valid.
1.5 Delimitations The value of DONG Energy will only be determined from the pre-selected valuation
approaches: Discounted Cash Flow valuation (DCF), and Relative valuation (multiples).
Hence, alternative valuation approaches such as Event Tree Analysis, Decision Tree
4
Analysis, Real Options Analysis, Adjusted Present Value, and Adjusted Value Added etc.
are omitted from this thesis. Hence, the conclusion is not as strong as it could have been if
it was verified by more valuation methods.
The strategic analysis is not the main driver for this thesis, and contains only the most
important strategic analyses. For a greater precision about DONG Energy, their products,
and the energy sector, the strategic analysis could have been expanded with a value chain,
product life cycle, Boston matrix, etc. However, the included models are considered to
provide the readers with the necessary information about DONG Energy’s strategic
position.
As a consequence of large investments in oil and gas fields as well as in offshore wind
projects, DONG Energy holds large tax loss carry forwards and unrecognized deferred tax
assets. These assets do affect the value of DONG Energy’s future cash flows, which to
some extent is accounted for in the tax estimating. However, the exact effect is considered
outside the scope of this thesis.
Additional the stock option program is also considered outside the scope of this thesis, as
its value is associated with some uncertainty. However, assuming a doubling of the value
towards the IPO the value would have been approximately DKK 1.5 billion (Ritzau, 2014).
The effects of the current fluctuations in DONG Energy’s capital structure due to the DKK
13 billion equity injection and divestment in operating as well as non-operating activities
are not incorporated in the capital structure estimation, and hence DONG Energy’s cost of
capital. Thus, a constant cost of capital is applied throughout the thesis even that a year-to-
year estimation would have increased the accuracy of the DCF model. However, the value
of the FCF towards 2020, only accounts for 15% of the total value and the effect on the
total value of a year-to-year estimation of cost of capital is considered insignificant.
Additional delimitations and assumptions will be made throughout the thesis when deemed
necessary.
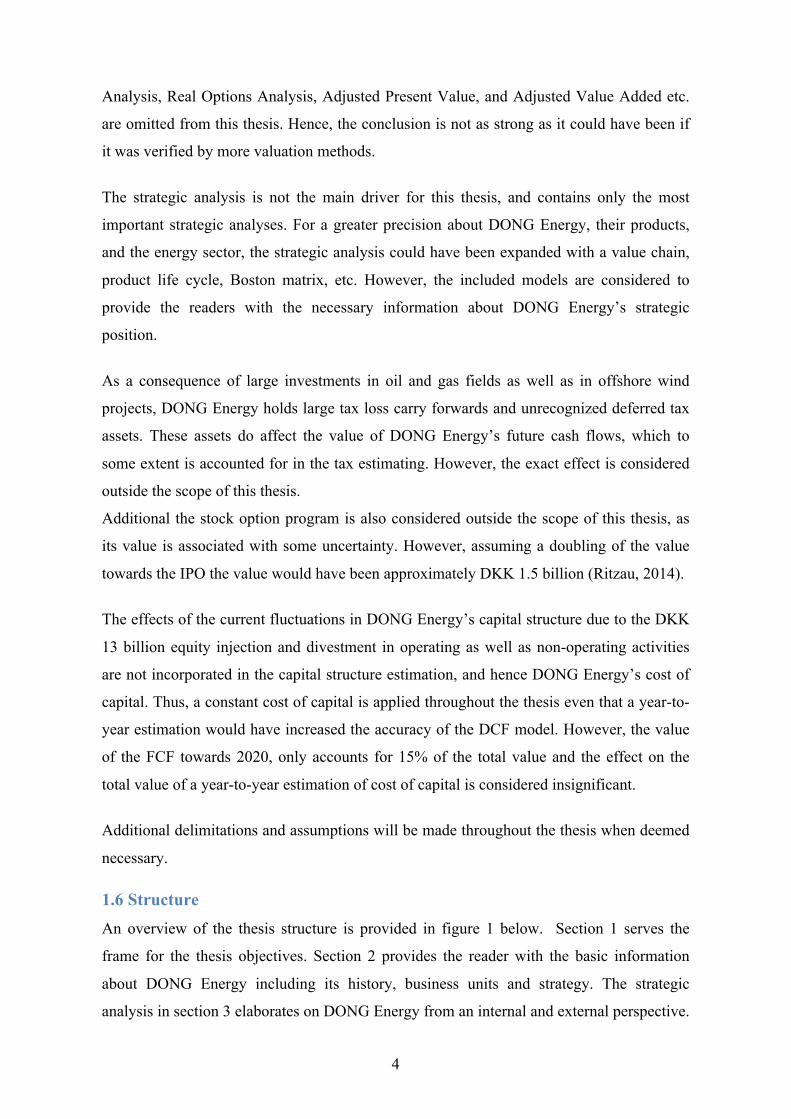
1.6 Structure An overview of the thesis structure is provided in figure 1 below. Section 1 serves the
frame for the thesis objectives. Section 2 provides the reader with the basic information
about DONG Energy including its history, business units and strategy. The strategic
analysis in section 3 elaborates on DONG Energy from an internal and external perspective.
5
Thus, it provides inputs to the budgeting about the energy sectors and in particular DONG
Energy’s future outlook. Section 4 is a very important section, as it justifies the choice of
why the DCF and Multiple valuations are most appropriate for DONG Energy.
Furthermore, section 4 defines DONG Energy’s cost of capital. Sections 5 reformulate and
analyze the financial statements to understand the historical trends of DONG Energy’s
financial performance. The conclusions form section 3 and 5 are used to forecast DONG
Energy’s future financial performance in section 6. Based on the estimations form section 4
and 6, DONG Energy’s theoretical fair value including a sensitivity analysis is estimated in
section 7. Section 8 about IPO’s contributes with an alternative input to a classic corporate
valuation. It provides the reader with an insight into the IPO world, and in particular, into
how much value, if any, is left on the table when a company is going public. Section 9
summarize the inputs from all valuation aspects including the IPO research in a weighted
model, which defines the final Initial Public Offering price for DONG Energy. Finally, all
significant findings are summarized in a conclusion and possible future research on the
Danish IPO market as well as valuation issues about DONG Energy are discussed at the
very end.
Figure 1 - The thesis structure
Own construction.

6
2 DONG ENERGY
2.1 DONG Energy at a glance The history goes back to the 27th of March 1972, where the Danish state founded Dansk
Naturgas A/S. The company was created as a vehicle to develop Danish energy activities.
In 1973 the name changed to Dansk Olie og Naturgas A/S and in 2002 it was changed to
DONG. DONG Energy A/S was established in 2006 through a merger of six Danish energy
companies; DONG, Energi E2, Elsam, Nesa, Frederiksberg Forsyning, and Københavns
Energi (DONG Energy A/S, 2014d).
The majority owner of DONG Energy is the Danish State which owns 57.3%. DONG
Energy got a DKK 13 billion equity injection in February 2014, where DKK 11 billion was
from new investors and DKK 2 billion was from existing minority-shareholders. This
equity injection reduced the majority ownership of the Danish State from 81.0% to 57.3%
and gave three new institutional investors; Goldman Sachs, ATP and PFA an ownership
share of respectively 18.0%, 4.9% and 1.8% (DONG Energy A/S, 2013b). The ownership
share of 18% in DONG Energy by Goldman Sachs was a widely discussed topic in the
Danish society during the beginning of 2014, because the Danish State is the Majority
owner. Meaning that DONG Energy is actually owned by the Danish people, who are very
skeptical about American investment banks such as Goldman Sachs. The ownership
composition before and after the equity injection is illustrated in appendix A.
Dong Energy has expanded significantly through both organic growth and several
acquisitions in Denmark and across Europe. Today, DONG Energy is one of the leading
energy groups in Northern Europe. DONG Energy is headquartered in Denmark and has
about 6.500 employees (DONG Energy A/S, 2013b). Dong Energy had revenue of DKK
73.105 billion and a net loss for the year of DKK 993 million in 2013, which was an 8.8%
increase in revenue and an improvement of 3.028 million in the net loss compared to 2012
(DONG Energy A/S, 2013b). As illustrated in appendix B, the revenue of DONG Energy
in 2013 was mainly generated in Denmark and the United Kingdom, with 47.06% and
26.65% respectively (DONG Energy A/S, 2013b). The Netherlands, Germany, Norway and
others accounts for respectively 13.53%, 8.33%, 2.55% and 1.88% of revenue in 2013
(DONG Energy A/S, 2013b).

7
DONG Energy supplies natural gas, oil, renewable energy, and electricity to customers in
Denmark, Norway, the Netherlands, the United Kingdom, Germany, France and Sweden.
DONG Energy is an integrated energy company and engaged in the exploration and
production of oil and gas, power generation, gas distribution, and wholesale energy
(MarketLine, 2013). DONG Energy’s operations can be divided into four different business
segments; Exploration & Production, Wind Power, Thermal Power, and Customers &
Markets.
Exploration & Production explores and produces oil and natural gas, which means they are
engaged in the upstream part of the oil sector. The activities of the Exploration &
Production business segment are focused on seas surrounding Denmark, Norway, the
United Kingdom, the Faroe Islands, and Greenland. Exploration & Production produced
approximately 87,000 BOE1 per day in 2013 and the target production by 2020 is 150,000
BOE per day (DONG Energy A/S, 2013b). In 2013, 15% of DONG Energy’s total revenue
came from this business segment.
The Wind Power business segment of DONG Energy has over 20 years experience within
offshore wind farm development and is a market leader in offshore wind power, having
built 35% of European offshore windmill capacity. Wind Power develops, constructs, and
operates wind farms in Denmark, France, Norway, and Sweden, as well as the UK and
Germany which are the largest growth markets (DONG Energy A/S, 2014b). Wind Power
work with all aspects of developing and constructing a wind farm, except actual production
of windmills, which includes the steps from early development to the construction phase
and operating and maintenance of the wind farms. Wind Power has developed and
constructed the largest portfolio of offshore wind farms in Northern Europe, which are
mainly located in the seas around Denmark, Germany and United Kingdom. Wind Power
has installed an offshore wind capacity of 2.1 GW in 2013 (DONG Energy A/S, 2013b) and
has a target of installed offshore wind capacity reaching 6.5 GW by 2020. In 2013, 14% of
DONG Energy’s total revenue came from this business segment (DONG Energy A/S,
2014a).
The Thermal Power business segment focuses on providing stable electricity and heat
production, while reducing the CO2 emissions in energy production. Most of Thermal
Power’s power stations combine production of electricity and heat. Thermal Power has
1!Barrels!of!Oil!Equivalent.!!

8
focus on optimizing the current thermal-based production, but also increasing the use of
CO2-neutral biomass. Thermal Power has nine central power stations and one waste-to-
energy plant in Denmark and one gas-fired power station in the Netherlands. Thermal
Power has a target of over 50% of electricity and heat generation in Denmark coming from
biomass by 2020 (DONG Energy A/S, 2013b). The Thermal Power business segment is the
smallest of the four business segments measured by revenue, with only 12% of total
revenue coming from this business segment in 2013 (DONG Energy A/S, 2014a).
Customers & Markets handles DONG Energy’s customer and market-related activities
within trading, distribution and sale of electricity and natural gas to the Northern European
markets. Customers & Markets is responsible for buying and selling electricity and gas to
wholesale, business and residential customers in Denmark, Germany, the United Kingdom,
the Netherlands, and Sweden. Customers & Markets is a leading Danish distributor of
electricity and gas with market shares of 26% and 28% respectively. One of the targets of
Customers & Markets is to quadruple energy saving by their Danish customers by 2020.
The Customers & Markets business segment is by far the largest of the four business
segments measured by revenue, with 59% of total revenue coming from this business
segment in 2013 (DONG Energy A/S, 2014a).
The equity injection of DKK 13bn in Dong Energy from Goldman Sachs, ATP and PFA
has happened in an agreement between the shareholders of DONG Energy to seek an Initial
Public Offering (IPO) of DONG Energy, when the timing and market conditions are right.
The Danish State will remain majority shareholders in a potential future IPO which is
completely in line with a political agreement by a majority of the Danish Parliament
(DONG Energy A/S, 2013a). If an IPO of DONG Energy has not been completed
following the presentation of the 2017 annual financial statements, the new investors
(Goldman Sachs, ATP and PFA) has the option to sell their shares back to the Danish State
on pre-agreed terms (DONG Energy A/S, 2013d). This agreement means that DONG
Energy will seek to go public before the beginning of 2018, where the financial statements
for the year 2017 are presented. The IPO will happen when shareholders agree that the
timing and market conditions are right and with the current rally in the equity markets, the
IPO might not be in too a distant future. This thesis will analyze what the correct valuation
of DONG Energy is, if DONG Energy were to complete an IPO primo 2014.

9
3 STRATEGIC ANALYSIS OF DONG ENERGY The purpose of this strategic analysis is to keep DONG Energy’s strategic objectives up
against their resources and competences as well as the opportunities in the external
environment. The strategic analysis will together with the financial analysis in section 5
form the basis for the budgeting and thereby create value for the valuation of DONG
Energy. The analysis will not elaborate on the theories, but rather focus on the output form
the analyses tools applied. The strategic analysis will consist of an internal analysis, an
industry analysis, and a macro-environment analysis, which will be summarized in a
SWOT analysis in the end of this section.
3.1 internal analysis of DONG Energy The purpose of this internal analysis of DONG Energy is to provide a basic understanding
about the resources and competences held by DONG Energy, and whether these resources
and competences create sustainable competitive advantages. This internal analysis will
focus on how DONG Energy as a company creates value through its business activities.
However, instead of using the classic Value Chain framework developed by Michael Porter
back in 1985 step by step, this analysis only focuses on the value drivers in DONG Energy
that create value for the valuation part of this thesis. Thus, this analysis will be on a
corporate level and not on a business level, which could have been justified as each
business unit do have its own value chain.
3.1.1 A well diversified and integrated business model
In the description of DONG Energy it was mentioned that DONG Energy holds an
integrated business model. Thus, DONG Energy creates value in all stages of the energy
value chain, as they are active within exploration and production of oil and gas, power
generation, gas and el distribution, and wholesale of energy. This integrated and well
diversified business model has a stabilizing effect on DONG Energy’s cash flows and
overall risk profile, resulting in competitive advantage against less diversified peers in the
sector (MarketLine, 2013).
Exploration!&!Production!of!oil!and!gas!
Power!generation!
Energy!distribution!
Wholeslae!of!energy!

10
3.1.2 High expertise in offshore wind power projects
Currently, DONG energy is one of the world’s leading players in the offshore wind power
sector, where they develops, construct, and operates wind farms in Denmark, France,
Norway, Sweden, Germany, and UK (DONG Energy A/S, 2013b). DONG Energy has built
38% of the European offshore wind capacity and with more than 20 years of experience
within the offshore wind power sector, DONG Energy holds unique knowledge and skills
about all aspects of offshore wind projects (DONG Energy A/S, 2014b). Thus, DONG
Energy has a strong position in a growing market. In 2013 45% of DONG Energy’s gross
investment were invested in offshore wind and a strong pipeline of projects are lined up for
the future (DONG Energy A/S, 2013b). However, DONG Energy’s strong position and a
global focus towards more clean energy, it is still a challenge to make wind power
competitive to other energy sources. Therefor DONG Energy needs to focus on bringing
down the cost through technical developments and overall optimizations of processes.
DONG Energy’s goal is to bring the cost of electricity from offshore below 100 €/MWh. by
2020. If DONG Energy manages to bring down the costs on offshore wind energy, they are
expected to take an even stronger position in the market.
The business unit Wind Power uses a unique partnership model that attracts large
institutional and private investors. The model enables long-term investments in offshore
wind farms, where DONG Energy share cost and earning with the partners (DONG Energy
A/S, 2014b). Hence, it is possible to expand the capital base and at the same time spread the
risk of invested capital. The Wind Power business unit is currently performing a return on
capital employed (ROCE) of 4.6%, but based on DONG Energy’s competences and heavily
investments, as well as a political focus on clean energy, DONG Energy expects a return on
capital employed ROCE of 12-14% in 2020 (DONG Energy A/S, 2013b). The Wind Power
is considered to deliver relative stable income and will in the future contribute more and
positively to DONG Energy’s financial performance.
3.1.3 Leading and innovative company in the transformation of the energy system
DONG Energy wants to lead on in the transformation of the energy system towards
benefitting its stakeholders, including the environment by converting the strongest
technological breakthroughs to value-creating business models, products, services, and
systems (DONG Energy A/S, 2014e). Open innovation through strategic partnerships with
inter alia, Copenhagen University, Technical University of Denmark (DTU), related
companies, suppliers, and costumers, is one-way, DONG Energy tries to stand out and be

11
on top with the development in sustainable energy. With the establishment of Inbicon, the
world’s largest demonstration plant of second-generation bioethanol, DONG Energy is in a
strong position for the future bioethanol market. Furthermore, DONG Energy has filed a
number of patents in the bioethanol industry (DONG Energy A/S, 2014e), providing basis
for creating competitive advantages and hence the possibility for high margins.
3.1.4 Conclusion on the internal analysis
Technology is essential in all aspects of transforming the energy system. DONG Energy
invests heavily in new technologies and is well positioned in their markets, particular
within the offshore wind market, where DONG Energy is a world-leading player. Flexible
and effective production facilities are how DONG Energy will compete in the global
energy market.
In regard to the valuation of DONG Energy, this internal analysis will be used in the
budgeting process, as it provides an understating of DONG Energy’s value creating
activities. However, it does not give specific input data for the budgeting. These inputs will
instead be based on DONG Energy’s own and the market expectations.
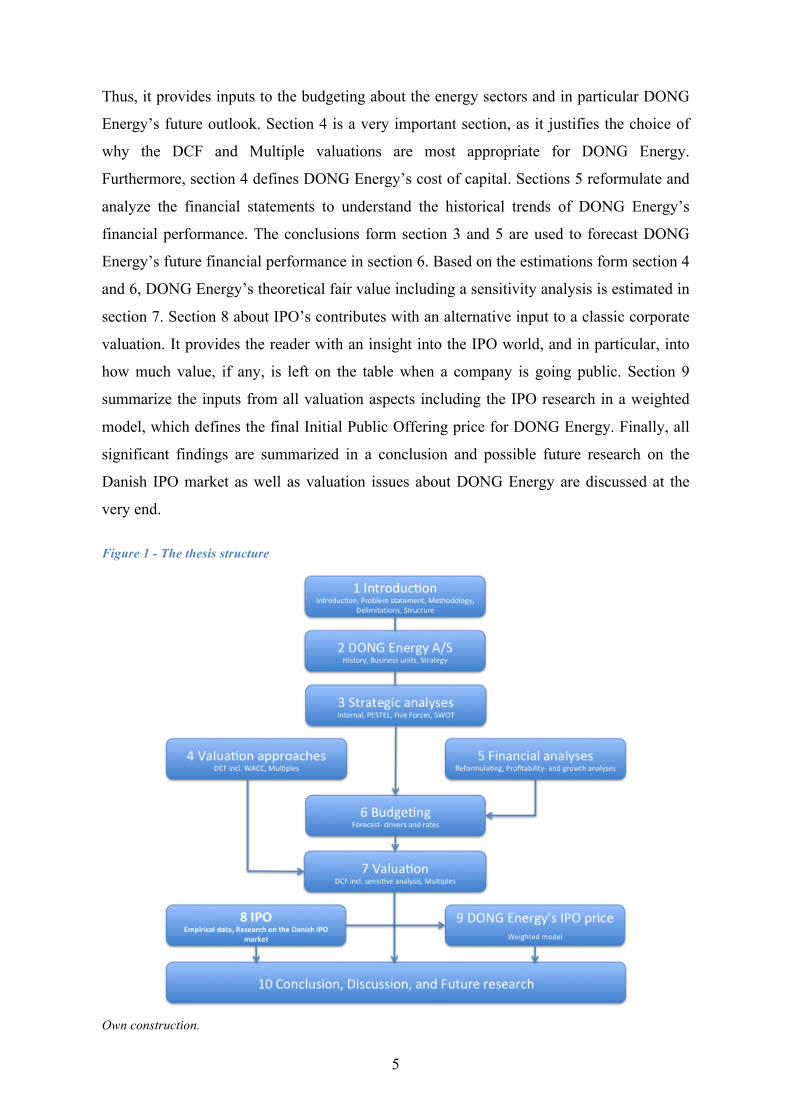
3.2 PESTEL analysis of DONG Energy
The purpose of the PESTEL analysis is to examine the most significant macro-environment
aspects, influencing DONG Energy. The PESTEL analysis distinguishes to some extent
between DONG Energy’s different business units and markets as each business unit and
market is exposed to specific external opportunities and risks. However, the Danish market
is considered as the main market and thus the main interest for this thesis. In general the
external environment is important to consider in order to make the right strategic decisions;
i.e. which markets and business units to focus on, and invest in.
12
Figure 2 - PESTEL analysis of DONG Energy
Own construction.
3.2.1 Political and legal factors influencing DONG Energy
It is no secret that the energy market is highly regulated and influenced by political
decisions. Last year the Danish parliament presented a new concrete climate plan, as part
of a comprehensive goal, aiming to reduce greenhouse gases by 40% in 2020 relative to the
1990 level (Kebmin.dk, August 2013). However, Denmark is not the only country focusing
on reducing greenhouse gasses. Germany, UK, Norway, and Sweden do also have
ambitious goals (Klimaplan, 2013). It is also worth noticing that DONG Energy is
operating in all these market. In general, EU is focusing on creating a better climate and has
adopted specific legal acts in order to support this process (Folketinget, August, 2013). One
of these acts is the CO2 emission trading system, which basically make it more expensive
to produce CO2. The climate is also on the agenda on a global scale, where the Kyoto
agreement set different but ambitious goals throughout the world. The political regulations,
focusing on climate friendly energy, is something DONG Energy already uses actively in
their strategy; i.e. heavy investments in wind-power, advanced bioethanol, and modern
power plants (DONG Energy A/S, 2013b).

13
In regard to DONG Energy’s business activities, political decisions about subsidies, tax
policies and exploration licenses are of important character in order to sustain competitive.
Without subsidies and taxes, wind-power and other renewables cannot compete with other
energy sources in the current market and without exploration licenses, DONG Energy’s
resources are limited (DONG Energy A/S, 2013b). Subsidies are partly finance through
Public service obligations (PSO), a public tariff imposed on consumers.
A merger of six companies founded DONG Energy back in 2006. At that time the
European Competition Authority approved the merger conditional. A divestment in a gas
field was one of the conditions required in order to complete the merger. EU and Denmark
in particular have taken steps towards a more liberalized energy market. Since 2003, the
European energy market has been considered a free market, as consumers have free
supplier choice (Energistyrelsen, 2013a). Furthermore, Dong Energy’s activities in
Denmark are regulated by the Electricity Supply Act, which aims to ensure that the
country's electricity supply is planned and implemented in accordance with the interests of
security, economy, environment, and consumer protection (lov om elforsyning, 2013).
Thus, prices and customer services are considered as important competitive parameters in
the energy market.
3.2.2 Economic factors influencing DONG Energy
In general, every sector is affected by the development in the overall economy in one-way
or another, as it influence the demand after goods and services. The energy sector is no
exception, however, it is not that sensitive to volatility in the over all economic conditions,
as energy is indispensable in the modern society (DONG Energy A/S, 2013b).
Figure 3 - GCP, CO2, and gross energy consumption in the Danish market
Own construction based on numbers from Energistyrelsen.dk

14
Despite an increased GDP, Figure 3 documents that the actual energy consumption in the
Danish market has been very stabile throughout the period from 1990. This is possible due
to a better utilization of the energy produced, and thus a lower CO2 emission, which can be
linked to the political initiatives stated above. Due to all the political actions and
regulations in the energy market, the trend of better energy utilization is expected to
continue going forward. Thus, DONG Energy, and other companies in the energy sector
have to transform their production to rely more on climate friendly energy sources.
Furthermore, the climate protection trend opens up an opportunity within the energy
consulting business.
Oil, gas, coal and, el are important sources in the energy sector, and fluctuations in prices
affect the profitability across the different energy sources. The prices are determined by
supply and demand and figure 4 illustrates how volatile selected commodity prices have
been historical.
Figure 4 - Historical development in selected commodity prices
Own construction based on numbers from Eurostat and DataStream. DONG Energy’s business unit Exploration & Production is highly exposed to the
development in especially oil and gas prices. Because of the high uncertainty about future
energy prices the price imbalance between sales and procurement present a risk, as
purchase contacts are negotiated for longer time periods (DONG, 2013). To reduce market
price risk and fluctuations in cash flows, DONG Energy applies hedging instruments
(DONG, 2013). However, DONG Energy’s 2020 strategy transform their risk profile and
strives to reduce the exposure to variation in market prices. Already by 2016, DONG
Energy expects to reduce their electricity generation from power stations and wind farms
sold at market prices to below 10%. In comparison, 2/3 of the electricity generation was
sold at market prices in 2007 (Dong, 2013). On the other hand, DONG Energy expects to

15
increase the proportion of electricity generation settled at fixed prices from 10% in 2007 to
about 60 % in 2016 (DONG, 2013).
In general, variation in exchange rates effects an international company. The currencies of
principal to DONG Energy are GBP, USD and NOK. However, DONG Energy does apply
hedging instrument to reduce their exposure to variation in exchange rates to a minimum.
At the end of 2013 DONG Energy was exposed to GBP, USD and NOK by respectively 0.4
billion, 2.6 billion and 0 billion (DONG, 2013).
3.2.3 Socio-cultural factors influencing DONG Energy
Today, the world population have exceeded 7.2 billion people and are expected to reach 8
billion in the spring of 2024 (Worldometers, 2014). Thus, the demand for energy will
increase going forward. Furthermore, Energy is something affecting the day-to-day life for
almost everybody in the modern society. Without energy, people would not be able to turn
on their TV, heat up their houses, or fill up their car with fuel. Even though most of the
population growth is outside EU, the trend of people depending more and more of energy
will still affect DONG Energy positively. To meet the future demand, DONG Energy is
investing in new energy solutions which can compete with traditional energy sources such
as coal, oil, and gas (DONG Energy A/S, 2013b).
Coal, oil, and gas are to some extent limited, and currently 75% of the EU energy comes
from coal, oil, and gas. Additional, two thirds of the fossil fuels in EU are imported
(DONG Energy A/S, 2013c). Therefore alternative energy sources are needed in the future.
DONG Energy has started a journey involving a transition to more renewable energy with
less impact on the environment (DONG Energy A/S, 2013c). This is a clear indication that
the energy sources will change in the years to come.
Today, renewable energy accounts for 11% of EU's energy consumption and is expected to
have a value of $252.3 billion in 2017, compared to a value of $170.4 billion in 2012
(MarketLIne, July 2013,). Thus, the trend is going towards more clean energy in the
European market. As a significant player in the renewable energy market DONG Energy is
well positioned to take a share in the coming development, which may have a positive
effect on DONG Energy’s growth outlook.

16
3.2.4 Technological factors influencing DONG Energy
Technology is a key factor in the process of achieving the ambitious goals set by politicians
around the world. The current situation in the European energy market is that many power
stations are old and will be decommissioned in the next couple of decades (DONG Energy
A/S, 2013c). Thus, more modern and more efficient ones will replace these power stations.
Furthermore, the oil and gas production in EU is declining, and that makes EU a net
importer of oil and gas (DONG Energy A/S, 2013c). Therefore new technologies are
required to make EU less dependent on oil and gas, as well as make the energy production
more sustainable.
One way to become less dependent on oil and gas while, at the same time care more about
the environment is wind power and offshore wind power, in particular. In theory, the
potential of offshore wind will be able to supply 80% of the EU with electricity in 2030
(DONG Energy A/S, 2013c). Currently, DONG Energy has installed offshore wind farms
with the capacity to supply 5 million Europeans. However, a focus on innovation together
with continuing investments will increase DONG Energy’s offshore wind capacity to
supply 15 million by 2020 (DONG Energy A/S, 2013c).
Another alternative to fossil fuels, which have been available through technological
breakthroughs, is biomass (DONG Energy A/S, 2013c). Biomass energy is greener than
fossil fuels and more stabile than wind and solar power (DONG Energy A/S, 2013c).
Even though wind power and other renewable energy sources look more and more as the
answer to the future electricity production sources, oil and gas are still important energy
sources in the modern society. Actually, oil and gas are estimated to account for 53% of
EU’s energy consumption in 2035 (DONG Energy A/S, 2013c). Thus, it is important
continuously to develop new technologies to discover and extract oil and gas in the
underground. The development for extracting shale gas is an excellent example of how a
new technology can change the supply, and thus the prices in a market (Team Trefis,
February 2014).
One challenge with wind power is that it is not possible, or at least very expensive, to store
the produced energy. However, an intelligent energy system, named Smart grid, will make
the energy system more flexible; i.e. an integrating of the production, transmission,
distribution, and management of consumption. An important condition to make Smart grid
a reality is remote reading of electricity meters and hourly settlement. Hence, making

17
energy consumers able to react on price signals and take advantage of the opportunities to
move their energy consumption. The Danish parliament agreed in 2013 on establishment of
this technology remote reading of electricity meters and hourly settlement all over Denmark
by the end of 2020 (Energistyrelsen, 2013b).
3.2.5 Environmental factors influencing DONG Energy
DONG Energy has a central role in the transformation towards a greener society. As an
energy provider, DONG Energy carries a large responsibility in the process of reducing
CO2 emissions. DONG Energy has already undertaken its social responsibility by focusing
on renewing energy for society, supplying energy at competitive prices and producing
cleaner energy, such as offshore wind power and biomass energy (DONG Energy A/S,
2013c).
In general, the environment and society are top priorities in the way DONG Energy do
business. However, if DONG Energy is not able to secure a sound return for its owners,
they cannot maintain business in the long term. In the report DONG Energy in society,
DONG Energy does officially work with the concept corporate social responsibility, which
is a balanced approach for organizations to address economic, social, and environmental
issues in a way that aims to benefit people, communities, and society (Leonard & McAdam,
2003).
DONG Energy is not the only company focusing on corporate social responsibility (CSR).
Organizations continuously demonstrate increased commitment to CSR, as they consider it
necessary to define their role in society in order to create value to its stakeholders
(Lindgreen & Swaen, 2010). One part of CSR is the environment, which, among others,
does involve energy. DONG Energy provides advisory service on how in particular large
corporation can reduce energy consumption for the benefit of both the environment and
their competitive advantages. Currently, DONG Energy has entered into over 135 climate
partnership agreements (DONG Energy A/S, 2014c)
3.2.6 Conclusion on the PESTEL analysis
One of the most important macro-environmental factors to DONG Energy is the global
focus on clean energy. In the coming period, political subsidies and regulation are of
important character to make clean energy competitive, in particular offshore wind. At some
point in the future, new technologies and a socio-cultural attitude towards clean energy,
will contribute to make clean energy both competitive and attractive. Thus, contribute to

18
make the world less dependent on fossil energy sources. However, DONG Energy is not
just offshore wind power, and is thus also affected by other factors than a global focus on
clean energy. A large proportion of the revenue in DONG Energy is directly, or indirectly
linked to the development in the commodity prices: oil, gas, el, and coal. The profitability
in the business unit Exploration & Production is in particular affected by the oil and gas
prices. Thus, DONG Energy needs a risk management strategy in order to mange these cash
flows.
3.3 Porters five forces analysis of DONG Energy Porters Five Forces was developed by Professor Michael Porter in 1979 and has shaped a
generation of research within competitive strategy (Porter, 2008). The target of Porters Five
Forces is to determine the long-run profitability of the industry that DONG Energy operates
in, since a company’s profitability is mainly determined by the attractiveness of the
industry in which it operates (Porter, 2008). Porter’s Five Forces is used to analyze the
competitive intensity and attractiveness of the industry, where the attractiveness of an
industry is given by the overall profitability in the industry. Porter’s five forces is a
framework to analyze the underlying structure of the industry and the analysis is conducted
by examining the following five forces; Rivalry among existing competitors, bargaining
power of buyers, bargaining power of suppliers, threat of substitute products, and services,
threat of new entrants (Porter, 2008). For each of the five forces there will be made an
analysis on several parameters, which will characterize the degree of the force being high
or low. The scale will be from 1 to 5, where one is low and five is high. The average score
is assessed as low from 1-2.5; medium-low from 2.5-2.8, medium between 2.8-3.2,
medium-high from 3.2-3.5 and high above 3.5.
Understanding the competitive forces and their underlying causes provides a framework for
anticipating and influencing the competition and profitability of the industry over time
(Porter, 2008). Understanding the underlying structure of the industry is therefore essential
for creating an effective corporate strategy. The analysis will focus on the five forces in
relation to the operations of DONG Energy and will create a foundation for assessing the
future profitability of DONG Energy, by identifying the competitive situation and
attractiveness in the industry, in which DONG Energy operates. This is essential
information, when performing a valuation of DONG Energy, since it allow us to make
better estimates for the future growth and profitability potential of DONG Energy’s
different business segments. The five forces will be analyzed in relation to DONG Energy’s

19
four business segments: Exploration & Production, Wind Power, Thermal Power and
Customers & Markets. Only the conclusions of the analysis will be presenter here. For a
detailed analysis about the five see appendix C.
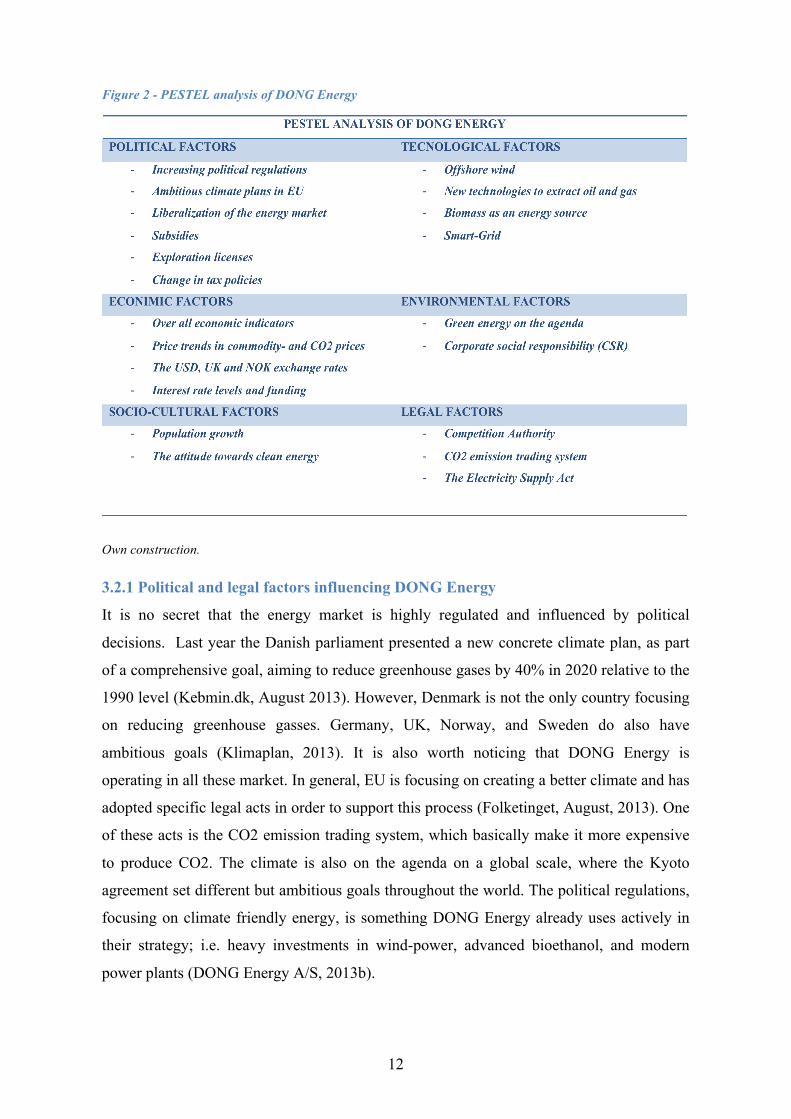
3.3.1 Conclusion on porters five forces Figure 5 - Conclusion on Porters Five Forces
Own construction.
The competitive situation in the industries, in which DONG Energy operates, are assessed
to be medium-high with an average score of 3.32. The rivalry among existing competitors
is especially high, because of high entry and exit barriers, together with high fixed costs
and the lack of differentiation in the industry. The threat from substitute products or
services are also high, mainly due to the increased focus on sustainable renewable energy
and the risk of substituting energy from oil, gas, or thermal power with renewable sources
as wind, solar, biomass, rain, water, or geothermal energy. DONG Energy is only involved
in renewable energy from wind power and a bit from biomass, which can be substituted
from other renewable sources. Furthermore, shale gas is also a threat. If shale gas is starting
to be extracted in Europe, then it can substitute other fossil fuels and potential make energy
prices decline significantly, as it happened in the US.
Bargaining power of buyers is quite strong, which is mainly driven by the liberalization of
the European energy market. Buyers are strongly independent of suppliers, since there are
many suppliers delivering the same standardized product. Furthermore, the liberalization
has made it easy and cheap to switch between suppliers and increased the bargaining power
of buyers.
3.25
3.30
2.60
3.55
3.90
0
1
2
3
4
5Bargaining0power0of0buyers
Bargaining0power0of0suppliers
Threat0of0new0entrantsThreat0of0substitute0products0or0services
Rivalry0among0existing0competitors

20
Bargaining power of suppliers is assessed to be medium-high. The suppliers have
significant size and financial muscle, which increased bargaining power of suppliers. On
the other hand there are several large suppliers, which increase the buyers’ independence of
each supplier. The agreements negotiated in this industry are of very large amounts and
therefore the contract has to be very comprehensive, which makes it expensive and difficult
to switch suppliers and further increases the bargaining power of suppliers. The threats
from new entrants are low, mainly because of high barriers to entry, regulations,
importance of economics of scale and non-abnormal profitability.
From this analysis it can be concluded that the competition in the industries in which
DONG energy operates, will be rather strong in the future, especially due to increased focus
on renewable energy. The growth of the oil and gas industry and the electricity industry is
forecasted to be modest in the future, while the offshore wind power industry is forecasted
to have significant growth, as discussed in threat of new entrants. The overall profitability
in the industries was currently assessed to be normal and with the increased competition
going forward, it is not expected to reach abnormal levels. The overall attractiveness of the
industries, which DONG Energy operates in, are assessed to be reasonable, and not high.
This is due to strong competition, non-abnormal profitability, and only significant growth
in the wind power market. All this is considered vital information for the valuation of
DONG Energy.
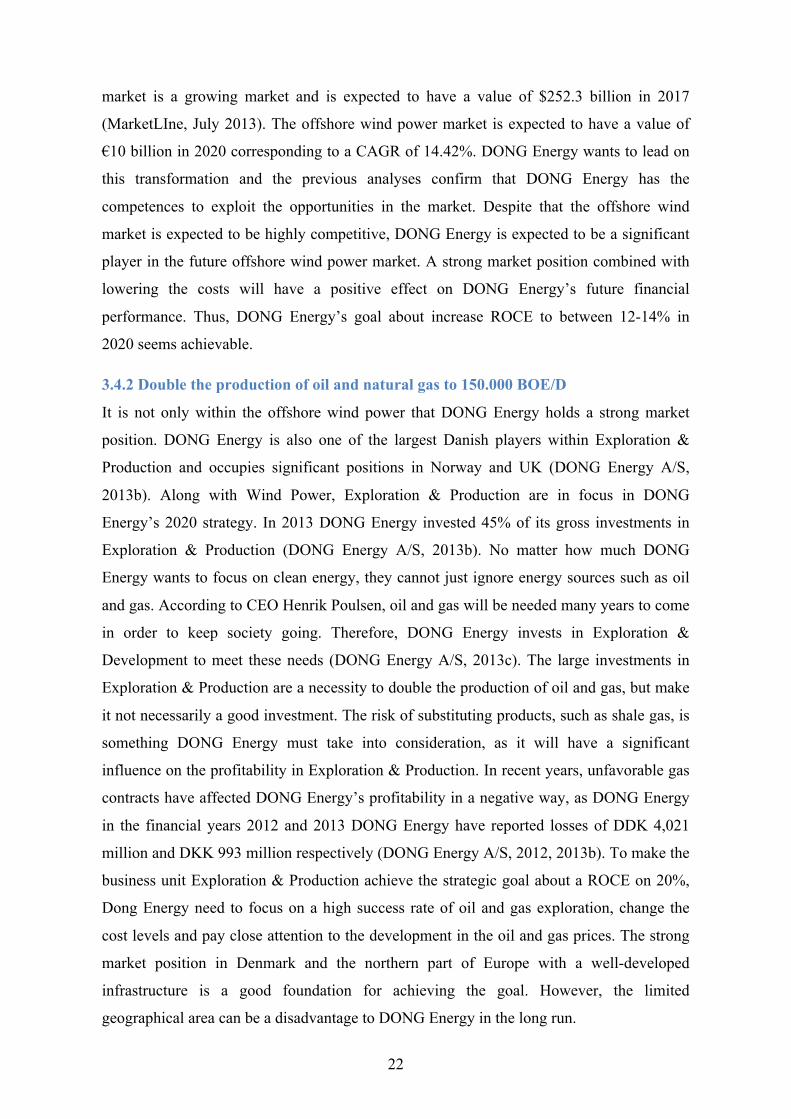
3.4 SWOT analysis DONG Energy To sum up on the strategic analysis a critical SWOT analysis is applied. The purpose of this
analysis is to connect DONG Energy’s strategic goals to its internal competences and
weaknesses and to the opportunities and threats observed in the external environment.

21
Figure 6 - SWOT analysis of DONG Energy
Own construction.
Firstly, it is worth to recall DONG Energy’s strategic goals towards 2020:
• Quadruple our installed capacity within offshore wind power to 6.5 GW and bring
down cost to 100 €/MWh.
• Double the production of oil and natural gas to 150.000 BOE/D.
• Double the share of biomass in the electricity and heat production at our Danish
power stations.
The strategic goals towards 2020 give an indication of how DONG Energy looks upon the
future in the energy market, or at least where DONG Energy wants to use its capabilities to
take advantage of the opportunities in the market. Together with the inputs form the
Internal, the PESTEL, and the Five Forces analyses; this SWOT analysis will elaborate on
how DONG Energy will achieve these goals.
3.4.1 Quadruple the installed capacity within offshore wind power
The political global focus on reducing CO2 emission along with socio-cultural preferences
towards clean energy creates great opportunities for DONG Energy, which during the last
couples of years, have invested heavily in offshore wind projects (DONG Energy A/S,
2013b). To meet the ambitious goals set by politicians a transformation of the current
energy system is needed; i.e. a transformation from high dependency on traditional energy
sources such as oil, gas, and coal into more renewable energy. Currently, about 75% of the
EU energy comes from oil, gas, while renewable energy only accounts for about 11%
(DONG Energy A/S, 2013c; MarketLIne, July 2013). The European renewable energy
22
market is a growing market and is expected to have a value of $252.3 billion in 2017
(MarketLIne, July 2013). The offshore wind power market is expected to have a value of
€10 billion in 2020 corresponding to a CAGR of 14.42%. DONG Energy wants to lead on
this transformation and the previous analyses confirm that DONG Energy has the
competences to exploit the opportunities in the market. Despite that the offshore wind
market is expected to be highly competitive, DONG Energy is expected to be a significant
player in the future offshore wind power market. A strong market position combined with
lowering the costs will have a positive effect on DONG Energy’s future financial
performance. Thus, DONG Energy’s goal about increase ROCE to between 12-14% in
2020 seems achievable.
3.4.2 Double the production of oil and natural gas to 150.000 BOE/D
It is not only within the offshore wind power that DONG Energy holds a strong market
position. DONG Energy is also one of the largest Danish players within Exploration &
Production and occupies significant positions in Norway and UK (DONG Energy A/S,
2013b). Along with Wind Power, Exploration & Production are in focus in DONG
Energy’s 2020 strategy. In 2013 DONG Energy invested 45% of its gross investments in
Exploration & Production (DONG Energy A/S, 2013b). No matter how much DONG
Energy wants to focus on clean energy, they cannot just ignore energy sources such as oil
and gas. According to CEO Henrik Poulsen, oil and gas will be needed many years to come
in order to keep society going. Therefore, DONG Energy invests in Exploration &
Development to meet these needs (DONG Energy A/S, 2013c). The large investments in
Exploration & Production are a necessity to double the production of oil and gas, but make
it not necessarily a good investment. The risk of substituting products, such as shale gas, is
something DONG Energy must take into consideration, as it will have a significant
influence on the profitability in Exploration & Production. In recent years, unfavorable gas
contracts have affected DONG Energy’s profitability in a negative way, as DONG Energy
in the financial years 2012 and 2013 DONG Energy have reported losses of DDK 4,021
million and DKK 993 million respectively (DONG Energy A/S, 2012, 2013b). To make the
business unit Exploration & Production achieve the strategic goal about a ROCE on 20%,
Dong Energy need to focus on a high success rate of oil and gas exploration, change the
cost levels and pay close attention to the development in the oil and gas prices. The strong
market position in Denmark and the northern part of Europe with a well-developed
infrastructure is a good foundation for achieving the goal. However, the limited
geographical area can be a disadvantage to DONG Energy in the long run.

23
3.4.3 Double the share of biomass in the electricity and heat production at the Danish
power stations
Dong Energy do also invest in new technologies within biomass and have already obtained
some patents within biomass technology. Patents as well as making the electricity and
heating supply efficient and flexible are key success factors for DONG Energy in order to
achieve their goal about biomass. The liberalization of the European energy market
emphasizes the importance of being efficient and thus able to produce electricity and heat at
competitive prices. In particular because electricity and heat are very standardized products.
As part of doubling the share of biomass in electricity and heat production at the Danish
power stations, DONG Energy wants to increase the biomass share of electricity and
heating generation in Denmark to minimum 50% in 2020 (DONG Energy A/S, 2013b).
DONG Energy has high competences within biomass energy, and as biomass energy
contributes positively to a cleaner environment, it seems reasonable for DONG Energy to
include biomass energy in the future product portfolio. The biomass energy is expected to
have a positive effect on DONG Energy’s business unit Thermal Power and thus contribute
to delivering annual operating cash flows of DKK 600-800 million from Danish power
stations.
3.4.3 Additional aspects
DONG Energy is market leader in wholesale of electricity and gas in the Danish market
and occupies leading electricity and gas positions in UK, Germany and Netherland (DONG
Energy A/S, 2013b). DONG Energy does also have a central position in the Danish
Thermal Power market, where they generate around one-third of the Danish heat
consumption (DONG Energy A/S, 2013b). The strong positioning puts DONG Energy in a
favorable situation in terms of competitive advantages. However, the competition
authorities can prevent DONG Energy from increasing its market share in the Danish
market. Thus, DONG Energy can be forced to seek new markets to create growth.
3.5 Conclusion on DONG Energy’s strategic position DONG Energy has a well-balanced and integrated business model and holds many
competences in particular within the growing offshore wind market. Their strong position
gives a competitive advantage in the short to medium term. However, an attractive market
attract new enters and hence increase competition, which eventually will eliminate DONG
Energy’s competitive advantages. However, DONG Energy’s future success depends not
only on wind power. A strong position on the Danish energy market, high competences

24
within biomass energy, and promising prospects for oil and gas exploration and production,
will also contribute to DONG Energy’s future performance. A new equity injection in the
beginning of 2014 has stabilized the financial situation of DONG Energy, which had been
under pressure due to recent poor financial performance. Thus, there are good prospects for
DONG Energy to continue investing in the transformation of the energy system. However,
energy is a very standardized product and can easily be substitutes. Therefore, DONG
Energy needs to pay attention to the development of for example shale gas and be prepared
to adapt their strategy to fundamental changes in the energy sector.
4 DEFINING VALUATION APPROACHED AND THEIR
ELEMENT FOR DONG ENERGY When it comes to make a valuation many different approaches can be applied. These
approaches range from the simple to the very sophisticated and make very different
assumptions about what fundamentals that define value (Damodaran, 2012; Koller,
Goedhart, Wessels, McKinsey, & Company, 2005). Hence, the value of the same object can
vary depending on the approach applied. However, they have some common characteristics
and can be categorized which make it easier to distinguish between different approaches, in
different situations. Broadly speaking, there are three categories of approaches to valuation:
discounted cash flow valuation (DCF), relative valuation (multiples), and contingent claim
valuation (options) (Damodaran, 2012).
As no approach is superior to all others, testing more approaches up against each other can
enhance the validity of the valuation. However, not every single valuation can be applied,
and finding the right approaches must be a trade off between:
E Minimizing the costs i.e. the time use regarding creation, implementation and use of
the approach.
E Optimizing the accuracy i.e. avoid systematic mistakes in the estimation process.
Hence, the choice of valuation approaches is a weighting of each approach’s advantages
and disadvantages in the given situation. The situation considered in this thesis is the initial
public offering of DONG Energy. Thus, there are two major things to consider when it
comes to choosing the most appropriate valuation approaches for DONG Energy. Firstly,
what valuation approaches are most suitable for an IPO company? Secondly, what
valuation approaches are most suitable for a diversified energy company? Most firms
conducting an IPO in the US are young growth companies for which it can be difficult to

25
forecast future cash flows (Kim & Ritter, 1999). Hence, the DFC approach will be
associated with high uncertainty and is likely to be very imprecise. Instead it is widely
recommended in both academic and practitioner publication to use accounting numbers in
conjunction with comparable firm multiples when valuing an IPO company (Kim & Ritter,
1999). However, with the recent IPOs of OW Bunker, ISS, Matas, and Pandora, the Danish
IPO market seems different from the US; i.e., Danish IPOs are exit strategies for private
equity funds. Further, DONG Energy may be considered a large, and to some extent,
mature company for which it is possible to estimate fairly precise future cash flows. Hence,
the DCF approach will work just fine for a valuation of DONG Energy. Notice that in
regard to the comparable firm approach it is crucial that there exists a highly comparable
peer group, otherwise we are comparing apples with bananas (How, Lam, & Yeo, 2007;
Kim & Ritter, 1999).
Based on the above arguments and what models are common applied (Damodaran, 2012;
How et al., 2007; Kim & Ritter, 1999; Koller et al., 2005; Roosenboom, 2012) the DCF and
the multiple approaches are the ones found most relevant for the purpose of valuing DONG
Energy. The DCF approach will be the main body in the valuation, while the multiples
approach is used to verify the value found. Next part will provide a theoretical introduction
to the two approaches and an analysis of estimating the approaches’ elements in relation to
DONG Energy.
4.1 Discounted Cash Flow (DCF) Valuation Originally the DCF approach was designed to value straight-line investment grade bonds,
generating well-defined equal cash flows. However, the DCF approach has developed over
the years and become suitable for valuing other assets than investment grade bonds.
Actually, the DCF approach is the foundation on which all other valuation approaches are
built (Damodaran, 2012). Notice that this valuation is valuing the free cash flow to all
investors and not only equity investors. First of all, because the focus is on a corporate
valuation of DONG Energy, but also because the capital structure is embedded in the cash
flows, which make the forecasting difficult by only focusing on the equity (Koller et al.,
2005). For instance, if DONG Energy change its debt-to-equity ratio, it will change the risk
for equity holders, thus the cost of equity must be adjusted. However, the capital structure
is not a direct part of the cost of equity and can be missed in the valuation. Hence, the cash-
flow-to-equity valuation approach is not minimizing the cost or optimizing the accuracy.
Even though the DCF model is the most common used valuation model, it has its
limitations. As can be seen from the formula below, the value is highly sensitive to both the

26
estimation of the future free cash flows and the WACC. Thus, it is important to be very
careful when estimating these elements.
The basis of the DCF approach is to estimate the firm value by estimating all future free
cash flows (FCF) and discount them back to today applying a appropriate cost of capital
(WACC), reflecting the risk embedded in the cash flow estimation.
E(FCF) = expected free cash flows; WACC = weighted average cost of capital; T =
number of time periods.
4.2 The Free-Cash-Flow (FCF) Even though it might seem simple and straightforward to calculate the firm value, it is not.
Much more complex procedures take place behind the scenes. Estimating the free-cash-
flows is a multi-step procedure involving reformulating the reported financial statement
(which will be elaborated later on), analyzing the historical performance, and then finally
forecast future cash flows based on historical performance and the strategic analysis
(Damodaran, 2012; Koller et al., 2005; Penman, 2013). Forecasting one year ahead can be
complicated enough, and thus it become meaningless to forecast far into the future
(Damodaran, 2012; Koller et al., 2005; Penman, 2013). However, a company like DONG
Energy is expected to last long into the future, if not forever. Hence, the free-cash-flows far
into the future also need to be discounted back to today as they contribute to the overall
value of the company. Instead of predicting these individual year-by-year cash flows, a
perpetuity-based continuing value will be applied (Koller et al., 2005). Hence, the firm
value becomes the sum of the forecasted period, which can vary from year to year and the
continuing value.
The continuing value is calculated by the following key value driver formula
NOPLAT = net operating profit less adjusted tax; g = the long run growth rate in
NOPLAT; RONIC = the long run return on new invested capital; WACC = weighted
average cost of capital.
Firm_Valuet =E(FCFt )
(1+WACCt )t
t=1
T
∑
Firm_Valuet =FCF1
(1+WACC)+
FCF2(1+WACC)2
+...+ FCFt(1+WACC)t
+Continuing_ value(1+WACC)t
Continuing_Valuet =NOPLATt+1 1−
gRONIC
"
#$
%
&'
WACC − g

27
4.3 The Weighted Average Cost of Capital (WACC) The other important element in estimating the firm value of DONG Energy is the Weighted
Average Cost of Capital (WACC).
D = market value of debt; E = market value of equity; D+E = market value of the firm; rd
= required return on debt; re = required return on equity; Tm = marginal tax rate.
As can be seen from the formula, the WACC consist of four elements, which here will be
dealt with in relation to DONG Energy.
4.3.1 The capital structure
First the long-term capital structure has to be estimated. The market value weights for each
financing element are better estimates, because market values reflect the true economic
claim of each type of financing outstanding (Damodaran, 2012; Koller et al., 2005).
Estimating the financing market values is quite simple for listed companies (if long-term
capital structure is equal to the current). However, it can be complicated for a non-listed
company like DONG Energy. Thus, the question is how to estimate the capital structure for
a non-listed company? In the absence of better, book values can be used as a proxy.
However, there are more shortcuts by using book values. In particular regarding the equity
value. When the company is not in a situation of financial distress (which DONG Energy
is not), the book value of debt is an appropriate proxy for the market value of debt.
However, the difference between book value and market value of equity are often
significant (Koller et al., 2005). Hence, using the book value of equity, as a proxy will lead
to an artificially low WACC as the cost of equity often are higher than the cost of debt
(because equity holders have a higher risk). Estimating the long-term capital structure can
be done easily if the company has declared a capital structure objective in their annual
report. Unfortunately, the only statement about DONG Energy’s future capital structure is
that Funds from operations (FFO, which is a internal proxy for NOPLAT) must be around
30% of adjusted net debt (DONG Energy A/S, 2013b). However, there is another way to
estimate the long-term capital structure. That is to assume that the industry's long-term
capital structure is a fair proxy for DONG Energy’s capital structure. Based on numbers
from Reuters and Bloomberg the capital structure for DONG Energy’s peers are determined
(see more information about the peers in section 4.4). As can be seen from the table below
the average market debt and equity ratios are 38% and 62% respectively. However, looking
WACC = DD+E
⋅ rd ⋅ (1−Tm )+E
D+E⋅ re

28
at the book value of equity (which is the only one available for DONG Energy), DONG
Energy seems to have a little higher debt ratio than its peers. Thus, the debt ratio for DONG
Energy is adjusted slightly upwards. In conclusion, DONG Energy’s long-term capital
structure is estimated to 40% debt and 60% equity. Notice that in accordance with both
Koller et al. (2005) and Damodaran (2012) the book values of debt are assumed to be equal
to its market equivalents. Hence, none of the firms are considered to face a significant
default risk. Furthermore, notice that debt is adjusted to include capitalized leasing. For
details on the calculations and number used, see the excel file – Financials – Estimating
WACC.
Table 1 - Estimation of the capital structure
Own construction based on Reuters and Bloomberg estimates.
4.3.2 Cost of Debt
The second element is about determining the cost of debt, which basically is a function of
the risk-free rate and the default spread (Damodaran, 2012; Koller et al., 2005).
Cost of debt = risk-free rate + default spread
From the annual report (2013) it can be found that DONG Energy’s weighted average
effective interest rate for general borrowing was 4.0% (2012: 4.4%). Hence, it represents
the current cost of debt for DONG Energy. However, it might not be an appropriate
measure for the long-term cost of debt, as some of the debt currently is entered at
historically low rates. In particular the debt entered with floating rates. Thus, a more solid
or at least a more theoretical correct measure for the long-term cost of debt will be
estimated using the parameters from the function above.
The risk-free rate represents the return from a total risk free asset, which only exists
theoretical; meaning that the actual returns should always be equal to the expected return.
According to CAPM the risk-free rate is assumed to have no variation in returns, i.e.
correlation and standard deviation equal zero. Government bonds are often used as a proxy
for the risk-free rate, as there is no actual observed risk-free asset. The nearest would be an

29
AAA rated zero coupon Government bond. Empirically, it is highly unlikely to observe
actual standard deviations and correlations of zero in financial markets. Furthermore, risk
elements such as transactions risk, reinvestment risk, roll risk, and sovereign risk, have to
be considered when determine a risk-free asset. Ideally the risk-free asset and the asset
valued (DONG Energy) should have the same maturity (Damodaran, 2012; Koller et al.,
2005). However, government bonds with very long maturity are not as liquid as
government bonds with shorter maturities (hence, a liquidity premium for longer maturity).
Thus, the 10-year German Eurobond is chosen as the risk-free rate for the valuation of
DONG Energy, as it is considered as the best proxy available. The current 10-year German
Eurobond yields 1.4% (2.34% for 30-yeay) (Bloomberg, 2014) and might be the best proxy
for the current risk free rate. However, as already mentioned, the current interest levels are
from a historical point of view relatively low (Damodaran, 2011), and it is questionable
whether they will remain at this low level going forward. The consequences of applying a
low (maybe too low) risk free rate, will holding all else constant, result in a lower discount
rate, which all else held the same, will result in higher valuations (Damodaran, 2011).
Hence, it is decided to use the 15 years historical average (1999-2013) for the 10-year
German Eurobond as a proxy for a “normalized” risk free rate. The time period of 15 years
is chosen as it captures both booms and busts. Notice that no structural break in the interest
level during the 15 years is assumed. The 15 years historical average for the 10-year
German Eurobond is calculated to 3.65% (see calculations in the excel file – Financials –
Estimating WACC). Thus, 3.65% will be applied as a proxy the risk free rate in this thesis.
The default spread concern the lenders perception of the default risk embedded in DONG
Energy. Default risk of a company is normally related to its ability to generate cash flows
and its capital structure with a particular focus towards current obligations; i.e. is the
company able to payoff its current obligations. Broadly speaking, a high cash flow
generation compared to current liabilities, lower the risk of a company (Koller et al., 2005).
The default spread for DONG Energy can be determined in several ways, the question is,
which one best represents the long-term default spread? DONG Energy has public traded
bonds, from which the current default spread can be determined. The yield to maturity for
DONG Energy’s obligations are compared with its respectively “risk free” benchmark. The
spread found is the weighted average default spread and is calculated to 142 basis points or
1.42% (for more details on the calculations see the excel file – Financials - WACC).
DONG Energy’s default spread can also be determined using independent rating agencies
(Standard & Poor’s, Fitch, and Moody’s) credit ratings, which for the year of 2013 were

30
BBB+, BBB+ and Baa1 (except from hybrid bond, which had ratings at BBB-, BBB- and
Baa3) respectively (DONG Energy A/S, 2013b). Notice that despite recent years poor
financial performance all ratings are investment grades. The most recent data estimates a
default spread at 2% for companies with similar ratings as DONG Energy (Damodaran,
2014).
Table 2 - Comparison of Cost of Debt measures
Based on the three different measures for cost of debt, 5% is assumed as a fair cost of debt
for DONG Energy. Even though the current market circumstances yield low spreads
between government bonds and corporate bonds, and thus relatively low rates for corporate
debt, the cost of debt is assumed fixed going forward. An explanation for the current low
spreads can be that the YTM for high investment grade rated government bonds is only 1-
2% on long term debt and taking inflation and brokerage fees into account, this gives
almost a negative real return. Investors therefore sought for higher yielding bonds, which
increased the demand dramatically for corporate bonds and hence decreased YTM.
Decreased YTM means that the spread between the YTM for example DONG Energy’s
Corporate bonds, and the Government bond benchmark decreased significantly. Hence, it
could be argued that the current spread of 1.42% is unsustainable low and could not remain
at these levels going forward. However, we have not adjusted the spread upwards, because
it is difficult to argue that the whole market is “wrong” and we cannot be sure that it will
change in the foreseen future. What we have done instead is to use the 15 years historical
average YTM for the 10-year German Eurobond as the risk free rate which encounter some
of the problematic of unsustainable low yields.
Notice that the effect from capitalizing operating lease is taking into consideration when
estimating the cost of debt. Hence, the over all cost of debt is downgraded a bit as operating
lease obligation is less risky than other debt (see the financial analysis for more information
on why).
4.3.3 Cost of Equity
The third element in estimating the WACC is the cost of equity, which can be estimated
using asset-pricing models. The most common asset pricing models are: capital asset
pricing model (CAPM), Fama and French’s three-factor model, and arbitrage pricing theory

31
(APT). CAPM is a single factor model, while the two others are multifactor models
(Damodaran, 2012). As there is mixed evidence about multifactor models giving better
estimates for the cost of equity (Ang & Chen, 2007; Ferguson & Shockley, 2003; Kothari,
Shanken, & Sloan, 1995), CAPM is due to its relative simplicity and popularity used in this
thesis. Further, the CAPM is built on solid theory rather than empirical evidence, which is
preferable for an academic thesis like this. Hence, Fama and French’s three-factor model,
and the arbitrage pricing theory will not be discussed further in this thesis. The purpose of
this thesis is not to cover all elements about the CAPM, however, a little have to be said.
The CAPM is built on the premise that equity investors should be compensated for taking
on risk and strives to explain the relationship between risk and expected return, by stating
that the expected return on a security equals the risk-free rate plus the securities beta times
the market risk premium (Sharpe, 1964).
or
E(Ri) = expected return on security i; rf = risk-free rate; βi = security i’s sensitivity to the
market return; E(Rm) = Expected market return; MRP = excess market return over the risk-
free rate
One of the assumptions about CAPM is that the variance of returns is an adequate
measurement of risk, as beta is calculated as the covariance between the market return and
the securities return. Even that this assumption might be unrealistic in reality (Roll, 1969),
Damodaran (2012) highlights that the main advantages by using CAPM is that it capture all
risk in one measure and hence simplify what could be a very complicated process. The
factors affecting the CAPM and hence the cost of equity will be presented here.
The risk free rate was estimated to 3.65% for the cost of debt. This rate is still considered
valid for estimating cost of equity.
How to estimate the market risk premium (MRP) is one of the most debated issues in
finance. The MRP strives to measure what investors on average demand over the risk free
rate for taking on the risk associated wit equity investing. At first glance, the method of
calculating MRP look simple as it is calculated by deducting the risk free rate from the
expected market return. However, the expected market return is not directly observable,
which make the estimation of the MRP very challenging. No universally accepted model
for estimating the MRP exist, but Koller et al. (2005) and Damodaran (2012) state that it is
common practice to use historical data to estimate the future risk premium. Hence, it is
E(Ri ) = rf +β E(Rm )− rf"# $% E(Ri ) = rf +β ⋅MRP

32
implicitly assumed that the historical premium is the best estimate for the future risk
premium, and hence that the investors level of risk aversion has not and will not change.
However, this assumption might be a little unrealistic, as both the world and the financial
markets have changed over the last 100 years. Shift in economic policy, inflation changes,
changes in interest rates, oil crises, terrorist attacks, etc. are all events, which affect the risk
premium. However, using shorter and more recent time periods lead to the problem of
unacceptable high standards errors (Damodaran, 2012). For this thesis it is decided to use a
long time period of historical data, to estimate the future market risk premium. The
question is now, which market’s historical data to use? As DONG Energy is expected listed
on the Danish stock exchange, Danish data looks like the obvious choice. However, most
investors today diversify their investments across countries (at least industrial investors),
which is an argument for using global data or US data as a proxy. The MRP for the Danish
market in the period from 1950 to 2004 was on average 4.2% (Skat.dk, 2006), while it for
The US in the past 100 years has been somewhere between 4% and all the way up to 12%,
depending on the estimation mythology applied (Damodaran, 2012). Most evidence suggest
somewhere between 4.5% and 5.5% (Damodaran, 2012; Koller et al., 2005). In conclusion,
the MRP used for this valuation is estimated to 4.5%.
As already mentioned beta is the CAMP measure of a securities risk and is calculates as the
covariance between a security and the market. Even though that the “market” is an
indefinable object, the MSCI world index is often used as a proxy for the market
(Damodaran, 2012; Koller et al., 2005). Thus, the volatility of a security is according to
CAPM assumed to explain its non-systematic riskiness (Sharpe, 1964). Because DONG
Energy is not listed on a stock exchange, it is not possible to calculate its historical return
and regress it against the market return. However, accounting earnings can be used as a
proxy (Damodaran, 2012). In this thesis, DONG Energy’s beta will be estimated as an
average of betas for a selected peer group consisting of large Europeans energy companies
with similar operating risks. This is known as the bottom-up approach (Damodaran, 2012).
Using a number of comparable firms lower the standard error, and hence makes the results
more trustworthy as
Std. error bottom-up beta =Average_ std _ errorcomparable_ fims
n, where n is the sample number
(Damodaran, 2012). However, the numbers of comparable firms are to some extend
limited, as they have to be similar to DONG Energy in most ways possible. For this thesis a

33
peer group of 6 firms are selected (for a detailed description of these companies see section
4.4.).
Table 3 - Bottom-up beta calculation
Own construction based on Reuters and Bloomberg estimates. Calculating the average beta of the 6 comparable firms presented in the table above give a
beta estimate of 0.87. However, DONG Energy is considered more risky than the selected
peer group for more reasons. Firstly, DONG Energy’s debt to equity ratio measured on
book values is higher. Secondly, DONG Energy has a credit rating lower than the average
and finally DONG Energy is relatively small (only around 30% value) measured on book
values. Because of DONG Energy’s higher risk, Damodaran (2012) recommend that the
average beta being adjusted upwards. Based on the risk parameters mentioned, it is decided
to estimate DONG Energy’s beta to 1.1 which is just above the high end of its peers.
All inputs to the CAPM for DONG Energy have now been estimated and the cost of equity
can be calculated.
DONG Energy’s cost of equity = 3.65% + 1.1 (4.5%) = 8,60%
4.3.4 The marginal tax rate
The last element is about the marginal tax rate. Debt creates a tax shield, which lower the
cost of debt. Thus, an appropriate marginal tax rate has to be estimated for determining the
effect of the tax shield. For most investment grade companies the statutory tax related to the
country where the company operates, will be a good proxy (Graham, 1996). However,
DONG Energy’s recent years performance lead to uncertainties about whether they can be
considered an investment grade company. Hence, it may be discussed whether or not the
marginal tax rate should be downgraded, due to rules related to tax loss carry forward,
investment tax credits etc. (Graham, 1996). Graham (1996) found that a typical company
does not fully use its tax shield and thus, that the marginal tax rate on average is 5% below
the statutory rate. The current Danish company tax rate (2013) is 25%, but is decreasing

34
towards 2016. The table below shows how the Danish corporate tax rate will decrease to
22% towards 2016.
Table 4 - The Danish Corporate tax rate
Own construction with reference to skat.dk
Even though the Danish company tax rate, or its adjusted equivalent seems as a good proxy
for DONG Energy, it might not be. The hydrocarbon tax, which concerns taxation of oil
and gas extracted form the North Sea, complicates the estimation of DONG Energy’s
marginal tax rate. DONG Energy’s tax rate, and particularly, the hydrocarbon tax will be
discusses in more details in the budgeting section. The elements about the debt tax shields
are assumed not affected by the high hydrocarbon tax. Additionally and in accordance with
credit rating agencies rating, DONG Energy is assumed to be an investment grade
company. In conclusion the marginal tax rate related to estimating DONG Energy’s WACC
is assumed to equal the future Danish statutory rate at 22%.
4.3.5 Calculating the WACC
After estimating all the inputs the last step is to calculate the
Table 5 - The WACC for DONG Energy
Own construction
In conclusion the WACC for DONG Energy is estimated to 6,72% and will be applied in
the DCF-model to discount the free cash flows in order to estimate the firm value of DONG
Energy.
4.4 Relative valuation by multiples In addition, or maybe more in conjunction with the DCF approach, multiples from DONG
Energy’s peers are applied as another approach to triangulate or estimate the value of
DONG Energy. The DCF approach is considered as the main driver for this thesis,
WACC = DD+E
⋅ rd ⋅ (1−Tm )+E
D+E⋅ re

35
however, the comparable firm approach using multiples is also considered highly relevant,
as DONG Energy is a company facing an initial public offering in the next couple of years
(Kim & Ritter, 1999).
In multiples valuation it is common to use industry average numbers, but companies even
in the same industry can be very different in regard to expected growth rates, returns on
invested capital and capital structure (Koller et al., 2005). Thus, a carefully selected peer
group optimizes the accuracy of the valuation. The comparable firm approach reduces the
risk of misvaluing a firm relative to other firms in the industry, however, this approach
provides no safeguard against an entire sector being undervalued or overvalued (Kim &
Ritter, 1999). This means that it provides a safeguard against misvaluing DONG Energy
relative to its peers, but if the whole industry (i.e. all the peers) is misvalued, then it will
also cause misevaluation of DONG Energy.
This thesis will use the following multiples: Price/Sales, Price/Book, Price/Earnings,
Enterprise Value/Sales, Enterprise Value/ EBITDA, Enterprise Value/EBIT, which will be
describe in more detail in section 8.5.2 Multiples and methodology of study. The use of
these multiples are in accordance with Kim and Ritter (1999), who also use all these
variables, except EV/EBIT, which we have added since it is common used valuation
multiple (Alford, 1992; How et al., 2007; Roosenboom, 2012). The Enterprise Value (EV)
multiples of EV/Sales, EV/EBITDA and EV/EBIT allow us to make comparison between
firms with different leverage, because these multiples are not affected by leverage and EV
includes the amount of net debt (book value of debt – cash) (Kim & Ritter, 1999).
However, the multiples do not take into consideration the difference in growth rates and
quality of earnings and should therefore be interpreted carefully. According to Kim and
Ritter (1999) the use of forecasted accounting numbers, instead of historical accounting
numbers, increases the accuracy of the valuation and therefore we place most emphasis on
the multiples based on DONG Energy’s expected 2014 accounting numbers. The
comparable firm approach will be described more in detail in Section 8 - IPOs.
DONG Energy is in many ways a unique company and finding a representative peer group
was not easy. The first step involved identifying a gross group based on a SIC code search.
However, there is no such SIC code for a multi unit business like DONG Energy. Thus, the
SIC code for “Electric Power Generation, Transmission and Distribution” was used as the
best proxy. From the gross list 6 peers were selected based on their business descriptions.
Unfortunately, 5 out of 6 selected peers are significantly larger than DONG Energy, simply
because they operate in larger markets. However, it was a trade off between size and

36
finding multi units business companies operating in all most the same business units as
DONG Energy. The highlights of the peer group will be presented here, but for further
details, see appendix Q and/or the excel file – Multiples Orbis.
Table 6 - Highlights of 2013 peer group data
Own construction based on Bloomberg numbers.
5 FINANCIAL ANALYSIS OF DONG ENERGY The financial analysis aims to make an assessment of how DONG Energy has managed the
invested capital as well as the efficiency and profitability of its operations. The analysis
will be based on historical numbers publish in recent annual reports from DONG Energy
and will focus on the direction and speed of the development in DONG Energy’s financial
performance. Further, this analysis will assess and discuss how realistic DONG Energy's
2020 goals are, in the light of the past years performance. An analysis of DONG Energy’s
credit health and capital structure is omitted from this financial analysis as these elements
are incorporated in the WACC estimation.
The reported numbers in the consolidated financial statement are considered valid, as they
are audited by PricewaterhouseCoopers without any qualifications.
5.1 Reformulating of the financial statements This part of the thesis will focus on reformulating the financial statements to align with the
business activities in DONG Energy. Hence, focusing on the value adding activities
described in 2 and the actual transactions with stakeholder. The output from the
reformulated financial statements will be applied to determine DONG Energy’s invested
capital and net operating profits less adjusted taxes (NOPLAT), which are important inputs
to the DCF valuation.
The annual report published by companies, including DONG Energy, is to some extent
blurred by accounting rules, which are impractical in the context of making an accurate
profitability and growth analysis (Damodaran, 2006; Koller et al., 2005; Penman, 2013).
DONG Energy has adopted the International Financial Reporting Standards (IFRS), which
is broadly accepted in both EU and Denmark (Penman, 2013). However, the IFRS
37
standards are not designed with a specific purpose of valuing companies, but to give a
picture of the business’ credit risk profile. Hence, the reported numbers have to be
reformulated for valuation purpose. Broadly speaking the reformulation is about dividing
the financial figures into operating and non-operating activities. Operating activities are
revenue-generating processes, while non-operating activities typically involve transactions
with lenders and shareholders and investments in passive marketable securities (Penman,
2013). As DONG Energy’s business unites has been described and analyzed in a previous
sections, it is possible to asses what is operating and what is non-operating activities, by
carefully going through the notes in the annual reports. This section about reformulating the
financial statement, will only contain comments on the most significant adjustments.
Hence, reference is made to the attached excel file – Financials – Balance sheet + Income
statement for a complete overview over the adjustments.
DONG Energy either agree that IFRS gives a true picture of their business and therefore
they introduced a new business performance measure in their 2011 annual report.
According to DONG Energy, the business performance measure aims to adjust the income
statement for temporary fluctuations in the market value of contracts, including hedging
transaction relating to other periods (DONG Energy A/S, 2011). In recent years, DONG
Energy has adopted a more active risk management approach and thus become more
exposed to IFRS 7 about financial instruments. As DONG Energy use approximate
hedging, only a portion of DONG Energy’s hedging meets the IFRS criteria for cash flow
hedge accounting, even though the hedging contracts are entered for cash flow hedge
purpose. Hence, DONG Energy wants to ensure greater transparency in the financial
reporting with the business performance measure. However, the question is whether the
business performance measure is a better measure for an appropriate financial analysis of
DONG Energy than the comprehensive income reported by IFRS? There is no doubt that
market value adjusting of hedging transactions on a continuous basis, dictated by IFRS,
will lead to large fluctuations in DONG Energy’s income statement, as they often hedge for
periods more than one year. Large fluctuations will complicate the budgeting process and
as these fluctuations do not correspond to the real cash flows, but only occur do to
inappropriate accounting rules, DONG Energy’s business performance measure seems like
the most appropriate measure to use for this financial analysis. However, it must be kept in
mind that DONG Energy is preparing for an initial public offering, and thus wants to
appear as good as possible.

38
Figure 7 - Comparison of Business Performance and IFRS
Own construction based on numbers from DONG Energy’s annual reports.
The above figure shows the differences between the business performance measure and the
IFRS measure. In general the differences are not significant, however, the tendency is that
the business performance measure makes DONG Energy’s financial results look better.
Particular in 2012 and 2013, where the use of hedging instruments has increased compared
to earlier years. As DONG Energy’s use of hedging instruments is expected to stay at the
current level or increase going forward, this tendency is expected to continue. Hence, the
business performance measure will be positively biased compared to IFRS. However, the
business performance measure is chosen as the best measure for this analysis. In particular
because it allow us to analyze the historical performance on a segment-basis, which is
highly beneficial in regard to the budgeting process.
The new presentation does not affect the cash flows from operating activities, the total
equity, or the balance sheet for this analysis. Only the income statement is affected (DONG
Energy A/S, 2011). For more information about the business performance measure see
DONG Energy Annual Report (2011). 2007 is chosen as the starting year for this financial
analysis, as it is the first full year after the merger. The financial analysis is also bounded to
include only the financial year 2013. Hence, the 2014 results are omitted, as this thesis
assess the value as of 31 December 2013. Further, a six-month period is not considered to
have significantly impact on the overall valuation of DONG Energy.
5.1.1 Reformulating and analyzing the statement of owners’ equity
In general the statement of owners equity is a summery of all the transactions, affecting the
shareholders (Penman, 2013). So what transactions do affect the shareholders of DONG
Energy? The main transactions with owners are related to the hybrid capital and dividends
E10.000!
0!
10.000!
20.000!
30.000!
40.000!
50.000!
60.000!
70.000!
80.000!
2007! 2008! 2009! 2010! 2011! 2012! 2013!
DKK"million"
Revenue!IFRS!
Revenue!BP!
EBITDA!IFRS!
EBITDA!BP!
Pro^it!(loss)!IFRS!
Pro^it!(loss)!BP!

39
paid. However, the profit (loss) for the year does also affect equity, including other
comprehensive income as for instance currency translation gains and losses are real.
Meaning that when DONG Energy holds net assets in UK or Norway, and the DKK
equivalent of those assets falls, the shareholders of DONG Energy have lost value. In the
financial year 2013, DONG Energy had a foreign exchange adjustment loss of DKK 435
million reported in other comprehensive income under IFRS.
Adjusting for non-controlling interests and hybrid capital
The reformulated equity is adjusted for the effect of non-controlling interests. Because
when DONG Energy controls, but not fully own a subsidiary, the subsidiary’s financial
statement must according to IFRS be fully consolidated into DONG Energy’s consolidated
financial statement. Hence, the equity reported in the annual report is to high and the non-
controlling interests must be deducted form the open and ending balances (Koller et al.,
2005).
Another important element in the assessment of DONG Energy’s equity and liabilities is
hybrid capital. Roughly speaking hybrid capital is debt with characteristics similar to equity
and is mostly used within the financial sector (Ussing & Winther, 2013). Hence, providers
of hybrid capital are subordinated to other creditors, which they are compensated for
through a higher interest rate. One can wonder why an industrial company like DONG
Energy has chosen what looks like expensive hybrid capital (compared to alternative
financing sources) as part of their financing. However, the answer is very simple and it
concerns the capital structure and hence DONG Energy’s credit ratings. The hybrid capital
issued by DONG Energy in January 2011 was recognized as 100% equity by the rating
agencies (Ussing & Winther, 2013). Hence, the overall credit rating of DONG Energy
benefitted due to a higher solvency ratio. However, the rating agencies have now changed
their assessment of hybrid capital, meaning that the old hybrid capital issued being
recognized as debt instead of equity (DONG Energy A/S, 2013b; Ussing & Winther, 2013).
Thus, DONG Energy had to exchange their hybrid capital in July 2013 and issue new
hybrid capital, achieving 50% equity weighting (DONG Energy A/S, 2013b). Overall, this
means that DONG Energy’s credit ratings had been under pressure and as DONG Energy
wants to achieve credit ratings of at least BBB+ (Standard & Poor’s measure), they had to
increase the equity position and thus their capital structure. Therefore, DONG Energy got
an equity injection worth DKK 13 billion in the beginning of 2014 (DONG Energy A/S,
2013b).

40
Whether hybrid capital should be recognized as equity or debt will be discussed in further
details later. This section will only assess the development in common shareholders equity
of DONG Energy.
Comments on the development in common shareholders equity Figure 8 - The development in DONG Energy's equity (2007-2013)
Own construction based on annual report numbers
As can be seen from the figure above, common shareholder equity has decreased 7% (15%
for average numbers) from 2007 to 2013. The recent poor financial performance has eroded
DONG energy’s common shareholders equity and increased pressure on DONG Energy’s
capital structure, and hence their credit riskiness. As described in the strategic analysis,
DONG Energy is investing heavily, particular in Exploration & Production, and Wind
Power. These investments need funding, but at the moment, retained earnings are not an
optional funding source for DONG Energy. Thus, DONG Energy’s funding is depended on
the external capital market. Increasing the debt-ratio will, as mentioned, put pressure on
credit riskiness. Hence, it might be difficult to obtain debt at competitive interest rates.
Meaning that projects carried out have to earn higher returns to be profitable.
Overall, the decreasing tendency in common shareholders equity is not sustainable in the
long run. However, the invested capital in business activities is expected to payoff at some
point in the future. Particularly investments in oil and gas fields are characterized by
relatively long investments horizons (Ussing & Winther, 2013). Despite the recent poor
financial performance, DONG Energy has managed to issue new equity, which ceteris
paribus strengthen their capital structure going forward. With an instant expansion of equity
and expectations of better financial performance, DONG Energy is expected to maintain
their BBB+ credit rating.

41
5.1.2 Reformulating the income statement
The overall goal by reformulating the income statement is to determine Net Operating
Profit Less Adjusted Taxes (NOPLAT), which is the after tax profit generated from DONG
Energy’s core operations, excluding non-operating income and interest expense (Koller et
al., 2005). Hence, NOPLAT is a measure for the profit to all investors. When determining
NOPLAT it is essential to be consistent with the reformulating of the balance sheet.
Meaning that only the profit generated by invested capital is included (Koller et al., 2005).
As can be seen in the reformulated income statement disclosed in appendix E, determining
NOPLAT starts with earning before interests, taxes and amortizations (EBITA). EBITA is
adjusted for the interest expenses associated with the capitalized leases, which will be
elaborated on in next section. Adjusted EBITA represent the earnings from DONG
Energy’s operating activities. Hence, tax paid on adjusted EBITA must reflect the taxes
related to the operation. As taxes on financial income and non-operating activities are not
related to EBITA, these must be added to operating cash taxes (Koller et al., 2005). Further,
tax shields form interest expenses must be deducted, as NOPLAT do not concern the
capital structure. Instead the capital structure is assessed in the weighted average cost of
capital (WACC).
5.1.3 Reformulating the Balance sheet
The traditional statement of the financial position presented in then annual report, focus on
creditors need for credit rating analysis. In the reformulated statement the focus is on what
assets and liabilities are related to operating and non-operating activities respectively. The
reformulation of the financial position or balance sheet leads to the term Invested Capital,
which represents the total capital needed to fund operations without any concern to the
source of capital (Koller et al., 2005).
Operating assets – Operating liabilities = Invested capital = Debt + Equity
However, the equation above is very simple compared to what companies face in reality, it
illustrates how capital from investors are used to finance operations. The major elements in
reformulating the balance sheet is assed here and the reformulated balance sheet can be
found in appendix E and in the excel file – Financials – Balance sheet.
Working cash vs. Excess cash and marketable securities
DONG Energy holds a relative large amount of cash and marketable securities, which not
can be considered a part of operating assets. However, a proportion is assumed to be

42
working cash, as DONG Energy like any other company needs cash on a day-to-day basis
in order to paid its bills. For DONG Energy working cash is determined as 2% of revenue,
which is higher than recommended by Penman (2013). However, DONG Energy needs
working cash to enter hedge positions when needed, and hence 2% of revenue is assumed
as the right size for DONG Energy.
Hybrid capital
As already mentions hybrid capital is debt with equity features. The hybrid capital issued
by DONG Energy is rated as 50% equity and 50% debt by credit rating agencies like S&P,
Moody’s and Fitch (DONG Energy A/S, 2013b; Ussing & Winther, 2013) Thus, it is
decided to split DONG Energy’s hybrid capital on a fifty-fifty basis in the reformulated
balance sheet.
Operating leases
One important part of reformulating DONG Energy’s financial statements concerns
operating leases. In general, lease is commonly used to finance asset, just as debt and
equity. However, operating leases are not recognized in the balance sheet and are reported
as one rental expense, which does not separate the interest expense from the lease payment
(Koller et al., 2005). Thus, operating leasing leads to artificially low operating profit and
artificially high return on invested capital. The adjustment concerning the operating leases
aims to make return on capital and free cash flows independent of the capital structure
(Koller et al., 2005). Information about operating leases can be found in the notes from
DONG Energy’s financial statements. In the annual report notes, DONG Energy has
provided information about operating leasing, including the present value of operating lease
assets for 2012 and 2013. However, there is no direct information about the present value
for earlier years. Thus, these numbers are estimated bases on the asset value formula
(Koller et al., 2005).
, kd = cost of debt = internal rate of return
Table 7 - Capitalization of operating leases
Own construction based on numbers from DONG Energy’s annual reports
Asset _Valuet−1 =Lease_ paymenttkd +
1Asset _ life
"
#
$$$$
%
&
''''

43
DONG Energy has set the cost of lease capital to 4.5%, which according to Koller et al.
(2005) is assumed to be a fair cost for leased assets. Leased assets are relatively riskless and
thus cheap to finance, as the underlying assets secure leased assets. The average lifetime of
the leased assets are estimated based on the information provided in the notes (DONG
Energy A/S, 2008b, 2009, 2010, 2011, 2012, 2013b). The majority (65% in 2013) of
DONG Energy’s leased assets have a lifetime over five years. These leases assets comprise
among others land and seabed relating to wind farms in the UK until 2034, and gas storage
facilities in Germany until 2025 (DONG Energy A/S, 2013b). Hence, the average life time
is estimated to 12 years, which is well in accordance with a large research carried by Lim,
Mann, and Mihov (2003).
Capitalizing operating leases affect both the balance sheet and the income statement.
DONG Energy’s assets and liabilities are increased with the capitalized value of operating
lease asset. The income statement is affect by the interest part of the lease payment. For a
complete overview see appendix E. Beyond affecting the balance sheet and the income
statement, capitalizing operating leased asset do also affect the valuation of DONG Energy.
First of all it affect the cash flows through adjustment to NOPLAT, but it also affect the
WACC, as capitalized lease asset will be part of the capital structure. For more details see
section 4 about the WACC estimation.
5.2 Free Cash flow (FCF) The free cash flow is obviously an important element to determine the value of DONG
Energy by the DCF approach. The Free cash flow is according to Koller et al. (2005)
defined as:
FCF = Gross cash flow – Gross investments
Gross cash flows represent the real cash flows generated by DONG Energy’s operations.
This corresponds to NOPLAT plus noncash operating expenses which, for DONG Energy,
concerns depreciations. Gross investments represent the amount of cash invested in the
business which roughly speaking corresponds to the change in assets adjusted for
depreciations and amortizations (for further details see the excel file – Financials – Income
statement). These investments are expected to pay of over time and how much to invest will
depend on each company’s ambitions and opportunities.

44
Table 8 - Free Cash Flow calculation
Own construction based on reformulated accounting numbers.
The above table illustrates the story about how DONG Energy has made significant
investments over the last several years. This is interpreted as an expression of confidence in
both own competence and positive market conditions and for good reason, as was the
conclusion of the strategic analysis. DONG Energy wants to transform the energy system,
which requires substantial investment. Unfortunately the investments made have not really
started to pay off, which is one reason why DONG Energy has had negative free cash
flows. Thus, investments has been financed from external capital sources (primarily debt)
instead form gross cash flows.
5.3 Analysis of historical performance in more details
Understanding DONG Energy’s past performance is essential to forecast their future. Thus,
this section assess possible trends in DONG Energy’s long-term performance, which will
create a solid understanding of their key value drivers and help to make reasonable
assumptions about future cash flows.
5.3.1 Return on invested capital (ROIC)
First of all, return on invested capital (ROIC) will be analyzed. From the reformulation of
the income statement and the balance sheet, NOPLAT and Invested Capital were
determined, respectively. These two numbers leads directly to ROIC.
To minimize the risk of a biased ROIC, average invested capital is applied. Since profit is
earned throughout the year, the invested capital used to earn that profit must reflect the
average capital invest throughout the year (Koller et al., 2005). ROIC is preferred over
return on equity (ROE) and return on assets (ROA), because it focuses solely on DONG
Energy’s operating activities, while ROE mixes operating performance with capital
structure. ROA is an inadequate performance measure as it neglects the benefits of, for
instance, accounts payable that reduce the need for external capital (Koller et al., 2005).
ROIC = NOPLATAvgerage_ Invested _Capital

45
Figure 9 - DONG Energy's historical ROIC
Own construction based on reformulated accounting numbers.
First thing to notice from the figure above is that the difference between ROIC with and
without goodwill is insignificant. Hence, the operating performance is not distorted by
price premiums paid for acquisitions (Koller et al., 2005). Broadly speaking there is no real
trends in the direction or speed of DONG Energy’s ROIC. However, a average ROIC
slightly above 5% indicates relatively poor performance, as the energy industry, in general,
has earned 7.7% in the period from 1963 to 2003 (Koller et al., 2005) and 9.48% in 2009
(Pätäri, Jantunen, Kyläheiko, & Sandström, 2012). Further, DONG Energy’s historical
ROIC is below the WACC estimated to 6.72%, meaning that value is actually destroyed as
DONG Energy invests more capital. However, it must be kept in mind that DONG Energy
is going through a costly transformation, and that RIOC is expected to increase in the
future.
To better understand what has driven ROIC, it must be decomposed and analyzed in more
details. ROIC can be transformed as follows:
Hence, DONG Energy’s ROIC is driven by its ability to maximize profitability, optimize
capital efficiency and minimize taxes (Koller et al., 2005). The main drivers in ROIC,
except the cash tax rate, will be analyzed here. The cash tax rate will instead be discussed
in details in the budgeting section.
Invested capital
The average invested capital has been relatively stable with a slight upward trend in the
analysis period (see figure 9 above). As can be seen from the figure below, the majority of
E5,00%!
0,00%!
5,00%!
10,00%!
15,00%!
E50.000!
0!
50.000!
100.000!
2008! 2009! 2010! 2011! 2012! 2013!DKK"million"
Invested!capital!including!goodwill! NOPLAT! ROIC!including!goodwill!
ROIC = (1−Cahs_Tax _ rate) ⋅ EBITARevenues
⋅Revenues
Invested _Capital

46
DONG Energy’s invested capital are tired up in property, plant and equipment (PPE).
Hence, DONG Energy is considered an asset heavy company. As already mentioned
DONG Energy has invested heavily during the analyzed period and therefore it may seem
strange that invested capital has not increased further. However, DONG Energy has in
recent years made divestments in both operating and non-operating assets to release capital
to invest in other projects and written down on assets (DONG Energy A/S, 2013b).
Because PPE by far represent the majority of invested capital, a total breakdown of all
balance sheet items is excluded from this analysis.
Figure 10 - Breakdown of Invested Capital (average numbers)
Own construction based on reformulated annual report numbers.
Prospectively, DONG Energy expects to invest DKK 30 billion towards 2015 (DONG
Energy A/S, 2013b). Holding recent years depreciation and amortization costs constant
(DKK million 11.963 in 2012 and 12.963 in 2013) these investment will contribute to a
slight increase in invested capital. However, DONG Energy has in recent years faced high
impairment losses on assets, but for the coming years DONG Energy expects to reduce
these large losses (DONG Energy A/S, 2013b). For the further analysis it is assumed that
the distribution between invested capital items will remain constant at their historical
average rate. Furthermore, it is assumed that the overall invested capital will continue to
increase with revenue as the forecast driver. However, invested capital is expected to grow
slower than revenue over the long-term, as the investments made in the analyzed period are
expected to contribute to an increased ROIC. In particular the investments in Wind Power
and Exploration & Production, which cash flows are characterized, as illustrated in
appendix G.
0%!
20%!
40%!
60%!
80%!
100%!
2007! 2008! 2009! 2010! 2011! 2012! 2013!
Goodwill!
Intangible!assets!
Capitalized!operating!leases!
Net!nonEcurrent!operating!liabilities!Net!operating!assets!
Property,!plant!and!equipment!inkl.!net!construction!contracts!
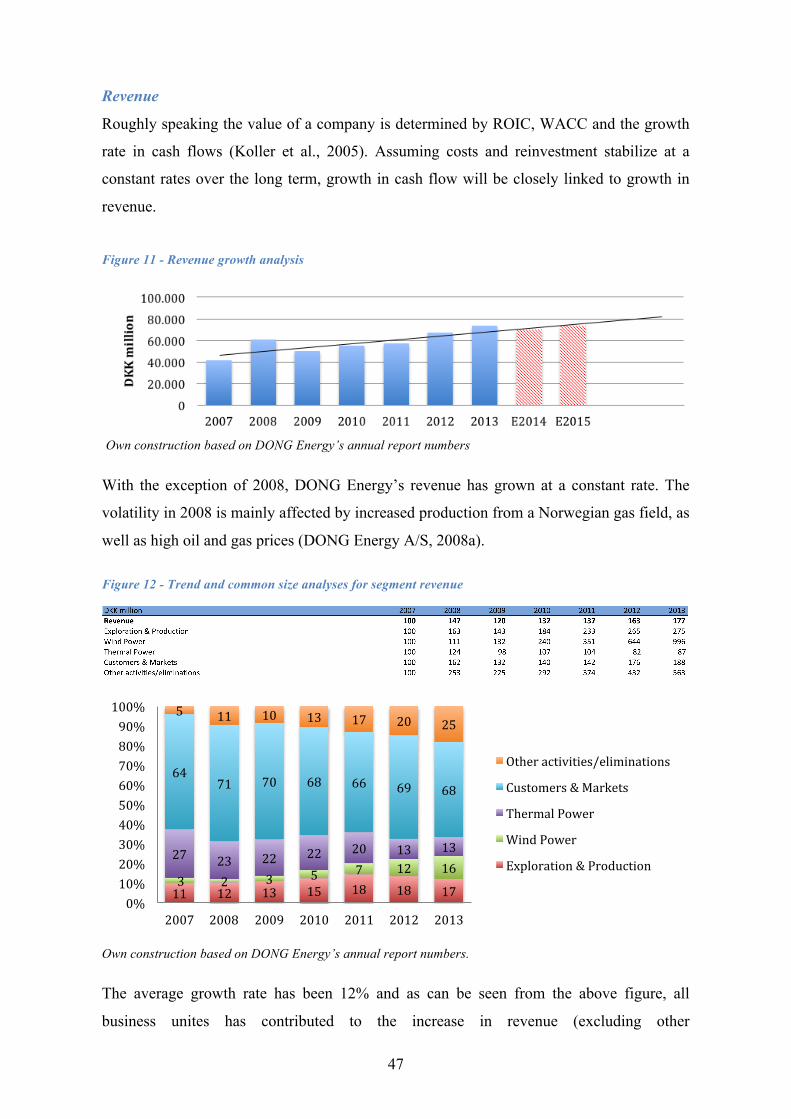
47
Revenue
Roughly speaking the value of a company is determined by ROIC, WACC and the growth
rate in cash flows (Koller et al., 2005). Assuming costs and reinvestment stabilize at a
constant rates over the long term, growth in cash flow will be closely linked to growth in
revenue.
Figure 11 - Revenue growth analysis
Own construction based on DONG Energy’s annual report numbers With the exception of 2008, DONG Energy’s revenue has grown at a constant rate. The
volatility in 2008 is mainly affected by increased production from a Norwegian gas field, as
well as high oil and gas prices (DONG Energy A/S, 2008a).
Figure 12 - Trend and common size analyses for segment revenue
Own construction based on DONG Energy’s annual report numbers.
The average growth rate has been 12% and as can be seen from the above figure, all
business unites has contributed to the increase in revenue (excluding other
11! 12! 13! 15! 18! 18! 17!3! 2! 3! 5! 7! 12! 16!27! 23! 22! 22! 20! 13! 13!
64!71! 70! 68! 66! 69! 68!
5! 11! 10! 13! 17! 20! 25!
0%!
10%!
20%!
30%!
40%!
50%!
60%!
70%!
80%!
90%!
100%!
2007! 2008! 2009! 2010! 2011! 2012! 2013!
Other!activities/eliminations!
Customers!&!Markets!
Thermal!Power!
Wind!Power!
Exploration!&!Production!

48
activities/elimination, which mainly handle internal sale). However, Exploration &
Production and in particular Wind Power have been the main drivers for the revenue
growth. This is no surprise, as DONG Energy has invested heavily in these business units
in recent years. The direct interpretation of this must naturally be that these business units
have high potential, which also was the conclusion of the strategic analysis. However, some
old tax deduction rules can have motivated DONG Energy to overinvest in oil and gas
fields (Skjerning & Tuxen, 2014). DONG Energy has not paid Danish tax on their
production in the North Sea and had unrecognized deferred tax assets worth DKK 11,049
million in the end of 2013 (DONG Energy A/S, 2013b). Prospectively, it means that
DONG Energy can activate these deferred tax assets at some point in the future and hence
reduce their tax burden, but only if DONG Energy will generate income from the
investments made in Danish and British oil and gas fields (DONG Energy A/S, 2013b). At
the moment, DONG Energy is not so far advanced in their investment cycle as other
companies in the North Sea. Hence, Exploration & Production is expected to contribute
even more to the over all revenue in the future. Even though Exploration & Production and
Wind Power have increased the most, Customer & Market is still by far the largest
contributor to revenue.
In conclusion, DONG Energy has had a relative stable growth in revenue, which is
expected to continue. However, divestment of non-core activities in 2013 for DKK 14.4
billion (DONG Energy A/S, 2013b) is expected to affect revenue negatively in 2014, as the
investments made in 2013 primarily was in wind, and oil and gas projects, which do not
generate cash flows immediately (see appendix G). For DONG Energy’s future revenue
Exploration & Production and Wind Power are expected to contribute more, and Thermal
Power and Costumers & Markets to contribute less in relative terms.
NOPLAT
During the analyzed period DONG Energy’s NOPLAT have been very volatile (ranging
from -1.614 to 6.972 DKK million) and no real trend can directly be observed. Hence, the
NOPLAT-drivers have to be analyzed separately. Net other operating income and operating
lease interest expenses are almost insignificant as they only represent about one per mille of
revenue on average (see excel file – Financials – Historical analysis). However, the other
costs are significant and, as can be seen from the figure below, cost of sales is the most
significant cost item for DONG Energy. In the period from 2007 to 2011 the cost of sales
was below or just about 60% of revenue, but in 2012 and 2013 the proportion has increased
up to 70%, which was mainly due to higher gas prices (DONG Energy A/S, 2013b).

49
Figure 13 - Analysis of costs as a percentage of revenue
Own construction based on reformulated annual report numbers.
Overall, DONG Energy’s costs ratio to revenue has increased during the analyzed period.
However, employee costs has been stable and other external expenses has actually
decreased. Analyzing costs on segment level provide evidence that Customers & Markets
despite its major contribution to revenue in recent years has destroyed or contributed only
to a lesser extent to EBITDA (see figure 14). The decrease in Thermal Power is mainly due
to its equivalent decrease in revenue contribution. On the other hand Wind Power and
Exploration & Production have in the most recent years become the main contributors to
EBITDA.
Figure 14 - Common size analysis of EBITDA on segment level
Own construction based on DONG Energy’s annual report numbers
2007! 2008! 2009! 2010! 2011! 2012! 2013!
Operatig!cash!taxes! 2! 5! 4! 6! 6! 2! 3!
Depreciation! 8! 6! 10! 10! 12! 14! 11!
Employee!costs! 6! 4! 6! 5! 6! 5! 5!
Other!external!expenses! 16! 13! 15! 12! 14! 12! 10!
Cost!of!sales! 57! 60! 61! 58! 56! 70! 65!
Revenue! 100! 100! 100! 100! 100! 100! 100!
0!
20!
40!
60!
80!
100!
120!
25! 32! 35! 36! 41!76! 49!6!
5! 6! 12!13!
29!28!
33! 18! 4!15!
14!
12! 5!38! 46! 54!36! 32!
E17!
16!3! 1!
E1! E1! 0!
0!
E4!
E20%!
0%!
20%!
40%!
60%!
80%!
100%!
2007! 2008! 2009! 2010! 2011! 2012! 2013!
Other!activities/eliminations!
Customers!&!Markets!
Thermal!Power!
Wind!Power!
Exploration!&!Production!

50
Looking forward DONG Energy’s costs are expected to decrease relatively to the revenue
as Wind Power and Exploration & Production which, as figure 14 shows, has lower costs
relative to revenue than Thermal Power and Costumers & Markets are expected to
represent a larger proportion of the overall revenue. Because there is no available
information about the future development in net other operating income, operating lease
interest expenses depreciation costs, employee costs, and other external expenses, these are
assumed to follow revenue at their historical average rate. A discussion of the taxes can be
found in the budgeting section.
5.3.2 Conclusion on the historical performance
In the analyzed period from 2007 to 2013, DONG Energy has invested heavily in physical
assets. Particularly within Wind Power and Exploration & Production. However, the return
from these investments has not been gaudy as DONG Energy’s average ROIC has been
below the industry. Despite a stable increase in revenue DONG Energy has not managed to
increase profit, which mainly is due to a negative development in the cost levels. In
conclusion, DONG Energy has not performed well in the past, but the future looks
interesting.
6 BUGETING For this valuation of DONG Energy it is decided to forecast for the strategic period up to
2020. Hence, there is basis for a comparison and discussion of the realism of DONG
Energy’s strategic goals based on the previous strategic and financial analyses. By setting
the budget period to 2020, it is assumed that DONG Energy at that time will be a more
mature company and thus a constant growth rate can be established, at that point in time.
This should also be seen in the light of an expected IPO of DONG Energy before the spring
2018. The overall purpose of the budgeting is to estimate DONG Energy’s future free cash
flows. From the financial analysis it should be clear that the main drivers for DONG
Energy’s free cash flows are revenue, NOPLAT, tax rate and invested capital. Hence, these
four drivers will be the main elements for the budgeting. However, other relevant items
included in the four drivers will also be assessed.

51
6.1 Revenue DONG Energy does not directly forecast on future revenue, but based on the finding in the
strategic analysis and the historical performance, the years up to 2020 is forecasted with the
utmost care.
First of all, divestment mainly in Wind Power- and Thermal Power activities as well as
non-core activities in 2013 for DKK 14.4 billion (DONG Energy A/S, 2013b) is expected
to affect 2014 revenue negatively. Hence, a 5% decrease in revenue is expected for 2014.
Despite the expected decrease in 2014, the overall trend is increasing revenue for DONG
Energy towards 2020. The strongest revenue growth occurs in 2015 and 2016 and is mainly
driven by an expected increase in oil and gas production from 87,000 BOE in 2013 to
130,000 BOE in 2016. This increase corresponds to a 14.3% annual growth, which is close
to the historical average at 15.9% (14.7% for 3-year average). From 2016 to 2020 DONG
Energy expect to increase the production up to 150,000 BOE. Hence, the growth in oil and
gas production is expected to slow down to 3.6% in the period from 2016 to 2020. Based
on the recent years investments in Exploration & Production, it seems fairly reasonable that
DONG Energy can achieve their goals concerning oil and gas production and thus,
Exploration & Production is expected to contribute positively to DONG Energy’s revenue
in the years to come. The forecast about Exploration & Production is associated with high
uncertainty, as they assume oil and gas prices to be fixed, which based on their historical
volatility might be doubtful. However, the focus of this thesis is not to forecast future oil
and gas prices, which for long maturities would be almost impossible. Furthermore, DONG
Energy’s oil and gas exposure is hedged almost 100% one-year ahead, which reduce the
price volatility risk. Thus, the current price for one BOE is assumed a fairly good proxy for
the future price.
Despite some smaller divestments in 2013, Wind Power is expected to contribute positively
to DONG Energy’s revenue towards 2020. DONG Energy’s strong position in offshore
wind and a global focus towards clean energy create a solid foundation for DONG Energy
to continue the historical growth. Historically DONG Energy’s revenue from Wind Power
has grown 51.7% on average (61.5% the 3 most recent years). Looking forward this rate is
expected to slow down as competition is expected to increase, but also because the
historical high growth rates reflect a start up in a new business unit. DONG Energy’s
position today is far more mature, and thus a lower growth rate is a natural consequence.
DONG Energy expects to increase installed capacity from 2,1 GW in 2013 to 3,5 GW in
2016 and 6,5 GW in 2020. Translated into annual growth rates it corresponds to 18% which
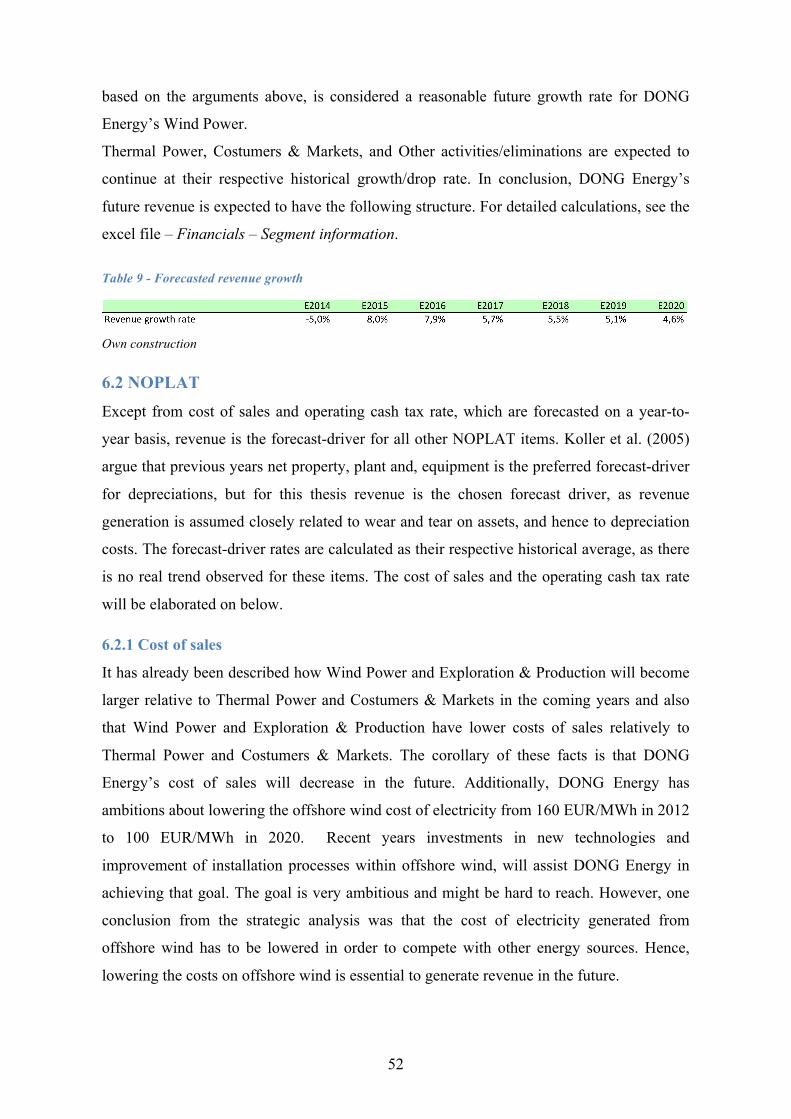
52
based on the arguments above, is considered a reasonable future growth rate for DONG
Energy’s Wind Power.
Thermal Power, Costumers & Markets, and Other activities/eliminations are expected to
continue at their respective historical growth/drop rate. In conclusion, DONG Energy’s
future revenue is expected to have the following structure. For detailed calculations, see the
excel file – Financials – Segment information.
Table 9 - Forecasted revenue growth
Own construction
6.2 NOPLAT Except from cost of sales and operating cash tax rate, which are forecasted on a year-to-
year basis, revenue is the forecast-driver for all other NOPLAT items. Koller et al. (2005)
argue that previous years net property, plant and, equipment is the preferred forecast-driver
for depreciations, but for this thesis revenue is the chosen forecast driver, as revenue
generation is assumed closely related to wear and tear on assets, and hence to depreciation
costs. The forecast-driver rates are calculated as their respective historical average, as there
is no real trend observed for these items. The cost of sales and the operating cash tax rate
will be elaborated on below.
6.2.1 Cost of sales
It has already been described how Wind Power and Exploration & Production will become
larger relative to Thermal Power and Costumers & Markets in the coming years and also
that Wind Power and Exploration & Production have lower costs of sales relatively to
Thermal Power and Costumers & Markets. The corollary of these facts is that DONG
Energy’s cost of sales will decrease in the future. Additionally, DONG Energy has
ambitions about lowering the offshore wind cost of electricity from 160 EUR/MWh in 2012
to 100 EUR/MWh in 2020. Recent years investments in new technologies and
improvement of installation processes within offshore wind, will assist DONG Energy in
achieving that goal. The goal is very ambitious and might be hard to reach. However, one
conclusion from the strategic analysis was that the cost of electricity generated from
offshore wind has to be lowered in order to compete with other energy sources. Hence,
lowering the costs on offshore wind is essential to generate revenue in the future.

53
In conclusion, DONG Energy’s cost of sales as percentage of revenue is expected to
decrease in the coming years. Particularly compared to 2012 (70%) and 2013 (65%), but
also compared to the historical average at 61% (for calculation details see the excel file –
Financials – Budgeting). The table below summarize DONG Energy’s expected cost of
sales.
Table 10 - Forecasted costs of sales
Own construction
6.2.2 Operating cash tax rate
In order to estimate an appropriate future operating cash tax rate for DONG Energy certain
assumptions have to be made. The most important assumption concerns how much of the
future income, before tax, is coming from the business unit Exploration & Production, as
this unit is dealing with the high hydrocarbon taxation (Skat.dk, 2014). Oil and gas
extracted in the Danish part of the North Sea are taxed at approximately 70% while the
Norwegian part is taxed at 85% (C.-A. Jensen, 2012). In the financial year for 2013, the
average taxation of oil and gas were 78% (DONG Energy A/S, 2013b). This taxation rate is
assumed as a good proxy going forward, as DONG energy’s current portfolio of oil and gas
fields is assumed to be more or less fixed in regard to country location. Hence, a taxation of
78% will be applied on operating income from Exploration & Production. As information
about income before tax or EBIT is not available on segment level, EBITDA is used as the
best proxy. In the excel file – Financials – Estimating tax rate, detailed information about
the future distribution of EBITDA as well as operating cash tax rate for each year towards
2020 is provided. The highlight is presented in the table below.
Table 11 - Forecasted operating cash tax rate for DONG Energy
Own construction
The forecasted operating cash tax rate is mainly affected by the development in EBITDA
from Exploration & Production. The proportion of Exploration & Production is expected to
be relatively stable with a little downtrend. The little downtrend is due to a relatively higher
growth in Wind Power. More aspects are taken into consideration when calculating the

54
operating tax. Despite from the EBITDA-distribution between the business units, the
development in the Danish statutory tax rate and adjustments for non-operating tax effects
are also taken into consideration. As described earlier, the Danish statutory tax rate is
decreasing towards 2016, which affect DONG Energy’s tax rate, and thus the value of
DONG Energy, positively. The 15% tax adjustment rate is based on the historical
difference between the operating cash tax rate and the reported tax rate. This difference is
assumed fixed, as non-operating items is forecasted with revenue as the forecast driver. In
conclusion, DONG Energy’s operating tax rate range form 56% to 59% in the forecasted
period, which is higher than the historical rate. However, losses in recent years and low
contribution from Exploration & Production in the early years make it hard to compare the
past with the future.
6.3 Invested capital As mentioned earlier, invested capital is expected to increase towards 2020, as DONG
Energy is expected to continuing in transforming the energy system, however, at a lower
rate than revenue. Except from goodwill, which is held constant at its 2013 level throughout
the period, all other invested capital items are forecasted on their historical average
proportion of invested capital. Hence, they are forecasted with revenue as the indirect
forecast driver, which is recommended by Koller et al. (2005). It could be argued that cost
of sales is a better forecast-driver for inventories, but as this budgeting does not forecast on
line item, this is considered irrelevant. The expected growth rates for invested capital is
summarized in the below table.
Table 12 - Forecasted invested capital growth rate for DONG Energy
Own construction
6.4 RIOC Based on the forecasted income statement (NOPLAT) and balance sheet (Invested capital),
ROIC can be calculated right away. As can be seen from the below table ROIC is
increasing throughout the forecasted period. However, the rates are relatively low
compared to DONG Energy’s future WACC (6.72%), but in particular compared to the
historical industry average (7.7%). The rates are also significant below DONG Energy’s
own return measure, return in capital employed (ROCE), which is >10% in 2016 and >12%
in 2020. Hence, the forecast made in this analysis underestimates DONG Energy’s future

55
performance and hence the value of the company compared to their own expectation/ goals.
However, the rates are overall better than the historical performance (5.19%). The effect on
the valuation with higher ROIC ratios will be analyzed in the scenario analysis later on.
Table 13 - Expected future ROIC for DONG Energy
Own construction
6.5 Free cash flow Calculating the free cash flows for the forecasted period are straightforward and the results
are presented in the table below. The general trend is increasing FCF, simply because
revenue and hence NOPLAT is growing faster than invested capital, and hence gross
investments.
Table 14 - Expected future free cash flow for DONG Energy
Own construction
6.7 Estimating the continuing value
The forecasted period is undoubtedly very important for the valuation of companies and
DONG Energy is no exception. However, most value is often generated in the continuing
value period, which is the period beyond the forecasted period (Koller et al., 2005). Not
necessarily because most value is generated in that period, but rather because of a large
cash outflows in the forecasted period, which pay off in the continuing value period (Koller
et al., 2005). Estimating the continuing value makes assumptions about a constant revenue
growth, a fixed distribution between revenue and NOPLAT and a constant return on capital
(Koller et al., 2005). Historically, DONG Energy and the energy industry’s revenue have
grown faster than the economy (Koller et al., 2005). However, only few companies and
even fewer industries grow faster then the economy forever (Koller et al., 2005). Hence,
DONG Energy’s revenue growth is assumed to follow the over all economic growth, which
based on Danish date for the last 15, is estimated to 3% (for calculations see excel file –
Financials – Estimating Growth rate).
DONG Energy’s return on capital has, as mentioned earlier, on average been below both
the WACC and the industry average, but is expected to increase in the coming period, as

56
illustrated in the forecasted RIOC. However, returns on capital higher than the WACC is in
economic theory considered as abnormal returns, which eventually will be eliminated by
higher competition (Koller et al., 2005). Hence, return on investments for the continuing
value period is assumed to equal the WACC at 6.72%. Setting RONIC and the WACC
equal, leaves the continuing value formula presented in section 4.2 as
Hence, the growth in revenue is almost neglected as it only affects NOPLATt+1.
7 VALUATION OF DONG ENERGY
7.1 DFC valuation
With the WACC and all future cash flows estimated, the inputs to the DCF approach are in
place and the value of operations can be calculated right away.
Figure 15 - Calculating the value of DONG Energy
Own construction based on forecasted numbers
The value of operations is calculated to DKK 112,760 million, but to find the equity value,
excess cash, and cash equivalents as well as the value of non-operating assets have to be
added. Excess cash and cash equivalents are reported at their fair market value on the
balance sheet. Thus, the reported numbers at 31 December are considered a good proxy.
Estimating the value of non-operating assets, which mainly concerns investments in
associates and joint ventures, is more complex. These are recorded at historical costs, which
Continuing_Valuet =NOPLATt+1WACC
=10,1516.72%
=151,061

57
is unlikely to be equal to today’s market value. However, it is not considered devastating
for the overall valuation of DONG Energy to estimate the exact value of non-operating
assets, and thus the book values are used as a proxy. Hence, the enterprise value of DONG
Energy is calculated to DKK 133,664 million. To calculate the value of common equity, the
value of non-equity claims have to be deducted (Koller et al., 2005). Debt claims including
hybrid capital is recorded at market values and is considered good proxies. The value of
operating leases has already been estimated and can be applied directly. As DONG
Energy’s non-controlling interests are not public traded, the book value is assumed as a
fairly good proxy for the market value of these non-controlling interests. In conclusion, the
equity value of DONG Energy is calculated to DKK 63,631 million.
7.2 Sensitivity analysis Although, the forecasted value drivers for DONG Energy is estimated with great care, they
are subject to some uncertainty. Unexpected changes in commodity prices, exchange rates,
interest rates, legislations etc., will one way or the other affect the value of DONG Energy.
The purpose of this section is to assess how sensitive the developed model, and hence the
value of DONG Energy is to changes in the value drivers.
7.2.1 NOPLAT-drivers
The value of DONG Energy is highly depended on the forecasted NOPLAT, as both the
forecasted FCF and the continuing value are closely related to NOPLAT. As mentioned
earlier, the revenue, the cost of sales, and the cash tax rate are considered the main drivers
for NOPLAT and are the parameter of interest for this analysis.
Figure 16 - Sensitivity analysis on NOPLAT-drivers
Own construction based on forecasted numbers
The figure above illustrates how an additional 5% change in the forecasted revenue, cost of
sales, and cash tax rates affect the enterprise value of DONG Energy. A 5% positive change
in revenue is the most significant, as it change the value of DONG Energy with DKK

58
51,339 million or 38%. However, a 5% increase in revenue in all forecasted years is
considered unlikely, as it for almost every year, double the best estimate for the future
growth rate. Furthermore, an additional 5% increase in revenue will most likely be driver
by an increase in commodity prices and not an increase in the quantity sold. Hence, the
costs of sales within Thermal Power and in particular within Costumers & Markets are
expected to increase by the same amount. Isolated changes in cost of sales and cash tax rate
do also affect the value of DONG Energy significantly. For more detailed calculations of
each driver see the excel file – Financials – Sensitivity analysis.
7.2.2 Cost of capital (WACC)
Estimating the WACC was a very complex process involving aspect such as DONG
Energy’s future capital structure, default spread and beta as well as the market risk
premium and the risk free rate. All these parameters are subject to uncertainty on an
individual basis, but for this sensitivity analysis the WACC is analyzed as a whole.
Figure 17 - Sensitivity to change in the WACC
Own construction based on forecasted numbers
In the figure above the value of DONG Energy is analyzed with the WACC ranging form
5% to 8% which is considered a plausible range for DONG Energy’s WACC, depending on
the assumptions made. Using the current low risk free rate as the best proxy for the long-
term risk free rate would have resulted in an estimated WACC close to 5%. On the other
hand, a higher market risk premium or/and a higher beta would have resulted in a higher
WACC.
Figure 17 illustrates how sensitive the value is to changes in the WACC. In the relatively
small range from 5% to 8% the enterprise value vary from DKK 238,851 million to DKK
102,531 million. Thus, it is essential that the estimated WACC is as close as possible to the
true WACC.
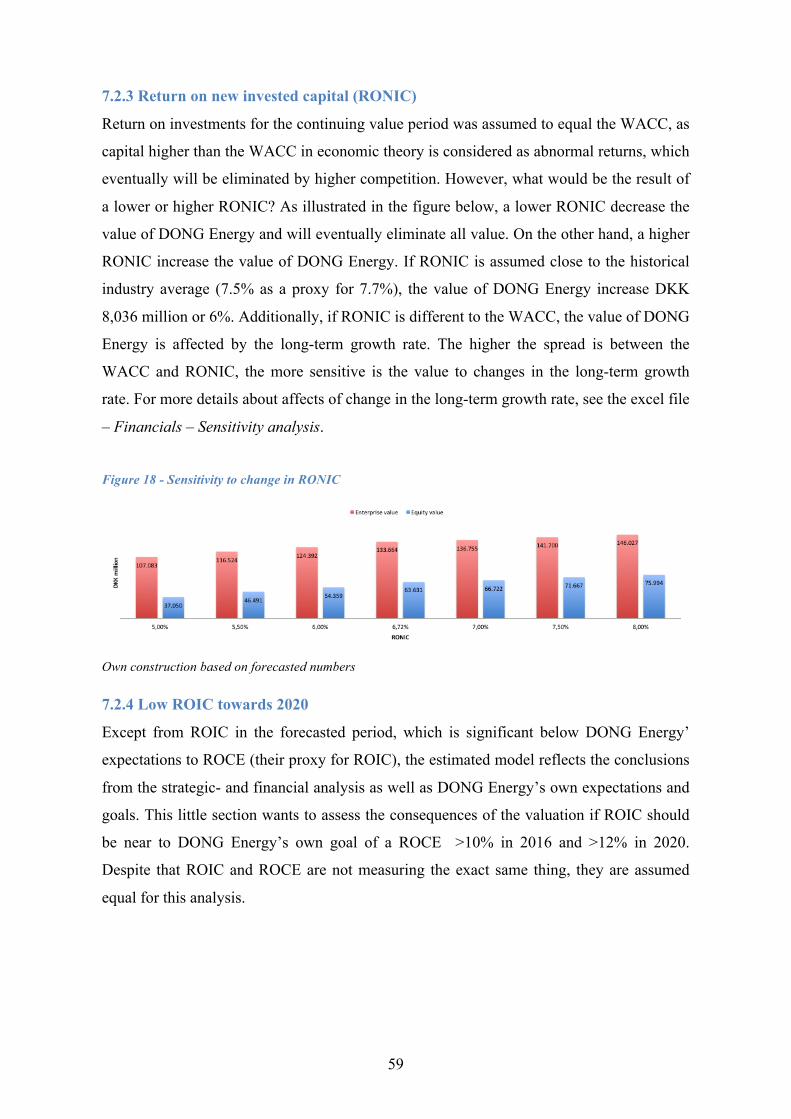
59
7.2.3 Return on new invested capital (RONIC)
Return on investments for the continuing value period was assumed to equal the WACC, as
capital higher than the WACC in economic theory is considered as abnormal returns, which
eventually will be eliminated by higher competition. However, what would be the result of
a lower or higher RONIC? As illustrated in the figure below, a lower RONIC decrease the
value of DONG Energy and will eventually eliminate all value. On the other hand, a higher
RONIC increase the value of DONG Energy. If RONIC is assumed close to the historical
industry average (7.5% as a proxy for 7.7%), the value of DONG Energy increase DKK
8,036 million or 6%. Additionally, if RONIC is different to the WACC, the value of DONG
Energy is affected by the long-term growth rate. The higher the spread is between the
WACC and RONIC, the more sensitive is the value to changes in the long-term growth
rate. For more details about affects of change in the long-term growth rate, see the excel file
– Financials – Sensitivity analysis.
Figure 18 - Sensitivity to change in RONIC
Own construction based on forecasted numbers
7.2.4 Low ROIC towards 2020
Except from ROIC in the forecasted period, which is significant below DONG Energy’
expectations to ROCE (their proxy for ROIC), the estimated model reflects the conclusions
from the strategic- and financial analysis as well as DONG Energy’s own expectations and
goals. This little section wants to assess the consequences of the valuation if ROIC should
be near to DONG Energy’s own goal of a ROCE >10% in 2016 and >12% in 2020.
Despite that ROIC and ROCE are not measuring the exact same thing, they are assumed
equal for this analysis.

60
Table 15 - The effect of a ROIC at 10% in 2016 and 12% in 2020
Own construction based on forecasted numbers
The figure above illustrates one model of how DONG Energy can achieve the ROIC
(ROCE) goals for 2016 and 2020. Compared to the rates forecasted in section 6 and the
conclusions from the strategic and financial analyses, the additional growth rates, illustrated
in table 15, seem a bit unrealistic. Especially when taking recent year’s poor return
performance into account. However, imagine DONG Energy managing to achieve their
return performance goals, the value will be affected significantly. Holding all aspect of the
WACC constant DONG Energy’s enterprise value increase from DKK 133,664 million to
DKK 192,230 million or 44%. In conclusion, it is our conviction that DONG Energy's own
return goals are a bit too optimistic. Certainly if the return performance is only driven by
operations and not divestment in assets.
7.3 Relative valuation by multiples In extension of the DCF approach, relative valuation by multiples is applied to value
DONG Energy and hence validate the results found. The peer group of the six energy
companies and the valuation multiples defined in section 4 will be the main drivers for this
valuation. Based on the company data retrieved from the Thomson one terminal, average
and median numbers are calculated for each multiple. All numbers and calculations can be
found in appendix H and the excel file – Financials – Multiples valuation, while only the
values are illustrated in figure 19 below. Notice that median numbers are preferred over
average numbers, as they reduce the risk and hence the effect of outliers.

61
Figure 19 - Summery of multiples valuation
Own construction based on multiples calculations.
Except from the values calculated based on P/B, all other multiple values are significant
below the DCF result of DKK 63.631 million. Notice that there are no 2013-values
calculated for P/E and EV/EIBT, as both EBIT and earnings are negative in 2013. The
value calculated by P/E is by far the most pessimistic, as it value DONG Energy’s market
cap at DKK 16,008 million. On average the multiple valuation based on 2014 numbers
value DONG Energy’s market cap at DKK 44,714 million (DKK 53,261 million for 2013
numbers).
Multiple valuation values significant below the DCF value indicates that investors value the
sector different and that the DCF forecasts might be too optimistic. However, it must be
taken into consideration that DONG Energy still is in the middle of a transformation
process and that sale and in particular earnings are underperforming currently. In
conclusion, it is our conviction that the multiple analysis is negatively bias by the
transformation going on in DONG Energy. Thus, the 2014 average is adjusted for the effect
of P/E and the value is revised upward to DKK 50,456 million. The market cap value is still
low compared to the DCF result. However, DKK 50,456 million is considered the best
estimate from the multiples analysis.
7.4 Fair value estimation of DONG Energy Based on the conclusions form the DCF model including its sensitivity analysis and the
multiples valuation, a fair value estimate of DONG Energy will be defined here.
As illustrated in table 16 below, the DCF and Multiple approaches are weighted at
respectively 60% and 40%. The DCF approach is weighted relatively higher for more
reasons. First of all, the DCF-approach is considered the main valuation driver for this
thesis and hence has analyzed DONG Energy in more details than the Multiple valuation.
Secondly, we are concerned that the Multiples valuation is negatively biased by DONG

62
Energy’s ongoing transformation. Thus, the best estimate of a fair value for DONG Energy
is DKK 58,361 million.
Table 16 - Fair value estimate-model
Own construction.
In connection with the capital increase, Goldman Sachs bought 18% of the equity for DKK
8 billion corresponding to a total equity value of DKK 44.4 billion (DONG Energy A/S,
2013a). Thus, the fair value estimate calculated from the DCF and Multiple valuation
approaches is significant higher. However, DKK 44.4 billion is only 80% of the equity
book value and on that basis it looks like there is provided a discount. It is not uncommon
that large institutional investors providing capital to companies in financial difficulties
being accommodated with a generous discount (Gandal, 2014). Remember that DONG
Energy needed new equity capital to retain its credit rating and capital in general to carry
out their transformation of the energy system. Additionally, a risk premium is usually
given. Even though the investors negotiated some favorable conditions that minimized their
risk (Gandal, 2014), there are still risks associated with the investment in DONG Energy.
Thus, a fair value at DKK 58,361 million for DONG Energy is, in conclusion, not
considered too high.
8 INITIAL PUBLIC OFFERING (IPO) This section will focus on IPO theory in general and not make direct references to DONG
Energy. However, a potential IPO of DONG Energy will be an exit strategy for existing
shareholders and will not have the intention of raise further capital (DONG Energy A/S,
2014f). Thus, an IPO of DONG Energy will be in line with what we have seen in the
Danish IPO market the last couple of years with the listing of Pandora, Matas, ISS and OW
Bunker.
8.1 Introduction and motivation When a company wants to raise additional equity capital it can be done through an Initial
Public Offering (IPO), where the company sells shares to the public for the first time. The
shares sold in the IPO can be categorized as either being new shares that raise new capital
63
for the IPO firm, known as primary offering, or existing shares that are sold by current
shareholders, as part of their exit strategy, known as secondary offering (Berk & DeMarzo,
2011). After the IPO the shares of the IPO firm will be listed on an exchange and be
actively traded in the secondary market, often with large amounts of shares shifting hands
each day. The area of IPOs is a widely studied and investigated topic in finance and it is of
great importance. This thesis seeks to investigate the price discount given to the investors
who participate in an IPO. There are many potential explanations of why investment
bankers discount an IPO, also known as “leaving something on the table”, and these will be
elaborated on in section 8.2 - Review of relevant theory.
Pricing an IPOs is often described as a combination of science and art (McCarthy, 1999).
The scientific component of the pricing equation involves numbers and the use of
quantitative models to estimate a fair value of the firm. The artistic component refers to the
investment banker’s ability to correctly assess the conditions of the IPO market and to
estimate the potential demand of the offering. To estimate the fair value of the IPO firm the
investment bankers use a mix of quantitative models and valuation methods. The most used
valuation method is the comparable firm approach, which is used by 87.28% of the
underwriters. The DCF and the dividend discount model (DDM) are also common used.
Both individually and combined and 59.21% % of the underwriters use these methods
(Roosenboom, 2012). Valuation methods such as economic value added and underwriter-
specific techniques are less used as respectively 19.29% and 11.40% of the underwriters
use these methods (Roosenboom, 2012).
To investigate the potential discount on Danish IPOs the comparable firm approach will be
applied. Furthermore, calculating the potential premium or discount given on Danish IPOs
the comparable firm approach uses market multiples of a peer group and compares those to
the market multiples of the IPO, and thus gives a premium or discount.
The comparable firm approach has, according to How et al. (2007), obtained significant
popularity because of its simplicity relative to other valuation methods and because of the
straightforward availability of the information required to implement this valuation, i.e.
market multiples of listed peer group firms and accounting data for the IPO firm.
This thesis will apply the comparable firm approach to investigate the potential discount on
Danish IPOs from 1997 to 2014. This thesis will also use the first day return as a proxy for
a potential discount. Furthermore, this thesis will investigate if there is a difference in the
discount given on Danish IPOs inside and outside an IPO wave. This is the first study using
the comparable firm approach to analyze a potential discount ever conducted on the Danish

64
IPO market. Only an analysis of the first day return as a proxy of a potential discount on
Danish IPOs has earlier been conducted and this thesis will thereby be able to contribute
with new empirical evidence on the Danish IPO market. It is very interesting to perform a
study contributing with new empirical evidence, especially in an area as significant as
Danish IPO’s, which is great motivation for this thesis.
8.2 Review of relevant theory
8.2.1 Theory of IPOs
When conducting an IPO the firm offers shares for sale to the public for the first time. The
managers of the firm that wants to go public work together with an underwriter, which is an
investment banking firm that is in the business of managing and structuring IPOs. If it is a
large offering the IPO might be managed by a group of underwriters, where the lead
underwriter has the primary responsibility of managing the IPO (Berk & DeMarzo, 2011).
The agreement between the underwriter(s) and the firm going public can vary between
different methods. If the firm going public is a well-know brand and name, and the
investments bankers assess that the demand will be strong the underwriters will often agree
to a firm-commitment IPO. Here the underwriter guarantees that it will sell all shares at the
offer price and if it cannot sell the entire issue to investors, the underwriter will have to sell
the remaining shares at a loss or buy them itself. This gives an incentive for the
underwriter(s) to underprice/discount the IPO in order to reduce their own exposure to
losses. In this kind of agreement, the underwriter purchases the entire issue slightly below
the offering price, which is part of the fee to the underwriter, and resells it at the offering
price. If the IPO is rather small and the underwriter is scared of not being able to sell all of
the shares at the offering price, it will enter into a best-effort IPO agreement. Here the
underwriter does not guarantee that all the shares will be sold at the offer price, but tries to
sell all shares at the best possible price. Often there is an all-or-none clause in this
agreement, so if all shares are not sold the deal is called off. The risk for the underwriter is
significant higher in the firm-commitment IPO agreement than in the best-effort IPO
agreement and therefore the fees are also higher for the firm commitment IPO agreement.
Companies going public have to register at the national financial regulator and they also
have to prepare a comprehensive prospectus, together with the underwriter(s) and legal
professionals, where all details of the IPO are contained. The prospectus is sent out to
investors early in the process, to give them a chance to analyze the companies and thereby
assess their demand for shares. The process of setting the final offering price based on the

65
interest from investors is called book building. When the final offering price is set it is all
about selling the shares to investors. Then at a specified date, the company will be trading
public for the first day and investors and the underwriter(s) will follow it closely. Many
firms later come back to the market to raise additional capital, known as Seasoned Equity
Offering (SEO).
8.2.2 The advantages and disadvantages of IPOs
The best know advantages of going public are better access to capital and increased
liquidity as well as the management of a public trading firm can obtain information about
the shareholders point of view on a specific decision made by management, by watching
the share price (Berk & DeMarzo, 2011). An IPO does also give the firm access to larger
amounts of capital, both through the IPO, but also in a potential later SEO. More often than
not, firms that have gone public through an IPO will later return and offer new shares for
sales through an SEO. It is often due to the firm believing it has profitable growth
opportunities, which it want to finance through an SEO (Berk & DeMarzo, 2011). When
the firm shares are trading public, the trading volume of the shares increases significantly,
thereby increasing liquidity of the firm’s shares, which is an advantage to the existing
investors. Going public also gives the existing shareholders of the firm the ability to
diversify their holdings and provides a potential exit strategy.
Besides the above mentioned advantages of an IPO, an IPO can also increase the publicity
and awareness of a firm. Both institutional and retail investors will buy the shares of a
listed firm, which potentially increases the awareness of the firm in the public.
Furthermore, journalists and analysts will publish news articles and recommendations about
the firm which will increase the publicity of the firm. Increased awareness and publicity
can potentially mean more customers and increased brand value, if the company performs
well and avoid damaging media coverage.
The disadvantages of going public concern the lack of ownership concentration and the
large direct costs attributable to the IPO, as well as the large longer-term cost of the IPO.
The ability of investors to diversify their holdings after going public is also a potential
major disadvantage of an IPO. When shareholders diversify their holdings the shareholders
of the firm becomes more widely dispersed and the lack of ownership concentration can
potentially undermine the shareholders ability and willingness to monitor the management
of the firm (Berk & DeMarzo, 2011). The reason for this is that only large shareholders can
afford the costs of monitoring the management, since the costs are a much smaller fraction
for the large shareholders. The costs associated with monitoring management are mostly

66
the time spent and costs of hiring consultants to conduct the analysis. Even if small
shareholders were willing to pay the cost of monitoring the management of the firm it
might still be much easier for large shareholders, since they potentially have the ability to
sit on the board of directors or affect decision by having a significant amount of votes.
The direct costs of an IPO include fees to underwriters, external auditors as well as legal
and advisory fees, while longer-term costs includes costs of developing external reporting,
investors relations, and human resource functions, which are necessary for a public firm in
order to comply with regulations (PWC, 2012). Furthermore, there can also be costs
associated with aligning shareholders and management incentives by instituting incentive
plans (PWC, 2012). The large direct costs of doing an IPO are mainly composed of very
large fees to the underwriters. The underwriters on average purchases the shares of the IPO
firm 7% below the final offering pricing (Berk & DeMarzo, 2011). A 2012 survey from
Price Waterhouse Coopers (PWC) of IPOs in the US does also conclude that the total fees
to underwriters equals 5-7% of gross proceeds from the IPO (PWC, 2012). Beside the large
fees to underwriters US companies on average incur additional $3.7 million of costs
directly attributable to the IPO and more than $1 million of one-time costs as a result of
going public (PWC, 2012). Even after having completed an IPO a firm will on average
have $1.5 million of recurring costs as a result of being public (PWC, 2012).
Even though the advantages of an IPO are many, the disadvantages are also significant. The
companies must assess that the advantages outweighs the disadvantages, because the
number of IPOs have been rising over the last two decades (Berk & DeMarzo, 2011).
8.2.3 The Efficient Market Hypothesis
The Efficient Market Hypothesis (EMH) is a fundamental assumption for many empirical
studies in finance including this thesis. The analysis of a potential discount of Danish IPOs
requires that the shares of the peer group are correctly priced and therefore that new
information is reflected correctly and immediate in the share price. Additionally, the EMH
is also an essential assumption when using first day return as a proxy for the
premium/discount of IPOs. The EMH is also an important assumption for the calculation of
DONG Energy’s fair value using peer group multiples. In order to calculate the correct
value of DONG Energy using peer group multiples, the peer group of DONG Energy has to
be correctly priced.
Fama (1970) defined an efficient market as: A market in which prices always fully reflect
available information. Thus, share prices in an efficient market reflect all accessible
information and only new information will affect the share price. Since new information is

67
not per definition possible to predict, share prices will vary randomly and therefore follow a
random walk (Ackert & Deaves, 2010). It can be argued that the market cannot fully reflect
all available information immediately, since there are costs associated with collecting and
processing information, and no investor will bear the costs of collecting and processing
information, since the information, according to Fama (1970), can be obtained just by
watching the share price (Christensen & Pedersen, 1998). A more general definition of an
efficient market is therefore: “A market is efficient with respect to information setθ , if it is
impossible to make economic profits by trading on the basis of information set θ (M. C.
Jensen, 1978). This is a more general definition, that concludes, that a market is efficient
when it is not possible to create an abnormal return, when adjusting for cost of collecting
and processing information and for trading cost (Ackert & Deaves, 2010). The EMH will
not be elaborated on further in this thesis, but is assumed to be satisfied.
8.3 Review of relevant empirical evidence According to Kim and Ritter (1999) the comparable firm approach, i.e. the use of
accounting numbers in conjunction with comparable firm multiples, is widely
recommended in both practitioners and academics publications, as well as being standard
practice in many IPO Valuation case studies. The approach is also frequently used in
studies and as a quantitative model for pricing IPO companies (Alford, 1992; Benninga &
Sarig, 1997; How et al., 2007; McCarthy, 1999; Roosenboom, 2012).
There have been conducted several studies on the premium/discount of IPOs using the
comparable firm approach. One of the most recent studies have been performed by
Roosenboom (2012) on 228 French IPOs. He concludes that IPOs are underpriced with
respectively 7.6% and 12.9% using median and average multiples. Houston, James, and
Karceski (2006) conducted a study on US IPOs and concluded that offer prices are set at a
10% discount compared to the mean comparable firm multiple. However, they also
conclude that the discount of 10% is not significant different from zero.
How et al. (2007) conducted an analysis on 275 Australian IPOs from 1993 to 2000 with
focus on Price/earnings (P/E) and Price/book (P/B) multiples. They used the median
comparable firm multiple, and conclude that using P/E multiples the IPO is underpriced
between 6.44% and 21.54%, depending on how comparable firms are selected. Using P/B
multiples they find that IPOs can range from being underpriced 13.63% to being overpriced
1.95%, depending on how comparable firms are selected. According to Kim and Ritter
(1999), who analyze the effectiveness of using the comparable firm approach to value IPO
using a sample of 190 US IPO from 1992 to 1993, it is standard practice to use industry

68
multiples to value IPOs and then adding or subtracting 10-20% to reflect differences in for
example growth rates and quality of earnings.
The first day return can be used as a proxy for the premium or discount of each IPO, since
if the market is efficient, then all available information will be reflected immediately in the
price. Thus, if an IPO delivers a first day return of for example 10%, then assuming the
EMH is satisfied, this can be seen as the IPO was underpriced with 10%.
Underwriters generally set the offering price, so that the first day return is positive (Berk &
DeMarzo, 2011). The average first day return on US IPOs between 1960 and 2007 was
17%, while the first day return for Danish IPOs was approximately 8% between 1984 and
2006 (Berk & DeMarzo, 2011). A thesis undertaken by (Sølversteen & Kristensen, 2004)
investigates underpricing for 55 Danish companies listed between 1990 and 2002 and the
relation between underpricing and information disclosed in the prospectus. They use the
first day return as a proxy for underpricing and conclude that the average underpricing was
9.18%, which is in accordance with the other studies of the first day return.
The mentioned studies generally points toward a discount on the offering price when
companies are going public. The magnitude of the discount varies considerably. The studies
using the comparable firm approach by Roosenboom (2012), Houston et al. (2006), How
and Lam (2007), Kim and Ritter (1999) gives an average discount of 10.25%, 10%, 9.92%
and 15% respectively (taking the average of the average/median or the interval). This is in
line with Sølversteen and Kristensen (2004) who found a discount of 9.18% on Danish
IPOs using the first day return and the first day returns of, respectively, 17% and 8% for US
and Danish IPOs (Berk & DeMarzo, 2011).
Even though the average first day return is on average positive, investors cannot create
abnormal returns consistently due to what is called The Winner’s Course. The Winner’s
Course simple describe the fact that when you participate in an highly demanded IPO,
which is expected to deliver a highly positive first day return, you only get a part of the
shares you have requested. However, when you participate in a low demand IPO you will
get all the shares you have requested. Low demand IPOs will often deliver a small negative
or zero first day return. Thus, it is not possible to generate an abnormal return, unless you
are able to separate the highly demand (good quality) IPOs from the less demanded (low
quality) IPOs.
In previous section we have discussed the positive short run performance of IPOs, but the
long run performance is far from as exciting. A study of US IPOs from 1975 to 1992
concluded that IPOs underperformed the S&P 500 by an average of 44% over the

69
subsequent five years (Brav & Geczy, 2000). Another study by Ritter and Welch (2002)
found that US IPOs underperformed the market by an average of 23.4% during the
subsequent three years. The consensus on long run performance of IPOs are highly
negative, while the consensus on short run performance of IPOs are contradictory highly
positive.
8.3.1 Review of relevant empirical evidence of IPO waves
Very few studies have investigated the difference between the valuation inside and outside
IPO wave. As described in the introduction, this thesis wants to shed some light on this area
for Danish IPOs. According to He (2007) the number of IPOs fluctuate over time. There are
hot IPO markets, or IPO waves, where there are exceptional many IPOs and cold IPO
markets, where there are much fewer IPOs. Cold IPO markets are according to both Green
and Porter (1984) and He (2007) triggered after certain number of low quality IPO firms
are observed and is thereby a “punishment” to the discipline of investment banks’
behavior. IPO waves have been characterized by an unusually high volume of offerings and
severe underpricing, while cold IPO markets have much lower volume of offerings and less
underpricing (He, 2007). Why IPO waves have been characterized by severe underpricing
is explained by how investment banks’ produce information through the prospectus, road
shows, auction, sale-calls etc., which attract investors and IPO prices are high in IPO waves
and thereby attracts more firms to go public. This circle continues until a cold IPO market
is triggered by some low quality IPO firms, often associated with a negative first day
return. He (2007) uses the first day return as a proxy for underpricing, which means that the
underpricing is only based on the first day performance of the share. If the demand of the
share is high and the reputation of the firm and the investment bankers is good, it can be
argued that the first day return is not only angered on valuation. Hence, the “underpricing”
in IPO waves might not actually be underpricing, if it was measured with the comparable
firm approach. Therefore this thesis will investigate the discount inside and outside IPO
waves using both the first day return and the comparable firm approach.
8.4 Hypothesis The empirical evidence reviewed above and the fact that a test of Danish IPOs using the
comparable firm approach never has been conducted motivates the hypothesis tested in this
thesis. Based on existing empirical evidence and theory, four hypotheses will be tested.

70
Hypothesis 1: premium/discount on Danish IPOs
H0: 0/ =discountpremiumµ There is no premium/discount on Danish IPOs.
H1: 0/ ≠discountpremiumµ There is a premium/discount on Danish IPOs.
Hypothesis 1 is the overall hypothesis for this thesis has never been tested on Danish IPOs
before. The first and second hypothesis will be tested using the comparable firm approach.
Hypothesis 2: Differences in premium/discount on Danish IPOs inside or outside an IPO
wave
H0: 0// == −− waveIPOofoutdiscountpremiumwaveIPOindiscountpremium µµ There is no difference in the
premium/discount on Danish IPOs inside or outside an IPO wave.
H1: 0// ≠≠ −− waveIPOofoutdiscountpremiumwaveIPOindiscountpremium µµ There is a difference in the
premium/discount on Danish IPOs inside or outside an IPO wave.
Hypothesis 2 is motivated by the phenomenon of IPO waves and the theory that inside IPO
waves IPOs are priced differently than outside IPO waves. Hence, this thesis seeks to
analyze if there is difference in the valuation inside and outside IPO waves, using the
comparable firm approach, or whether the “underpricing” is just due to period of greater
demand and a continuing streak of high first day return IPOs, as discussed in section 8.3 -
Review of relevant empirical evidence.
Hypothesis 3: The first day return for Danish IPOs
H0: 0=returndayfirstµ The first day return for Danish IPOs is not different from zero.
H1: 0≠returndayfirstµ The first day return for Danish IPOs is different from zero.
Hypothesis 3 is also a test on a potential premium/discount on Danish IPOs, since the first
day return, as described in section 8.3 - Review of relevant empirical evidence, can be a
proxy for the premium/discount on the IPO.
Hypothesis 4: Difference in first day return on Danish IPOs inside or outside an IPO
wave
H0: 0== −− waveIPOofoutreturndayfirstwaveIPOinreturndayfirst µµ There is no difference in the first day
return on Danish IPOs inside and outside an IPO wave.
H1: 0≠≠ −− waveIPOofoutreturndayfirstwaveIPOinreturndayfirst µµ There is a difference in the first day
return on Danish IPOs inside and outside an IPO wave.

71
Hypothesis 4 will test if there is a difference in the first day return inside and outside IPO
waves and thereby test if there is a difference in the premium/discount inside and outside
IPO waves.
8.5 Methodology
8.5.1 Comparable firm approach methodology
Ideally, comparable firms should be selected to explain cross-sectional differences in
multiples, so the market multiples of the peer group should be similar to the IPO firm being
valued (Alford, 1992). This assumes that the peer group of the IPO firm is highly identical
and therefore the comparable firms approach works best when a highly comparable group
is available. The method for identifying a highly comparable peer group for each of the
Danish IPO firms will be described in details later on.
The comparable firm approach reduces the risk of misvaluing a firm relative to other firms
in the industry, however, this approach provides no safeguard against an entire sector being
undervalued or overvalued (Kim & Ritter, 1999). When analyzing the potential discount of
IPOs, it is not a concern that the entire industry is under or overvalued, as long as the
relative valuation in the industry is correct.
This thesis will use the following multiples: Price/Sales, Price/Book pre-issue, Price/Book
post-issue, Price/Earnings, Enterprise Value/Sales, Enterprise Value/ EBITDA, Enterprise
Value/EBIT, which will be described in detail in section 8.5.2 - Multiples and methodology
of study. The use of these multiples are in accordance with Kim and Ritter (1999), who also
use all these variables, except EV/EBIT, which we have added since it is common used
valuation multiple (Alford, 1992; How et al., 2007; Roosenboom, 2012). EV/EBIT is very
similar to EV/EBITDA but adding further multiples decrease the risk of misvaluation since
there is less weight on each multiple and an “outlier” will thereby have less significance.
However, the multiples still have to be economically motivated and make sense in a
valuation setting, which is also the case for the multiples used in this thesis.
The large proceeds often raised from an IPO will change the Price/book value before (pre-
issue) and after (post-issue) significantly, which can be problematic (Kim & Ritter, 1999).
This issue will be elaborated further on in section 8.5.2, where all multiples are described in
detail. This thesis includes Enterprise Value multiples (calculated as; Market value of
equity + book value of debt – cash & cash equivalents) because it is analogous to the total
firm value and is neutral with respect to the proceeds raised from an IPO, if it is retained as
cash or used to pay down debt (Kim & Ritter, 1999). This is due to a boosting of the market

72
value by the proceeds, but cash/debt will be boosted/reduced by the same amount and
thereby cancel out each other. Furthermore, the EV multiples of EV/Sales, EV/EBITDA
and EV/EBIT do also allow us to make comparison between firms with different leverage,
because Sales, EBITDA and EBIT are not affected by leverage (before taking into
consideration the capital structure, i.e. interest payments) and EV includes the amount of
net debt (book value of debt – cash & cash equivalents) (Kim & Ritter, 1999).
This thesis uses historical accounting numbers and current market values, which are
described further in section 8.5.2 - Multiples and methodology of study. It would be
preferred to use the current year’s forecasted accounting numbers or even better, the next
year’s forecasted accounting numbers instead of historical earnings since this, according to
Kim and Ritter (1999) increase the accuracy of the valuation. This thesis uses historical
accounting numbers since it is not possible to obtain forecasted accounting numbers for
peers from up to 16 years ago. Many firms do not guide sufficiently on their future
expectations to use these numbers and it would also be necessary to investigate the
historical annual reports of all the 20 Danish IPO firms and their 78 peers, instead of
obtaining them from various databases. This is therefore considered outside the scope of
this thesis.
For each peer of the Danish IPO firm the seven multiples are calculated, as will be
described in section 8.5.2 - Multiples and methodology of study. Thereafter, both the
average and median is calculated for each multiple including all the peers of the Danish
IPO. Most emphasis is placed on median numbers, as the median rely less on exceptional
small or large numbers (outliers). This is in accordance with How et al. (2007), who use the
median comparable firm multiple, because their distribution are skewed and it places less
emphasis on outliers. For each of the six multiples the following formula is used to
calculate the premium/discount:
peergroupi
peergroupiIPOi
multipleMedianmultipleMedianmultiple
discountemium_
__ )(/Pr
−=
IPOimultiple _ = The multiple for the Danish IPO firm; peergroupimultipleMedian _ = The
median multiple for the peer group of the Danish IPO firm; i: reflects the six multiples;
P/S, P/B, P/E, EV/S, EV/EBITDA, EV/EBIT.
The formula used to calculate the premium/discount using the average peer group multiple
is identical to formula illustrated above, just replacing the median multiple for the peer

73
group with the average multiple for the peer group. After having calculated the
premium/discount for each of the six multiples, the total premium/discount for each Danish
IPO firm is calculated by taking the average of the six premiums/discounts. Hereby an
estimate of the total premium/discount for each Danish IPO firm using the comparable firm
approach is obtained. The total average premium/discount for the whole sample is
calculated by taking the average premium/discount for each of the Danish IPO firms. The
total average premium/discount calculated using the average multiples for the peer group is
also reported.
Besides calculating the premium or discount for each of the Danish IPO firms, the first day
return will also be calculated using the offering price and the mid bid-ask closing price. The
first day return can also be used as a proxy for the discount given in an IPO, as discussed in
section 8.3 - Review of relevant empirical evidence.
8.5.2 Multiples and methodology of study
The data for each of the Danish IPOs and their peers are collected mainly through Zephyr,
Orbis and DataStream. See section 8.7 - Data collection for thorough description of the data
collection.
In this thesis it is necessary to obtain, calculate and adjust several accounting and financial
variables in order to make them useable as multiples in the comparable firm approach.
The following accounting and financials variables are used in the analysis:
! Price (P): Deal value obtained through Zephyr or else calculated as the market value
of the IPO firm at the final offering price. Hence, the closing market value, which
was obtained from DataStream, is adjusted by the difference between the final
offering price and the closing mid bid-ask price. For the peers, the closing market
value the day before the date of the IPO is used because that would make the two
market values directly comparable, since they are obtained at the exact same time
and therefore “influenced” by the same market movements.
! Enterprise Value (EV): Calculated as Price (market-value) plus Net debt (NB),
where Net Debt is defined as: Total debt (The sum of long and short term interest
bearing debt and capitalized lease obligations) – Total Cash & Cash Equivalents.
! Book-value of Equity (B): The sum of common equity available to common
shareholders.

74
! Net Proceeds from issue of shares (NP): The amount of proceeds received from the
issue of common shares minus the cost to the company for issuing those shares.
! Sales (S): Sales for the last Trailing Twelve Months (TTM).
! Earnings (E): Calculated as fully diluted net income available to common
shareholders.
! Earnings Before Interest, Tax, Depreciation and Amortization (EBITDA): earnings
before interest expense, income taxes, depreciations and amortizations.
! Earnings Before Interest and Tax (EBIT): earnings before interest expense and
income taxes.
To calculate a potential premium or discount on the IPO correctly, it is essential that the
annual reports used in the comparison are those that were used to price the IPO (i.e. in the
prospect), otherwise it will not be possible to assign a potential premium or discount to the
event of the IPO. Danish listed companies are obligated to deliver quarterly reports and
annual reports, respectively, two and four months after the end of the accounting period,
which is in accordance with international IFRS- and IAS-standards (Erhvervsstyrelsen,
2014). Thus, we assume this to be the case for all companies in our sample since they are
all assumed to apply to either IFRS or IAS. It can be difficult for companies to go public
and raise additional capital, if the quarterly or annual report is five or six months old, since
investors pay significant attention to the most recent development in the business.
Therefore companies often make sure that recent financial reports are available in the
prospect. Since we are not in possession of all prospects for Danish IPOs (many of them are
not available online), both the financial numbers for the Danish IPOs and their peers will be
obtained through DataStream. It is therefore assumed that quarterly reports were available
in the second months after the end of the accounting period and annual reports were
available in the third months after the end of the accounting period. The table below
illustrates the months of the IPO and the financial reports assumed available and therefore
used, based on the above legislations and arguments: Table 17 - Financial report associated with the month of IPO
Own construction.
The financial data obtained from DataStream for each IPO and its peers was collected on a
daily frequency at the end of the accounting period assumed available. If an IPO was
happening in November for example, then it was the second months after the accounting
period ending in September, why the data for the IPO and its peers was collected on the
Months of IPO January February March April May June July August September October November DecemberFinancial report
used Q3 Q3 FY FY Q1 Q1 Q1 Q2 Q2 Q2 Q3 Q3

75
31th of September. This method was used to obtain all the variables described above,
except for market values which were obtained on the exact date of the IPO.
The above variables are then used to calculate the following multiples:
1. Price/Sales (P/S): Price divided by Sales.
2. Price/Book pre-issue (P/B pre-issue): Price divided by Book-value of Equity.
3. Price/Book post-issue (P/B post-issue): Price divided by the sum of Book-value of
Equity and Net Proceeds from issue of shares.
4. Price/Earnings (P/E): Price divided by Earnings
5. Enterprise Value/Sales (EV/S): Enterprise Value divided by Sales.
6. Enterprise Value/ Earnings Before Interest, Tax, Depreciation and Amortization
(EV/EBITDA): Enterprise Value divided by Earnings Before Interest, Tax,
Depreciation and Amortization.
7. Enterprise Value/ Earnings Before Interest and Tax (EV/EBIT): Enterprise Value
divided by Earnings Before Interest and Tax.
When companies go through an IPO they usually raise additional capital, as described in
8.2.1 - Theory of IPOs, and the proceeds of the offering is often used to pay down debt,
invested in the business of the company or invested in money market instruments (Kim &
Ritter, 1999). Thus, the Book-value of Equity for a company going public is increased by
an amount equal to the net proceeds. Since the comparable firm approach is comparing the
IPO companies with peers already listed, it is necessary to adjust the Price/Book multiple
with the net proceeds in order to get a better comparison. It is due to that listed peers would
have increased their Book-value of Equity with the Net Proceeds and calculating a
premium/discount without the inclusion of the net proceeds for the IPO firm, would distort
the analysis. Therefore, it is only the P/B post-issue multiples that will be included in the
calculation of the total premium/discount. However, the P/B pre-issue multiple will also be
shown.
We will use four peers (in some cases five, if suitable) for each IPO firm and if it is not
possible to obtain multiples for at least two peers, then the IPO will be deleted from the
sample, see section 8.5.3 - Identification of peer group, for further details. All multiples that
are negative or not available will be shown as not available (n.a.) and will not be included
in the analysis, which is in accordance with Kim and Ritter (1999), who only calculate
multiples for firms with positive earnings and book values. Furthermore, multiples that
reach extreme values are deleted and shown as not available (n.a.). This is also somewhat in

76
accordance with the method applied by Kim and Ritter (1999), who caps multiples to a
maximum value. The reason this thesis do not included multiples that has extreme values,
is because the comparable firm approach assume that the EMH is satisfied, which is
difficult to assume, when valuations reach extreme levels. Furthermore, extreme valuations
are often because a certain firm has some unique or specific characteristics (i.e. growth
opportunities, technology etc.) which are not general attributable to other firms in industry.
As described in section 8.5.1 – Comparable firm approach methodology, the approach
works best when highly comparable peers are available. If a firm has characteristics
different from the rest of the peers in the industry in is not considered a good peer.
Extreme multiples are defined as:
Since this thesis excludes IT-companies, as described further in section 8.7 - Data
collection, the risk of excluding whole industries actually trading at these extreme multiples
are assessed as being small.
8.5.3 Identification of peer group
Findings by Alford (1992) conclude that selecting comparable firms by industry, defined by
three digit SIC-codes is relatively effective. Thus, this was attempted for our sample, but
many of the 25 companies included in our IPO sample from 1997 to 2014 was classified as
Holding Companies on Orbis, when using the three digits SIC-code. See example for ISS
A/S in appendix I. Furthermore, some of the small Danish companies, which are included
in our sample, were not correctly classified through the SIC-codes on Orbis. When the
Danish IPO companies are not correctly classified using the SIC-codes, it is problematic to
rely on SIC-codes to identify the peer group for each company. Instead of using SIC-codes
to find comparables for the Danish IPO firms, Infinancials.com and Thomsonone.com will
be used together with articles and thesis, where it is deemed appropriate. We will mostly
use Infinancials.com, which is a homepage specialized in the identification of relevant
comparable firms even within highly specific industry sectors. We will use the four (in
some cases five, if suitable) peers that have been identified to have the best fit with the
Danish IPO company, compared on factors as firm size, earnings growth, geographic
markets and most important the similarity of the industry engaged in. This is somewhat in
according with Alford (1992), who concludes that selecting comparables using firm size
and industry are effective, while earnings growth is less effective. Firms from the whole
Multiple: P/S P/B P/E EV/S EV/EBITDA EV/EBIT
Above: 30 25 50 30 50 50

77
world will be allowed as peers, since industry similarity, firm size, geographical markets
and earnings growth is more important than firm location. Appendix J illustrates an
example of the peer group identification for Pandora. The peer group for each of the Danish
IPO companies can be seen in the excel file – IPO data – Total overview IPOs and peers.
However, it is considered outside the scope of this thesis to include the arguments for the
identification of each of the 78 peers.
8.5.4 Identification of IPO waves
This section will briefly explain how IPO waves have been identified in our sample. As
described in section 8.3.1 - Review of relevant empirical evidence of IPO waves, it is a well
established fact that there are evident cycles in the volume of IPOs (Christoffersen, Nain, &
Tang, 2009). Periods of very high IPO volume are often referred to as IPO waves or hot
periods, while periods of very low volume of IPOs are referred to as cold periods. This
thesis seeks to identify potential IPO waves in Danish IPOs from 1997 to 2014, in order to
investigate the relation between the discount of an IPO inside and outside an IPO wave.
According to He (2007) hot IPO markets, or IPO waves, have been characterized by an
unusually high volume of offerings and severe underpricing, while cold IPO markets have
much lower issuance and less underpricing.
To identify a potential IPO wave in the Danish IPOs we use the number of offerings for the
previous Trailing Twelve Months (TTM). If the number of IPOs TTM is above the 70th
percentile, which is equal to minimum 12 IPOs, then the previous twelve months qualifies
as being a part of an IPO wave. To be identified as being a part of an IPO wave, each
quarter in the TTM has to have at least one offering or the average number of offerings of
two consecutive quarters has to be at least two. This is to ensure that each quarter identified
is a part of an IPO wave and not only around one. This method is somewhat in accordance
with Christoffersen et al. (2009) method of identifying an IPO wave. For further
information on method of identifying IPO waves, see excel file – IPO data – IPO wave
definition.
8.6 Test statistics This thesis undertakes four test statistics for each hypothesis in order to conclude if the
Hypothesis stated can be rejected or not. The four test statistics are all standard t-tests. The
assumption to be satisfied for these tests to be valid is that the data is following a normal
distribution (Verbeek, 2012). Appendix K illustrates the distribution of the
premium/discounts on Danish IPOs is not approximately normal distributed and neither is

78
the sample of IPOs inside or outside an IPO wave. The first day return of the Danish IPOs
is closer to being approximately normally distributed, as illustrated in appendix K. Thus,
taking the sample size and the non-normal distributed data into consideration, the
conclusions of this thesis should be interpreted carefully.
The test statistic used to test the first hypothesis; There is no premium/discount on Danish
IPOs is a standard t-test:
nsxt IPOs
/
_
µ−=
Where:
IPOsx_
: The sample average premium/discount.
µ : The population average premium/discount.
s : The sample standard deviation.
n : The number of observations.
And µ is tested to be equal to zero.
The test statistic used to test the second hypothesis; There is no difference in the
premium/discount on Danish IPOs inside or outside an IPO wave is a standard t-test,
testing if there is a difference between two sample means:
waveIPONo
No
waveIPO
waveIPONowaveIPO
Ns
Ns
xxtwaveIPOwaveIPO
−−
−−
−− +
−=
_
2_
2
_
__
Where:
waveIPOx −
_ : The sample average premium/discount inside IPO waves.
waveIPONox −_
_ : The sample average premium/discount outside IPO waves.
2waveIPO
s−
: The sample variance inside IPO waves.
2_ waveIPONos −
: The sample variance outside IPO waves.
waveIPON − : The number of observations inside IPO waves.

79
waveIPONoN −_ : The number of observations outside IPO waves.
This kind of t-test is used, because we cannot assume that the variances are equal inside and
outside an IPO wave and therefore both variances are calculated and used. The test statistic
used to test the fourth hypothesis that; There is no difference in the first day return on
Danish IPOs inside or outside an IPO wave is the same test statistics used to test the
second hypothesis, we simply use the sample average first day return instead of the average
premium/discount.
The test statistic used to test the third hypothesis; The first day return for Danish IPOs is
not different from zero is similar to the test of the first hypothesis and is a standard t-test:
nsxt IPOs
/
_
µ−=
Where:
IPOsx_
: The sample average first day return.
µ : The population average first day return.
s : The sample standard deviation.
n : The number of observations.
Additional we test if µ is equal to zero.
8.7 Data collection The sampling of IPOs was initially constructed through Zephyr and the years included was
from 1997 to 2014. There was no data on any IPO before 1997 and it was chosen to go as
far back as possible in order to get the largest possible sample, because of the limited
number of Danish IPOs. To get the initial sample the following constrains for the deal
should be satisfied; being an IPO (of cause), status should be completed, and it should be in
Denmark. For the IPOs the following information was chosen from Zephyr; firm name,
deal number, deal value of IPO, name of exchange, country of exchange, business
description, completed date, and ISIN number. This information was necessary in order to
check the correctness of the sample and provided valuable information to be used later in
the analysis. The initial screening gave a sample of 99 IPOs, as illustrated below.

80
Table 18 - Search strategy - Initial sample form Zephyr
Screenshot from Orbis.
The sample was then checked and 13 IPOs were deleted, because they were not Danish
IPOs. Hence, a sample of 86 IPOs was used for the identification of IPO waves.
To construct the sample to be used in the comparable firm approach and thereby make it
possible to investigate a potential discount given for IPOs, further criteria’s needed to be
satisfied:
! Exclusion of 33 financial companies, including insurance companies, real estate
investments, banking, venture capital, private equity and equity funds. The financial
industry is excluded because firms will often be listed at Net Asset Value (NAV)
and it can distort the analysis. This is also in accordance with Walker (2000), who
excludes the financial industry.
! We exclude seven Formuepleje companies, since they are Investment funds and
assumed to be trading at NAV (or maybe at a premium due to good management),
and this is also in accordance with excluding financials in general.
! Ten IT-companies are excluded because they are often trading at extreme multiples
and often they are prices on multiples not relating to earnings, as for example
numbers of user and time spend on site per user. This thesis uses sales, earnings and
book value multiples, why the IT-companies will distort the analysis. Furthermore
six of the ten companies were listed between 1999 and 2001, and it can be argued
that there was a mispricing in the market at that time, which could also distort the
analysis.
! We have excluded three soccer and handball clubs, because the valuation of these
are assumed to be more driven by sentiment and feelings, than anchored on
accounting multiples since very few ever reach positive earnings.
Step result Search result1. 25,252 25,2522. 948,991 25,2523. 13,870 99
TOTAL 99Boolean search : 1 And 2 And 3
Cut off date 31/03
Deal type: IPOCurrent deal status: CompletedCountry: Denmark (DK) ( Acquiror OR Target OR Vendor )
Data update 05/05/2014 (n° 30103294)Username Aarhus Business School-16468Export date 06/05/2014
Product name ZephyrUpdate number 30Software version 30.0

81
! For four of the IPOs the ISIN-codes, which were necessary to collect data through
DataStream, were not available, so they were excluded.
! Furthermore four of the IPOs was Seasoned Equity Offerings (SEOs) and not IPOs,
why there were also deleted from the sample.
A sample of 25 Danish IPOs was left after the screening process. The 25 IPOs and
information about each IPO can be seen in appendix L. The peer group for each IPO firm
was identified as described in section 8.5.3 - Identification of peer group. Orbis was used to
obtain the ISIN-number for each of the peers. The ISIN-number was needed in order to
collect the necessary data from DataStream. After identifying the ISIN-numbers on all the
Danish IPO firms and their peers, DataStream was used to collect the data for the
comparable firm approach and the calculation of a potential discount on Danish IPOs. The
data collected from DataStream was; Opening share price, closing share price, market
value, sales, EBITDA, EBIT, net income, book value of equity, net proceeds from IPO and
Net debt. If the data was not available through DataStream, then ThomsonOne.com was
used. All the data was collected for the IPO firm and the peer group on the exact date of the
IPO and used to calculate the multiples, as described in 8.5.2 - Multiples and methodology
of study. The data collected have to be on the exact date of the IPO for the peer group of
the IPO firm in order to ensure optimal comparison conditions. The valuation multiples
should ensure correct valuation relative to other firms in the industry, but are not any
safeguard to an entire industry being over or undervalued, as described in 8.5.1 -
Comparable firm approach methodology. The valuation multiples of an entire industry or
sector can easily change over time and therefore, if the multiples of the IPO firm and the
peer group are not obtained on the exact same date, then a potential IPO discount or
premium can be caused by varying multiples over time.
The data collected from DataStream was then exported back to the main excel-sheet for
calculation of multiples, please see the excel file – IPO data – Total overview IPOs and
peers for all details. The data obtained was then checked and the sample consisted of 25
IPOs. For five of these IPOs it was not possible to obtain data for at least two of the four or
five peers, mainly due to none of them being listed at the time. These five IPOs is not use in
the calculation of the comparable firm approach but their first day return is calculated and
used in the analysis. In conclusion, a sample of 20 Danish IPOs to be analyzed using the
comparable firm approach and 25 Danish IPOs to be analyzed using their first day return
was identified.

82
8.8 Descriptive statistics A full overview of the 20 Danish IPOs, the date of the IPO, the seven multiples, if the IPO
was in an IPO wave and the first day return can be seen in appendix M, together with the
median multiples for the peer group and the premium/discount on each multiples. Appendix
N provides the same information only calculated using the average peer group multiple. Table 19 - Descriptive statistics from the comparable firm approach
Own construction.
From the descriptive statistics it can be seen that the average premium/discount (calculated
by median multiples), is actually a premium of 1.56% for the total sample, while it is a
premium of 5.98% inside IPO waves and a discount of -0.33% outside IPO waves. It can be
seen that in all three cases the standard deviation is relatively large compared to the average
premium/discount, varying from 15.05% to 27.67%. The premium of 1.56% for the 20
IPOs calculated using the comparable firm approach indicates that Danish IPOs are offered
at a premium. Later in the thesis it will be tested if the premium is significant different from
zero. The difference of 6.31% between premium/discount inside and outside IPO waves
indicates there might be a significant difference, but it is opposite as expected, as IPOs
were expected to be more underpriced in IPO waves than outside IPO waves. For the total
sample we found a discount of 1.38% using the average peer group multiple instead of the
median, see appendix N for further details.
The average numbers of peers for each of the 20 Danish IPOs is 3.9, all the peers can be
seen in the excel file – IPO data – Total overview IPOs and peers. Hence, for each IPO the
premium/discount is calculated comparing the multiples of the IPO firm with the median of
four peers on average.
In#IPO&wave Not#in#IPO&wave Total
Average'Premium/discount'adj.' 5.98% &0.33% 1.56%
Number'of'IPOs 6 14 20
Std.'Deviation 15.05% 27.67% 24.34%
Variance 2.26% 7.66% 5.92%

83
Table 20 - Descriptive statistics for first day return
Own construction.
The first day return can be used as a proxy for the valuation and hence premium/discount
given for the IPO, as described in section 8.3 - Review of relevant empirical evidence. The
average first day returns for the 25 Danish IPOs is 11.34%, with a standard deviation of
27.83%. A positive first day return of 11.34% indicates Danish IPOs being offered at a
discount, which will be analyzed further in section 8.9 - Empirical evidence. The five IPOs
for which no peer group data was available can be seen in appendix O, together with the
date of the IPO.
It is also illustrated that the first day return on average is 24.87% in IPO waves, while it is
on average only 7.10% outside IPO waves. This indicates that IPOs might be more
underpriced in IPO waves than outside IPO waves and thereby indicates that we might be
able to reject the fourth hypothesis of equal premium/discount inside and outside IPO
waves.
8.9 Empirical evidence
8.9.1 IPO waves
The number of IPOs is highly cyclical and has happened in waves, as described in section
8.3.1 - Review of empirical evidence of IPO waves. Our sample covers a period of 13 years
and 8 months from August 1997 to March 2014, where 87 Danish IPOs have been
observed. The average numbers of Danish IPOs yearly is a little less impressive than the
yearly average of between 100 and 700 IPOs in the US (Berk & DeMarzo, 2011). In the
period covered in this thesis there has been an average of around six IPOs per year from
1997 to 2014. Even though the number is much smaller than the US, there have also been
IPO waves, or hot periods, where the volume of offerings has been significant higher.
Using the method described in section 8.5.4 - Identification of IPO waves, it has been
possible to identify two Danish IPO waves, as illustrated in the figure below.
First&day&return&(in&IPO1wave)
First&day&return&(not&in&IPO1wave) Total
Av.$First$day$return 24.78% 7.10% 11.34%
Number$of$IPOs 6 19 25
Std.$Deviation 53.66% 12.40% 27.83%
Variance 28.79% 1.54% 7.75%

84
Figure 20 - Number of Danish IPOs previous trailing twelve months from 1997 to 2014
Own construction. Two IPO waves have been identified on the Danish market. The fist on a short time before
the new millennium and the second one in a tree year period up to the recent financial crisis. The first IPO wave in our sample lasted 12 months from 26-03-1998 to 26-03-1999, where
the numbers of offerings the previous TTM increased significantly. All the details,
calculations and numbers of IPOs in each period can be seen in the excel file – IPO data –
overview all IPOs, IPO wave. Some of the well known Danish companies got listed during
this period including Vestas Wind Systems and Bavarian Nordic, while the three Danish IT
companies; Navision Software, Contex and Licenergy also got listed during this period.
Many Danish IT Companies going public characterized the period from the beginning of
1998 until the Internet-bubble busted in the middle of 2002. However, the numbers of
IPOs started to decline some time before. The previous TTM number of IPOs when the
bubble burst, were already below four. Many IT companies suffered from the bubble
bursting and it took until the beginning of 2004, before the Danish IPO market started to
see more IPOs again. The pace of IPOs started to increase slowly in 2004 and in the end of
2005 it really took off. The second IPO wave lasted almost 2 years and 9 months, from14-
09-2005 to 04-06-2008, where the numbers of offerings the previous TTM increased
significantly and was over 15 for a long period, and even twice peaked at 22 offerings the
previous TTM. In this period, well known Danish companies as Trygvesta and Nordic
Tankers went public. There were 38 Danish IPOs in this period and 17 of the IPOs were
financial companies, with banks, equity funds, private equities and investment companies
going public. Again the figure illustrates that the number of IPOs started to slow down
before the Bankruptcy of Lehman Brothers on the 15. September 2008, which was the
beginning of the financial crisis. Many of the financial companies struggled in the
0
5
10
15
20
25IPOs)previous)TTM
Internet bubble)bursts)(June/July)2002)
Lehman)Brothers)Bankruptcy)15.)september)2008
IPOEwave)26/3 1998)E 26/3)1999.
IPOEwave)14/9 2005)E 3/6)2008.
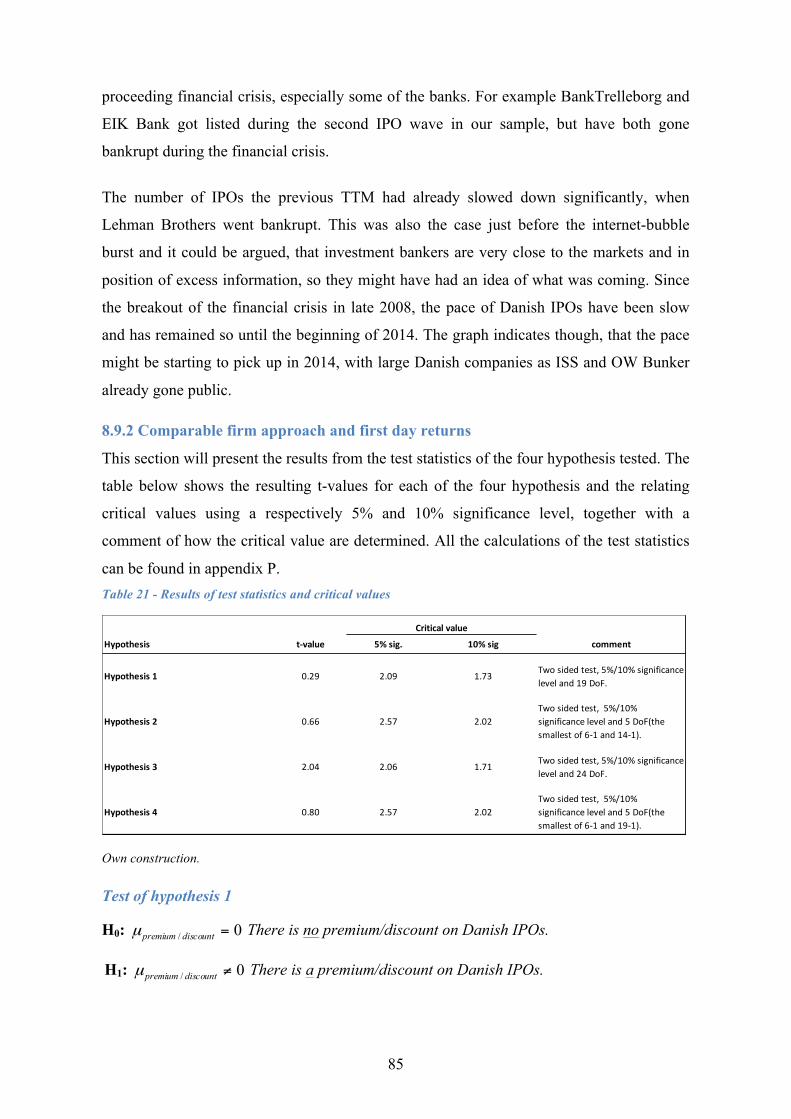
85
proceeding financial crisis, especially some of the banks. For example BankTrelleborg and
EIK Bank got listed during the second IPO wave in our sample, but have both gone
bankrupt during the financial crisis.
The number of IPOs the previous TTM had already slowed down significantly, when
Lehman Brothers went bankrupt. This was also the case just before the internet-bubble
burst and it could be argued, that investment bankers are very close to the markets and in
position of excess information, so they might have had an idea of what was coming. Since
the breakout of the financial crisis in late 2008, the pace of Danish IPOs have been slow
and has remained so until the beginning of 2014. The graph indicates though, that the pace
might be starting to pick up in 2014, with large Danish companies as ISS and OW Bunker
already gone public.
8.9.2 Comparable firm approach and first day returns
This section will present the results from the test statistics of the four hypothesis tested. The
table below shows the resulting t-values for each of the four hypothesis and the relating
critical values using a respectively 5% and 10% significance level, together with a
comment of how the critical value are determined. All the calculations of the test statistics
can be found in appendix P. Table 21 - Results of test statistics and critical values
Own construction.
Test of hypothesis 1
H0: 0/ =discountpremiumµ There is no premium/discount on Danish IPOs.
H1: 0/ ≠discountpremiumµ There is a premium/discount on Danish IPOs.
Hypothesis t*value 5%1sig. 10%1sig comment
Hypothesis11 0.29 2.09 1.73Two+sided+test,+5%/10%+significance+level+and+19+DoF.
Hypothesis12 0.66 2.57 2.02Two+sided+test,++5%/10%+significance+level+and+5+DoF(the+smallest+of+6B1+and+14B1).
Hypothesis13 2.04 2.06 1.71Two+sided+test,+5%/10%+significance+level+and+24+DoF.
Hypothesis14 0.80 2.57 2.02Two+sided+test,++5%/10%+significance+level+and+5+DoF(the+smallest+of+6B1+and+19B1).
Critical1value

86
The first hypothesis fail to reject H0 on both a 5% and 10% significance level with a tvalue
of only 0.29, which mean that we fail to reject that there is no premium or discount on
Danish IPOs, when the premium/discount is calculated using the comparable firm
approach. Hence, the total premium of 1.56% calculated for Danish IPOs is not significant
different from zero. This was also what the descriptive statistics indicated since it revealed
relatively large standard deviations. The findings of a premium using the comparable firm
approach is opposite to the existing empirical evidence described in section 8.3 - Review of
relevant empirical evidence. The existing empirical evidence generally concluded a
discount of around 10% on IPOs, using the comparable firm approach. However, Houston
et al. (2006) does, as described earlier, also conclude that their discount is not significant
different from zero.
Test of hypothesis 2
H0: 0// == −− waveIPOofoutdiscountpremiumwaveIPOindiscountpremium µµ There is no difference in the
premium/discount on Danish IPOs inside or outside an IPO wave.
H1: 0// ≠≠ −− waveIPOofoutdiscountpremiumwaveIPOindiscountpremium µµ There is a difference in the
premium/discount on Danish IPOs inside or outside an IPO wave.
The second hypothesis also fail to reject H0 on both a 5% and 10% significance level with a
t-value of 0.66, which mean that we fail to reject that there is no difference in the
premium/discount on Danish IPOs inside or outside an IPO wave. Therefore, the difference
of 6.31% between the 5.98% premium inside IPO waves and the 0.33% discount outside
IPO waves is not significant different from zero. According to He (2007) hot IPO markets,
or IPO waves, have been characterized by an severe underpricing, while cold IPO markets
have much less underpricing. This thesis fail to confirm the existing conclusion of He
(2007) since we actually obtained the opposite results, i.e. that IPO waves have been
characterized by overpricing (premium) and cold IPO markets have been slightly
underpriced but the results are not significant.
Test of hypothesis 3
H0: 0=returndayfirstµ The first day return for Danish IPOs is not different from zero.
H1: 0≠returndayfirstµ The first day return for Danish IPOs is different from zero.

87
With a t-value of 2.04 for the test statistics of the third hypothesis we barely fail to reject H0
on a 5% significance level, which means that we fail to reject that the first day return for
Danish IPOs is not different from zero. However, we are able to reject H0 on a 10%
significance level, which means that we are able to reject that the first day return for Danish
IPOs is not different from zero and thereby conclude that the average first day return of
11.34% is significant different from zero. The first day return are often used as a proxy for
the discount given in IPOs and therefore this can be interpreted as Danish IPOs being
offered at an 11.34% discount. The findings of this thesis (on a 10% significance level and
almost also on a 5% level) that Danish IPOs have a first day return of 11.34% and therefore
are offered at a 11.34% discount is very much in line with existing empirical evidence. As
discussed in section 8.3 - Review of relevant empirical evidence, Sølversteen and
Kristensen (2004) finds a discount of 9.18% on Danish IPOs using the first day return and
also a first day return of 8% for Danish IPOs are reported by Berk and DeMarzo (2011).
Test of hypothesis 4
H0: 0== −− waveIPOofoutreturndayfirstwaveIPOinreturndayfirst µµ There is no difference in the first day
return on Danish IPOs inside and outside an IPO wave.
H1: 0≠≠ −− waveIPOofoutreturndayfirstwaveIPOinreturndayfirst µµ There is a difference in the first day
return on Danish IPOs inside and outside an IPO wave.
The fourth hypothesis also fail to reject H0 on both a 5% and 10% significance level with a
t-value of 0.80, which mean that we fail to reject that there is no difference in the first day
return on Danish IPOs inside or outside an IPO wave. We report a 24.78% return in IPO
waves and a 7.10% return outside IPO wave for Danish IPOs, which means that the
discount is higher in IPO waves (not significant), since the first day return is higher, which
is in line with the conclusion by (He, 2007) of severe underpricing in IPO waves. However,
this is opposite to the findings of this thesis using the comparable firm approach, finding a
premium in IPO waves and a discount outside IPO waves, but neither is significant. Thus,
the first day return and therefore the potential discount are not concluded to be different for
Danish IPOs inside and outside IPO waves which is very much in line with the conclusion
of the second hypothesis, using the comparable firm approach.

88
8.10 Conclusion The analysis of this thesis finds a premium of 1.56% on all Danish IPOs included in the
sample, using the comparable firm approach. The results of the analysis is a premium of
5.98% for Danish IPOs characterized as being in an IPO wave, while there is a discount of
0.33% outside IPO waves, also using the comparable firm approach. However, the
premium on all Danish IPOs is not significant different from zero and neither is there
significant differences between the premium inside IPO waves and the discount outside
IPO waves.
The results of this thesis using the comparable firm approach on Danish IPOs is not in line
with existing empirical evidence on IPOs. Roosenboom (2012), Houston et al. (2006), How
et al. (2007) and Kim and Ritter (1999), which all concludes that there are a discount of,
respectively, 7.6% to 12.9%, 10%, 6.44% to 21.54% and 10 to 20% on IPOs. However,
Houston et al. (2006) does also conclude that the discount is not significant different from
zero. The results of this study might differ due to the small sample size, different selecting
method of peers, different methodology of study and/or different traits of the Danish IPO
markets compared to these studies on the US, Australian and French IPO market. The study
of a potential premium/discount on Danish IPOs using the comparable firm approach is the
first ever conducted on Danish IPOs and is therefore able to contribute with new empirical
evidence presenting that Danish IPOs are neither significantly overpriced nor underpriced.
The analysis of this thesis does also use the first day return as a proxy for the
premium/discount of IPOs. The average first day return for all Danish IPOs is 11.34%,
while the analysis presents results of respectively a first day return of 24.78% and 7.10%
inside and outside IPO waves. The first day return for all Danish IPOs is significant on a
10% significance level and almost on a 5% level, while the test statistic on a potential
difference in the first day return inside and outside IPO waves is highly insignificant.
Hence, the analysis reveals that Danish IPOs are underpriced 11.34% when using the first
day return as a proxy. The results of this thesis, using the first day return as a proxy for the
premium/discount on Danish IPOs, are very much in line with existing empirical evidence.
Studies on the first day return on the Danish IPO market have found first day returns of
9.18% from 1990 to 2002 (Sølversteen & Kristensen, 2004) and approximately 8% from
1984 to 2006 (Berk & DeMarzo, 2011). The analysis of this thesis includes Danish IPOs
from 1997 to 2014 and is thereby able to contribute with updated evidence on the first day
return of Danish IPOs.

89
To determine the correct final offering price for Dong Energy we will, on behalf of the
analysis of Danish IPOs and the existing empirical evidence on the area, be using a
discount of 10%. This is very much in line with existing empirical evidence using the
comparable firm approach and the existing empirical evidence of first day returns as a
proxy for the discount of IPOs.
9 DONG ENERGY’S IPO PRICE Figure 21 - IPO pricing model
Own construction. The two theoretical valuation approaches forms a fair value estimate, which is discounted
before offered at the stock exchange. After the first day of trading the discount given should according to
EMH be eliminated.
This section summarizes all pricing aspects analyzed and discussed in this thesis so far.
Figure 21 illustrates how this thesis has worked through the different pricing elements to
estimate the final IPO price for DONG Energy. In addition to the aspects discussed in this
thesis, the final IPO price will also be affected by market sentiment and indications of
investors demand obtained by investment banks on their roadshow. Pinelli et al. (2013)
argue that the IPO outlook for 2014 is positive and that investors have a big appetite for
new shares. However, a further analysis of the effect by market sentiment etc. is considered
outside the scope of this thesis. In conclusion, the best estimate for an appropriate IPO for
DONG Energy as of 31 December 2013 is DKK 52,525 million. With an equity base
consisting of 415,386,124 shares, it gives a share price of DKK 123.45 for DONG Energy.
The last part of figure 21 illustrates that under the efficient market hypothesis (EMH) the
price of DONG Energy should increase to its fair value on the first day of trading.

90
10 CONCLUSION, DISCUSSION AND FURTHER
REASEARCH
10.1 Conclusion DONG Energy A/S was established back in 2006 through a merger of six Danish energy
companies. Despite a recent equity injection from new investors, the Danish state is still the
majority owner with 57.3%. Today DONG Energy has a well-balanced and integrated
business model operating within four business units: Exploration & Production, Wind
Power, Thermal Power, and Customers & Markets. DONG Energy holds many
competences in particular within the growing offshore wind market. Their strong position
gives a competitive advantage in the short to medium term; however, an attractive market
attract new enters and hence increase competition, which eventually will eliminate DONG
Energy’s competitive advantages. However, DONG Energy’s future success depends not
only on wind power. A strong position on the Danish energy market, high competences
within biomass energy, and promising prospects for oil and gas exploration and production
will also contribute to DONG Energy’s future performance. A new equity injection in the
beginning of 2014 has stabilized DONG Energy’s financial situation, which had been under
pressure due to recent poor financial performance. Thus, there are good prospects for
DONG Energy to continue investing in the transformation of the energy system.
Broadly speaking, there are three categories of valuation approaches: discounted cash flow
valuation (DCF), relative valuation (multiples), and contingent claim valuation (options),
and selecting the right valuation approaches is a trade off between:
E Minimizing the costs i.e. the time use regarding creation, implementation and use of
the approach.
E Optimizing the accuracy i.e. avoid systematic mistakes in the estimation process.
DONG Energy is considered a large and to some extent mature company for which it is
possible to estimate fairly precise future cash flows. Hence, the DCF approach is due to its
accuracy and popularity selected as the main valuation driver for this thesis. In addition,
multiples valuation, which is common used to valuing upcoming IPO firms, is also applied.
In combination the DCF and multiple valuation approaches are considered the best suitable
valuation approaches to define a theoretical fair value estimate for DONG Energy. The fair
value estimate for DONG Energy’s equity is calculated to DKK 58,361 million.
91
One of the most important elements in estimating the value of DONG Energy by the DCF
approach is the cost of capital, as the value of the company is highly sensitive to variation
in the cost of capital. In order to estimate a correct cost of capital for DONG Energy several
assumptions were made. Among the most important are included assumptions about the
capital structure, the cost of debt, and the cost of equity. Based on a solid research and a
discussion of a variety of aspects, DONG Energy’s cost of capital is estimated to 6.72%.
This thesis finds a premium of 1.56% on all Danish IPOs included in the sample, using the
comparable firm approach. The results of the analysis is a premium of 5.98% for Danish
IPOs characterized as being in an IPO wave, while there is a discount of 0.33% outside IPO
waves, also using the comparable firm approach. However, the premium on all Danish
IPOs is not significant different from zero and neither is there significant differences
between the premium inside IPO waves and the discount outside IPO waves. The results of
this thesis using the comparable firm approach on Danish IPOs is not in line with existing
empirical evidence on IPOs. Roosenboom (2012), Houston et al. (2006), How et al. (2007)
and Kim and Ritter (1999), which all concludes that there are a discount of respectively
7.6% to 12.9%, 10%, 6.44% to 21.54% and 10 to 20% on IPOs. However, Houston et al.
(2006) does also conclude that the discount is not significant different from zero
Additionally, the analysis of this thesis does also use the first day return as a proxy for the
premium/discount of IPOs. The average first day return for all Danish IPOs is 11.34%,
while the analysis presents results of, respectively, a first day return of 24.78% and 7.10%
inside and outside IPO waves. The first day return for all Danish IPOs is significant on a
10% significance level and almost on a 5% level, while the test statistic on a potential
difference in the first day return inside and outside IPO waves is highly insignificant.
Hence, the analysis reveals that Danish IPOs are underpriced 11.34% when using the first
day return as a proxy. The results of this thesis using the first day return as a proxy for the
premium/discount on Danish IPOs are very much in line with existing empirical evidence.
Studies on the first day return on the Danish IPO market have found first day returns of
9.18% from 1990 to 2002 (Sølversteen & Kristensen, 2004) and approximately 8% from
1984 to 2006 (Berk & DeMarzo, 2011).
To determine the correct final offering price for Dong Energy we will on behalf of the
analysis of Danish IPOs and the existing empirical evidence on the area, be using a
discount of 10%. This is very much in line with existing empirical evidence using the

92
comparable firm approach and the existing empirical evidence of first day returns as a
proxy for the discount of IPOs.
In conclusion, the final offer value of DONG Energy’s equity is calculated to DKK 52,525
million, corresponding to a final offer price per share of DKK 123.45.
10.2 Discussion and further research This thesis is delaminated only to value DONG Energy by the DCF and Multiples
approaches. As discussed inside the thesis, applying more valuation approaches will
increase the validity of the estimated value. Thus, the field is still open for more valuations
on DONG Energy. Additionally, the elements estimated under the DCF approach are
subject to uncertainty and the value of DONG Energy is highly sensitive to the assumptions
made. However, what the correct price of DONG Energy is will remain subjective until the
day they go public and the market makes its valuation. After all the markets opinion is the
closest we get to an objective price.
The research constructed on discounts given in the underwriting process in the Danish IPO
market using the comparable firm approach, was the first of its kind. The results were
opposite of the expected and the conclusions were unfortunately not significant. Hence, a
more solid research have to be carried out before anything can be concluded. However,
further research on the Danish IPO market is limited of the relative small sample and the
data available. Thus, it might take a couple of years if not a decade before enough data will
be available to carry out a more solid research.

93
11 BIBLIOGRAPHY !Ackert,!L.!F.,!&!Deaves,!R.!(2010).!Behavioral!finance!:!psychology,!decision(making,!and!
markets.!Mason,!OH:!SouthEWestern!Cengage!Learning.!Alford,!A.!W.!(1992).!The!Effect!of!the!Set!of!Comparable!Firms!on!the!Accuracy!of!the!
PriceEEarnings! Valuation! Method.! Journal! of! Accounting! Research,! 30(1),! 94E108.!doi:!10.2307/2491093!
Ang,!A.,!&!Chen,! J.! (2007).!CAPM!over! the! long!run:!1926–2001.! Journal!of!Empirical!Finance,!14(1),!1E40.!doi:!http://dx.doi.org/10.1016/j.jempfin.2005.12.001!
Benninga,! S.! Z.,! &! Sarig,! O.! H.! (1997).! Corporate! finance! :! a! valuation! approach!(International!ed.!ed.).!New!York:!McGrawEHill.!
Berk,!J.,!E,!&!DeMarzo,!P.!(2011).!Corporate!finance!(2.!global!edition!ed.).!Boston,!MA:!Pearson.!
Bloomberg.!(2014).!German!Government!Bunds.!!Brav,! A.,! &! Geczy,! C.! (2000).! Is! the! abnormal! return! following! equity! issuances!
anomalous?! Journal! of! Financial! Economics,! 56(2),! 209E249.! doi:!10.1016/s0304E405x(00)00040E4!
Christensen,!M.,!&!Pedersen,!F.!(1998).!Aktieinvestering!(!Teori!og!praktisk!anvendelse:!Djøf!/!JuristE!og!Økonomforbundet.!
Christoffersen,!S.,!Nain,!A.,!&!Tang,!Y.!(2009).!IPO!Waves,!Information!Spillovers,!and!Analyst!Biases:!Working!paper,!McGill!University.!
Damodaran,!A.! (2006).!Damodaran!on!valuation!:!security!analysis!for!investment!and!corporate!finance!(2.!ed.!ed.).!Hoboken,!N.J.:!John!Wiley!&!Sons.!
Damodaran,! A.! (2011).! Risk! free! rates! and! value:! Dealing!with! historically! low! risk!free! rates.! from! http://aswathdamodaran.blogspot.dk/2011/09/risk-free-rates-and-value-dealing-with.html!
Damodaran,!A.!(2012).!Investment!valuation!:!tools!and!techniques!for!determining!the!value! of! any! asset! Wiley! finance! series! (pp.! 974).! Retrieved! from!http://www.statsbiblioteket.dk/au/showrecord.jsp?record_id=ebog_ssj0000637184!database! Retrieved! from! Full! text! available! from! Ebook! Library:!http://ez.statsbiblioteket.dk:2048/login?url=http://www.asb.eblib.com/patron/FullRecord.aspx?p=817866!!
Damodaran,! A.! (2014).! Ratings,! Interet! Coverage! Ratios! and! Default! Spread.! from!http://pages.stern.nyu.edu/~adamodar/New_Home_Page/datafile/ratings.htm!
DONG!Energy!A/S.!(2008a).!DONG!Energy!Annual!reort!2008.!!DONG!Energy!A/S.!(2008b).!DONG!Energy!Annual!report!2008.!!DONG!Energy!A/S.!(2009).!DONG!Energy!Annual!report!2009.!!DONG!Energy!A/S.!(2010).!DONG!Energy!Annual!report!2010.!!DONG!Energy!A/S.!(2011).!DONG!Energy!Annual!report!2011.!!DONG!Energy!A/S.!(2012).!DONG!Energy!Annual!report!2012.!!DONG! Energy! A/S.! (2013a).! ATP,! Goldman! Sachs! funds! and! PFA! to! invest! DKK! 11!
billion! in! DONG! Energy! A/S! E! Investment! agreement! has! been! signed.! from!http://www.dongenergy.com/EN/Investor/releases/Pages/omx feed list details.aspx?omxid=721810!
DONG!Energy!A/S.!(2013b).!DONG!Energy!Annual!report!2013.!DONG!Energy!A/S.!(2013c).!DONG!Energy!in!society.!!DONG!Energy!A/S.!(2013d).!Goldman!Sachs,!ATP!and!PFA!to!invest!DKK!11!billion!in!
DONG! Energy! A/S.! from!

94
http://www.dongenergy.com/EN/Media/Newsroom/News/Pages/GoldmanSachs-ATPandPFAtoinvestDKK11billioninDONGEnergyAS.aspx!
DONG! Energy! A/S.! (2014a).! Business! activities.! from!http://www.dongenergy.com/EN/business activities/Pages/default.aspx!
DONG! Energy! A/S.! (2014b).! Business! activities! E! Wind! power.! from!http://www.dongenergy.com/en/business activities/renewables/pages/renewables.aspx!
DONG! Energy! A/S.! (2014c).! Forretningsaktiviteter! E! Klimapartnerskaber.! from!http://www.dongenergy.com/da/forretningsaktiviteter/customers_markets/aktiviteter/klimapartnerskab/pages/default.aspx!
DONG!Energy!A/S.!(2014d).!History.!2014,!from!http://www.dongenergy.com/EN/About us/dong energy in brief/Pages/history.aspx!
DONG! Energy! A/S.! (2014e).! MarketEoriented! and! valueEcreating! innovation.! from!http://www.dongenergy.com/en/innovation/innovation/pages/default.aspx!
(2014f).!Presentation!of!full(year!2013!result
95
Kim,!M.,!&!Ritter,!J.!R.!(1999).!Valuing!IPOs.!Journal!of!Financial!Economics,!53(3),!409E437.!doi:!http://dx.doi.org/10.1016/S0304-405X(99)00027-6!
Koller,! T.,! Goedhart,! M.,! Wessels,! D.,! McKinsey,! &! Company.! (2005).! Valuation! :!measuring! and! managing! the! value! of! companies! (pp.! 739).! Retrieved! from!http://www.statsbiblioteket.dk/au/showrecord.jsp?record_id=sb_4148295!database!!
Kothari,!S.!P.,!Shanken,!J.,!&!Sloan,!R.!G.!(1995).!Another!Look!at!the!CrossESection!of!Expected! Stock! Returns.! The! Journal! of! Finance,! 50(1),! 185E224.! doi:!10.2307/2329243!
Leonard,!D.,!&!McAdam,!R.!(2003).!Corporate!social!responsibility.!!Lim,! S.! C.,!Mann,! S.! C.,!&!Mihov,!V.!T.! (2003).!Market! evaluation!of! offEbalance! sheet!
financing:!You!Can!Run!but!You!Can't!Hide.!EFMA!2004!Basel!Meetings!Paper.!!Lindgreen,! A.,! &! Swaen,! V.! (2010).! Corporate! Social! Responsibility.! International!
Journal! of! Management! Reviews,! 12(1),! 1E7.! doi:! 10.1111/j.1468E2370.2009.00277.x!
MarketLine.!(2013).!Company!profil!DONG!EnergyA/S!!MarketLIne.!(July!2013).!Renewable!Energy!in!Europe.!!MarketLIne.!(July!2013,).!Renewable!Energy!in!Europe.!!McCarthy,!E.!(1999).!PRICING!IPOs:!Science!or!Science!Fiction?!Journal!of!Accountancy,!
188(3),!51E58.!!Penman,!S.!H.! (2013).!Financial!statement!analysis!and!security!valuation! (5.! ed.!ed.).!
New!York:!McGrawEHill!Higher!Education.!Pinelli,! M.,! Kelley,! J.,! Choi,! R.,! Steinbach,! D.! M.,! &! Suszuki,! S.! (2013).! EY! Global! IPO!
Trends.!!Porter,! M.! E.! (2008).! THE! FIVE! COMPETITIVE! FORCES! THAT! SHAPE! STRATEGY.!
Harvard!Business!Review,!86(1),!78E93.!!PWC.! (2012).!Considering!an! IPO?!The!costs!of!going!and!being!public!may!surprise!
you.!32.!!Pätäri,! S.,! Jantunen,! A.,! Kyläheiko,! K.,! &! Sandström,! J.! (2012).! Does! Sustainable!
Development! Foster! Value! Creation?! Empirical! Evidence! from! the! Global!Energy! Industry.! Corporate! Social! Responsibility! and! Environmental!Management,!19(6),!317E326.!doi:!10.1002/csr.280!
Ritter,!J.!R.,!&!Welch,!I.!(2002).!A!Review!of!IPO!Activity,!Pricing,!and!Allocations.!The!Journal!of!Finance,!57(4),!1795E1828.!doi:!10.1111/1540E6261.00478!
Ritzau.!(2014).!DONGEchefer!kan!score!over!en!milliard!på!børsnotering.!DR.dk.!from!http://www.dr.dk/Nyheder/Politik/2014/01/23/0123231608.htm!
Roll,!R.!(1969).!BIAS!IN!FITTING!THE!SHARPE!MODEL!TO!TIME!SERIES!DATA.!Journal!of!Financial!&!Quantitative!Analysis,!4(3),!271E289.!!
Roosenboom,!P.!(2012).!Valuing!and!pricing!IPOs.!Journal!of!Banking!&!Finance,!36(6),!1653E1664.!doi:!http://dx.doi.org/10.1016/j.jbankfin.2012.01.009!
Sharpe,!W.!F.!(1964).!CAPITAL!ASSET!PRICES:!A!THEORY!OF!MARKET!EQUILIBRIUM!UNDER!CONDITIONS!OF!RISK.!Journal!of!Finance,!19(3),!425E442.!!
Skat.dk.! (2006).! Aktiemarkedets! risikopræmie.! 2014,! from!http://www.skat.dk/gsa.aspx?oId=1813219&vId=208529!
Skat.dk.!(2014).!Kulbrinteskatteloven.!from!http://www.taks.fo/00565/00566/!Skjerning,! A.,!&!Tuxen,!K.! (2014).!Dong! betaler! ikke! skat! af!Nordsøoli! E!modsat! alle!
andre.!from!http://www.dr.dk/Nyheder/Penge/2014/04/23/113722.htm!Sølversteen,! S.! P.,! &! Kristensen,! T.! V.! (2004).! Hvorvidt! en! virksomhed! kan! påvirke!
underprisfastsættelse! ved! børsintroduktion! via! informationer! ud! over! de!påkrævede!givet!i!børsprospektet.!(Cand.merc.),!Aarhus!Universitet.!!!!

96
Team!Trefis.!(February!2014).!Key!trends!impacting!natural!gas!prices!in!the!US.!from!http://www.forbes.com/sites/greatspeculations/2014/01/02/key-trends-impacting-natural-gas-prices-in-the-u-s/!
Ussing,! J.,! &! Winther,! J.! (2013).! DONG! sendt! i! knæ! af! egen! spekulation.! Berlingske!Business.!!
Verbeek,!M.!(2012).!A!guide!to!modern!econometrics!(4.!ed.!ed.).!Hoboken,!NJ:!Wiley.!Worldometers.! (2014).! Real! time! world! statistics.! from!
http://www.worldometers.info/world-population/!

97
12 APPENDICIES
LIST OF CONTENT
Appendix A - Ownership structure
Appendix B - 2013 revenue
Appendix C - Porter five forces
Appendix D - Electricity production
Appendix E - Reformulated statements
Appendix F - Forecasts
Appendix G - Cash flow from wind- and oil & gas projects
Appendix H - Dong Energy Peer Group data
Appendix I - Orbis search for ISS A/S
Appendix J - Example of peer group identification for Pandora A/S
Appendix K- Distribution of premium/discount and first day returns
Appendix L - Overview of 25 IPOs from Zephyr
Appendix M - Full overview of 20 Danish IPOs (median peer group multiples)
Appendix N - Full overview of 20 Danish IPOs (Average peer group multiples)
Appendix O - The 5 companies with first day return only
Appendix P- Calculation of test-statistics and critical values
Appendix Q - Description of DONG Energy’s peer group

Appendix(A(–(Ownership(structure(
Ownership(pre(equity(injection(
Own construction based on annual report numbers.
Ownership(post(equity(injection(
Own construction based on annual report numbers.
(
Danish'State'(81.0%)'
SEAS4NVE'(10.9%)'
SYD'ENERGI'(3.5%)'
Insero'Horsens'(2.6%)'
Nyfors'Entreprise'(1.2%)'
Galten'Elværk'(0.9%)'
Danish'State'(57.3%)'Goldman'Sachs'(18.0%)'SEAS4NVE'(10.9%)'ATP'(4.9%)'SYD'ENERGI'(3.5%)'Insero'Horsens'(2.0%)'PFA'(1.8%)'Nyfors'Entreprise'(1.0%)'Galten'Elværk'(0.6%)'

Appendix(B(–(2013(revenue(
2013(revenue(generated(on(country(basis(
Own construction based on annual report numbers.
2013(revenue(generated(on(business(units(
Own construction based on annual report numbers.
Denmark'
United'Kingdom'
Netherlands'
Germany'
Norway'
Others'
Wind'Power'
Exploration'&'Production'
Thermal'Power'
Costumers'&'Markets'

Appendix(C(*(Porter(five(forces((
Bargaining power of buyers
In the beginning of the 1990s most national electricity and natural gas markets in Europe were
monopolized, but through the 1990s and up through the 2000s the European Energy markets,
including gas and electricity, have been through a wave of liberalization (European Commission,
2012). The liberalization did also strongly take place in the northern European energy markets,
where DONG Energy generated the majority of their revenue in 2013. This liberalization sought to
protect the customers, improve effectiveness of the energy markets, and create focus on
environment and sustainable energy (European Commission, 2012). This improved the competition
on energy markets, because it removed barriers preventing alternative suppliers from importing or
producing energy, increased possibility for movement of energy across countries, imposing
conditions on more information available to customers and partly removing restrictions/costs on
customers from changing supplier (European Commission, 2012). This liberalization did also make
it possible for customers to freely choose between commercial suppliers of electricity and thereby
increased the buyer’s independence of the large energy suppliers. Several entities were also
assigned to monitor the energy markets in order to project customers. In Denmark, the monitoring
entity of the energy market is Energitilsynet (Energitilsynet, 2014).
Overall this means that the buyers of energy, both corporations and private households, increased
their bargaining power, since they now could switch between suppliers more easily and without
costs. Even though the possibility of changing supplier has improved significant, only 5% of the
Danish customers had changed supplier by 2007 (DONG Energy A/S, 2007). Thus, the buyers do
not exploit their increased bargaining power, which they are in position of. The liberalization
furthermore increased the supply on the energy market, because several barriers were removed,
which also increase the bargaining power of buyers. The liberalization of the energy markets
increased the bargaining power of buyers, but the buyers are still very small compared to the
suppliers and have little financial strength, which means that bargaining power of buyers is limited.
On the other hand commodities, like electricity, natural gas, or oil, are a very standardized and
undifferentiated product, which increases the bargaining power of buyers, since they can get the
same product from many suppliers. The suppliers cannot create differentiated products and buyers

are price sensitive, because the products, customers are demanding, are highly standardized, it
means that the price is a very important competition parameter, which increases the bargaining
power of buyers. Energy suppliers can differentiate by offering to supply the majority of electricity
that an individual or corporation receives from sustainable energy sources, such as wind, water or
solar, to customers whom are especially focused on using sustainable energy. The liberalization of
the Energy Market increased the competition for maintaining customers and, as mentioned above,
increased the competition on price, which made DONG Energy increase focus on other factors,
such as supply security, customer-satisfaction, customer service, and sustainability in order to
maintain customers (DONG Energy A/S, 2007).
The prices of oil and natural gas is determined according to supply and demand by the mercantile
exchanges of New York, London and Dubai, which to some degree limits the power of the buyers
in relation to basis of price, since the price will not differ significantly from the exchanges price
(MarketLine, 2013d).
The overall bargaining power of buyers in the industry, which DONG Energy operates in, are
assessed as being medium-high with an average score of 3.25.
Bargaining power of suppliers
The suppliers are characterized by being very large and highly diversified companies, which also
often are vertically integrated companies, involved in energy generation and trade (MarketLine,
2013b). The largest suppliers to the European natural gas and oil exploration and production
industry are Schlumberger, Baker Hughes, Smith International or Halliburton (MarketLine, 2013c).
The largest European offshore wind turbines manufacturers are Siemens, BARD, Vestas and

Senvion (Corbetta, Pineda, Moccia, & Guillet, 2014) and in the thermal power industry some of the
largest European suppliers are ABB, Alstom, Andritz and Howden (EPPSA, 2014). All the
suppliers mentioned are large and diversified companies, with significant financial muscles, which
give them a significant, bargaining power. The Energy companies in the industry that buys offshore
wind turbines, drilling rigs, thermal production plants etc. are also of significant size and financial
strength, which levels the negotiation positions by increasing the supplier’s dependence and reduces
the bargaining power of suppliers. The quality of the products supplies in this industry is very
important, since the products should withstand significant wear through many years and reparations
are often very expensive. The importance of quality products gives suppliers, which are able to
create and demonstrate quality products, a significant increased bargaining power. Furthermore, it is
not easy, or without cost, to change suppliers, since companies needs to use many resources
creating new contracts and agreements when making business of this magnitude. This increases the
bargaining power of suppliers, by making it more expensive to switch to another supplier.
Overall the bargaining power of suppliers is assessed as medium-high, with an average score of 3.30.
Threat of new entrants
There are very high capital barriers to enter into the industry. Wind turbines are very expensive and
the equipment for exploration and production of oil and gas is also very expensive, the same is true
for thermal plants. The industry is very assets heavy, which is an entry barrier for new entrants.
Furthermore, these industries require significant investments in research and development (R&D),
as the future income is depended on product innovation, developing new technologies or exploring
new oil fields. High R&D costs make the utilization of economics of scale important. Small
companies cannot afford the same size of investments in R&D, which weaken their competitive
situation and potentially drive them out of business. Thus, the significant investments necessary in
R&D, function as an entry barrier, by favoring economics of scale, and thereby reducing the threat
of new entrants. The industry does also require substantial access to a high level of modern
technology, which also is an entry barrier that reduces the threat of new entrants. The above
arguments do not apply for selling and trading energy, which is also a significant part of the energy
market. Selling and trading energy does not require large capital investment or access to a high
level of modern technology, but still required potential large investments in R&D to generate
investment analyzes and profitable trading strategies.
As discussed previous, the products in the industry are very standardized and therefore
undifferentiated, which makes it more difficult to brand the products. The low degree of branding in
this industry makes it easier for new entrants to establish themselves, since they do not have to
compete with strong existing brands and that increases the threat of new entrants in the industry.
The industry has been through a wave of liberalization, but is still regulated regarding permission to
explore new fields and extract oil, as well as permission to develop wind farms. The market for
electricity and natural gas in Denmark is furthermore characterized by Energistyrelsen granting a
utility supplier concession to be supplier of last resort of electricity and natural gas in an area for
several years (Energistyrelsen, March 2013). The buyers are still free to choose another supplier,
but as discussed in bargaining power of buyers, very few actually do change. These regulations do
all make it harder for new entrants to enter the market, and hence decrease the threat from new
entrants.
A high growth market tends to attract new entrants, whom want a share of the growth opportunity.
The market value of the northern European offshore wind energy market is forecasted to grow with
a CAGR1 of 14.42% from €2.6 billion in 2010 to €10 billion in 2020 (Wiersma et al., 2011), and the
market value of the European oil and gas market is forecasted to decline at a CAGR of 1.36% to
$711.1 billion from 2012 to 2017 (MarketLine, 2013c), while the market value of the European
electricity market is forecasted to grow with a CAGR of 4.21% to $581.2 billion from 2012 to 2017
(MarketLIne, February 2014). From these numbers it can be concluded that growth are more
profound in the market for electricity and wind power, than in the oil and gas market, which means
that the threat of new entrants is higher in the electricity and wind power market.
1 Compounded Annual Growth Rate

If companies operating in an industry are able to earn abnormal profits2, economic theory states that
this will attract new firms to the industry, whom want to compete for the abnormal profits and the
entrance of new companies will continue until it is no longer possible to earn abnormal profits
(Wilkinson, 2005). A research of 96 sectors by Professor Aswath Damodaran from Stern School of
Business reveals an average net margin for 2013 of 7.07% oil & gas production and exploration
together with power and utility (general), while the total average net margin for all 96 investigated
sectors are 8.06% (S&P Capital IQ, Bloomberg, & Fed, 2014). Therefore the profitability of this
industry is currently not assessed to be abnormal, which reduces the threat from new entrants.
Overall the threat from new entrants are assessed to be medium-low with an average score of 2.6.
Rivalry among existing competitors
A profitable and large industry with and growing market will often have many players competing
and therefore be characterized by a very strong degree of rivalry. As described in threat of new
entrants, the industries in which DONG Energy operates are characterized by decent growth and
profitability, but no abnormal profitability was observed. The fact that DONG Energy operates in
industries with decent growth and profitability opportunities increase the rivalry among existing
competitors, as all companies want to sustain, and in best case, increase their share of the growing
profitable market.
A common trait for the industries are that electricity, oil and gas are very standardized products, as
discussed above, which means that it is not possible for the companies in the industries to
2 Defined as: a profit that exceeds the normal opportunity for profit derived from labor costs and capital and considered normal profit. Read more: http://www.businessdictionary.com/definition/abnormal-profit.html#ixzz31CqkB22t

differentiate the products, but only to differentiate on the services, offered together with the
product. For example focus on providing the right information to customers buying electricity, in
order to improve customer satisfaction. The lack of possible differentiation of electricity, oil and
gas increases the rivalry, because customers can get the same end product from many suppliers. The
liberalization of the European gas and electricity markets, as discussed earlier did also increase
rivalry because customers easier can switch between suppliers.
The industries in which DONG Energy operates are also characterized by being dominated typically
by few large integrated multinational companies that benefit from economies of scale, which
strengthen the degree of rivalry among existing competitors. Large integrated multinational
companies dominate the industries of oil and gas exploration and production, offshore wind power
and thermal power, because those industries all are very asset heavy and capital intensive.
Furthermore, extensive R&D costs are needed and the fixed costs are typical high in these
industries. Because the industries are capital intensive, demands extensive R&D costs and have
high fixed costs it is very costly for companies to exit, as a fire sale of all assets cannot recoup their
estimated value on a going concern consideration. Thus, companies will be willing to engage in less
profitable competition, as it will be even more expensive for them to exit the industry. Hence, high
exit-barriers increase the degree of rivalry among existing competitors.
The industries in which DONG Energy operates are very different, when it comes to rivalry among
existing competitors. DONG Energy is one of the leading energy groups in Northern Europe, but
rivalry among existing competitors differs in each of their four business segments. In the
exploration and production of oil and gas, DONG Energy is one of the largest companies in DK
(DONG Energy A/S, 2013b), but did only produce 5.7% of total production of oil and gas in the
Danish oil and gas fields in 2012, while there were 11 companies producing in the Danish fields
and the two largest producers, Shell and A.P. Møller-Mærsk, had respectively 36.2% and 30.7%
(Energistyrelsen, 2012). A significant number of large companies competing mean a strong degree
of rivalry among existing competitors.
DONG Energy has built more than 35% of the European offshore wind capacity (DONG Energy
A/S, 2013b) and is therefore a strong player in the offshore wind market. The share of the total
electricity production coming from renewable has double the last ten years and an increased focus
towards renewable energy has been observed in Europe. The offshore wind market is therefore a

market with high growth, and potentially a very profitable market, why the degree of rivalry among
existing competitors are strong. DONG Energy has a leading market position on the offshore wind
power market, which allows them to benefit from the current and future strong growth on that
market.
DONG Energy operates nine out of fifteen central power stations in Denmark and has 44% of
available thermal generation capacity in Denmark (DONG Energy A/S, 2013b). DONG Energy
does also generate one-third of Danish district heat consumption (DONG Energy A/S, 2013b),
making DONG Energy the leading player on the Danish Thermal power market. However, in the
European Thermal Power market Dong Energy is still small compared to competitors such as
E.ON, RWE, Iberdroal, and Électricité de France.
The Danish market for sale and distribution of electricity and gas is characterized by many players,
especially in the market of sale of electricity. Furthermore, it is difficult for companies competing in
these industries to differentiate the products, as discussed earlier, which increase the rivalry among
existing competitors further. Distribution of electricity and gas is also asset heavy and has high
fixed costs, which creates significant exit barriers and increases rivalry. On the other hand sale of
electricity and gas has very limited fixed costs and is not capital intensive. The liberalization of the
Danish energy market, as discussed in Bargaining power of buyers, means that customers can easier
switch between suppliers and do not have to use the supplier, that is the supplier of last resort, in
that specific area. This has increased the rivalry among existing competitors on sale of electricity
and gas, but despite increased rivalry, DONG Energy has retained a good market position. DONG
Energy distributes electricity and gas in Zealand and Jutland and is a leading Danish electricity and
gas distributor with market shares of 26% and 28% respectively in 2013 (DONG Energy A/S,
2013b), which means that almost one million customers receive electricity or gas through DONG
Energy’s grid (DONG Energy A/S, 2014c).
Overall the rivalry among existing competitors in the industries, which DONG Energy operates in,
are assessed to be high with a score of 3.9.

Threat of Substitute products and services
As mentioned above, oil, gas, and electricity are all very standardized products and are not directly
substitutable. Electricity can be generated from many sources including fossil fuels, water, nuclear
power, solar, thermal/geothermal power, or wind and the electricity delivered to the customers is
the same no matter how it is generated. Hence, all these sources can be substitutes for each other.
Oil and gas are more difficult to substitute, since it then would be necessary to change from
receiving energy through the use of oil or gas to using electricity, which can be very difficult and
costly.
Shale gas is currently not being extracted in Denmark (or Europe), because there are many
environmental concerns (Strzelecki & Swint, 2014). However, it is currently being investigated by
Nordsøfonden and Total E&P Denmark B.V. whether there is shale gas in areas of Denmark and
whether it can be produces on a environmental sound and sustainable way (Total E&P Denmark
B.V., 2012). Further, it is being assessed whether production of shale gas would be economically
profitable. Shale gas is a type of natural gas, which is present in deeper layers of the subsoil and is
extracted differently from the natural gas. However, shale gas is a complete substitute for natural
gas (Total E&P Denmark B.V., 2014). Production of shale gas in the US made gas prices in the US
decline 36% from 2006 to 2010, because of the increased supply from cheaper sources and has also
resulted in lower European gas price, because of exports (Nielsen, 2013). Shale gas production can
substitute current production of natural gas and make gas price, and hence also other energy prices,
decline significantly. That could threat the profitability of the Danish energy market and represent a
significant threat for DONG Energy’s operations and an area that should be paid close attention to.
Customers are increasingly focused on buying energy from sustainable renewable energy sources,
such as wind, water, and solar which provide long term energy security in contrast to the
diminishing oil and gas reserves. Even though there is an increasing focus on sustainable renewable
energy sources, the majority of Europe’s energy production is still generated from non-renewable
sources as only 22% of the electricity production in Europe in 2012 came from renewables, see
appendix D. The development of how electricity have been produced from 2001 to 2012 can also be
seen in appendix D, where it is revealed that renewable energy has gone from a 11% share of total
electricity production in Europe to 22% in 2012, which is a doubling in just ten years. This is a
significant increase and is a good indication of where the European electricity market is heading
and does also show the increased focus on sustainable renewable energy sources. Even though there
is an increased focus on electricity produced from renewable energy sources, the primary sources
for heat generation is still gas, solid fuels, and petroleum and products, which made up 91,4% of the
world heat generation in 2010, while renewables was only contributing 3,9% (European
Commission, 2013).
The increased focus on renewable energy sources, which can substitute other sources of energy, and
diminishing natural reserves, is a threat for companies supplying energy from non-renewable
energy sources. DONG Energy has operations in Exploration & Production of oil and gas, and in
thermal power, which are non-renewables energy sources. However, DONG energy does also have
significant operations within wind power, which is an increasing renewable energy source. The
threat of substitute products is therefore on one hand from renewable, since a large part of DONG
Energy’s operations come from non-renewables, but on the other hand, they are producing
renewable energy from wind power, why the primary risks of substitute are renewable energy from
other sources than wind power. This could for example be energy generated from solar, biomass,
rain, water or geothermal energy, which all are areas that DONG Energy currently is not operation
within.
Renewable energy sources are only a smaller part of the total energy market, even though the shares
of renewables are increasing. Renewable energy source cannot currently and will not in many years
to come be nearly able to substitute other sources of energy, why there still will be significant
demand for non-renewable energy sources a long time into the future.
As discussed above customers can switch supplier of energy and also choose to have the majority of
their electricity coming from renewable energy sources. It is easy for customers to switch and
without significant costs. As discussed above, many customers see renewable energy as a beneficial

alternative, which all together increased the threat from substitute products or services. Overall the
threat from substitutes products and services is assessed to be high, with a total score of 3.55.
!

Reference'to'Porters'Five'forces'!Corbetta, G., Pineda, I., Moccia, J., & Guillet, J. (2014). The European Offshore wind industry -
key trends and statistics 2013. European Wind Energy Association. DONG Energy A/S. (2007). DONG Energy ansvarlighedsrapport - Kunder. Retrieved April, 2014,
from http://www.dongenergy.com/DA/ansvarlighedsrapport/2007/Pages/indexf695.html?area=5
DONG Energy A/S. (2013). DONG Energy Annual report 2013. DONG Energy A/S. (2014). Customers & Markets' activities. Retrieved May, 2014, from
http://www.dongenergy.com/en/business activities/customers_markets/activities/pages/default.aspx
Energistyrelsen. (2012). Danmarks Olie- og Gasproduktion 2012: Samt anden anvendelse af undergrunden.
Energistyrelsen. (March 2013). Mange el- og gaskunder får ny forsyningspligtleverandør. Retrieved April, 2014, from http://www.ens.dk/info/nyheder/nyhedsarkiv/el-gaskunder-far-ny-forsyningspligt-leverandor
Energitilsynet. (2014). Forsyningspligt. Retrieved April, 2014, from http://energitilsynet.dk/el/regulering/forsyningspligt/
EPPSA. (2014). Developing the future. Retrieved May, 2014, from http://www.eppsa.eu/ European Commission. (2012, 16.04.2012). Liberalisation of the electricity and gas markets.
Retrieved April, 2014, from http://ec.europa.eu/competition/sectors/energy/overview_en.html
European Commission. (2013). EU Energy in figures. MarketLine. (2013a). MarketLine Industry Pofile - Wind Energy in Europe. doi: 0201-2610 MarketLine. (2013b). MarketLine Industry Profile - Oil & Gas in Europe. doi: 0201-2116 MarketLine. (2013c). MarketLine industry profile: Oil and Gas i Norway. doi: 0177-2116 MarketLIne. (February 2014). MarketLine Industry Profile - Electricity in Europe. doi: 0201-0663 Nielsen, S. J. (2013). USA's skifergas- og oliejagt: Det rene eventyr? Information. S&P Capital IQ, Bloomberg, & Fed. (2014). Margins by Sectors. Retrieved May, 2014, from
http://pages.stern.nyu.edu/~adamodar/New_Home_Page/datafile/margin.html Strzelecki, M., & Swint, B. (2014). Europe Nears First Commercial Shale Gas Production in
Poland. Bloomberg News. Total E&P Denmark B.V. (2012). Skifergas i Danmark. Retrieved May, 2014, from
http://www.skifergas.dk/skifergas-i-danmark.aspx Total E&P Denmark B.V. (2014). Hvad er skiffergas? Retrieved May, 2014, from
http://www.skifergas.dk/teknisk-overblik/hvad-er-skifergas.aspx Wiersma, F., Grassin, J., Crockford, A., Winkel, T., Roitzen, A., & Folkerts, L. (2011). State of the
offshore Wind Industry in Northern Europe - Lessons Learnt in the First Decade. ECOFYS. Wilkinson, N. (2005). Managerial Economics: A Problem-Solving Approach. Cambridge:
Cambridge University press. !

Appendix(D(–(Electricity(production(
EU@28(Electricity(production(by(fuel(in(2012((
(Own construction
(
EU@28(Electricity(production(by(fuel((
Own construction
(
(
(
9%'
17%'
29%'22%'
21%'
2%'Petroleum'and'products'
Gas'
Nuclear'
Renewables'
Solid'fuels'
Others'
0'100'200'300'400'500'600'700'800'900'1000'
2001'' 2002'' 2003'' 2004'' 2005'' 2006'' 2007'' 2008'' 2009'' 2010'' 2011'' 2012'
Others'
Solid'fuels'
Renewables'
Nuclear'
Mtoe'

EU@28(Electricity(production(by(fuel((
Own construction
0%'
5%'
10%'
15%'
20%'
25%'
30%'
35%'
2001''2002''2003''2004''2005''2006''2007''2008''2009''2010''2011'' 2012'
Petroleum'and'products'Gas'
Nuclear'
Renewables'
Others'
Percentage'

Appendix(E(–(Reformulated(statements(
Reformulated(income(statement((
Own construction (

Reformulated(balance(sheet(
Own construction

Appendix(F(*(Forecasts( Forecasted(income(statement
Own construction (Forecasted(Free(cash(flow(((
(
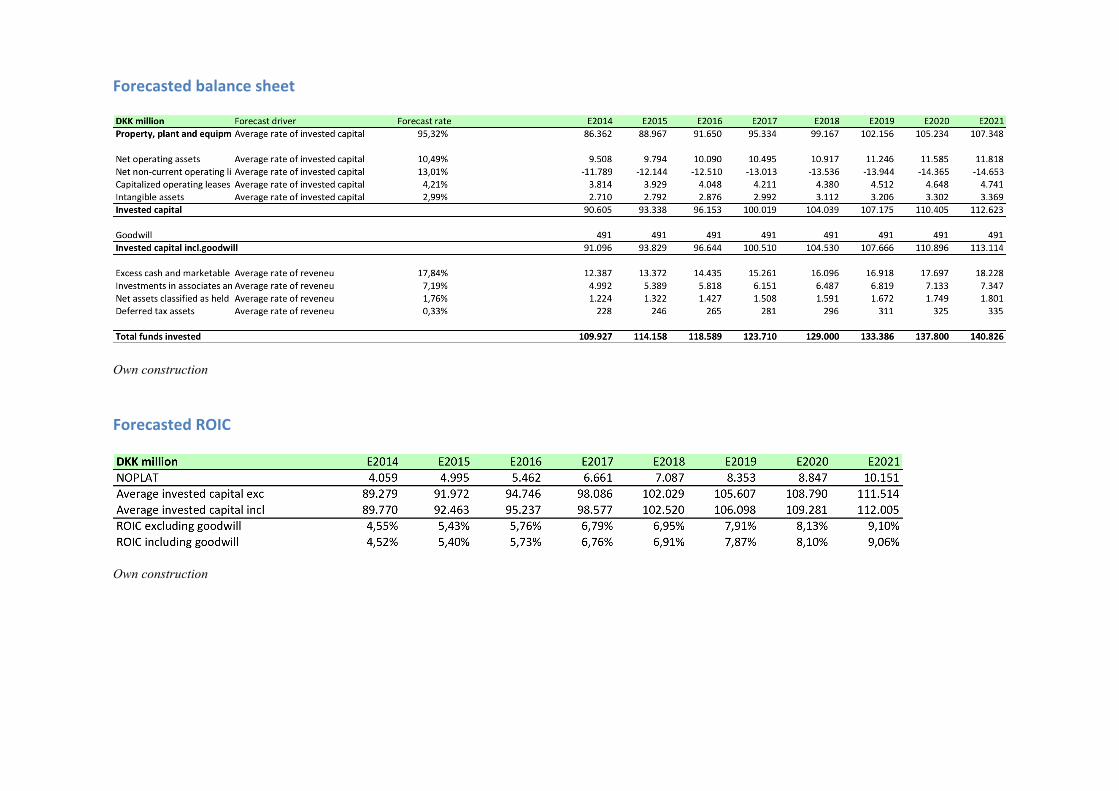
Forecasted(balance(sheet
Own construction Forecasted(ROIC(
Own construction

Appendix(G(*(Cash(flow(from(wind*(and(oil(&(gas(projects(
Own construction based on fictive numbers
!500$!400$!300$!200$!100$
0$100$200$
2010$
2011$
2012$
2013$
2014$
2015$
2016$
2017$
2018$
2019$
2020$
2021$
2022$
2023$
2024$
2025$
2026$
2027$
2028$
2029$
2030$
2031$
2032$
2033$
2034$
2035$
Cash$1low$from$wind$projects$
!200$
!100$
0$
100$
200$
300$
2010$
2011$
2012$
2013$
2014$
2015$
2016$
2017$
2018$
2019$
2020$
2021$
2022$
2023$
2024$
2025$
2026$
2027$
2028$
2029$
2030$
2031$
2032$
2033$
2034$
2035$
Cash$1lows$from$oil$and$gas$projects$

Appendix(H(*(Dong(Energy(Peer(Group(data(
Own construction
Peer$group$financials
million$EURFY$2013 FY$2014E FY$2013 FY$2014E FY$2013 FY$2014E FY$2013 FY$2014E FY$2013 FY$2014E FY$2013 FY$2014E
Sales 122,450$$$$$$$$$$$$$$$$$$$$$$ 115,996$$$$$$$$$$$$ 51,393$$$$$$$$$$ 50,759$$$$$$$$$$$$$$ 32,808$$$$$$$$ 32,484$$$$$$$$$$ 75,594$$$$$$$$ 74,662$$$$$$$$$$$$$$$$$$$$$$$$$ 26,571$$$$$$$$ 27,343$$$$$$$$$$$$ 6,056$$$$$$$$$$ 5,096$$$$$$$$$$$$$$$$$$$
EBITDA 9,316$$$$$$$$$$$$$$$$$$$$$$$$$$ 8,458$$$$$$$$$$$$$$$$ 7,214$$$$$$$$$$$$ 6,824$$$$$$$$$$$$$$$$ 7,839$$$$$$$$$$ 6,829$$$$$$$$$$$$ 16,686$$$$$$$$ 16,581$$$$$$$$$$$$$$$$$$$$$$$$$ 3,157$$$$$$$$$$ 3,599$$$$$$$$$$$$$$ 2,534$$$$$$$$$$ 2,043$$$$$$$$$$$$$$$$$$$
EBIT 5,752$$$$$$$$$$$$$$$$$$$$$$$$$$ 4,713$$$$$$$$$$$$$$$$ A414$$$$$$$$$$$$$$ 4,121$$$$$$$$$$$$$$$$ 2,586$$$$$$$$$$ 3,875$$$$$$$$$$$$ 7,241$$$$$$$$$$ 9,184$$$$$$$$$$$$$$$$$$$$$$$$$$$ 1,867$$$$$$$$$$ 2,276$$$$$$$$$$$$$$ 1,794$$$$$$$$$$ 1,990$$$$$$$$$$$$$$$$$$$
Net.Income 2,142$$$$$$$$$$$$$$$$$$$$$$$$$$ 1,855$$$$$$$$$$$$$$$$ 2,757$$$$$$$$$$$$ 1,424$$$$$$$$$$$$$$$$ 2,572$$$$$$$$$$ 2,266$$$$$$$$$$$$ 3,517$$$$$$$$$$ 3,981$$$$$$$$$$$$$$$$$$$$$$$$$$$ 950$$$$$$$$$$$$$ 1,173$$$$$$$$$$$$$$ 1,204$$$$$$$$$$ 1,563$$$$$$$$$$$$$$$$$$$
Total.Shareholders.Equity 33,470$$$$$$$$$$$$$$$$$$$$$$$$ 33,516$$$$$$$$$$$$$$ 7,738$$$$$$$$$$$$ 8,097$$$$$$$$$$$$$$$$ 35,135$$$$$$$$ 34,733$$$$$$$$$$ 34,207$$$$$$$$ n.a. 5,192$$$$$$$$$$ n.a. 10,023$$$$$$$$ 12,110$$$$$$$$$$$$$$$$$
Market.Cap.(Consolidated) 30,313$$$$$$$$$$$$$$$$$$$$$$$$ $A 19,196$$$$$$$$$$ $A 35,596$$$$$$$$ $A 43,292$$$$$$$$ $A 15,749$$$$$$$$ $A 17,448$$$$$$$$ $A
Enterprise.Value 45,164$$$$$$$$$$$$$$$$$$$$$$$$ $A 36,140$$$$$$$$$$ $A 59,414$$$$$$$$ $A 92,547$$$$$$$$ $A 20,281$$$$$$$$ $A 22,001$$$$$$$$ $A
FY$2013=$31/12$2013.
FY$2014E$=$31/12$2014$expected.
FortumE.ON.AG RWE.AG Iberdrola EDF Centrica
MultiplesFY#2013 FY#2014E FY#2013 FY#2014E FY#2013 FY#2014E FY#2013 FY#2014E FY#2013 FY#2014E FY#2013 FY#2014E
0.25x########################### 0.26x################# 14.15x########### 16.34x############### 0.91x########### 0.90x############# 0.37x########### 0.39x############################ 4.85x########### 5.34x############### 7.85x########### 9.58x####################
0.37x########################### 0.38x################# 6.96x############# 13.48x############### 2.48x########### 2.37x############# 0.70x########### 0.71x############################ 5.01x########### 5.30x############### n.a. 8.77x####################
1.08x########################### 1.10x################# 13.84x########### 15.71x############### 1.01x########### 1.02x############# 1.81x########### 1.83x############################ 7.58x########### 8.70x############### 22.98x######### 15.33x##################
0.57x########################### 0.58x################# 12.31x########### 10.87x############### 1.27x########### n.a. 1.22x########### 1.24x############################ 5.55x########### 5.58x############### 12.78x######### 10.08x##################
0.59x########################### 0.58x################# 16.58x########### 13.43x############### 3.03x########### n.a. 0.76x########### 0.74x############################ 6.42x########### 5.64x############### 10.86x######### 8.91x####################
2.88x########################### 3.42x################# 14.49x########### 11.16x############### 1.74x########### 1.44x############# 3.63x########### 4.32x############################ 8.68x########### 10.77x############# 12.26x######### 11.06x##################
Average.multiple 0.96x########################### 1.05x################# 13.06x########### 13.50x############### 1.74x########### 1.44x############# 1.42x########### 1.54x############################ 6.35x########### 6.89x############### 13.35x######### 10.62x##################
Median.multiple 0.58x################################### 0.58x###################### 14.00x################ 13.45x#################### 1.50x############### 1.23x################## 0.99x############### 0.99x#################################### 5.99x############### 5.61x#################### 12.26x############# 9.83x##########################
Negative#multiples#=#not#available#(n.a) FY#2013=#31/12#2013.#FY#2014E#=#31/12#2014#expected.
Fortum
P/S P/E P/B EV/S EV/EBITDA EV/EBIT
E.ON.AG
RWE.AG
Iberdrola
EDF
Centrica

Appendix(I(*(Orbis(search(for(ISS(A/S(
(
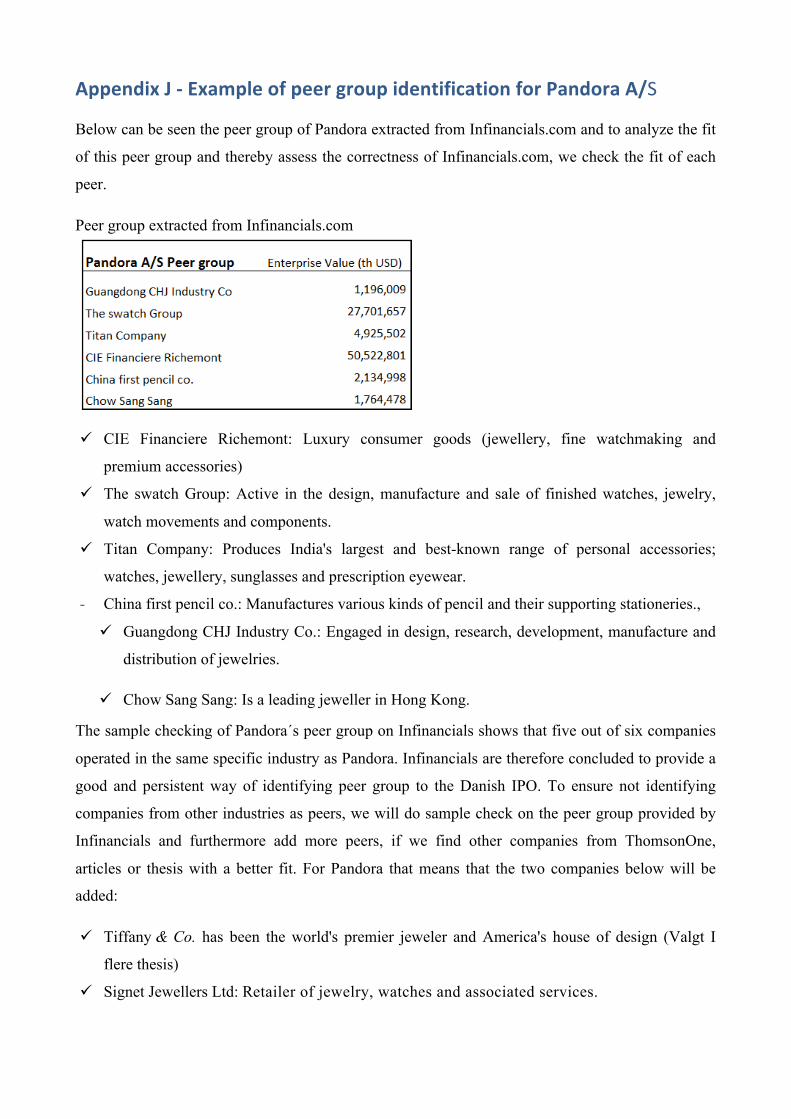
Appendix(J(*(Example(of(peer(group(identification(for(Pandora(A/S( Below can be seen the peer group of Pandora extracted from Infinancials.com and to analyze the fit
of this peer group and thereby assess the correctness of Infinancials.com, we check the fit of each
peer.
Peer group extracted from Infinancials.com
! CIE Financiere Richemont: Luxury consumer goods (jewellery, fine watchmaking and
premium accessories)
! The swatch Group: Active in the design, manufacture and sale of finished watches, jewelry,
watch movements and components.
! Titan Company: Produces India's largest and best-known range of personal accessories;
watches, jewellery, sunglasses and prescription eyewear.
- China first pencil co.: Manufactures various kinds of pencil and their supporting stationeries.,
! Guangdong CHJ Industry Co.: Engaged in design, research, development, manufacture and
distribution of jewelries.
! Chow Sang Sang: Is a leading jeweller in Hong Kong.
The sample checking of Pandora´s peer group on Infinancials shows that five out of six companies
operated in the same specific industry as Pandora. Infinancials are therefore concluded to provide a
good and persistent way of identifying peer group to the Danish IPO. To ensure not identifying
companies from other industries as peers, we will do sample check on the peer group provided by
Infinancials and furthermore add more peers, if we find other companies from ThomsonOne,
articles or thesis with a better fit. For Pandora that means that the two companies below will be
added:
! Tiffany & Co. has been the world's premier jeweler and America's house of design (Valgt I
flere thesis)
! Signet Jewellers Ltd: Retailer of jewelry, watches and associated services.

The four peers with the best deemed fit will be used as peer group for each IPO firm. For Pandora
the selected Peer group consist of; Tiffany & Co, Signet Jewellers Ltd, The swatch Group and CIE
Financiere Richemont.
Own construction (

Appendix(K*(Distribution(of(premium/discount(and(first(day(returns((
!50% !40% !30% !20% !10% 0% 10% 20% 30% 40% 50% 60%
Distribution*of*premium/discount*(total*sample)
Average0premium/discount0adj.
Mean: 1.56%
!8% 0% 8% 12% 34%
Distribution*of*premium/discount*in*IPO5waves
Average/premium/discount/adj.
Mean: 5.98%

Own construction
!50% !40% !30% !20% !10% 0% 10% 20% 30% 40% 50% 60%
Distribution*of*Premium/discount*outside*IPO4waves
Average0premium/discount0adj
Mean: !0.33%
!20% !10% 0% 10% 20% 30% 40% 130%
Average'first'day'return
Mean: 11.34%
Modified2scale

(((((((((((((((((((((((((((((((((((((((((((((((((((((((((((((((((((((((((((((((((((((((((((((((((((((((((((((((((((((((((((((((((((((((Appendix(L*(Overview(of(25(IPOs(from(Zephyr(
Own construction
NrTarget stock exchange(s) listed Target name Target business description
Target country code
Completed date Deal type Deal status
1. Nasdaq OMX - Copenhagen / Boerse Berlin / Boerse Frankfurt / Boerse Munchen / Boerse Stuttgart / London Stock Exchange / US
PANDORA A/S Jewellery manufacturer, Jewellery wholesaler
DK 05-10-2010 Initial public offering 40.057% on NASDAQ OMX
Completed
2. Nasdaq OMX - Copenhagen / Boerse Berlin / Boerse Frankfurt / Boerse Munchen / Boerse Stuttgart / London Stock Exchange
ISS A/S Building security services, Catering services, Cleaning and building maintenance services, Facility management support services
DK 13-03-2014 Initial public offering 31.728% on NASDAQ OMX Copenhagen
Completed
3. Nasdaq OMX - Copenhagen / Boerse Frankfurt / Boerse Stuttgart / London Stock Exchange / US Exchange
CHR HANSEN HOLDING A/S
Natural ingredients manufacturing holding company
DK 03-06-2010 Initial public offering 42.3% on NASDAQ OMX Copenhagen
Completed
4. OW BUNKER A/S Marine fuels and lubricants wholesaler, Shipping holding company
DK 28-03-2014 Initial public offering unknown stake % on NASDAQ OMX Copenhagen
Completed
5. Nasdaq OMX - Copenhagen / Boerse Berlin / Boerse Frankfurt / Boerse Stuttgart / London Stock Exchange
MATAS A/S Cosmetics and skin care products retailer, Online cosmetics retailer, Pharmaceutical products retailer
DK 28-06-2013 Initial public offering 59.985% Nasdaq OMX Copenhagen
Completed
6. Nasdaq OMX - Copenhagen / Boerse Berlin / Boerse Duesseldorf / Boerse Frankfurt / Boerse Stuttgart / London Stock Exchange /
GENMAB A/S Cancer treatment human antibody therapeutics developer, Cancer treatment human antibody therapeutics research services
DK 18-10-2000 Initial public offering on Copenhagen and Frankfurt (Neuer Markt)
Completed
7. Nasdaq OMX - Copenhagen / Boerse Berlin / Boerse Duesseldorf / Boerse Frankfurt / Boerse Munchen / Boerse Stuttgart / London
H LUNDBECK A/S Central nervous system pharmaceutical researcher and developer, Pharmaceuticals manufacturer
DK 18-06-1999 Initial public offering on Copenhagen Completed
8. Nasdaq OMX - Copenhagen / Boerse Berlin / Boerse Duesseldorf / Boerse Frankfurt / Boerse Munchen / Boerse Stuttgart / London
NOVOZYMES A/S Enzymes manufacturer DK 17-11-2000 Initial public offering on Copenhagen Completed
9. Nasdaq OMX - Copenhagen / Boerse Frankfurt / Boerse Stuttgart
RTX TELECOM A/S Wireless communication equipment manufacturer, Wireless communication equipment wholesaler
DK 08-06-2000 IPO on Copenhagen Completed
10. Nasdaq OMX - Copenhagen / Boerse Berlin / Boerse Frankfurt / US Exchange
LIFECYCLE PHARMA A/S Clinically validated drug-delivery technology developer
DK 13-11-2006 Initial public offering on the Copenhagen Stock Exchange
Completed
11. Nasdaq OMX - Copenhagen FIRSTFARMS A/S Agricultural companies investment services, Agricultural companies management consulting services
DK 12-12-2006 Initial public offering on the Copenhagen Stock Exchange
Completed
12. Nasdaq OMX - Copenhagen / US Exchange
EXIQON A/S Gene expression and disease research services, Gene expression and disease treatment products developer
DK 29-05-2007 Initial public offering 41.169% on Copenhagen Stock Exchange
Completed
13. Nasdaq OMX - Copenhagen / Boerse Berlin / Boerse Frankfurt / Boerse Stuttgart / US Exchange
ZEALAND PHARMA A/S Drug discovery and development services, Peptide drugs manufacturer
DK 23-11-2010 Initial public offering 19.3% on NASDAQ OMX Copenhagen
Completed
14. Nasdaq OMX - Copenhagen CIMBER STERLING GROUP A/S
Airline operator holding company DK 01-12-2009 Initial public offering 60.44 % on NASDAQ OMX Copenhagen
Completed
15. Nasdaq OMX - Copenhagen / Boerse Frankfurt / Boerse Stuttgart / US Exchange
TOPOTARGET A/S Novel pharmaceuticals developer, Novel pharmaceuticals research services
DK 10-06-2005 Initial public offering unknown stake % on Copenhagen stock exchange
Completed
16. Nasdaq OMX - Copenhagen THRANE & THRANE A/S Satellite communications equipment manufacturer
DK 06-03-2001 Initial public offering 44% Completed
17. Nasdaq OMX - Copenhagen / Boerse Berlin / Boerse Frankfurt / Boerse Stuttgart
CURALOGIC A/S Innovative pharmaceuticals developer
DK 09-06-2006 Initial public offering 63.137% Completed
18. Nasdaq OMX - Copenhagen SDC DANDISC A/S Electronic media manufacturer DK 18-05-1998 IPO on Copenhagen Completed
19. Nasdaq OMX - Copenhagen / Boerse Berlin
NORDIC TANKERS A/S Shipping and ship owning services
DK 12-06-2007 Initial public offering 28.969% on OMX Copenhagen
Completed
20. Nasdaq OMX - Copenhagen NUNAMINERALS A/S Minerals exploration services, Precious and base metals exploration services
DK 04-06-2008 Initial public offering 24.115% on OMX Nordic Exchange Copenhagen
Completed
21. BHJ A/S Food distributor, Functional animal proteins manufacturer, Meat products processor
DK 12-06-1998 IPO on Copenhagen Completed
22. NOWACO GROUP A/S Food manufacturer, Food wholesaler
DK 21-12-1998 IPO on Copenhagen Completed
23. Nasdaq OMX - Copenhagen CHEMOMETEC A/S Analytical instruments manufacturer
DK 18-12-2006 Initial public offering on the Copenhagen Stock Exchange
Completed
24. Nasdaq OMX - Copenhagen / Boerse Berlin / Boerse Duesseldorf / Boerse Frankfurt / Boerse Hamburg / Boerse Hannover / Boerse Munchen / Boerse Stuttgart / London Stock Exchange / US Exchange / XETRA
VESTAS WIND SYSTEMS A/S
Wind turbines manufacturer DK 30-04-1998 IPO on Copenhagen Completed
25. Nasdaq OMX - Copenhagen RELLA HOLDING A/S Magazines publisher holding company
DK 12-06-2006 Initial public offering unknown stake % on Copenhagen stock exchange
Completed
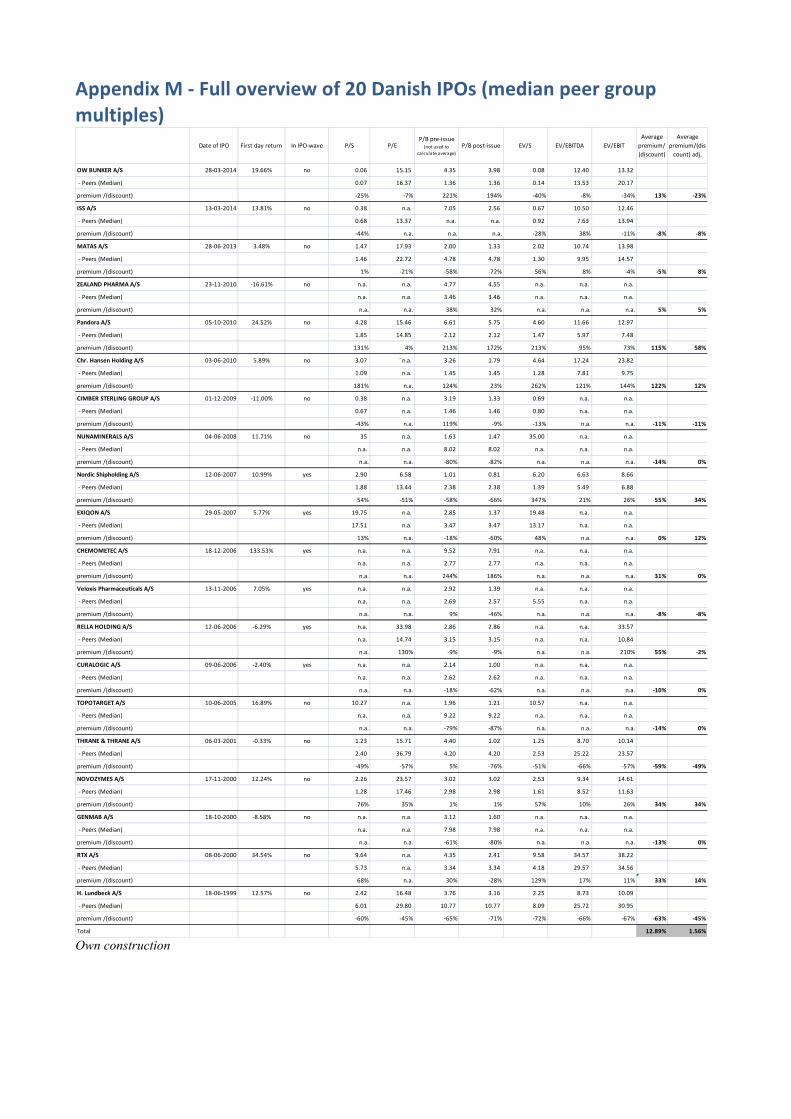
Appendix(M(*(Full(overview(of(20(Danish(IPOs((median(peer(group(multiples)(
Own construction
Date%of%IPO First%day%return In%IPO3wave P/S P/EP/B%pre3issue%(not%used%to%
calculate%average)P/B%post3issue EV/S EV/EBITDA EV/EBIT
Average%premium/(discount)
Average%premium/(discount)%adj.
OW#BUNKER#A/S 2830332014 19.66% no 0.06%%%%%%%%%%%%%%%% 15.15%%%%%%%%%%%%%%%% 4.35%%%%%%%%%%%%%%%%%% 3.98%%%%%%%%%%%%%%%%%% 0.08%%%%%%%%%%%%%%%%%% 12.40%%%%%%%%%%%%%%%% 13.32%%%%%%%%%%%%%%%%
%3%Peers%(Median) 0.07%%%%%%%%%%%%%%%% 16.37%%%%%%%%%%%%%%%% 1.36%%%%%%%%%%%%%%%%%% 1.36%%%%%%%%%%%%%%%%%% 0.14%%%%%%%%%%%%%%%%%% 13.53%%%%%%%%%%%%%%%% 20.17%%%%%%%%%%%%%%%%
premium%/(discount) 325% 37% 221% 194% 340% 38% 334% 13% 023%
ISS#A/S 1330332014 13.81% no 0.38%%%%%%%%%%%%%%%% n.a. 7.05%%%%%%%%%%%%%%%%%% 2.56%%%%%%%%%%%%%%%%%% 0.67%%%%%%%%%%%%%%%%%% 10.50%%%%%%%%%%%%%%%% 12.46%%%%%%%%%%%%%%%%
%3%Peers%(Median) 0.68%%%%%%%%%%%%%%%% 13.37%%%%%%%%%%%%%%%% n.a. n.a. 0.92%%%%%%%%%%%%%%%%%% 7.63%%%%%%%%%%%%%%%%%% 13.94%%%%%%%%%%%%%%%%
premium%/(discount) 344% n.a. n.a. n.a. 328% 38% 311% 08% 08%
MATAS#A/S 2830632013 3.48% no 1.47%%%%%%%%%%%%%%%% 17.93%%%%%%%%%%%%%%%% 2.00%%%%%%%%%%%%%%%%%% 1.33%%%%%%%%%%%%%%%%%% 2.02%%%%%%%%%%%%%%%%%% 10.74%%%%%%%%%%%%%%%% 13.98%%%%%%%%%%%%%%%%
%3%Peers%(Median) 1.46%%%%%%%%%%%%%%%% 22.72%%%%%%%%%%%%%%%% 4.78%%%%%%%%%%%%%%%%%% 4.78%%%%%%%%%%%%%%%%%% 1.30%%%%%%%%%%%%%%%%%% 9.95%%%%%%%%%%%%%%%%%% 14.57%%%%%%%%%%%%%%%%
premium%/(discount) 1% 321% 358% 372% 56% 8% 34% 05% 8%
ZEALAND#PHARMA#A/S 2331132010 316.61% no n.a. n.a. 4.77%%%%%%%%%%%%%%%%%% 4.55%%%%%%%%%%%%%%%%%% n.a. n.a. n.a.
%3%Peers%(Median) n.a. n.a. 3.46%%%%%%%%%%%%%%%%%% 3.46%%%%%%%%%%%%%%%%%% n.a. n.a. n.a.
premium%/(discount) n.a. n.a. 38% 32% n.a. n.a. n.a. 5% 5%
Pandora#A/S 0531032010 24.52% no 4.28%%%%%%%%%%%%%%%% 15.46%%%%%%%%%%%%%%%% 6.61%%%%%%%%%%%%%%%%%% 5.75%%%%%%%%%%%%%%%%%% 4.60%%%%%%%%%%%%%%%%%% 11.66%%%%%%%%%%%%%%%% 12.97%%%%%%%%%%%%%%%%
%3%Peers%(Median) 1.85%%%%%%%%%%%%%%%% 14.85%%%%%%%%%%%%%%%% 2.12%%%%%%%%%%%%%%%%%% 2.12%%%%%%%%%%%%%%%%%% 1.47%%%%%%%%%%%%%%%%%% 5.97%%%%%%%%%%%%%%%%%% 7.48%%%%%%%%%%%%%%%%%%
premium%/(discount) 131% 4% 213% 172% 213% 95% 73% 115% 58%
Chr.#Hansen#Holding#A/S 0330632010 5.89% no 3.07%%%%%%%%%%%%%%%% ¨n.a. 3.26%%%%%%%%%%%%%%%%%% 1.79%%%%%%%%%%%%%%%%%% 4.64%%%%%%%%%%%%%%%%%% 17.24%%%%%%%%%%%%%%%% 23.82%%%%%%%%%%%%%%%%
%3%Peers%(Median) 1.09%%%%%%%%%%%%%%%% n.a. 1.45%%%%%%%%%%%%%%%%%% 1.45%%%%%%%%%%%%%%%%%% 1.28%%%%%%%%%%%%%%%%%% 7.81%%%%%%%%%%%%%%%%%% 9.75%%%%%%%%%%%%%%%%%%
premium%/(discount) 181% n.a. 124% 23% 262% 121% 144% 122% 12%
CIMBER#STERLING#GROUP#A/S 0131232009 311.00% no 0.38%%%%%%%%%%%%%%%% n.a. 3.19%%%%%%%%%%%%%%%%%% 1.33%%%%%%%%%%%%%%%%%% 0.69%%%%%%%%%%%%%%%%%% n.a. n.a.
%3%Peers%(Median) 0.67%%%%%%%%%%%%%%%% n.a. 1.46%%%%%%%%%%%%%%%%%% 1.46%%%%%%%%%%%%%%%%%% 0.80%%%%%%%%%%%%%%%%%% n.a. n.a.
premium%/(discount) 343% n.a. 119% 39% 313% n.a. n.a. 011% 011%
NUNAMINERALS#A/S 0430632008 11.71% no 35%%%%%%%%%%%%%%%%%%% n.a. 1.63%%%%%%%%%%%%%%%%%% 1.47%%%%%%%%%%%%%%%%%% 35.00%%%%%%%%%%%%%%%% n.a. n.a.
%3%Peers%(Median) n.a. n.a. 8.02%%%%%%%%%%%%%%%%%% 8.02%%%%%%%%%%%%%%%%%% n.a. n.a. n.a.
premium%/(discount) n.a. n.a. 380% 382% n.a. n.a. n.a. 014% 0%
Nordic#Shipholding#A/S 1230632007 10.99% yes 2.90%%%%%%%%%%%%%%%% 6.58%%%%%%%%%%%%%%%%%% 1.01%%%%%%%%%%%%%%%%%% 0.81%%%%%%%%%%%%%%%%%% 6.20%%%%%%%%%%%%%%%%%% 6.63%%%%%%%%%%%%%%%%%% 8.66%%%%%%%%%%%%%%%%%%
%3%Peers%(Median) 1.88%%%%%%%%%%%%%%%% 13.44%%%%%%%%%%%%%%%% 2.38%%%%%%%%%%%%%%%%%% 2.38%%%%%%%%%%%%%%%%%% 1.39%%%%%%%%%%%%%%%%%% 5.49%%%%%%%%%%%%%%%%%% 6.88%%%%%%%%%%%%%%%%%%
premium%/(discount) 54% 351% 358% 366% 347% 21% 26% 55% 34%
EXIQON#A/S 2930532007 5.77% yes 19.75%%%%%%%%%%%%%% n.a. 2.85%%%%%%%%%%%%%%%%%% 1.37%%%%%%%%%%%%%%%%%% 19.48%%%%%%%%%%%%%%%% n.a. n.a.
%3%Peers%(Median) 17.51%%%%%%%%%%%%%% n.a. 3.47%%%%%%%%%%%%%%%%%% 3.47%%%%%%%%%%%%%%%%%% 13.17%%%%%%%%%%%%%%%% n.a. n.a.
premium%/(discount) 13% n.a. 318% 360% 48% n.a. n.a. 0% 12%
CHEMOMETEC#A/S 1831232006 133.53% yes n.a. n.a. 9.52%%%%%%%%%%%%%%%%%% 7.91%%%%%%%%%%%%%%%%%% n.a. n.a. n.a.
%3%Peers%(Median) n.a. n.a. 2.77%%%%%%%%%%%%%%%%%% 2.77%%%%%%%%%%%%%%%%%% n.a. n.a. n.a.
premium%/(discount) n.a. n.a. 244% 186% n.a. n.a. n.a. 31% 0%
Veloxis#Pharmaceuticals#A/S 1331132006 7.05% yes n.a. n.a. 2.92%%%%%%%%%%%%%%%%%% 1.39%%%%%%%%%%%%%%%%%% n.a. n.a. n.a.
%3%Peers%(Median) n.a. n.a. 2.69%%%%%%%%%%%%%%%%%% 2.57%%%%%%%%%%%%%%%%%% 5.55%%%%%%%%%%%%%%%%%% n.a. n.a.
premium%/(discount) n.a. n.a. 9% 346% n.a. n.a. n.a. 08% 08%
RELLA#HOLDING#A/S 1230632006 36.29% yes n.a. 33.98%%%%%%%%%%%%%%%% 2.86%%%%%%%%%%%%%%%%%% 2.86%%%%%%%%%%%%%%%%%% n.a. n.a. 33.57%%%%%%%%%%%%%%%%
%3%Peers%(Median) n.a. 14.74%%%%%%%%%%%%%%%% 3.15%%%%%%%%%%%%%%%%%% 3.15%%%%%%%%%%%%%%%%%% n.a. n.a. 10.84%%%%%%%%%%%%%%%%
premium%/(discount) n.a. 130% 39% 39% n.a. n.a. 210% 55% 02%
CURALOGIC#A/S 0930632006 32.40% yes n.a. n.a. 2.14%%%%%%%%%%%%%%%%%% 1.00%%%%%%%%%%%%%%%%%% n.a. n.a. n.a.
%3%Peers%(Median) n.a. n.a. 2.62%%%%%%%%%%%%%%%%%% 2.62%%%%%%%%%%%%%%%%%% n.a. n.a. n.a.
premium%/(discount) n.a. n.a. 318% 362% n.a. n.a. n.a. 010% 0%
TOPOTARGET#A/S 1030632005 16.89% no 10.27%%%%%%%%%%%%%% n.a. 1.96%%%%%%%%%%%%%%%%%% 1.21%%%%%%%%%%%%%%%%%% 10.57%%%%%%%%%%%%%%%% n.a. n.a.
%3%Peers%(Median) n.a. n.a. 9.22%%%%%%%%%%%%%%%%%% 9.22%%%%%%%%%%%%%%%%%% n.a. n.a. n.a.
premium%/(discount) n.a. n.a. 379% 387% n.a. n.a. n.a. 014% 0%
THRANE#&#THRANE#A/S 0630332001 30.33% no 1.23%%%%%%%%%%%%%%%% 15.71%%%%%%%%%%%%%%%% 4.40%%%%%%%%%%%%%%%%%% 1.02%%%%%%%%%%%%%%%%%% 1.25%%%%%%%%%%%%%%%%%% 8.70%%%%%%%%%%%%%%%%%% 10.14%%%%%%%%%%%%%%%%
%3%Peers%(Median) 2.40%%%%%%%%%%%%%%%% 36.79%%%%%%%%%%%%%%%% 4.20%%%%%%%%%%%%%%%%%% 4.20%%%%%%%%%%%%%%%%%% 2.53%%%%%%%%%%%%%%%%%% 25.22%%%%%%%%%%%%%%%% 23.57%%%%%%%%%%%%%%%%
premium%/(discount) 349% 357% 5% 376% 351% 366% 357% 059% 049%
NOVOZYMES#A/S 1731132000 12.24% no 2.26%%%%%%%%%%%%%%%% 23.57%%%%%%%%%%%%%%%% 3.02%%%%%%%%%%%%%%%%%% 3.02%%%%%%%%%%%%%%%%%% 2.53%%%%%%%%%%%%%%%%%% 9.34%%%%%%%%%%%%%%%%%% 14.61%%%%%%%%%%%%%%%%
%3%Peers%(Median) 1.28%%%%%%%%%%%%%%%% 17.46%%%%%%%%%%%%%%%% 2.98%%%%%%%%%%%%%%%%%% 2.98%%%%%%%%%%%%%%%%%% 1.61%%%%%%%%%%%%%%%%%% 8.52%%%%%%%%%%%%%%%%%% 11.63%%%%%%%%%%%%%%%%
premium%/(discount) 76% 35% 1% 1% 57% 10% 26% 34% 34%
GENMAB#A/S 1831032000 38.58% no n.a. n.a. 3.12%%%%%%%%%%%%%%%%%% 1.60%%%%%%%%%%%%%%%%%% n.a. n.a. n.a.
%3%Peers%(Median) n.a. n.a. 7.98%%%%%%%%%%%%%%%%%% 7.98%%%%%%%%%%%%%%%%%% n.a. n.a. n.a.
premium%/(discount) n.a. n.a. 361% 380% n.a. n.a. n.a. 013% 0%
RTX#A/S 0830632000 34.54% no 9.64%%%%%%%%%%%%%%%% n.a. 4.35%%%%%%%%%%%%%%%%%% 2.41%%%%%%%%%%%%%%%%%% 9.58%%%%%%%%%%%%%%%%%% 34.57%%%%%%%%%%%%%%%% 38.22%%%%%%%%%%%%%%%%
%3%Peers%(Median) 5.73%%%%%%%%%%%%%%%% n.a. 3.34%%%%%%%%%%%%%%%%%% 3.34%%%%%%%%%%%%%%%%%% 4.18%%%%%%%%%%%%%%%%%% 29.57%%%%%%%%%%%%%%%% 34.56%%%%%%%%%%%%%%%%
premium%/(discount) 68% n.a. 30% 328% 129% 17% 11% 33% 14%
H.#Lundbeck#A/S 1830631999 12.57% no 2.42%%%%%%%%%%%%%%%% 16.48%%%%%%%%%%%%%%%% 3.76%%%%%%%%%%%%%%%%%% 3.16%%%%%%%%%%%%%%%%%% 2.25%%%%%%%%%%%%%%%%%% 8.73%%%%%%%%%%%%%%%%%% 10.09%%%%%%%%%%%%%%%%
%3%Peers%(Median) 6.01%%%%%%%%%%%%%%%% 29.80%%%%%%%%%%%%%%%% 10.77%%%%%%%%%%%%%%%% 10.77%%%%%%%%%%%%%%%% 8.09%%%%%%%%%%%%%%%%%% 25.72%%%%%%%%%%%%%%%% 30.95%%%%%%%%%%%%%%%%
premium%/(discount) 360% 345% 365% 371% 372% 366% 367% 063% 045%
Total 12.89% 1.56%

Appendix(N(*(Full(overview(of(20(Danish(IPOs((Average(peer(group(multiples)(
(Own construction
Date%of%IPO First%day%return In%IPO3wave P/S P/EP/B%pre3issue%(not%used%to%
calculate%average)P/B%post3issue EV/S EV/EBITDA EV/EBIT
Average%premium/(discount)
Average%premium/(discount)%adj.
OW#BUNKER#A/S 2830332014 19.66% no 0.06%%%%%%%%%%%%%%%% 15.15%%%%%%%%%%%%%%%% 4.35%%%%%%%%%%%%%%%%%% 3.98%%%%%%%%%%%%%%%%%% 0.08%%%%%%%%%%%%%%%%%% 12.40%%%%%%%%%%%%%%%% 13.32%%%%%%%%%%%%%%%%%3%Peers%(Average) 0.07 16.37 1.36 1.36 0.14 13.53 20.17 premium%/(discount) -25% -7% 221% 194% -40% -8% -34% 13% 023%ISS#A/S 1330332014 13.81% no 0.38%%%%%%%%%%%%%%%% n.a. 7.05%%%%%%%%%%%%%%%%%% 2.56%%%%%%%%%%%%%%%%%% 0.67%%%%%%%%%%%%%%%%%% 10.50%%%%%%%%%%%%%%%% 12.46%%%%%%%%%%%%%%%%%3%Peers%(Average) 0.68 6.69 na na 0.92 7.63 13.94 premium%/(discount) -44% na na na -28% 38% -11% 08% 08%MATAS#A/S 2830632013 3.48% no 1.47%%%%%%%%%%%%%%%% 17.93%%%%%%%%%%%%%%%% 2.00%%%%%%%%%%%%%%%%%% 1.33%%%%%%%%%%%%%%%%%% 2.02%%%%%%%%%%%%%%%%%% 10.74%%%%%%%%%%%%%%%% 13.98%%%%%%%%%%%%%%%%%3%Peers%(Average) 1.37 25.56 5.09 5.09 1.34 11.23 15.96 premium%/(discount) 7% -30% -61% -74% 51% -4% -12% 010% 2%ZEALAND#PHARMA#A/S 2331132010 316.61% no n.a. n.a. 4.77%%%%%%%%%%%%%%%%%% 4.55%%%%%%%%%%%%%%%%%% n.a. n.a. n.a.%3%Peers%(Average) 3.49 na 3.46 3.46 3.39 na napremium%/(discount) 538% na 38% 32% 508% na na 180% 8%Pandora#A/S 0531032010 24.52% no 4.28%%%%%%%%%%%%%%%% 15.46%%%%%%%%%%%%%%%% 6.61%%%%%%%%%%%%%%%%%% 5.75%%%%%%%%%%%%%%%%%% 4.60%%%%%%%%%%%%%%%%%% 11.66%%%%%%%%%%%%%%%% 12.97%%%%%%%%%%%%%%%%%3%Peers%(Average) 1.79 14.19 2.09 2.09 1.42 6.53 8.04 premium%/(discount) 139% 9% 217% 175% 225% 79% 61% 115% 50%Chr.#Hansen#Holding#A/S 0330632010 5.89% no 3.07%%%%%%%%%%%%%%%% ¨n.a. 3.26%%%%%%%%%%%%%%%%%% 1.79%%%%%%%%%%%%%%%%%% 4.64%%%%%%%%%%%%%%%%%% 17.24%%%%%%%%%%%%%%%% 23.82%%%%%%%%%%%%%%%%%3%Peers%(Average) 2.28 na 3.07 3.07 2.07 9.14 11.82 premium%/(discount) 35% na 6% -42% 124% 89% 101% 51% 20%CIMBER#STERLING#GROUP#A/S 0131232009 311.00% no 0.38%%%%%%%%%%%%%%%% n.a. 3.19%%%%%%%%%%%%%%%%%% 1.33%%%%%%%%%%%%%%%%%% 0.69%%%%%%%%%%%%%%%%%% n.a. n.a.%3%Peers%(Average) 0.90 na 1.87 1.87 0.80 na napremium%/(discount) -57% na 70% -29% -13% na na 017% 08%NUNAMINERALS#A/S 0430632008 11.71% no 35%%%%%%%%%%%%%%%%%%% n.a. 1.63%%%%%%%%%%%%%%%%%% 1.47%%%%%%%%%%%%%%%%%% 35.00%%%%%%%%%%%%%%%% n.a. n.a.%3%Peers%(Average) na na 7.46 7.46 na na napremium%/(discount) na na -78% -80% na na na 013% 0%Nordic#Shipholding#A/S 1230632007 10.99% yes 2.90%%%%%%%%%%%%%%%% 6.58%%%%%%%%%%%%%%%%%% 1.01%%%%%%%%%%%%%%%%%% 0.81%%%%%%%%%%%%%%%%%% 6.20%%%%%%%%%%%%%%%%%% 6.63%%%%%%%%%%%%%%%%%% 8.66%%%%%%%%%%%%%%%%%%%3%Peers%(Average) 6.90 15.04 2.46 2.46 1.65 9.33 11.65 premium%/(discount) -58% -56% -59% -67% 275% -29% -26% 7% 027%EXIQON#A/S 2930532007 5.77% yes 19.75%%%%%%%%%%%%%% n.a. 2.85%%%%%%%%%%%%%%%%%% 1.37%%%%%%%%%%%%%%%%%% 19.48%%%%%%%%%%%%%%%% n.a. n.a.%3%Peers%(Average) 18.54 na 4.11 4.11 13.17 na napremium%/(discount) 7% na -31% -67% 48% na na 02% 11%CHEMOMETEC#A/S 1831232006 133.53% yes n.a. n.a. 9.52%%%%%%%%%%%%%%%%%% 7.91%%%%%%%%%%%%%%%%%% n.a. n.a. n.a.%3%Peers%(Average) 2.81 na 3.80 3.80 2.95 na napremium%/(discount) 498% na 150% 108% 461% na na 178% 0%Veloxis#Pharmaceuticals#A/S 1331132006 7.05% yes n.a. n.a. 2.92%%%%%%%%%%%%%%%%%% 1.39%%%%%%%%%%%%%%%%%% n.a. n.a. n.a.%3%Peers%(Average) na na 3.51 2.57 8.82 na napremium%/(discount) na na -17% -46% na na na 08% 08%RELLA#HOLDING#A/S 1230632006 36.29% yes n.a. 33.98%%%%%%%%%%%%%%%% 2.86%%%%%%%%%%%%%%%%%% 2.86%%%%%%%%%%%%%%%%%% n.a. n.a. 33.57%%%%%%%%%%%%%%%%%3%Peers%(Average) na 14.51 4.41 4.41 na 14.18 17.52 premium%/(discount) na 134% -35% -35% na 137% 92% 55% 14%CURALOGIC#A/S 0930632006 32.40% yes n.a. n.a. 2.14%%%%%%%%%%%%%%%%%% 1.00%%%%%%%%%%%%%%%%%% n.a. n.a. n.a.%3%Peers%(Average) na na 2.48 2.48 na na napremium%/(discount) na na -14% -60% na na na 010% 0%TOPOTARGET#A/S 1030632005 16.89% no 10.27%%%%%%%%%%%%%% n.a. 1.96%%%%%%%%%%%%%%%%%% 1.21%%%%%%%%%%%%%%%%%% 10.57%%%%%%%%%%%%%%%% n.a. n.a.%3%Peers%(Average) na na 9.22 9.22 na na napremium%/(discount) na na -79% -87% na na na 014% 0%THRANE#&#THRANE#A/S 0630332001 30.33% no 1.23%%%%%%%%%%%%%%%% 15.71%%%%%%%%%%%%%%%% 4.40%%%%%%%%%%%%%%%%%% 1.02%%%%%%%%%%%%%%%%%% 1.25%%%%%%%%%%%%%%%%%% 8.70%%%%%%%%%%%%%%%%%% 10.14%%%%%%%%%%%%%%%%%3%Peers%(Average) 2.42 35.18 4.44 4.44 3.48 23.69 23.57 premium%/(discount) -49% -55% -1% -77% -64% -63% -57% 061% 049%NOVOZYMES#A/S 1731132000 12.24% no 2.26%%%%%%%%%%%%%%%% 23.57%%%%%%%%%%%%%%%% 3.02%%%%%%%%%%%%%%%%%% 3.02%%%%%%%%%%%%%%%%%% 2.53%%%%%%%%%%%%%%%%%% 9.34%%%%%%%%%%%%%%%%%% 14.61%%%%%%%%%%%%%%%%%3%Peers%(Average) 1.25 17.12 3.07 3.07 1.77 10.10 13.66 premium%/(discount) 81% 38% -2% -2% 43% -7% 7% 26% 26%GENMAB#A/S 1831032000 38.58% no n.a. n.a. 3.12%%%%%%%%%%%%%%%%%% 1.60%%%%%%%%%%%%%%%%%% n.a. n.a. n.a.%3%Peers%(Average) na na 7.90 7.90 na na napremium%/(discount) na na -60% -80% na na na 013% 0%RTX#A/S 0830632000 34.54% no 9.64%%%%%%%%%%%%%%%% n.a. 4.35%%%%%%%%%%%%%%%%%% 2.41%%%%%%%%%%%%%%%%%% 9.58%%%%%%%%%%%%%%%%%% 34.57%%%%%%%%%%%%%%%% 38.22%%%%%%%%%%%%%%%%%3%Peers%(Average) 5.32 na 3.67 3.67 3.99 29.57 34.56 premium%/(discount) 81% na 19% -34% 140% 17% 11% 11%H.#Lundbeck#A/S 1830631999 12.57% no 2.42%%%%%%%%%%%%%%%% 16.48%%%%%%%%%%%%%%%% 3.76%%%%%%%%%%%%%%%%%% 3.16%%%%%%%%%%%%%%%%%% 2.25%%%%%%%%%%%%%%%%%% 8.73%%%%%%%%%%%%%%%%%% 10.09%%%%%%%%%%%%%%%%%3%Peers%(Average) 5.93 31.08 9.88 9.88 7.04 25.70 30.66 premium%/(discount) -59% -47% -62% -68% -68% -66% -67% 063% 047%Total 20.80% 01.38%

Appendix(O(*(The(5(companies(with(first(day(return(only(
Own construction
(
(
(
(
(
First&day&return&only
FIRSTFARMS&A/S 12#12#2006 #0.95% no,peer,group,data,avaliable
NOWACO&GROUP&A/S 21#12#1998 2.47% no,peer,group,data,avaliable
BHJ&A/S 12#06#1998 4.71% no,peer,group,data,avaliable
Dicentia&A/S 18#05#1998 1.29% no,peer,group,data,avaliable
VESTAS&WIND&SYSTEMS&A/S 30#04#1998 8.52% no,peer,group,data,avaliable
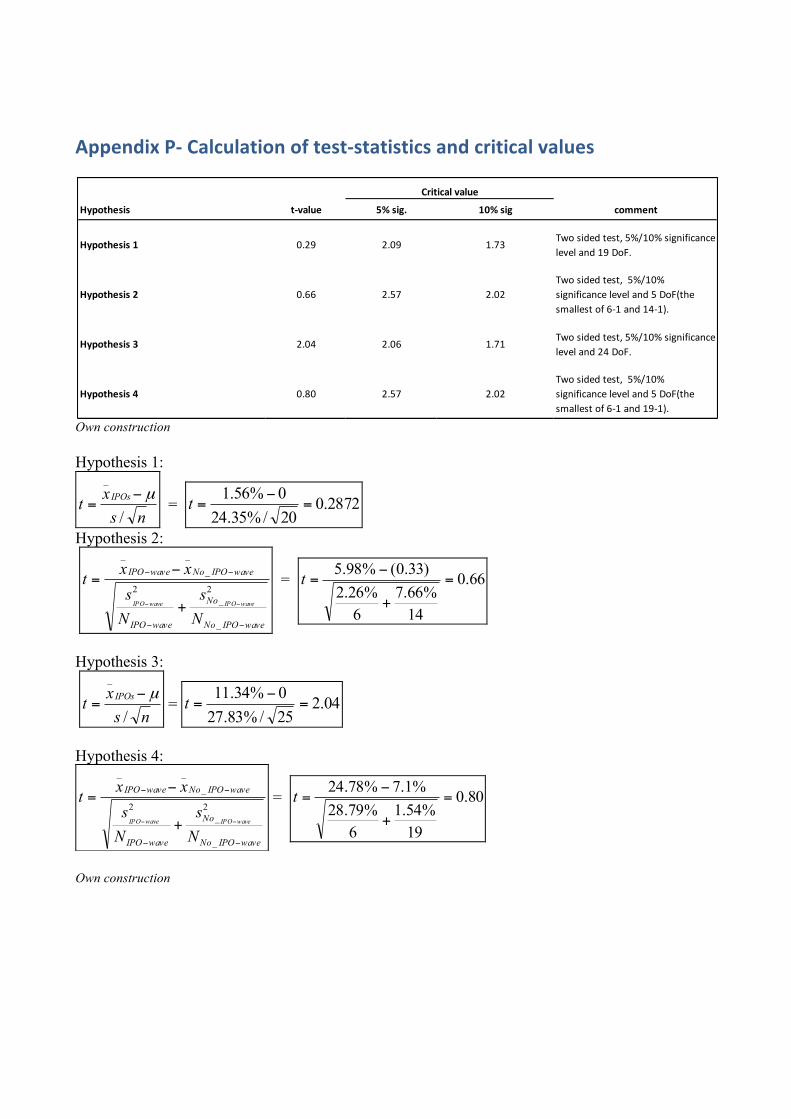
(
Appendix(P*(Calculation(of(test*statistics(and(critical(values(
Own construction Hypothesis 1:
nsxt IPOs
/
_µ−
= = 2872.020/%35.240%56.1
=−
=t
Hypothesis 2:
waveIPONo
No
waveIPO
waveIPONowaveIPO
Ns
Ns
xxtwaveIPOwaveIPO
−−
−−
−− +
−=
_
2_
2
_
__
= 66.0
14%66.7
6%26.2
)33.0(%98.5=
+
−=t
Hypothesis 3:
ns
xt IPOs
/
_µ−
= = 04.225/%83.270%34.11
=−
=t
Hypothesis 4:
waveIPONo
No
waveIPO
waveIPONowaveIPO
Ns
Ns
xxtwaveIPOwaveIPO
−−
−−
−− +
−=
_
2_
2
_
__
= 80.0
19%54.1
6%79.28
%1.7%78.24=
+
−=t
Own construction
Hypothesis t*value 5%1sig. 10%1sig comment
Hypothesis11 0.29 2.09 1.73Two+sided+test,+5%/10%+significance+level+and+19+DoF.
Hypothesis12 0.66 2.57 2.02Two+sided+test,++5%/10%+significance+level+and+5+DoF(the+smallest+of+6B1+and+14B1).
Hypothesis13 2.04 2.06 1.71Two+sided+test,+5%/10%+significance+level+and+24+DoF.
Hypothesis14 0.80 2.57 2.02Two+sided+test,++5%/10%+significance+level+and+5+DoF(the+smallest+of+6B1+and+19B1).
Critical1value

Appendix(Q(–(Description(of(DONG(Energy’s(peer(group(
E.ON
E.ON is a German power and gas company, which is mainly engaged in the chain of the power and
gas business, as they are active within all from power generation and gas production to distribution
and customer sales. E.ON’s operations are organized into separate market units: Central Europe,
which has operations in Central European countries; Pan-European Gas, which is a gas importer;
U.K., providing power and gas services; Nordic, which generates, distributes, markets and supplies
electricity and gas; U.S. Midwest, focusing primarily on the regulated electricity and gas utility
sectors in Kentucky; Energy Trading, combining all of the Company's European trading activities,
including electricity, gas, coal, oil and carbon dioxide allowances, and New Markets, which include
the activities of the new Climate and Renewables, Italy, Russia and Spain market units. “Cleaner &
better energy” is the guiding strategic theme for E.ON’s transformation from an integrated,
primarily European energy utility into a global, specialized provider of energy solutions.
RWE
The RWE Group ranks among the leading industrial companies in Germany and is through its
subsidiaries, engages in the generation, trading, transmission, and supply of electricity and gas.
RWW has many business units and the most important are Power, Innogy, Dea, Supply, and
Energy. RWE Power produces power in Continental Europe and RWE Innogy pools the company’s
renewable energy activities, which include both onshore and offshore wind farms in Europe as well
as hydroelectric power plants and biomass projects. RWE Dea produces gas and oil, focusing on
Europe and North Africa. RWE Supply & Trading runs the company’s European energy trading
operations and commercially optimizes its non-regulated gas activities. RWE Energy is responsible
for the company’s sales and grid companies in twelve regions in and outside Germany.
Iberdrola
Iberdrola is a Spanish energy company, which is one of the largest in the world and a world leader
in wind power. Iberdrola is engaged in production, transmission, switching, and distribution of
electricity and gas. Further, Iberdrola is involved in the renewable energy business, as well as
engages in the gas storage, electricity and gas supply activities, and distributes electricity and
natural gas. The company generates electricity primarily through nuclear, fossil fuel, and
hydroelectric power. Additionally Iberdrola operated business units such as telecommunication
services and engineering consulting, which are not directly related to the energy industry.

EDF
Electricité de France (EDF) is an integrated energy company, engaged in the generation,
transmission, distribution, supply, and trading of energies in France and internationally. It generates
electricity through nuclear, hydro, wind, solar, biomass, geothermal, fossil fuel, and marine energy
sources. The company also manages low and medium-voltage public distribution network; and
operates, maintains, and develops high-voltage and very-high-voltage electricity transmission
networks. In addition, it is engaged in the commodity trading activities; and provision of energy
services, including district heating services, thermal energy services, etc.
Centrica
Centrica is an integrated UK energy company, operating in United Kingdom, North America, and
Europe. Centrica Energy’s activities include: upstream gas production, development and
exploration; electricity generation; renewable asset operations and development; wholesale and
industrial gas sales, and energy procurement optimization and scheduling. In addition, the company
manages gas transportation and shipping services.
Fortum
Fortum is a Finnish energy company, which main activities are production, refining, distribution
and marketing of energy. Fortum generates and markets electricity, heat and oil, operates and
maintains power plants and provides energy-related services. The main products are electricity, heat
and steam, traffic fuels and heating oils. Fortum has its primary operations in Finland, Sweden and
Norway. It operates in four segments: Power Generation, Heat, Distribution, and Markets. Power
Generation comprises power generation and sales in the Nordic countries and the provision of
operation and maintenance services in the Nordic area and selected international markets. The
Power Generation segment sells its production to Nord Pool. Heat comprises heat generation and
sales in the Nordic countries and other parts of the Baltic Rim. Fortum is the major heat producer in
the region. The segment also generates power in the combined heat and power plants (CHP) and
sells it to end-customers mainly by long-term contracts, as well as to Nord Pool. Distribution owns
and operates distribution and regional networks and distributes electricity to a total of 1.4 million
customers in Sweden, Finland, Norway and Estonia. Markets is responsible for retail sales of
electricity to a total of 1.1 million private and business customers, as well as to other electricity
retailers in Sweden, Finland and Norway.