a core concept of the risk-based monitoring (rbm ... · pdf filerisk and will address one of...
TRANSCRIPT

A core concept of the Risk-based Monitoring (RBM) Methodology involves using what we’ve learned from assessing the risk of the clinical trial in order to manage the potential risks in a timely and integrated manner. This module will focus on the use of Risk Indicators and Thresholds in designing risk mitigation plans and assuring issues are identified and resolved in a timely manner. Learners will have the opportunity to apply some of the tools and concepts from the TransCelerate RBM methodology to hands on activities during this section of the course.
1

2

As noted, the course information will be broken down into five distinct modules. While information may overlap, the intent is to individually explore the concepts, tools and implementation of evaluating risk and implementing management and monitoring techniques. Each module will consist of three to four key objectives for the learners. The modules are as follows: Module 1- Introduction to Risk-Based Monitoring (RBM). In this module we will introduce the concept of RBM, how it varies from traditional monitoring approaches and why we are focusing on implementing this methodology. We will also introduce you to definitions and assumptions underlying the TransCelerate Position Paper: Risk-Based Monitoring Methodology that was published May, 2013. Module 2- Methodology and Team Members. The focus of module 2 will be to further explore the TransCelerate Methodology, introduce the RBM toolkit, discuss RBM team responsibilities within a company, and describe the on-site, off-site, and central monitoring activities in study oversight. Module 3- Risk Assessment. In module 3 we will be focusing on how to identify and quantify risk and will address one of the key measurement tools, the RACT, in detail. Module 4- Risk Management. Module 4 will further address risk management and how to define critical Risk Indicators and Thresholds in decision making. We will also talk about risk mitigation plans, activities, and risk response. Module 5- Transitions. The focus of the final module is on the application and considerations of RBM plan implementation. In this section we will address a practical approach to implementation and management, as well as how to transition projects, protocols and sites into the RBM model.
3

By the end of this module, learners will be able to define Risk Indicators and Thresholds for a particular trial and demonstrate their use in decision-making through a hands-on activity built around a mock protocol synopsis. Learners will be able to discuss the implementation of risk mitigation plans. Participants will be able to describe how monitoring activities are conducted in the RBM model, including the concept of a baseline monitoring approach, and modifications to that approach. Finally, learners will be able to describe how potential risks and issues can be managed throughout the study by applying appropriate response plans and actions.
4

Before we get started, let’s check in with our high-level process diagram for the TransCelerate RBM Methodology, as shown here. Our discussion of Risk Indicators and Thresholds takes us into Step 3 of the process. You will also see that risk mitigation planning occurs in Step 3 and is implemented in step 4.
5

The International Conference on Harmonisation of Technical Requirements for Registration of Pharmaceuticals for Human Use, known as ICH, defines risk management in Topic Q9 as [read slide]. Assessment of risk is accomplished in the RBM methodology through identification of Critical Data and Processes and completion of the Risk Assessment Categorization Tool (RACT). Controlling, communicating, and reviewing risks will be the topic of this module as we talk about Risk Indicators, Thresholds, action plans and risk mitigation.
6

Let’s start by reviewing the concepts of Risk Indicators and Thresholds. These add substantial value to personnel as they make decisions about data and information obtained through monitoring of a clinical trial.
7

This process flow will serve as our “roadmap” as we learn about risk management activities in the RBM methodology. As we just mentioned, in the RBM methodology, first we identify our risks through the process of risk assessment. Then, we move into further evaluating the protocol to answer three key questions: 1. Now that we know what our risks are, what helps us to detect that risk? Risk indicators are established to allow us to detect potential problems or risks in the study. 2. At what point in the study will we know there is a potential problem requiring action? Establishing Thresholds for our Risk Indicators helps us to establish expectations and sets a trigger point for action. 3. How will we respond when a Threshold is reached and/or a potential problem is found? Actions are designed to appropriately respond to data and information that indicates a possible problem.
Let’s look at the topic of Risk Indicators first and see how they can help us to detect risks to our study.
8

Take a minute to review the definition of a Risk Indicator (from the TransCelerate position paper) which was reviewed in the introductory module of this course. Risk Indicators can be thought of as variables defined through risk assessment that need to be tracked to indicate whether there is a danger of an actual issue occurring. Risk Indicators are variables assessed by comparison across a program, study, country, and/or site. All Risk Indicators are considered to have underlying influence on the quality of a study.
9

Note to Speaker: Use this slide content as a guide for facilitating a discussion about when Risk Indicators are identified, who is involved in the identification, and where Risk Indicators are documented. When are Risk Indicators identified ? During study planning and before functional risk mitigation plans are finalized Who is involved in identifying Risk Indicators? This should be a cross-functional process involving many of the same roles and team members as participated in the RACT completion Where are Risk Indicators documented? In the Integrated Quality Risk Management Plan (IQRMP)
10
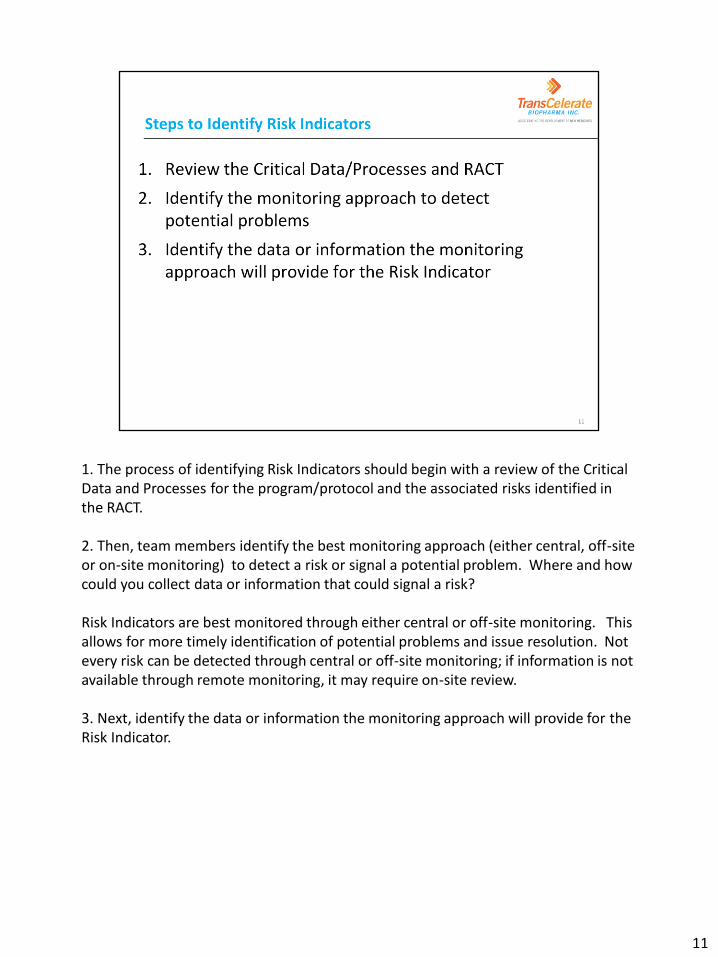
1. The process of identifying Risk Indicators should begin with a review of the Critical Data and Processes for the program/protocol and the associated risks identified in the RACT. 2. Then, team members identify the best monitoring approach (either central, off-site or on-site monitoring) to detect a risk or signal a potential problem. Where and how could you collect data or information that could signal a risk? Risk Indicators are best monitored through either central or off-site monitoring. This allows for more timely identification of potential problems and issue resolution. Not every risk can be detected through central or off-site monitoring; if information is not available through remote monitoring, it may require on-site review. 3. Next, identify the data or information the monitoring approach will provide for the Risk Indicator.
11

Let’s work through an example together to see how these steps are applied. For this example, let’s focus on the Critical Process that relates to subject safety and the safety profile of the product. Note to Speaker: Ask a participant to read the study description or read it aloud to the participants. Ask each question of participants and facilitate application of concepts. Answer key is provided below and on the next slide. 1. Identify the Critical Process - compliance with re-testing requirements for
elevated ALT/AST 2. Identify the monitoring approach - central (through reports provided by central
laboratory vendor) 3. Identify data/information obtained - missing re-tests when ALT/AST > 2 x ULN Risk Indicator = comparison across sites for # of missing required re-tests (i.e., when ALT/AST > 2 x ULN)
12

Answer Key for previous slide
13

TransCelerate created a collection of Risk Indicators, provided in the position paper, which are intended to be monitored in an ongoing fashion either centrally or through off-site activities. This table may serve as a valuable resource to facilitate discussions within the team and identification of Risk Indicators. Here you see 8 TransCelerate categories and an example for each of a potential Risk Indicator. There is no requirement that every Risk Indicator in the TransCelerate paper has to be implemented for every clinical trial. These are suggested Risk Indicators that can be applied where appropriate to the risks and Critical Variables for a particular protocol. Note to Speaker: For each example on the right side, highlight the potential risk that this Indicator would allow us to detect. For example – the first one is “outliers/trends in number of adverse events per subject visit/site.” This Risk Indicator would allow you to detect sites that have a low number of AEs (compared to other sites); potential under-reporting would result in a risk to the overall safety profile of the product. Alternatively, a site with a comparatively high number of AEs could indicate a risk to subject safety at that site. Slides #13-18 provide details on all the Risk Indicator categories provided in the TransCelerate paper and can be used if in depth review is desired.
14

Note to Speaker: This slide is hidden but available for those who want to review
the TransCelerate position paper Risk Indicators in detail. Read and discuss content
on the slide with participants.
15

Note to Speaker: This slide is hidden but available for those who want to review the TransCelerate position paper Risk Indicators in detail. Read and discuss content on the slide with participants.
16

Note to Speaker: This slide is hidden but available for those who want to review the TransCelerate position paper Risk Indicators in detail. Read and discuss content on the slide with participants.
17

Note to Speaker: This slide is hidden but available for those who want to review the TransCelerate position paper Risk Indicators in detail. Read and discuss content on the slide with participants.
18

Note to Speaker: This slide is hidden but available for those who want to review the TransCelerate position paper Risk Indicators in detail. Read and discuss content on the slide with participants.
19

Note to Speaker: This slide is hidden but available for those who want to review the TransCelerate position paper Risk Indicators in detail. Read and discuss content on the slide with participants.
20

Next, let’s give you an opportunity to put the concepts reviewed thus far into action through a hands-on activity. Note to Speaker: This activity will be completed through review of a sample protocol synopsis. Instructions for the activity are provided separately in the participant workbook, recognizing that some organizations may prefer to use an internal protocol synopsis to make the activity more applicable to the specific work environment.
21

Returning to our “roadmap” from earlier in the module, we have now completed identification of the Risk Indicators. Now that we know how to detect risks, we are ready to ask the second question – what range or value do we expect from the Risk Indicators? Setting Thresholds allows us to evaluate data and information to determine when there is a potential problem that requires action.
22
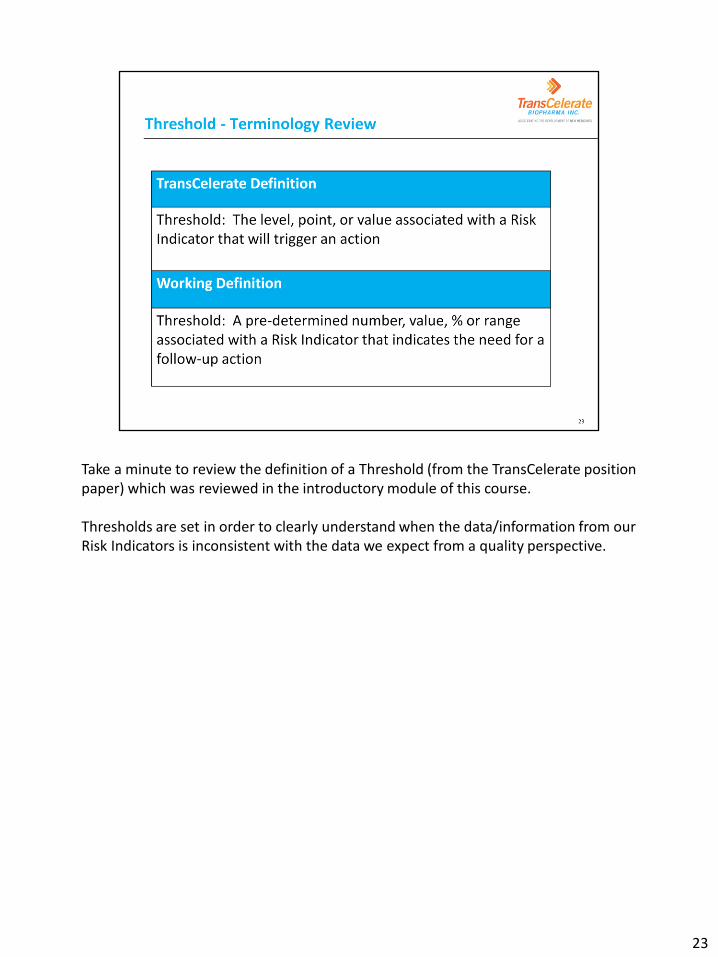
Take a minute to review the definition of a Threshold (from the TransCelerate position paper) which was reviewed in the introductory module of this course. Thresholds are set in order to clearly understand when the data/information from our Risk Indicators is inconsistent with the data we expect from a quality perspective.
23

In setting Thresholds for each Risk Indicator, the first step is generally to determine an expected value (a rate, number, percentage, or range of values). Next, we need to consider how high the risk to the study will be if the expected value isn’t met. This could occur in several ways – the data is either lower or higher than the expected value, or varies from the expected value by a range or percentage. This example shows there is often an inverse relationship between Thresholds and risks. So, if the risk from missing the expected value is high, your Threshold should be set relatively low. This indicates a lower tolerance or acceptance of variation from the expected value. Conversely, we might be willing to accept a higher Threshold or more variance if the risk to the study is low. Thresholds can be adjusted depending on the needs of the study to be either more stringent (such as for Risk Indicators impacting subject safety or the primary objective) or less stringent (such as for Risk Indicators considered to have low or with minimal impact for a given study).
24

Let’s work through an example together to see how to apply the identification of an appropriate Threshold. Note to Speaker: Ask a participant to read the study description and background on Critical Process and Risk Indicators. Alternatively, read them aloud to the participants. Move forward to next slide to see the group assignment/question.
25

Note to Speaker: Facilitate discussion among participants to identify which of the Thresholds is most appropriate. Answer key is provided below and on the next slide.
A. Set the Threshold at a medium level since the risk is medium (no more than 15% average variation in serial BP measurements)
B. Set the Threshold at a low level since the risk is high (i.e., no more than 4% average variation in serial BP measurements)
C. Set the Threshold at a high level since the risk is low (no more than 30% average variation in serial BP measurements per site)
26

Answer Key and explanation:
A. Set the Threshold at a medium level since the risk is medium (no more than 15% average variation in serial BP measurements) - not the best answer because the risk was identified as high; Threshold should therefore be relatively low.
B. Set the Threshold at a low level since the risk is high (i.e., no more than 4% average variation in serial BP measurements) – very low Threshold because risk is high.
C. Set the Threshold at a high level since the risk is low (no more than 30% average
variation in serial BP measurements per site) – Threshold is set too high for such a high impact Risk Indicator.
27

Different levels of Thresholds may be set for a specific Risk Indicator. This practice can facilitate directing our response activities in accordance with the level of perceived risk. An example shown here involves three different levels (high, medium, and low) and shows how they can be conceptualized. • A Risk Indicator in the high range reflects a warning and would require more immediate attention than an item coded as Medium or Low. • The medium range provides more of an awareness of a potential problem. • A Risk Indicator in the low range may be considered more acceptable in terms of risk and possibly require no action.
The TransCelerate position paper recommends that a Risk Indicator system or tool be used to help display information that will help track the indicators, such as a color coded alert system on a dashboard. For example, a high alert would be color coded as red and would require more immediate attention than an item coded as medium in yellow. The system used should be able to provide the right level of information to the functional team member performing a monitoring activity, for example, a person with study-level responsibilities should be able to assess risk across all sites for a given protocol. If such a dashboard is not available, at a minimum, the Risk Indicator system or tool should be able to display information as follows: • allows comparison of subject-level data across a site, • allows comparison of a site against its peer sites within a country or within a protocol, • allows comparison of one country to another, • allows comparison of data across protocols, and
28

• facilitates the detection of problems that require further investigation.
28

You may remember the Companion Guide to Risk Indicators from our previous discussions of the RBM Toolkit. This guide can be used to facilitate consistency among team members in applying Risk Indicators and Thresholds for decision-making and responding to risks. Notice how the left column on the screen illustrates the application of three different levels of Thresholds to the specific Risk Indicator of Adverse Event collection /reporting. We will examine the right hand column a bit later when we review setting actions for Thresholds. Now, let’s give you an opportunity to practice working with setting Thresholds.
29

Note to Speaker: This activity will be completed through continuing review and analysis of a sample protocol synopsis. Instructions for the activity are provided separately in the participant workbook, recognizing that some organizations may prefer to use an internal protocol synopsis to make the activity more applicable to the specific work environment.
30

We’ve identified our Risk Indicators and set our Thresholds. What’s left in our “road map”? Note to Speaker: Facilitate participants’ discussion of the steps and review – what do we do with the data we collect and the expected values we’ve set?
31

Now we are ready to answer the last of our 3 questions: How will we respond when a Threshold is reached and/or a potential problem is found? Actions are designed to appropriately respond to data and information that indicate a possible problem. Let’s take a closer look at planning actions designed to respond to Risk Indicators and Thresholds. Note to Speaker: Reveal the answers.
32

When a given Threshold is reached, a decision needs to be made regarding the appropriate action to take. The timing of our actions in response to Thresholds also often depends upon the Threshold level. Therefore, more immediate action may be necessary for a “High” Threshold level in comparison to a “Medium” level. At the “Low” or “green” level, often no additional actions beyond ongoing comprehensive monitoring will be needed. At the “Medium” or “yellow” Threshold level, the choice of action, depending on the issue, may simply be to continue Central or Off-site Monitoring for potential trends. Examples of additional actions for a “Medium” Threshold level include:
• Assess other types of data remotely – for example, if a site’s AE rate is lower then expected, one could review EDC off-site to identify any changes in subject concomitant medications. These could represent potential AEs.
• Contact the site to gather additional information – for example, discuss how the site collects and assesses potential AEs and confirm the site has qualified individuals involved in AE management
In response to a “High” Threshold level, many of the same actions as identified above may be taken but in a more immediate timeframe. Additionally, these actions may be taken:
• Collect site documentation – for example, one could ask to review a copy of the site’s SOP for AE management if one exists
• Visit the site to assess documentation that is only available on-site and cannot be made available remotely through electronic means – for example, this may be necessary to review subject medical records to confirm there are no unreported or missed AEs.
33

In some situations, it may be useful for an action plan to make use of a decision tree. This would guide team members through the various steps of investigation when a particular Threshold is reached. A sample of this approach is provided here. Not to Speaker: Walk through the decision tree with participants. Squares/rectangles represent action plans and diamonds represent decision points.
34

Let’s work through an example together to see how to determine an appropriate action for Thresholds. It has been determined that a high rate of subject discontinuations due to lack of efficacy (presumably in those subjects assigned placebo) could jeopardize the statistical analysis and study endpoints. What actions could possibly be taken in response to data showing the Threshold has been reached? Note to Speaker: Read the instructions to the participants. Facilitate discussion to determine appropriate action(s) to respond to this high level Threshold. Answer key is provided below and on the next slide (may not be all-inclusive). 1. Evaluate site-level discontinuation rates to determine if rate is higher at some
sites than others 2. Off-site review of data to confirm reason for discontinuation = lack of efficacy 3. Contact sites to confirm subjects are receiving appropriate rescue medication
35

Answer key for previous slide (may not be all inclusive)
36

Again, let’s remember that Companion Guide to Risk Indicators in the RBM Toolkit can serve as a resource in identifying actions in response to Thresholds. Notice how the right column on the screen defines the actions that are needed in response to the three different levels of Thresholds for this Risk Indicator (adverse event reporting). Now, let’s give you an opportunity to practice developing action plans when Thresholds are met.
37

Note to Speaker: This activity will be completed through continuing review and analysis of a sample protocol synopsis. Instructions for the activity are provided separately in the participant workbook, recognizing that some organizations may prefer to use an internal protocol synopsis to make the activity more applicable to the specific work environment.
38

Our objective in this section is to describe risk mitigation plans and how they are implemented throughout the conduct of the clinical trial.
39

Risk Mitigation is an element of risk management and is simply defined as a plan which assigns responsibility and defines the actions taken to prevent or decrease the probability of a risk becoming an issue. In the RBM methodology, completion of the RACT helps to document risk mitigation by identifying the functional plans that are involved for each risk category. The responsible functional plans are then incorporated into the Integrated Quality Risk Management Plan or IQRMP. The IQRMP and its associated risk mitigation plans define the actions that each function will take to proactively identify, assess, and manage risk throughout the life of the clinical trial.
40

Note to Speaker: Use this slide content as guide for facilitating a discussion about how a Data Management Plan represents risk mitigation. Traditionally, Data Management Plans describe the procedures and responsible personnel involved in data collection, data review, and data query and resolution. So, how do these plans fit into our concept of risk mitigation? Data collection: Timely data collection and data entry is a critical factor in successfully implementing the RBM methodology to allow for “real-time” review of potential risks. So, data management teams may mitigate this risk by setting Risk Indicators, Thresholds, and action plans related to timely data collection/entry by sites. Data review: Expectations may be set for timely and ongoing (preferably continuous) data review cycles to ensure risks are detected in a timely manner. Also, the use of programmed edit checks for Critical Data or to assess Risk Indicators can be a component of risk mitigation. Data query and resolution: Reviews may occur to determine if certain data points have a higher than average query rate. If so, the risk may be mitigated by the following: 1. Process to validate the query is firing correctly 2. Determine impact of the query – is it resulting in delays in ability to review Critical Data? 3. Determine extent of query problem – all sites across the study or only certain ones? 4. Review eCRF completion instructions to determine if appropriate guidance was given to sites. Risk mitigation can also be managed through other data systems such as entering data from a lab
41

directly into an IVRS system to avoid transcription error or setting lab alerts for values that meet a specified criteria.
41

Note to Speaker: Use this slide content as guide for facilitating a discussion about how the Safety Plan relates to risk mitigation. Safety or pharmacovigilance plans describe how pharmacovigilance/drug safety functional areas will manage safety risks related to a product. These activities involve ongoing review of emerging safety data from all studies being conducted for the product. Additionally, drug safety personnel ensure that investigators, regulatory authorities, and potentially ethics committees are updated as required when new safety information becomes available. So, how are safety plans critical for mitigating risks that arise from safety risks related to the product? Safety plans should establish the processes and assign responsibility for ongoing review of all safety data coming in from clinical trials being conducted. Reports of serious adverse events (SAEs), for example, should receive expedited review by safety personnel as they represent a higher level of risk to subject safety. Communication may need to be expedited for certain adverse events based upon their rate of occurrence. The incidence and severity of adverse events is evaluated against the existing product information allowing the identification of an increase in the expected rate that requires further investigation. For example, in a dry eye study, if ocular hypertension is occurring in 40% of study subjects but was only seen at a rate of 20% in previous studies, the safety plan would detail how this safety signal will be further evaluated.
42

For significant safety data, the safety plan may possibly establish a Threshold at which the study would need to be stopped. This may become part of the charter for a Data Safety Monitoring Committee where appropriate.
42

Note to Speaker: Use this slide content as guide for facilitating a discussion about how components of the MP represent risk mitigation. The trial-specific Monitoring Plan is a plan within the IQRMP, typically created by the clinical monitoring or clinical operations group. The MP should guide Monitors beginning after site activation until close-out. What do we mean by “baseline monitoring approach”? This is an aspect of the MP which defines the level of monitoring across sites and the processes for monitoring (i.e., central, off-site, and/or on-site) that reflect the appropriate level of monitoring in response to the identified risks (Critical Data, Critical Processes, and the RACT). How does detailing the monitoring activities conducted centrally, off-site, and on-site reflect risk mitigation? It assigns responsibility (who will do what) and defines the process (how will they do it) by which we will detect risks, measure their impact, and take actions to minimize their impact. Finally, how and why would changes in our baseline monitoring approach or activities be required? For example, if the Overall Risk Level of the study decreases at a certain stage, such as moving from active enrollment/treatment stage to subject follow-up stage, the extent of activities such as SDR and/or SDV may change. The monitoring approach and/or activities may also change if Thresholds are reached in various Risk
43

Indicators or if other compliance/quality issues are identified at the site or study level.
43

Let’s spend some time reviewing the monitoring activities defined in the TransCelerate RBM methodology. This will include a discussion of Source Data Verification (SDV), Source Data Review (SDR), the baseline monitoring approach, and modifying the monitoring approach in response to issues or risks in the study.
44

Looking once more at the high-level process diagram for the RBM Methodology, our discussion of how monitoring activities are conducted in the TransCelerate RBM methodology resides in step 4 – where we are executing monitoring activities for the trial.
45

The concept of comprehensive monitoring within the TransCelerate RBM methodology involves 4 key ideas:
• The baseline monitoring activities are defined by the program and study-specific risks
• Ongoing central and/or off-site monitoring activities provide a foundation to ensure timely and adequate monitoring
• On-site monitoring activities are triggered by Risk Indicators and Thresholds • Monitoring involves everyone, not just Clinical Research Associates/Monitors
Additionally, two key terms related to monitoring are clarified in the TransCelerate position paper – Source Data Verification and Source Data Review. Let’s look at these two terms and how they are defined and applied in the RBM methodology.
46

Commonly known as ‘transcription checking’, SDV is the process by which data within the site’s original source documentation are compared to data within the CRF (or other data collection systems) (and vice versa). SDV involves 1:1 verification. It’s purpose is to confirm that the data were transcribed accurately (i.e. data from source matches data in the CRF or other system and vice versa). SDV is performed on Critical Data only and decisions about the amount of SDV are based upon the risk assessment process and outcomes.
47

SDR mainly involves reviewing key pieces of source documents for areas where there is no associated CRF data field. SDR also provides a means of reviewing the processes by which the data were collected - including protocol compliance, PK collection, ICF process, investigator involvement and delegation, etc. This can provide additional assurance of data integrity. SDR is sometimes performed by reviewing source documents and other records in their entirety – like reading a book that tells the story of the subject’s participation in the study. Let’s consider a few examples of SDR. Let’s assume that the CRF only includes the lab test name and the result (e.g. blood glucose value of 105 mg/dl). Whereas SDV is verifying that the blood glucose value shown on the local lab report is accurately entered into the CRF (i.e. value of 105 in the CRF matches the value in the source and vice versa), SDR might involve reviewing the source to check that the patient was fasting for the glucose test (if fasting was required per protocol). Let’s think about another example involving weight measurement. Whereas SDV is verifying the source weight measurement is accurately entered into the CRF (i.e. CRF matches the source and vice versa), SDR might involve checking how the weight was
48

obtained (e.g. with shoes on or off, using the same scale across visits) to determine if the protocol requirements for obtaining the weight were followed.
48

Transcription errors identified by SDV are typically infrequent, insignificant, and do not lead to study data being unusable. This was supported by the retrospective analysis of monitoring and SDV conducted by TransCelerate. In contrast, issues with compliance (i.e. protocol violations) are one of the reasons for study data being excluded from the final efficacy analysis. These types of errors are more readily identified through SDR. So, the two activities address different risks in study conduct and can help sponsors get answers to different questions about site performance. Therefore, different levels of SDV and SDR can be used according to the study-specific needs to address risks.
49
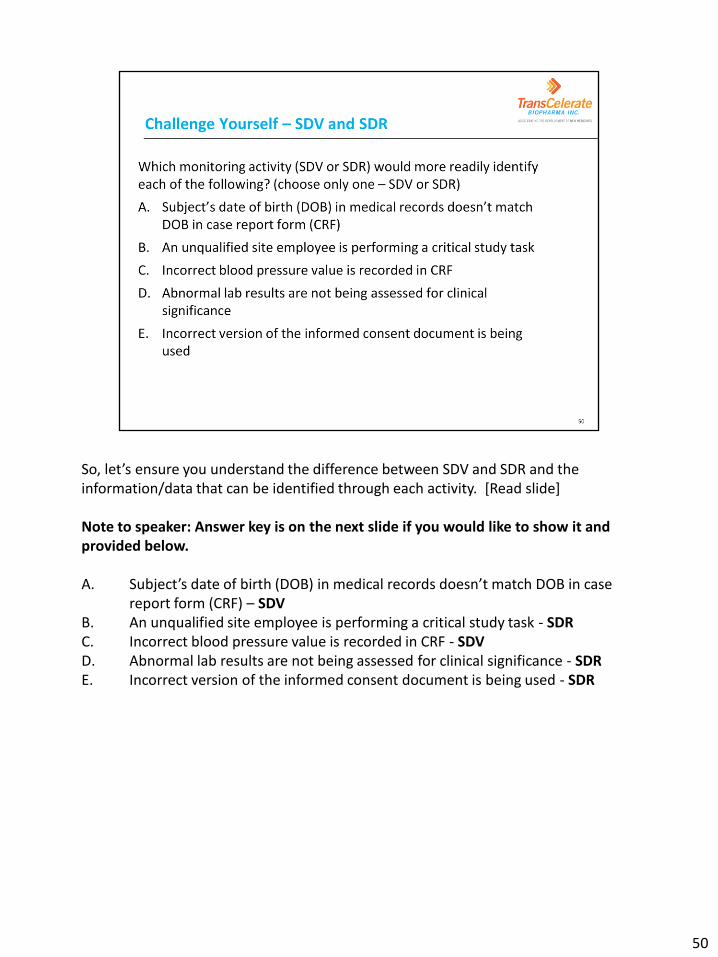
So, let’s ensure you understand the difference between SDV and SDR and the information/data that can be identified through each activity. [Read slide] Note to speaker: Answer key is on the next slide if you would like to show it and provided below. A. Subject’s date of birth (DOB) in medical records doesn’t match DOB in case
report form (CRF) – SDV B. An unqualified site employee is performing a critical study task - SDR C. Incorrect blood pressure value is recorded in CRF - SDV D. Abnormal lab results are not being assessed for clinical significance - SDR E. Incorrect version of the informed consent document is being used - SDR
50

Answer key
51

An Overall Risk Level for each trial is derived from the completion of the RACT and can be used to determine the baseline monitoring approach. This table from the TransCelerate position paper illustrates how the study’s Overall Risk Level impacts some of the common monitoring activities. These ranges are recommendations; higher or lower percentages can be applied for a given study or site. SDV and/or SDR can be increased in response to issues and risks identified at the site, country/region, or study level. Any such increases, however, should be temporary and implemented in a targeted manner. Note to Speaker: review the monitoring activities and point out how the sampling percentage changes based on whether the Overall Risk Level for the study is high, medium, or low.
52

As mentioned previously, it is acceptable to assign differing Overall Risk Levels for various stages of the study. For example, the Overall Risk Level may be high during a site’s active enrollment but then be set as low as the site’s subjects enter follow-up. The type, amount, and location of monitoring activities may also vary accordingly. Results from monitoring (Central, Off-site, or On-site) may guide specific interventions and require a change in the risk level and/or approach. For example, if an oncology site is identified as an outlier with no reported adverse events, the sponsor could consider increasing SDV of subject visits for that site.
53

Note to Speaker: Use this slide content as guide for facilitating a discussion about possible situations that would require a change in the baseline monitoring approach. As part of the Risk Mitigation Plan the following elements may be considered for adjustment of the baseline monitoring approach:
• Protocol amendments, especially for a substantial amendment, may impact ICFs, inclusion/exclusion criteria, safety, and relabeling of study medication
• Changes at the investigative site such as relocation or significant change in site personnel
• The occurrence of quality issues such as protocol deviations, deviation from inclusion/exclusion criteria, unreported or inappropriate reporting of SAEs
• Thresholds being reached for Risk Indicators (example: AE rate identified through central monitoring appears below or above average for rest of the study)
• Additional issues for consideration may include a high recruitment rate, inadequate PI oversight, lack of follow-up, or outstanding issues that have not been resolved
54
Our final topic for this module is to summarize our responsibility to appropriately respond to potential issues and risks identified or encountered throughout the study.
55

Finally, let’s take one last look at the high-level process diagram for the TransCelerate RBM Methodology. Our last topic of discussion, responding to issues and risks, occurs within step 4.
56

A four step process is commonly used in site and study management for responding to issues or risks occurring in clinical trials. Let’s briefly review these steps. 1. First, the issue or risk is identified. In the RBM methodology, this is facilitated by
the identification of Critical Data/Processes, the completion of the RACT, and the development and application of various components of the IQRMP.
2. The second step involves what is often called root cause analysis, which means thoroughly investigating the issue/risk to clearly identify the underlying cause of the problem. While not specifically covered in the TransCelerate position paper, the concept of root cause analysis is supported by regulatory authorities and can be considered part of quality risk management. Also, many of the actions we design for responding to Thresholds help to move us toward understanding the root cause(s).
3. The third step requires that appropriate solution(s) to the identified root causes be applied – at the site, study, country, and/or program level. These solutions could include both immediate corrective actions and more long-term preventive actions.
4. Finally, we should ensure that we evaluate the effectiveness of the solutions in preventing recurrence of the problems This can often be accomplished through ongoing central and/or off-site monitoring.
57

Let’s take another look at the previous group challenge involving IP with a known association for elevated liver enzymes and its Risk Indicator (as shown on the slide). Let’s use this scenario to illustrate how one would respond to issues/risks identified for this Critical Process. Note to Speaker: Ask a participant to read the study description reminder and Risk Indicator (or read these aloud to the participants). Additional information and questions for the participants are provided on the next slide.
58

So, we previously determined that we would monitoring through a central approach, using reports provided by the central laboratory vendor. We have analyzed the central lab data as follows [read bullet points] Note to Speaker: Facilitate the discussion of potential issues/risks, guiding participants to determine if the data indicates only site-level risks, only study-level risks, or both. Focus only on identifying the risks at this point, not on root cause(s) and/or solutions. We will approach those after we’ve identified the issues. Answers appear below and on the next slide. High overall average rate of missing required re-tests 6.7 missed out of 10.3 incidence 6 sites have higher than average missing required re-tests
59

So, two potential issues or risks include a high overall rate for the study of missing required re-tests. On average, each site has 10.3 ALT/AST results that would require re-testing. On average, 6.7 missed re-tests occur per site. So, this can be thought of as a study-level issue/risk. Then, we have a potential site-level issue/risk with the 6 “outlier” sites that have a higher than average number of missing required re-tests. Our next step is to think about and identify possible root cause(s) of the issues we’ve identified. Note to Speaker: Facilitate discussion to identify the possible root causes of the potential issues/risks identified on the slide. Participants should clearly identify the potential root causes in order to identify possible solutions. Answers are provided below and detailed in the speaker notes of the next slide.
• Unclear expectations • Reporting issues • Subject compliance • Training gap
60

Some possible root causes for the issues we’ve identified are provided here. Let’s look at them more closely. Perhaps the protocol or other communication with sites has not provided clear expectations for the required re-testing. Maybe the protocol doesn’t specify how quickly the re-test should be performed after the elevated ALT/AST results are received. There could be reporting issues with the central lab vendor. For example, maybe it is unclear form the lab report that the ALT/AST results are elevated (if, for example, the normal ranges aren’t printed on the lab report). Perhaps sites are struggling with getting subjects to comply with the re-testing requirements. Returning to the clinic for re-testing may be extremely difficult for subjects, for example due to work schedules, if the subject population is physically disabled, or if transportation to the clinic is problematic. Finally, there may truly be a training gap in which investigative site personnel were not trained properly on the re-testing requirements for the ALT/AST elevations. Note to Speaker: After discussing the possible root causes, facilitate discussion to identify possible solutions to address the potential issues/risks. Answers are provided below and detailed in the speaker notes of the next slide.
61

Some possible solutions are provided here. To address the potential lack of clarity in protocol expectations, a re-testing decision tree tool could be developed and provided to all sites. Review and training on the use of this tool could take place remotely through teleconference. To address the potential laboratory reporting root cause, a “re-test flag” could be incorporated into the laboratory report that would clearly identify for investigators those ALT/AST results that require re-testing. To address the potential subject compliance factor, perhaps a subject travel stipend could be incorporated to off-set transportation costs. This would, of course, need to be reviewed and approved by the institutional review board/ethics committee and incorporated through an informed consent revision. Finally, to address potential training gaps, training materials could be developed to be presented remotely to sites through teleconference.
62
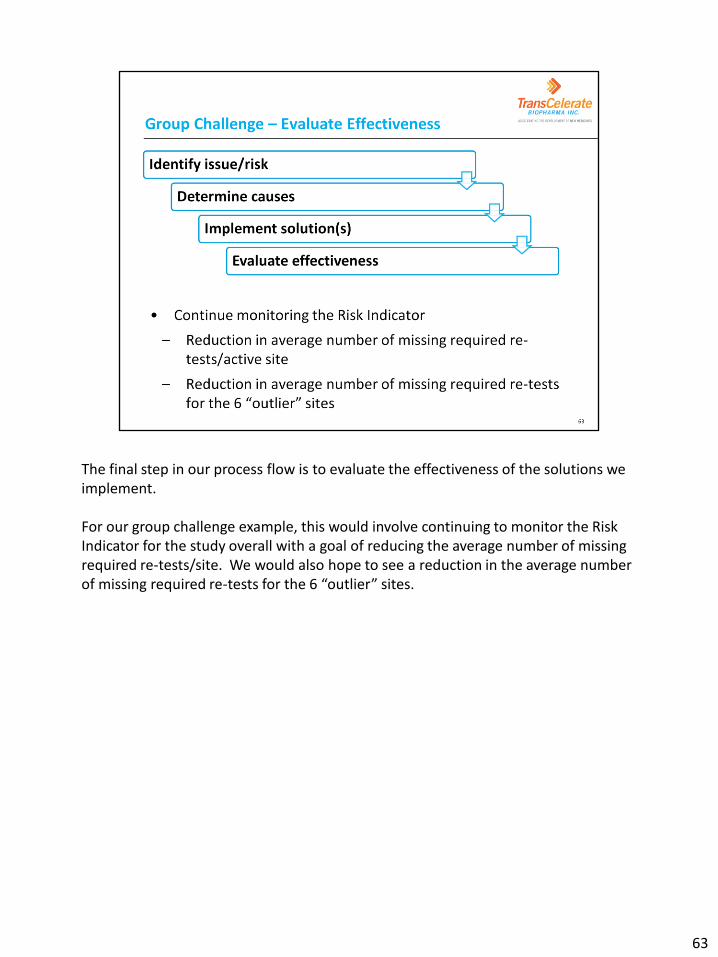
The final step in our process flow is to evaluate the effectiveness of the solutions we implement. For our group challenge example, this would involve continuing to monitor the Risk Indicator for the study overall with a goal of reducing the average number of missing required re-tests/site. We would also hope to see a reduction in the average number of missing required re-tests for the 6 “outlier” sites.
63

The Integrated Quality Risk Management Plan (IQRMP), recommended in the TransCelerate RBM methodology, includes these two potential elements that may be used to communicate, track, and monitor issues and risks throughout the study. Note to Speaker – these are provided as optional for discussion. These may or may not be used by your project teams and/or organizations.
64

Note to Speaker: This activity will be completed through review and analysis of several scenarios related to the simulated protocol synopsis. Instructions for the activity are provided separately in the participant workbook, recognizing that some organizations may prefer to use an internal protocol synopsis to make the activity more applicable to the specific work environment.
65

In summarizing this module, we have covered several key practices and concepts related to the TransCelerate RBM methodology. We reviewed the use of Risk Indicators and Thresholds for decision-making in clinical trials. We discussed the implementation of risk mitigation plans for minimizing the impact of potential risks in our trials. We described the monitoring activities conducted in the RBM model including clarification of SDV and SDR activities, establishing a baseline monitoring approach, and modifying monitoring approaches and activities. Finally, we reviewed how potential risks and issues can be managed throughout the study by applying appropriate response plans and actions.
66

Any questions?
67