a consumer perception on preferred brand of …
TRANSCRIPT
GSJ: Volume 8, Issue 3, March 2020, Online: ISSN 2320-9186
www.globalscientificjournal.com
A STUDY ON CONSUMER PERCEPTION ON PREFERRED BRAND OF PROCESSED CHEESE Harihara Subramanian KK1, Dr. K. Vivekanandan2 1Ph.D. Research Scholar (P.T), BSMED, Bharathiar University, Email: [email protected] 2Dr. K. Vivekanandan, Professor (Rtd.), BSMED, Bharathiar University,Email: [email protected] KeyWords Brand, Consumer Perception, Durabiity, Processed Cheese, Quality, Shape, Taste.
ABSTRACT The purpose of this study is to determine the consumer perception on preferred brand of processed cheese. Specifically, to investigate the perception towards the attractiveness, quality, taste, durability on preferred brand of processed cheese. Components like brand, shape, packaging material, weight, shop where consumers purchase processed cheese were also considered for finding the opinion differences among the consumers. Data were collected through questionnaire from 400 individuals. The study found a significant difference in consum-ers opinion on quality, taste of processed cheese among age category, income level, shape of cheese, packaging material, weight of cheese and shop where consumers purchased. It is observed that, there was a strong positive relationship between quality and taste of processed cheese for both male and female.
Introduction Cheese is a dairy product derived from milk and mostly made from Cow’s milk. It comprises mostly milk fat and protein. The milk
is coagulated by use of the enzyme rennet and the solids are separated and pressed in the final form. Cheese is valued for its port-ability. The word cheese comes from the Latin word caseus from which the modern word casein is derived. Many types of cheeses are produced in different countries all over the world.
Processed cheese is made with the ingredients of Cheese, emulsifiers, saturated vegetable oils, salt, food colourings, whey or sugar. The use of emulsifiers in processed cheese results in a product that melts without separating when cooked. Processed cheese is often sold in blocks, cubes, slices, shreds & spreads.
Branding of food products is being done by manufacturers and brand awareness of these food products in packed form is gaining more value both for the manufacturers and the consumers. For consumers, the value delivered is by means of varieties, ease of shopping, lesser work and time in cooking, longer shelf life etc. For manufacturers it is a value addition in the process of converting commodity into a branded product by processing and packing thereby enhancing their opportunity to get more margins on process-ing, packaging and creating a value for their brand.Cheese is one of the fast-emerging dairy products that is being used by consumers in India.
“The Indian cheese market is worth around Rs.1700 Crores but is expected to grow at roughly 15-20 percent annually. By industry estimates, the current household penetration in terms of cheese consumption is less than 7-8 percent. The per capita consumption of cheese in India is a mere 200gm per year in contrast to the global average of 7 kg per year. The average per capita consumption for urban India, however, is 700g per person per year. Geographically, the top six cities consume approximately 60 percent of all the cheese sold in India.”
The Indian organised Cheese market including its variants like Processed Cheese, Mozzarella Cheese spreads, Flavoured and Spiced Cheese is valued around Rs. 4.5 billion. Processed Cheese at 60% of overall market is Rs. 2.7 billion. The next most popular variant is Cheese spread claiming a share of around 30% of the total Processed Cheese Market. The market is primarily an urban
GSJ: Volume 8, Issue 3, March 2020 ISSN 2320-9186 2552
GSJ© 2020 www.globalscientificjournal.com
phenomenon and is known to be growing at around 15%. The market for Cheese Cubes, Slices and Tins is growing.
Literature Review
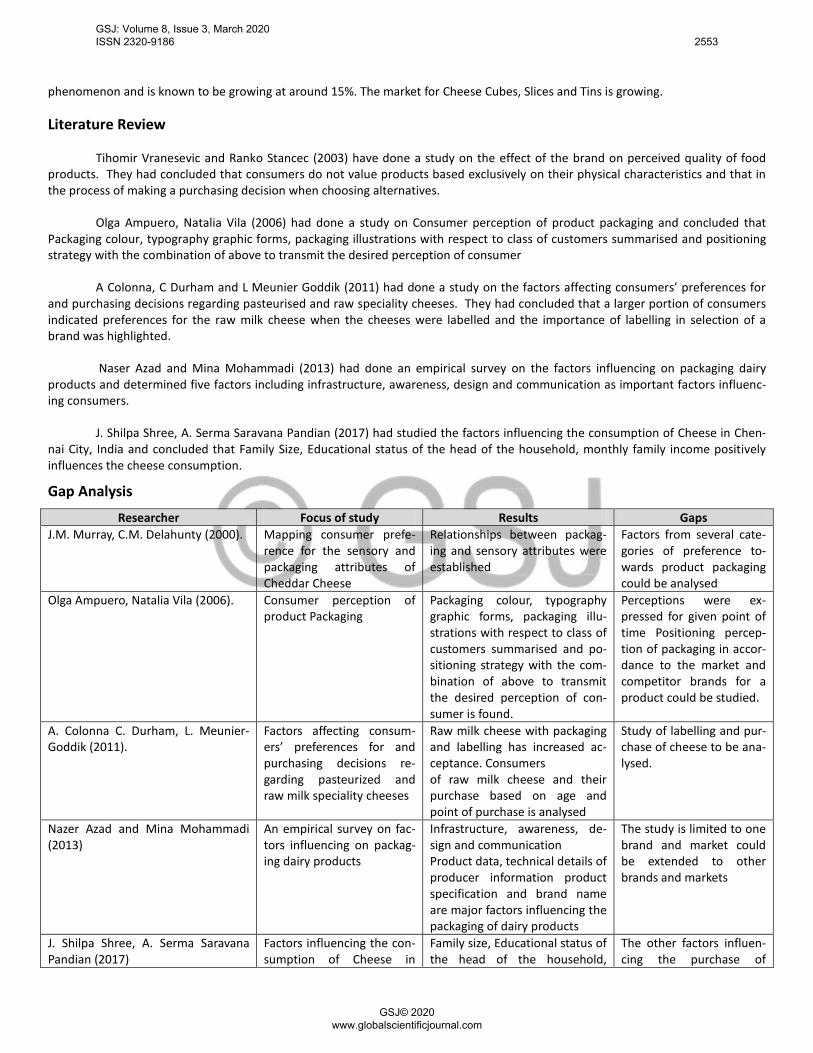
Tihomir Vranesevic and Ranko Stancec (2003) have done a study on the effect of the brand on perceived quality of food products. They had concluded that consumers do not value products based exclusively on their physical characteristics and that in the process of making a purchasing decision when choosing alternatives.
Olga Ampuero, Natalia Vila (2006) had done a study on Consumer perception of product packaging and concluded that Packaging colour, typography graphic forms, packaging illustrations with respect to class of customers summarised and positioning strategy with the combination of above to transmit the desired perception of consumer
A Colonna, C Durham and L Meunier Goddik (2011) had done a study on the factors affecting consumers’ preferences for and purchasing decisions regarding pasteurised and raw speciality cheeses. They had concluded that a larger portion of consumers indicated preferences for the raw milk cheese when the cheeses were labelled and the importance of labelling in selection of a brand was highlighted.
Naser Azad and Mina Mohammadi (2013) had done an empirical survey on the factors influencing on packaging dairy products and determined five factors including infrastructure, awareness, design and communication as important factors influenc-ing consumers.
J. Shilpa Shree, A. Serma Saravana Pandian (2017) had studied the factors influencing the consumption of Cheese in Chen-nai City, India and concluded that Family Size, Educational status of the head of the household, monthly family income positively influences the cheese consumption.
Gap Analysis
Researcher Focus of study Results Gaps J.M. Murray, C.M. Delahunty (2000). Mapping consumer prefe-
rence for the sensory and packaging attributes of Cheddar Cheese
Relationships between packag-ing and sensory attributes were established
Factors from several cate-gories of preference to-wards product packaging could be analysed
Olga Ampuero, Natalia Vila (2006). Consumer perception of product Packaging
Packaging colour, typography graphic forms, packaging illu-strations with respect to class of customers summarised and po-sitioning strategy with the com-bination of above to transmit the desired perception of con-sumer is found.
Perceptions were ex-pressed for given point of time Positioning percep-tion of packaging in accor-dance to the market and competitor brands for a product could be studied.
A. Colonna C. Durham, L. Meunier-Goddik (2011).
Factors affecting consum-ers’ preferences for and purchasing decisions re-garding pasteurized and raw milk speciality cheeses
Raw milk cheese with packaging and labelling has increased ac-ceptance. Consumers of raw milk cheese and their purchase based on age and point of purchase is analysed
Study of labelling and pur-chase of cheese to be ana-lysed.
Nazer Azad and Mina Mohammadi (2013)
An empirical survey on fac-tors influencing on packag-ing dairy products
Infrastructure, awareness, de-sign and communication Product data, technical details of producer information product specification and brand name are major factors influencing the packaging of dairy products
The study is limited to one brand and market could be extended to other brands and markets
J. Shilpa Shree, A. Serma Saravana Pandian (2017)
Factors influencing the con-sumption of Cheese in
Family size, Educational status of the head of the household,
The other factors influen-cing the purchase of
GSJ: Volume 8, Issue 3, March 2020 ISSN 2320-9186 2553
GSJ© 2020 www.globalscientificjournal.com

Chennai City, India. monthly family income positive-ly influences the cheese con-sumption
cheese could be studied
Objectives of the Study
• To study the demographic characteristics of the consumers. • To find the association between the demographic characteristics and the components of processed cheese. • To analyse the difference in opinion towards perception on preferred brand of processed cheese among consumers demo-
graphic (Age, Gender, Marital Status, Monthly Income, Education Qualification, Family Type) and components of processed cheese (Brand, Shape, Packaging Material, Weight, Shop of Purchase)
• To find the relationship among consumer perception of processed cheese: attractiveness, quality, taste, durability on pre-ferred brand.
Methodology
The data was collected from the residents of the corporation limits of Coimbatore in the 100 wards in 5 Zones. The total population in the 5 zones is 15.86 Lakhs. The percentage of population in each zone to the total population was taken and the pro-portionate number of samples in each zone to be collected were arrived.
Table A – Distribution of number of respondent’s zone wise
Zone Total Population (No. of People)
% of Total Population
No. of Respondents
North 319865 20.16 81 East 323019 20.36 81
West 327123 20.62 82 Central 309161 19.49 78
South 307422 19.38 78 Total 1586590 100.00 400
Source: Coimbatore Corporation, Draft Ward Delimitation The sample size as determined by the Krejcie Morgan table is 384 for a confidence level of 95%. The major streets in these
zones were listed and every 3rd street was taken and households in these zones were contacted and at least one house per street were covered until the consumer for branded processed cheese were met. Data Analysis
Table 1: Frequency Distribution for Demographic Characteristics of the Consumers
Variable Category Frequency Percent
Gender Male 188 47.0 Female 212 53.0
Age
<= 25 26 6.5 26 - 35 136 34.0 36 - 45 151 37.8 46+ 87 21.7
Marital Status Married 353 88.3 Un Married 47 11.7
Income
<= 25000 50 12.5 25001 - 40000 153 38.3 40001 - 55000 99 24.7 55001+ 98 24.5
Education Qualification HSC 50 12.5 UG 260 65.0 PG 90 22.5
Family Type Joint 165 41.3
GSJ: Volume 8, Issue 3, March 2020 ISSN 2320-9186 2554
GSJ© 2020 www.globalscientificjournal.com

Nuclear 235 58.7 (n=400)
The above table shows the frequency distribution of demographic characteristics of the consumers. Gender showed that, Female have the highest frequency value 212 (53%), while male have frequency value of 188 (47%). Among the age distribution of consumers, 72% (majority) of them are coming under the age category of 26 – 45 years. Majority (88%) of the consumers are mar-ried. Income category shows that 38.3 % of the consumers are earning between 25001-40000 per month. Coming to their educa-tional level, most of them (65%) have completed their undergraduate programme. Majority (59%) of the consumers are in Nuclear family.
Table 2: Frequency Distribution for Processed Cheese
Variable Category Frequency Percent
Brand
Amul 222 55.5 Britannia 43 10.8 Milky Mist 123 30.7 Go 12 3.0
Shape
Block 55 13.8 Cubes 186 46.5 Slices 119 29.7 Shredded 12 3.0 Spreads 28 7.0
Packaging Material
Aluminium Foil 59 14.7 Poly Pouches 115 28.7 Carton Boxes 150 37.5 Poly Rigid Container 49 12.3 Squeezable Poly Tubes 11 2.8 Tins 16 4.0
Weight
50 g 33 8.3 100 g 185 46.3 200 g 99 24.7 500 g 83 20.7
Shop
Modern Retail Store 85 21.3 Departmental Store 256 64.0 Grocery Shop 30 7.4 Dairy Store 29 7.3
The above table shows the frequency distribution for processed cheese regarding brand, shape preferred, type of packaging
material, weight preferred and the shop from which the cheese is purchased by the consumers. Table shows that, Amul is the brand of processed cheese preferred by majority (55.5%) of the consumers and the next preferred brand is Milky Mist which is preferred by 30.7 % of the consumers. Coming to the shape of the processed cheese, 76.2% of the consumers prefer the shape of the processed cheese to be in cubes and slices. Carton Boxes and Poly Pouches are the preferred packaging material by majority (66.2%) of the con-sumers. Majority (46.3%) of the consumers purchase processed cheese weighting 100gms. Around 85.3% of the consumers purchase processed cheese at departmental store and modern retail store.
Table 3: Association between demographic characteristics and components of processed cheese
Variables Pearson
Chi-Square Strength
of Association Value p Cramer's V Strength
Gender * Brand 3.728 .292 .097 Small Gender * Shape 13.745 .008 .185 Moderate Gender * Packaging Material 44.590 .000 .334 Moderately Strong Gender * Weight 11.206 .011 .167 Moderate Gender * Shop 12.048 .007 .174 Moderate Family Type * Weight 14.896 .013 .164 Moderate Family Type * Shop 10.780 .002 .193 Moderate
GSJ: Volume 8, Issue 3, March 2020 ISSN 2320-9186 2555
GSJ© 2020 www.globalscientificjournal.com
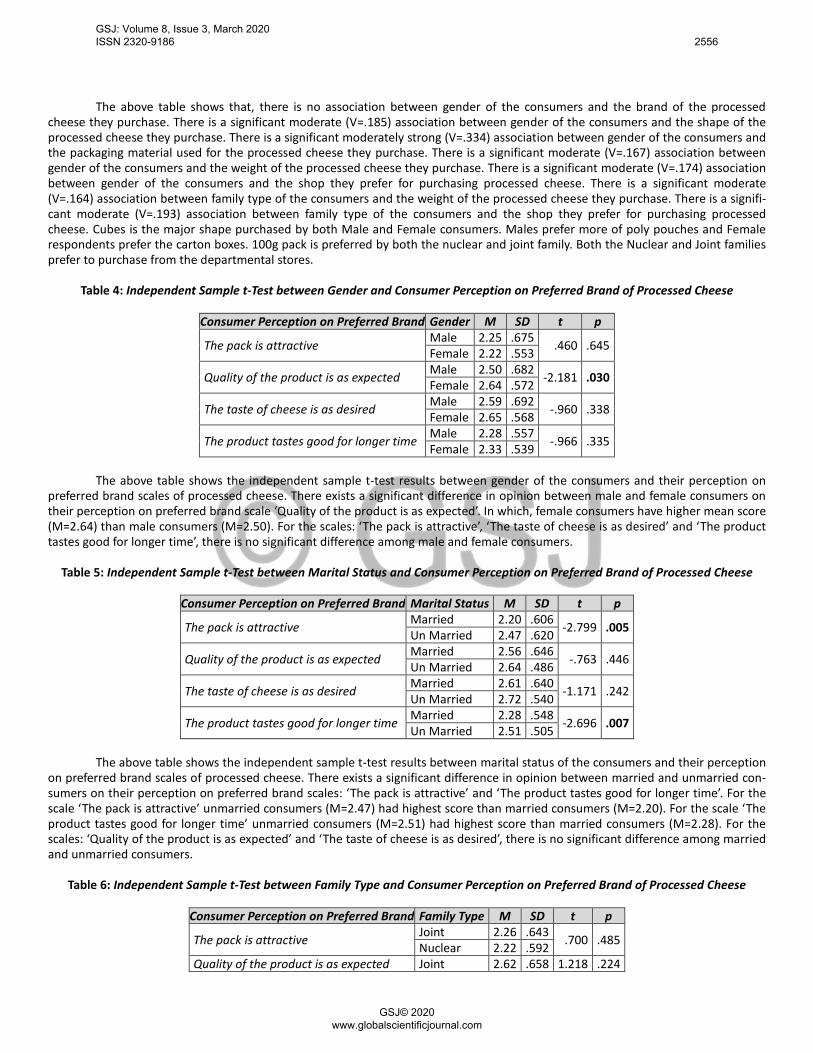
The above table shows that, there is no association between gender of the consumers and the brand of the processed
cheese they purchase. There is a significant moderate (V=.185) association between gender of the consumers and the shape of the processed cheese they purchase. There is a significant moderately strong (V=.334) association between gender of the consumers and the packaging material used for the processed cheese they purchase. There is a significant moderate (V=.167) association between gender of the consumers and the weight of the processed cheese they purchase. There is a significant moderate (V=.174) association between gender of the consumers and the shop they prefer for purchasing processed cheese. There is a significant moderate (V=.164) association between family type of the consumers and the weight of the processed cheese they purchase. There is a signifi-cant moderate (V=.193) association between family type of the consumers and the shop they prefer for purchasing processed cheese. Cubes is the major shape purchased by both Male and Female consumers. Males prefer more of poly pouches and Female respondents prefer the carton boxes. 100g pack is preferred by both the nuclear and joint family. Both the Nuclear and Joint families prefer to purchase from the departmental stores.
Table 4: Independent Sample t-Test between Gender and Consumer Perception on Preferred Brand of Processed Cheese
Consumer Perception on Preferred Brand Gender M SD t p
The pack is attractive Male 2.25 .675 .460 .645 Female 2.22 .553
Quality of the product is as expected Male 2.50 .682 -2.181 .030 Female 2.64 .572
The taste of cheese is as desired Male 2.59 .692 -.960 .338 Female 2.65 .568
The product tastes good for longer time Male 2.28 .557 -.966 .335 Female 2.33 .539 The above table shows the independent sample t-test results between gender of the consumers and their perception on
preferred brand scales of processed cheese. There exists a significant difference in opinion between male and female consumers on their perception on preferred brand scale ‘Quality of the product is as expected’. In which, female consumers have higher mean score (M=2.64) than male consumers (M=2.50). For the scales: ‘The pack is attractive’, ‘The taste of cheese is as desired’ and ‘The product tastes good for longer time’, there is no significant difference among male and female consumers.
Table 5: Independent Sample t-Test between Marital Status and Consumer Perception on Preferred Brand of Processed Cheese
Consumer Perception on Preferred Brand Marital Status M SD t p
The pack is attractive Married 2.20 .606 -2.799 .005 Un Married 2.47 .620
Quality of the product is as expected Married 2.56 .646 -.763 .446 Un Married 2.64 .486
The taste of cheese is as desired Married 2.61 .640 -1.171 .242 Un Married 2.72 .540
The product tastes good for longer time Married 2.28 .548 -2.696 .007 Un Married 2.51 .505 The above table shows the independent sample t-test results between marital status of the consumers and their perception
on preferred brand scales of processed cheese. There exists a significant difference in opinion between married and unmarried con-sumers on their perception on preferred brand scales: ‘The pack is attractive’ and ‘The product tastes good for longer time’. For the scale ‘The pack is attractive’ unmarried consumers (M=2.47) had highest score than married consumers (M=2.20). For the scale ‘The product tastes good for longer time’ unmarried consumers (M=2.51) had highest score than married consumers (M=2.28). For the scales: ‘Quality of the product is as expected’ and ‘The taste of cheese is as desired’, there is no significant difference among married and unmarried consumers.
Table 6: Independent Sample t-Test between Family Type and Consumer Perception on Preferred Brand of Processed Cheese
Consumer Perception on Preferred Brand Family Type M SD t p
The pack is attractive Joint 2.26 .643 .700 .485 Nuclear 2.22 .592 Quality of the product is as expected Joint 2.62 .658 1.218 .224
GSJ: Volume 8, Issue 3, March 2020 ISSN 2320-9186 2556
GSJ© 2020 www.globalscientificjournal.com
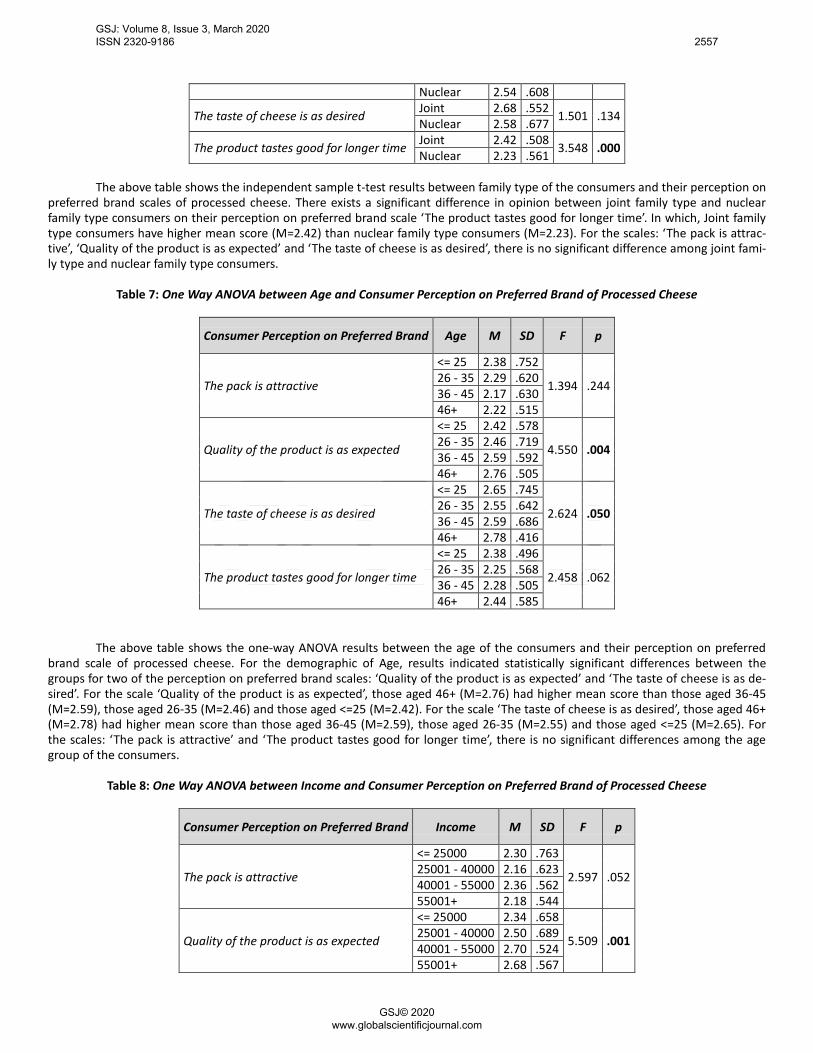
Nuclear 2.54 .608
The taste of cheese is as desired Joint 2.68 .552 1.501 .134 Nuclear 2.58 .677
The product tastes good for longer time Joint 2.42 .508 3.548 .000 Nuclear 2.23 .561 The above table shows the independent sample t-test results between family type of the consumers and their perception on
preferred brand scales of processed cheese. There exists a significant difference in opinion between joint family type and nuclear family type consumers on their perception on preferred brand scale ‘The product tastes good for longer time’. In which, Joint family type consumers have higher mean score (M=2.42) than nuclear family type consumers (M=2.23). For the scales: ‘The pack is attrac-tive’, ‘Quality of the product is as expected’ and ‘The taste of cheese is as desired’, there is no significant difference among joint fami-ly type and nuclear family type consumers.
Table 7: One Way ANOVA between Age and Consumer Perception on Preferred Brand of Processed Cheese
Consumer Perception on Preferred Brand Age M SD F p
The pack is attractive
<= 25 2.38 .752
1.394 .244 26 - 35 2.29 .620 36 - 45 2.17 .630 46+ 2.22 .515
Quality of the product is as expected
<= 25 2.42 .578
4.550 .004 26 - 35 2.46 .719 36 - 45 2.59 .592 46+ 2.76 .505
The taste of cheese is as desired
<= 25 2.65 .745
2.624 .050 26 - 35 2.55 .642 36 - 45 2.59 .686 46+ 2.78 .416
The product tastes good for longer time
<= 25 2.38 .496
2.458 .062 26 - 35 2.25 .568 36 - 45 2.28 .505 46+ 2.44 .585
The above table shows the one-way ANOVA results between the age of the consumers and their perception on preferred
brand scale of processed cheese. For the demographic of Age, results indicated statistically significant differences between the groups for two of the perception on preferred brand scales: ‘Quality of the product is as expected’ and ‘The taste of cheese is as de-sired’. For the scale ‘Quality of the product is as expected’, those aged 46+ (M=2.76) had higher mean score than those aged 36-45 (M=2.59), those aged 26-35 (M=2.46) and those aged <=25 (M=2.42). For the scale ‘The taste of cheese is as desired’, those aged 46+ (M=2.78) had higher mean score than those aged 36-45 (M=2.59), those aged 26-35 (M=2.55) and those aged <=25 (M=2.65). For the scales: ‘The pack is attractive’ and ‘The product tastes good for longer time’, there is no significant differences among the age group of the consumers.
Table 8: One Way ANOVA between Income and Consumer Perception on Preferred Brand of Processed Cheese
Consumer Perception on Preferred Brand Income M SD F p
The pack is attractive
<= 25000 2.30 .763
2.597 .052 25001 - 40000 2.16 .623 40001 - 55000 2.36 .562 55001+ 2.18 .544
Quality of the product is as expected
<= 25000 2.34 .658
5.509 .001 25001 - 40000 2.50 .689 40001 - 55000 2.70 .524 55001+ 2.68 .567
GSJ: Volume 8, Issue 3, March 2020 ISSN 2320-9186 2557
GSJ© 2020 www.globalscientificjournal.com

The taste of cheese is as desired
<= 25000 2.32 .844
7.747 .000 25001 - 40000 2.56 .687 40001 - 55000 2.72 .453 55001+ 2.79 .482
The product tastes good for longer time
<= 25000 2.36 .563
.229 .876 25001 - 40000 2.29 .534 40001 - 55000 2.31 .528 55001+ 2.32 .585
The above table shows the one-way ANOVA results between the income of the consumers and their perception on pre-
ferred brand scale of processed cheese. For the demographic of Income, results indicated statistically significant differences between the groups for two of the perception on preferred brand scales: ‘Quality of the product is as expected’ and ‘The taste of cheese is as desired’. For the scale ‘Quality of the product is as expected’, those earning between 40001-55000 (M=2.70) had higher mean score than those earning 55001+ (M=2.68), those earning 225001-40000 (M=2.50) and those earning <=25000 (M=2.34). For the scale ‘The taste of cheese is as desired’, those earning 55001+ (M=2.79) had higher mean score than those earning 40001-55000 (M=2.72), those earning 25001-40000 (M=2.56) and those earning <=25000 (M=2.32). For the scales: ‘The pack is attractive’ and ‘The product tastes good for longer time’, there is no significant differences among the income group of the consumers.
Table 9: One Way ANOVA between Education Qualification and Consumer Perception on Preferred Brand of Processed Cheese
Consumer Perception on Preferred Brand Education Qualification M SD F p
The pack is attractive HSC 2.10 .580
2.720 .067 UG 2.22 .618 PG 2.34 .603
Quality of the product is as expected HSC 2.66 .557
.589 .556 UG 2.57 .657 PG 2.54 .584
The taste of cheese is as desired HSC 2.58 .731
.686 .504 UG 2.61 .652 PG 2.69 .489
The product tastes good for longer time HSC 2.52 .580
4.399 .013 UG 2.29 .518 PG 2.26 .591
The above table shows the one-way ANOVA results between the education qualification of the consumers and their percep-
tion on preferred brand scales of processed cheese. For the demographic of Educational Qualification, results indicated statistically significant differences between the groups for one of the perceptions on preferred brand scales: ‘The taste of cheese is as desired’. For the scale ‘The taste of cheese is as desired’, those having education qualification of HSC (M=2.52) had higher mean score than those having education qualification of UG (M=2.29) and those having education qualification of PG (M=2.26). For the scales: ‘The pack is attractive’, ‘Quality of the product is as expected’ and ‘The taste of cheese is as desired’, there is no significant differences among the education qualification of the consumers.
Table 10: One Way ANOVA between Brand and Consumer Perception on Preferred Brand of Processed Cheese
Consumer Perception on Preferred Brand Brand M SD F p
The pack is attractive
Amul 2.18 .619
1.586 .192 Britannia 2.37 .578 Milky Mist 2.28 .594 Go 2.25 .754
Quality of the product is as expected Amul 2.59 .615 1.048 .371 Britannia 2.42 .587
GSJ: Volume 8, Issue 3, March 2020 ISSN 2320-9186 2558
GSJ© 2020 www.globalscientificjournal.com

Milky Mist 2.59 .651 Go 2.50 .798
The taste of cheese is as desired
Amul 2.63 .679
.093 .964 Britannia 2.58 .587 Milky Mist 2.63 .562 Go 2.58 .515
The product tastes good for longer time
Amul 2.25 .546
2.201 .087 Britannia 2.42 .499 Milky Mist 2.36 .560 Go 2.50 .522
The above table shows the one-way ANOVA results between the brand of the processed cheese purchased and their per-
ception on preferred brand scales of processed cheese. For the brand of processed cheese, results indicated no statistical significant differences between the groups of brand for any of the scales: ‘The pack is attractive’, ‘Quality of the product is as expected’, ‘The taste of cheese is as desired’ and ‘The product tastes good for longer time’.
Table 11: One Way ANOVA between Shape and Consumer Perception on Preferred Brand of Processed Cheese
Consumer Perception on Preferred Brand Shape M SD F p
The pack is attractive
Block 2.36 .557
2.319 .057 Cubes 2.20 .642 Slices 2.24 .592 Shredded 1.83 .577 Spreads 2.36 .559
Quality of the product is as expected
Block 2.84 .420
8.981 .000 Cubes 2.65 .512 Slices 2.48 .723 Shredded 2.25 .452 Spreads 2.11 .916
The taste of cheese is as desired
Block 2.76 .508
12.934 .000 Cubes 2.59 .636 Slices 2.80 .403 Shredded 2.17 .718 Spreads 2.00 .981
The product tastes good for longer time
Block 2.51 .573
7.080 .000 Cubes 2.37 .526 Slices 2.22 .523 Shredded 1.75 .622 Spreads 2.18 .476
The above table shows the one-way ANOVA results between the shape of the processed cheese preferred and their percep-
tion on preferred brand scales of processed cheese. For the shape of the processed cheese preferred, results indicated statistically significant differences between the groups for three of the perception on preferred brand scales: ‘Quality of the product is as ex-pected’, ‘The taste of cheese is as desired’ and ‘The product tastes good for longer time’. For the scale ‘Quality of the product is as expected’, those who prefer the shape as Block (M=2.84) had higher mean score than those who prefer the shape as Cubes (M=2.65), those who prefer the shape as Slices (M=2.48), those who prefer the shape as Shredded (M=2.25) and those who prefer the shape as Spreads (M=2.11). For the scale ‘The taste of cheese is as desired’, those who prefer the shape as Slices (M=2.80) had higher mean score than those who prefer the shape as Block (M=2.76), those who prefer the shape as Cubes (M=2.59), those who prefer the shape as Shredded (M=2.17) and those who prefer the shape as Spreads (M=2.00). For the scale ‘The product tastes good for longer time’, those who prefer the shape as Block (M=2.51) had higher mean score than those who prefer the shape as Cubes (M=2.37), those who prefer the shape as Slices (M=2.22), those who prefer the shape as Spreads (M=2.18) and those who prefer the shape as Shredded (M=1.75). For the scale ‘The pack is attractive’, there is no significant differences among the shape of the processed cheese.
GSJ: Volume 8, Issue 3, March 2020 ISSN 2320-9186 2559
GSJ© 2020 www.globalscientificjournal.com
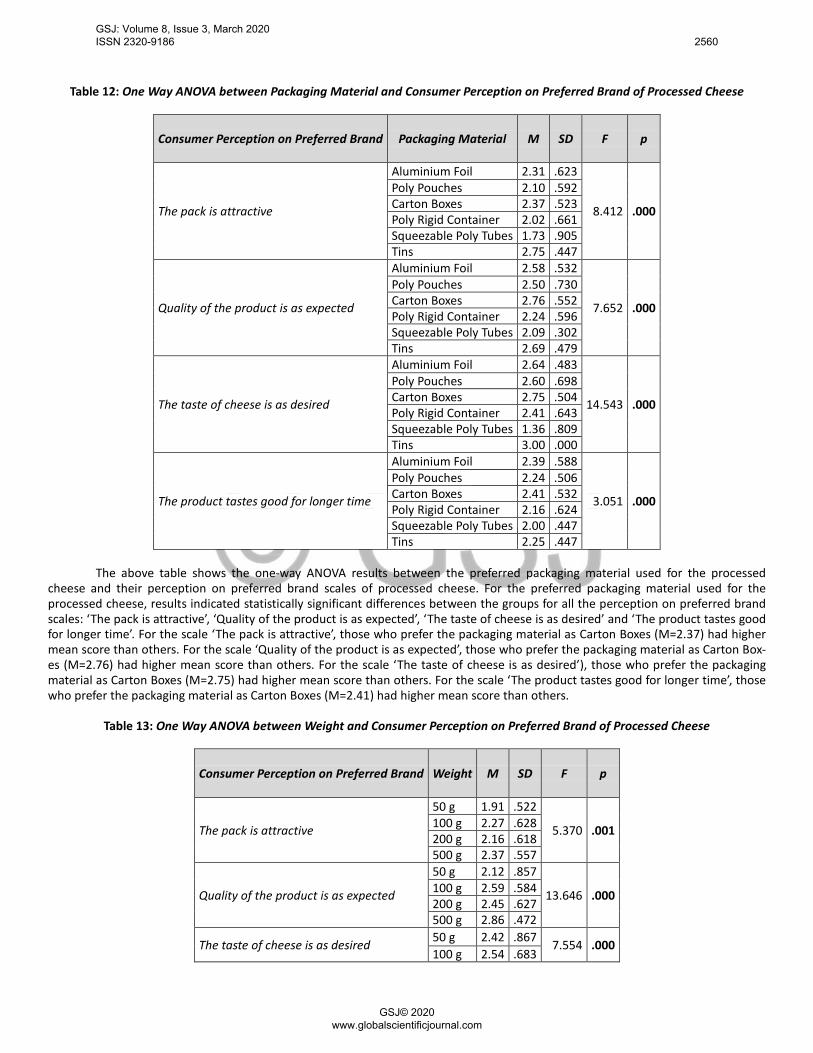
Table 12: One Way ANOVA between Packaging Material and Consumer Perception on Preferred Brand of Processed Cheese
Consumer Perception on Preferred Brand Packaging Material M SD F p
The pack is attractive
Aluminium Foil 2.31 .623
8.412 .000
Poly Pouches 2.10 .592 Carton Boxes 2.37 .523 Poly Rigid Container 2.02 .661 Squeezable Poly Tubes 1.73 .905 Tins 2.75 .447
Quality of the product is as expected
Aluminium Foil 2.58 .532
7.652 .000
Poly Pouches 2.50 .730 Carton Boxes 2.76 .552 Poly Rigid Container 2.24 .596 Squeezable Poly Tubes 2.09 .302 Tins 2.69 .479
The taste of cheese is as desired
Aluminium Foil 2.64 .483
14.543 .000
Poly Pouches 2.60 .698 Carton Boxes 2.75 .504 Poly Rigid Container 2.41 .643 Squeezable Poly Tubes 1.36 .809 Tins 3.00 .000
The product tastes good for longer time
Aluminium Foil 2.39 .588
3.051 .000
Poly Pouches 2.24 .506 Carton Boxes 2.41 .532 Poly Rigid Container 2.16 .624 Squeezable Poly Tubes 2.00 .447 Tins 2.25 .447
The above table shows the one-way ANOVA results between the preferred packaging material used for the processed
cheese and their perception on preferred brand scales of processed cheese. For the preferred packaging material used for the processed cheese, results indicated statistically significant differences between the groups for all the perception on preferred brand scales: ‘The pack is attractive’, ‘Quality of the product is as expected’, ‘The taste of cheese is as desired’ and ‘The product tastes good for longer time’. For the scale ‘The pack is attractive’, those who prefer the packaging material as Carton Boxes (M=2.37) had higher mean score than others. For the scale ‘Quality of the product is as expected’, those who prefer the packaging material as Carton Box-es (M=2.76) had higher mean score than others. For the scale ‘The taste of cheese is as desired’), those who prefer the packaging material as Carton Boxes (M=2.75) had higher mean score than others. For the scale ‘The product tastes good for longer time’, those who prefer the packaging material as Carton Boxes (M=2.41) had higher mean score than others.
Table 13: One Way ANOVA between Weight and Consumer Perception on Preferred Brand of Processed Cheese
Consumer Perception on Preferred Brand Weight M SD F p
The pack is attractive
50 g 1.91 .522
5.370 .001 100 g 2.27 .628 200 g 2.16 .618 500 g 2.37 .557
Quality of the product is as expected
50 g 2.12 .857
13.646 .000 100 g 2.59 .584 200 g 2.45 .627 500 g 2.86 .472
The taste of cheese is as desired 50 g 2.42 .867 7.554 .000 100 g 2.54 .683
GSJ: Volume 8, Issue 3, March 2020 ISSN 2320-9186 2560
GSJ© 2020 www.globalscientificjournal.com
200 g 2.62 .529 500 g 2.89 .383
The product tastes good for longer time
50 g 2.18 .635
1.450 .228 100 g 2.28 .539 200 g 2.38 .548 500 g 2.34 .524
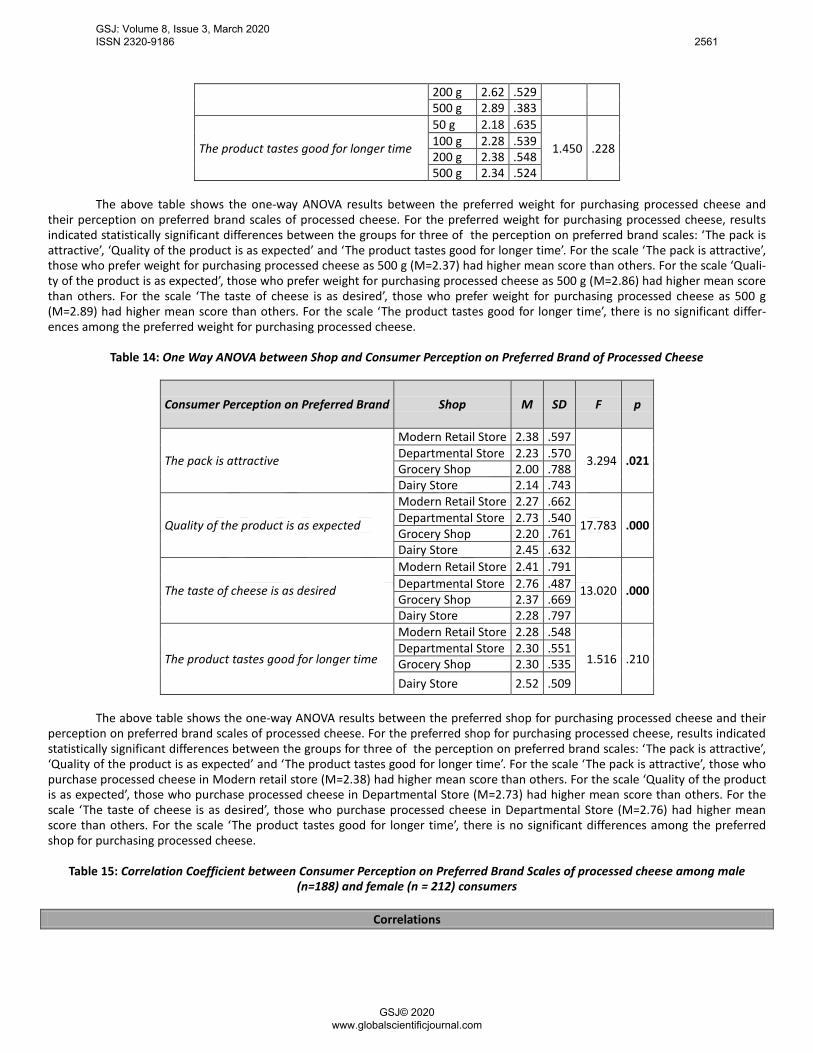
The above table shows the one-way ANOVA results between the preferred weight for purchasing processed cheese and
their perception on preferred brand scales of processed cheese. For the preferred weight for purchasing processed cheese, results indicated statistically significant differences between the groups for three of the perception on preferred brand scales: ‘The pack is attractive’, ‘Quality of the product is as expected’ and ‘The product tastes good for longer time’. For the scale ‘The pack is attractive’, those who prefer weight for purchasing processed cheese as 500 g (M=2.37) had higher mean score than others. For the scale ‘Quali-ty of the product is as expected’, those who prefer weight for purchasing processed cheese as 500 g (M=2.86) had higher mean score than others. For the scale ‘The taste of cheese is as desired’, those who prefer weight for purchasing processed cheese as 500 g (M=2.89) had higher mean score than others. For the scale ‘The product tastes good for longer time’, there is no significant differ-ences among the preferred weight for purchasing processed cheese.
Table 14: One Way ANOVA between Shop and Consumer Perception on Preferred Brand of Processed Cheese
Consumer Perception on Preferred Brand Shop M SD F p
The pack is attractive
Modern Retail Store 2.38 .597
3.294 .021 Departmental Store 2.23 .570 Grocery Shop 2.00 .788 Dairy Store 2.14 .743
Quality of the product is as expected
Modern Retail Store 2.27 .662
17.783 .000 Departmental Store 2.73 .540 Grocery Shop 2.20 .761 Dairy Store 2.45 .632
The taste of cheese is as desired
Modern Retail Store 2.41 .791
13.020 .000 Departmental Store 2.76 .487 Grocery Shop 2.37 .669 Dairy Store 2.28 .797
The product tastes good for longer time
Modern Retail Store 2.28 .548
1.516 .210 Departmental Store 2.30 .551 Grocery Shop 2.30 .535 Dairy Store 2.52 .509
The above table shows the one-way ANOVA results between the preferred shop for purchasing processed cheese and their
perception on preferred brand scales of processed cheese. For the preferred shop for purchasing processed cheese, results indicated statistically significant differences between the groups for three of the perception on preferred brand scales: ‘The pack is attractive’, ‘Quality of the product is as expected’ and ‘The product tastes good for longer time’. For the scale ‘The pack is attractive’, those who purchase processed cheese in Modern retail store (M=2.38) had higher mean score than others. For the scale ‘Quality of the product is as expected’, those who purchase processed cheese in Departmental Store (M=2.73) had higher mean score than others. For the scale ‘The taste of cheese is as desired’, those who purchase processed cheese in Departmental Store (M=2.76) had higher mean score than others. For the scale ‘The product tastes good for longer time’, there is no significant differences among the preferred shop for purchasing processed cheese.
Table 15: Correlation Coefficient between Consumer Perception on Preferred Brand Scales of processed cheese among male (n=188) and female (n = 212) consumers
Correlations
GSJ: Volume 8, Issue 3, March 2020 ISSN 2320-9186 2561
GSJ© 2020 www.globalscientificjournal.com
GENDER Consumer Perception on Preferred Brand Scales
The pack is attractive
Quality of the product is as
expected
The taste of cheese is as
desired
The product tastes good for
longer time
Male
The pack is attractive 1 .389** .461** -.060 Quality of the product is as expected .389** 1 .595** .303** The taste of cheese is as desired .461** .595** 1 .107 The product tastes good for longer time -.060 .303** .107 1
Female
The pack is attractive 1 .241** .277** .243** Quality of the product is as expected .241** 1 .643** .181** The taste of cheese is as desired .277** .643** 1 .229** The product tastes good for longer time .243** .181** .229** 1
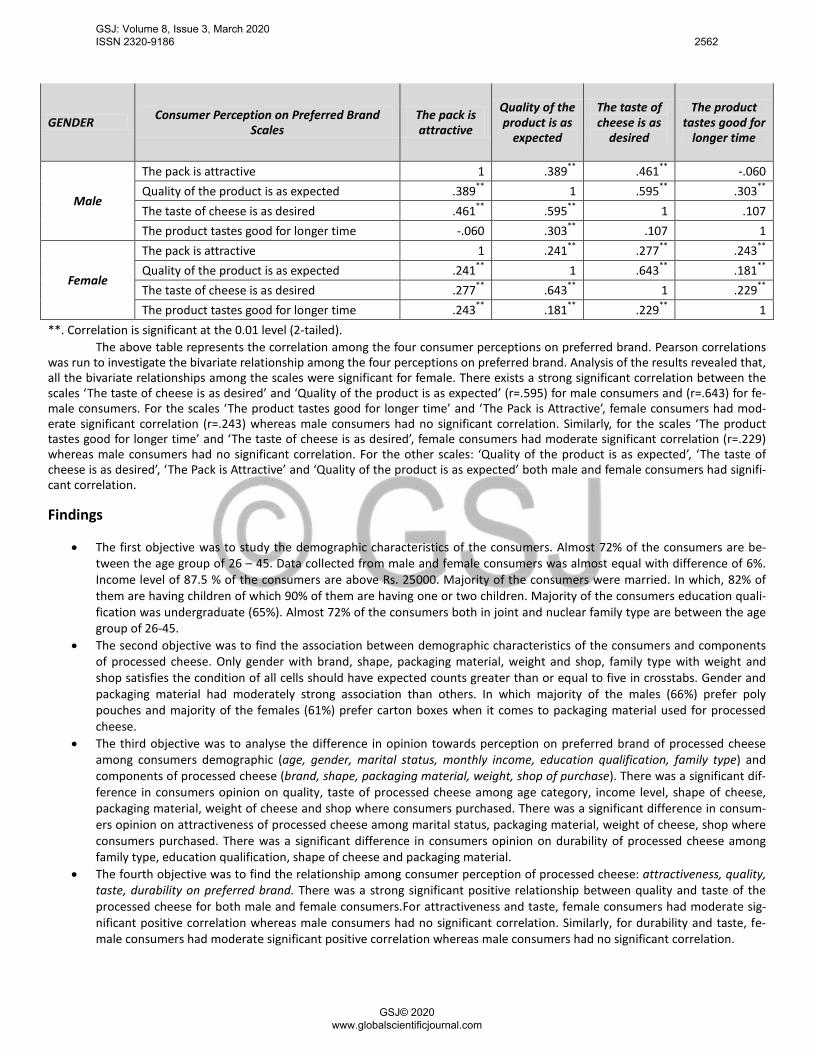
**. Correlation is significant at the 0.01 level (2-tailed). The above table represents the correlation among the four consumer perceptions on preferred brand. Pearson correlations
was run to investigate the bivariate relationship among the four perceptions on preferred brand. Analysis of the results revealed that, all the bivariate relationships among the scales were significant for female. There exists a strong significant correlation between the scales ‘The taste of cheese is as desired’ and ‘Quality of the product is as expected’ (r=.595) for male consumers and (r=.643) for fe-male consumers. For the scales ‘The product tastes good for longer time’ and ‘The Pack is Attractive’, female consumers had mod-erate significant correlation (r=.243) whereas male consumers had no significant correlation. Similarly, for the scales ‘The product tastes good for longer time’ and ‘The taste of cheese is as desired’, female consumers had moderate significant correlation (r=.229) whereas male consumers had no significant correlation. For the other scales: ‘Quality of the product is as expected’, ‘The taste of cheese is as desired’, ‘The Pack is Attractive’ and ‘Quality of the product is as expected’ both male and female consumers had signifi-cant correlation. Findings
• The first objective was to study the demographic characteristics of the consumers. Almost 72% of the consumers are be-tween the age group of 26 – 45. Data collected from male and female consumers was almost equal with difference of 6%. Income level of 87.5 % of the consumers are above Rs. 25000. Majority of the consumers were married. In which, 82% of them are having children of which 90% of them are having one or two children. Majority of the consumers education quali-fication was undergraduate (65%). Almost 72% of the consumers both in joint and nuclear family type are between the age group of 26-45.
• The second objective was to find the association between demographic characteristics of the consumers and components of processed cheese. Only gender with brand, shape, packaging material, weight and shop, family type with weight and shop satisfies the condition of all cells should have expected counts greater than or equal to five in crosstabs. Gender and packaging material had moderately strong association than others. In which majority of the males (66%) prefer poly pouches and majority of the females (61%) prefer carton boxes when it comes to packaging material used for processed cheese.
• The third objective was to analyse the difference in opinion towards perception on preferred brand of processed cheese among consumers demographic (age, gender, marital status, monthly income, education qualification, family type) and components of processed cheese (brand, shape, packaging material, weight, shop of purchase). There was a significant dif-ference in consumers opinion on quality, taste of processed cheese among age category, income level, shape of cheese, packaging material, weight of cheese and shop where consumers purchased. There was a significant difference in consum-ers opinion on attractiveness of processed cheese among marital status, packaging material, weight of cheese, shop where consumers purchased. There was a significant difference in consumers opinion on durability of processed cheese among family type, education qualification, shape of cheese and packaging material.
• The fourth objective was to find the relationship among consumer perception of processed cheese: attractiveness, quality, taste, durability on preferred brand. There was a strong significant positive relationship between quality and taste of the processed cheese for both male and female consumers.For attractiveness and taste, female consumers had moderate sig-nificant positive correlation whereas male consumers had no significant correlation. Similarly, for durability and taste, fe-male consumers had moderate significant positive correlation whereas male consumers had no significant correlation.
GSJ: Volume 8, Issue 3, March 2020 ISSN 2320-9186 2562
GSJ© 2020 www.globalscientificjournal.com

Suggestions • Departmental stores and Modern Retail stores are the purchase points of both male and female consumers and the retail-
ing of processed cheese to be maximised in these outlets. • The retention of quality and taste in the brand of processed cheese is preferred by both male and female consumers. Also,
both nuclear and joint families prefer the product to be good in the type of packaging chosen. Hence the packaging to be done such that the quality of the processed cheese is retained for longer time.
• The packaging of blocks and slices could be such that it is attractive, and the packaging should retain the quality and taste. These types of processed cheese to be in poly packs targeted towards male consumers and in carton boxes targeted to-wards the female consumers.
Conclusion Consumer perception is a marketing concept that incorporates a consumer’s impression, awareness and/or consciousness about the product offered. Due to the influence of several brands for a single product, marketers are trying to implement new strate-gies to sell their product in a competitive environment. This study took processed cheese as the product with aspects like brand, shape, weight, packaging material and shop where consumer purchase are considered. It is found that, packaging of processed cheese influences the consumer in their choice of preferred brand. In the aspect of shape, cubes are the majorly preferred by both male and female consumers. In the aspect of packaging material used for processed cheese, male consumers prefer poly pouches whereas female consumers prefer carton boxes. In the aspect of weight, majority of the consumer prefer to buy 100gms pack, those consumers buying 500gms pack prefer attractiveness and taste. Most of the male and female consumers buy processed cheese at departmental stores and modern retail stores. Consumers buying in modern retail store looks for attractiveness whereas consumers buying in departmental stores looks for quality and taste. Married consumers prefer taste whereas unmarried consumers prefer quality. Consumers in both joint and nuclear family prefer taste. Consumers earning between 40001-55000 prefer quality. This study reveals the consumers preference related to the attributes like attractiveness, quality, taste and durability on preferred brand of processed cheese in Coimbatore. The study suggested that a marketer should analyse different factors that influence the consumers perception on selecting their preferred brand of products.
References [1] Ampuero, Olga, and Natalia Vila. "Consumer perceptions of product packaging." Journal of Consumer Marketing, vol. 23, no. 2, 2006, pp. 100-112. [2] Azad, Naser, and Mina Mohammadi. "An empirical survey on factors influencing on packaging dairy products." Management Science Letters, vol.
3, no. 7, 2013, pp. 1901-1906. [3] Colonna, A., et al. "Factors affecting consumers’ preferences for and purchasing decisions regarding pasteurized and raw milk specialty cheeses."
Journal of Dairy Science, vol. 94, no. 10, 2011, pp. 5217-5226. [4] Drake, S.L., et al. "Comparison of two methods to explore consumer preferences for cottage cheese." Journal of Dairy Science, vol. 92, no. 12, 2009,
pp. 5883-5897. [5] Eldesouky, Ali, and Francisco Mesias. "An insight into the influence of packaging and presentation format on consumer purchasing attitudes to-
wards cheese: a qualitative study." Spanish Journal of Agricultural Research, vol. 12, no. 2, 2014, p. 305. [6] Gaafar Mohamed A., and Ra'id Suleman AL-Hrezat. "The Role of Packaging in Consumer's Perception of Product Quality at the Point of Purchase."
European Journal of Business and Management, vol. 5, no. 4, 2013, pp. 69-82. [7] Murray, J.M, and C.M Delahunty. "Mapping consumer preference for the sensory and packaging attributes of Cheddar cheese." Food Quality and
Preference, vol. 11, no. 5, 2000, pp. 419-435. [8] Orth, Ulrich R., and Keven Malkewitz. "Holistic Package Design and Consumer Brand Impressions." Journal of Marketing, vol. 72, no. 3, 2008, pp.
64-81. [9] Rokka, Joonas, and LiisaUusitalo. "Preference for green packaging in consumer product choices - Do consumers care?" International Journal of
Consumer Studies, vol. 32, no. 5, 2008, pp. 516-525. [10] Shilpashree J., and Serma Saravana Pandian A. "Factors influencing the consumption of cheese in Chennai city, India." International Journal of
Science,Environment and Technology, vol. 6, no. 1, 2017, pp. 399-403. [11] Vraneševic´, Tihomir, and Ranko Stančec. "The effect of the brand on perceived quality of food products." British Food Journal, vol. 105, no. 11,
2003, pp. 811-825. [12] Zepeda, Lydia, et al. "A conceptual framework for analyzing consumers' food label preferences: An exploratory study of sustainability labels in
France, Quebec, Spain and the US." International Journal of Consumer Studies, vol. 37, no. 6, 2013, pp. 605-616.
GSJ: Volume 8, Issue 3, March 2020 ISSN 2320-9186 2563
GSJ© 2020 www.globalscientificjournal.com