a construction waste generation model for developing countries · a construction waste generation...
TRANSCRIPT
A construction waste generation model for developingcountriesCitation for published version (APA):Abarca Guerrero, L. (2014). A construction waste generation model for developing countries Eindhoven:Technische Universiteit Eindhoven DOI: 10.6100/IR770952
DOI:10.6100/IR770952
Document status and date:Published: 01/01/2014
Document Version:Publisher’s PDF, also known as Version of Record (includes final page, issue and volume numbers)
Please check the document version of this publication:
• A submitted manuscript is the version of the article upon submission and before peer-review. There can beimportant differences between the submitted version and the official published version of record. Peopleinterested in the research are advised to contact the author for the final version of the publication, or visit theDOI to the publisher's website.• The final author version and the galley proof are versions of the publication after peer review.• The final published version features the final layout of the paper including the volume, issue and pagenumbers.Link to publication
General rightsCopyright and moral rights for the publications made accessible in the public portal are retained by the authors and/or other copyright ownersand it is a condition of accessing publications that users recognise and abide by the legal requirements associated with these rights.
• Users may download and print one copy of any publication from the public portal for the purpose of private study or research. • You may not further distribute the material or use it for any profit-making activity or commercial gain • You may freely distribute the URL identifying the publication in the public portal.
If the publication is distributed under the terms of Article 25fa of the Dutch Copyright Act, indicated by the “Taverne” license above, pleasefollow below link for the End User Agreement:
www.tue.nl/taverne
Take down policyIf you believe that this document breaches copyright please contact us at:
providing details and we will investigate your claim.
Download date: 25. Feb. 2019
1
A Construction Waste Generation Model for Developing Countries
PROEFSCHRIFT
ter verkrijging van de graad van doctor aan de Technische Universiteit Eindhoven, op gezag van de rector magnificus, prof.dr.ir. C.J. van Duijn,
voor een commissie aangewezen door het College voor Promoties, in het openbaar te verdedigen op maandag 24 maart 2014 om 16.00 uur
door
Lilliana Abarca-Guerrero
geboren te San José, Costa Rica
2
Dit proefschrift is goedgekeurd door de promotoren en de samenstelling van de promotiecommissie is als volgt:
Voorzitter: prof.ir. E.S.M. Nelissen1e promotor: prof.ir. G.J. MaasCopromotor: dr.ir. A.J.D. LambertLeden: prof.dr. W. Hogland (Linnaeus University) prof.dr. G. Ofori (NUS) prof.dr.ir. J.J.N. Lichtenberg prof.dr. F. Roa (Costa Rica Institute of Technology) prof.dr.ir. M. Haas (TUD)
Reserve: prof.dr.ir. J.I.M. Halman (UT)
3
PREFACE
I always say I am the product of inherent genes and my surrounding environment. This means that many people, places, situations and actions have helped to build up who I am. This PhD thesis records a rollercoaster path. This has been an awesome journey, feeling sometimes at the edge of despair but sending me every now and then to the sweet side of success.
I started my PhD thanks to my colleagues and friends from the Costa Rica Insti-tute of Technology, who gave me the opportunity to study in the Netherlands while keeping my position at the university. A special thanks to both directors that gave me this chance: Walter and Floria.
In this path I met many people who through their knowledge and support have helped me to present this piece of work to all of you. First, Emilia van Egmond was instrumental by introducing me to Prof. F. Scheublin whom accepted me in his re-search group. There I had the opportunity to meet with two important colleagues: William and Tobias (deceased) who extended their warm hands in moments of need. Also in the first years Ana Pereira, Ljiljana Rodic, Annelies Balkema, Bertus v. Heu-gten and Jetske B. were angels in my anguish moments.
In 2009 I moved to the PEBE research group thanks to Prof. Annelies van Bronswijk and Prof. Ger Maas. Chapter 2 of this thesis is mainly inspired by Annelies. Hand-held by Ger, I greatly benefited from his patient, persistent, critical and detailed re-flections. Ger, you have been essential in my personal development as a researcher, inspiring me always with your wisdom and positive words, ETERNALLY thankful. I would also like to express thanks to Fred Lambert for his unrestricted support, knowledge, critical comments and visions during our discussions. I am grateful to my PEBE gang that made possible my fruitful, kind of smooth and joyful PhD life. Bert, Jules, Cor, Paul, Gaby, Michiel, Remy, Frans, Ruben and my dear Wim, with whom I enjoyed the mission to Sierra Leone. THANKS for EVERYTHING, my dear colleagues.
A word of appreciation goes out to the members of the defense committee: for your cooperation, the time you spent reading this thesis and for your helpful feedback. To Samantha for improving the language, L. Osinski for support on database and the graphic designers of KREAIDEAS.
Angels and supporters popped up at crucial moments: Ana Lorena Arias provided me with two students: Francisco Troyo and Jose David Leiva who helped to collect data for chapters 4 and 5. Freddy Bolaños with his continuing support with informa-tion and prompt answers to my queries about the Costa Rican construction sector.
4
Also Ana Grettel Leandro and Hijmen van Twillert who were responsible for impor-tant inputs at the beginning of my research.My work at WASTE gave me the opportunity to travel to so many countries, work with so many incredible partner organizations and people. We learned together about the challenges in waste management systems in developing countries. Chap-ter 2 is a co-creation between me and all those participants in my workshops, train-ings, seminars and other means of data and information sharing. Thank you for all the long hours of fruitful work. My colleagues at WASTE are an important group for my accomplishment of this thesis. They were comprehensive, patient and sup-portive with positive words in moments of hopelessness. My dear Arnold that just by his presence provided me with so much inspiration. Verele, Niels, Stan, Gert, Ger, Tatiana, Mireille, Karin B., Helma, Ivo, Justine, Roza, Sophie, Ingrid, Valentin, Jacqueline, Kiwako, Anne, Jan, Kim, and others not with us anymore. Also gratitude to my colleagues at the WASH Alliance Elbrich, Annelies, Basja, Jurrie, Sara, Dipok, Fauzia, Mr. Islam, Indira and Kalawati.
It is said that when you have friends who needs a psychologist? And that is what a big group of friends in Costa Rica and throughout the world have been for me. THANKS, Jo, Victoria Ch., Eli C., Victoria H., Cecilia B., Tere F., Ana Isabel C., Xio-ma, Xinia, Michelle, Fernando, Marisela, Rolando F, Sonia V, Victor Hugo, Cristina, Sandra R., Marta J, tia Alba, friends from ACEPESA, Rinske, Martine, Christa, Jo-han, Antonette, Adrian, Niki, Evelyn, Jacques, Heleen v.d. H, Ina, Loes, Niko, Tere, Çigdem, Heinz, Annie, Glenn, Karen and Luis.
I also have my gratitude to my family in NL: Marcella (1948-2007), tante Annie, Charlotte, Roel, Sanne, Ananda, Mythra, John, Sterre, Lydia, Berith, Andrea and Irca.
I thank my family for their unrestrictive love and support. The generous love of my parents and example provided during all these years of my life. My sister Kathya and brother Gustavo for the long distance support. THANK YOU for making my life easier. Jorge who helped me with his talent as a Civil Engineer and Jenny for all the nice moments we have spent together.
I don’t have words of appreciation for the love and care provided by Myrtille during all these years in which we have celebrated together the good and the bad, THANK YOU for standing next to me. I want to thank Andres for his support, companion-ship and understanding during his life with this crazy mother. Finally, a big kiss to Julian and Olivier, my twin 3 year old sons, for their love and for making my life so joyful always but specially, in the moments in which I needed it the most.
Lilliana Abarca-Guerrero
Utrecht, March 2014

5
To my mother and the memory of my father, from where my journey began.

6
A catalogue record is available from the Eindhoven University of Technology LibraryISBN: 978-90-386-3585-9Lay-out by Dirk van den Ende and Grefo PrepressCover design by KREAIDEAS, Costa RicaProof reading and grammar check: Samantha ConstanceBased on: Seppo Leinonen, Basis NEC 80486 and Wuppertal InstitutePrinted by the Eindhoven University Press, Eindhoven, the NetherlandsPublished as issue 188 in de Bouwstenen series of the Faculty of the Built Environment of the Eindhoven University of TechnologyLilliana Abarca-Guerrero, 2014All rights reserved. No part of this document may be photocopied, reproduced, stored, in a retrieval system, or transmitted, in any form or by any means whether, electronic, mechanical, or otherwise without the prior written permission of the author.
7
TABLE OF CONTENTS
CHAPTER 1
INTRODUCTION 111.1 Background 131.2 Motivation 131.3 Research Aim 161.4 Research approach and thesis structure 19References 22
CHAPTER 2
WASTE MANAGEMENT IN DEVELOPING COUNTRIES 252.1 Introduction 272.2 Theoretical framework 292.3 Waste management in developing countries 302.4 Research methodology 332.5 Results and discussion 36
Stakeholders 36 Generation and separation 37 Collection, transfer and transport 40 Treatment 43 Final disposal 44 Recycling 45
2.6 Summary of factors affecting performance of SWM systems 452.7 Conclusions 48References 50
CHAPTER 3
CONCEPTUAL FRAMEWORK 553.1 Introduction 573.2 Construction industry in developing countries 583.3 Industrial Productive Efficiency Models 603.4 Modeling method 623.5 Construction waste generation model 63
Materials 64 Energy 65 Labor 67 Barriers and motivators for environmental building practices 67 Design and management 70 Residual products 73 Residual energy 74 Product 74
8
3.6 Conclusions 75References 76
CHAPTER 4
CONSTRUCTION SECTOR IN COSTA RICA 834.1 Introduction 854.2 Construction in Costa Rica 864.3 Research methodology 884.4 Results and discussion 934.5 Conclusions 108References 110
CHAPTER 5
CASE STUDY IN COSTA RICA 1155.1 Introduction 1175.2 Literature review 1185.3 Research methodology 1245.4 Results and discussion 1285.5 Conclusions 140References 142
CHAPTER 6
CONCLUSIONS AND RECOMMENDATIONS 1456.1 Introduction 1476.2 Conclusions 1486.3 Discussion 1566.4 Research contributions 1586.5 Societal relevance 1596.6 Recommendations 160
SUMMARY 199
RESUMEN 203
SAMENVATTING 207
CURRICULUM VITAE 211
9
LIST OF TABLESTable 1.1: Percentage of waste that corresponds to construction activities at different landfill sites 14Table 2.1: Some characteristics of countries and areas visited 37Table 2.2: Spearman correlation of household separation and city parameters 38Table 2.3: Principle Component Analysis of household separation and their related city factors 40Table 2.4: Spearman correlation of collection, transport and transfer and city parameters 41Table 2.5: Principle Component Analysis of collection, transfer and transport 42Table 2.6: Spearman correlation of waste treatment and city parameters 43Table 2.7: Spearman correlation of disposal and city parameters 44Table 2.8: Spearman correlation matrix of recyclables collection and city parameters 45Table 3.1: Gross Energy Requirement values for different construction materials 66Table 4.1: Company size by category 93Table 4.2: Most important materials used in the construction sector in Costa Rica 94Table 4.3: Gross Energy Requirement values for the most important materials used in the construction sector in Costa Rica 95Table 4.4: Overall level of highest complete education 95Table 4.5: Barriers to implementing construction waste reduction practices in Costa Rica 97Table 4.6: Motivators to implementing construction waste reduction practices in Costa Rica 97Table 4.7: Barriers to implementing construction waste reduction practices 98Table 4.8: Motivators to implementing construction waste reduction practices 99Table 4.9: Waste generation influencing attributes 101Table 4.10: Waste generation per project 102Table 4.11: Use of waste plan and/or waste manager 103Table 4.12: Causes of construction waste 106Table 5.1: Summary of approaches to analyze quantities of construction waste 119Table 5.2: Summary of some previous studies on Waste Generation Rates 121Table 5.3: Amount of materials required for the construction of a semi-detached houses project 129Table 5.4: Amount of construction waste generated during the realization of the foundation, structure and roof of a semi-detached houses project 130Table 5.5: Percentage of required material converted into waste 132Table 5.6: Residual Gross Energy Requirement values for different waste materials 133
LIST OF PICTURESPicture 5.1: Scale for weighing construction waste 127Picture 5.2: Collection of stony materials 129Picture 5.3: Wood waste scattered in the construction site 129Picture 5.4: Concrete electric mixer used 132Picture 5.5: Broken and off-cuts of blocks 135Picture 5.6: Steel wood and mortar as waste 135
10
LIST OF FIGURESFigure 1.1: Schematic diagram of the thesis 21Figure 2.1: The Integrated Sustainable Waste Management Model 29Figure 2.2: Factors influencing the elements of waste management systems 46Figure 2.3: Factors influencing the aspects of waste management systems 47Figure 3.1: Construction waste generation model 64Figure 4.1: Type of constructions built (m2) in Costa Rica in 2012 86Figure 4.2: Total square meters built in Costa Rica during the period 2008-2012 87Figure 4.3: Waste streams reported by responding companies 102Figure 5.1: Basic waste flow symbols 123Figure 5.2: Symbols used for representing various waste facilitators 124Figure 5.3: Schematic of the semi-detached houses project 126Figure 5.4: Percentage (by weight) of materials utilized while constructing the foundation, structure and roof 128Figure 5.5: Total waste amount generated during the observation period (kg/week) 130Figure 5.6: Percentage (by weight) of waste materials produced during the analyzed phases 131Figure 5.7: Quantity (kg) of waste materials produced during the analyzed weeks 131Figure 5.8: Mapping of waste management practices for a semi-detached houses project 138Figure 5.9: Waste management mapping diagram 139
APPENDIXAppendix 2.1 164
Categories of waste Appendix 2.2 165
Waste streamsAppendix 2.3 166
Stakeholder exerciseAppendix 2.4 167
Characterization of waste management practices Appendix 3.1 172
Barriers to implementing environmental building practices for construction waste reduction
Appendix 3.2 173Motivators to environmental building practices for construction waste reduction
Appendix 4.1 174Quick assessment of construction sector in Costa Rica
Appendix 4.2 180Questionnaire for contractors and practitioners
Appendix 4.3 182Quick assessment of construction sector
Appendix 5.1 189Checklist with attributes during planning, execution and controlling of a construction project
Appendix 5.2 191Results of checklist application
Appendix 5.3 196Energy loss analysis due to equipment
Appendix 6.1 197Complete construction waste generation model
11
I N T R O D U C T I O N
Chapter 1Introduction
12
C H A P T E R 1
“The responsibility of every human being is to preserve the natural environment that has been lent by our parents and that we are borrowing from the future generations” (WCED, 1987). And this is the driving force to fulfill this task, the dream of developing new ideas that provide an insight to improve the footprints that we leave behind while participating in
the voyage of life.
13
I N T R O D U C T I O N
1. Introduction
1.1 BackgroundAfter the work of the World Commission on Environment and Development (WCED) and their report Our Common Future, better known as the Brundtland Commission Report in 1987, efforts have been made in order to shape the sustain-able development concept. In essence, it makes us aware of the responsibility we have for the resources acquired from our ancestors, and that we must manage in an efficient way so that future generations are able to meet their own needs. It is a concept, which has a relationship among three broad themes: social, economic and environmental factors.
Modern societies rely on the extraction and metabolism of large quantities of re-sources including energy, in order to support a world of continuing population growth, urbanization, social and economic development (Brunner, 2007). Large vol-umes and quantities of waste are produced and in general local governments in developing countries are responsible for its management facing problems which are beyond their ability to resolve (Sujauddin, 2008).
This chapter discusses the choices made for this study: municipal waste manage-ment and construction waste generation. It also introduces the research objectives, questions, hypothesis as well as the methods for data collection. Further, it outlines the entire structure of the thesis.
1.2 MotivationIncreasing population levels, booming economy, rapid urbanization and the rise in community living standards have greatly accelerated the municipal solid waste generation (Minghua et al., 2009). In developing countries1, the waste produced by burgeoning cities is overwhelming local authorities and national governments (Marshall and Farahbakhsh, 2013). Managing waste is a complex task that requires cooperation between a wide range of stakeholders (Zarate et al., 2008).
In developing countries, solid waste management systems have failed, firstly, for the lack of real stakeholder involvement in decision making and planning process-es. Their participation is particularly important for understanding the constantly
1 The term developed country or developed economy is used to describe countries that have a high level of development according to some criteria. Economic criteria have dominated discussions e.g. income per capita or level of industrialization. More recently another measure, the Human Development Index (HDI), which combines an economic measure, national income, with other measures, indices for life expectancy and education has become prominent. Countries not fitting such definitions are classified as developing countries and some also called emerging economies (www.princeton.edu/).
14
C H A P T E R 1
changing relationships among governance, decision-making power, and eco-social system dynamics (Marshall and Farahbakhsh, 2013). Secondly, for the lack of under-standing that the system is composed of different steps in which the flow of mate-rials go from the generation point towards collection, transport, transfer, treatment and final disposal. The waste can also be collected for reuse, recycling or energy recovery. Thirdly, recognizing that there are external factors influencing the system such as financial, institutional, environmental, technical, socio-cultural and legal (WASTE, 2004).
Developing countries lack reliable and sufficient data for the development of solid waste management systems. Cities are characterized by poor information, inade-quate and inaccurate data and difficulties obtaining real figures on their waste sit-uation (Shekdar, 2009). The reasons for this are multiple, such as: reduced funding, shortage of skilled personnel, priorities to be solved, lack of interest by the local au-thorities, and alike (Marshall and Farahbakhsh, 2013). This study is unique because these limitations are overcome by the author of this thesis collecting both data and information on-site. Additionally, observing the cultures allowing her to understand the difficulties facing authorities to improve the waste management service.
With all these experiences and data collected by the author of this thesis in 26 years of work in waste management in developing countries, she considers having suffi-cient information that can provide enough evidence of influencing factors affecting waste management systems in developing countries.
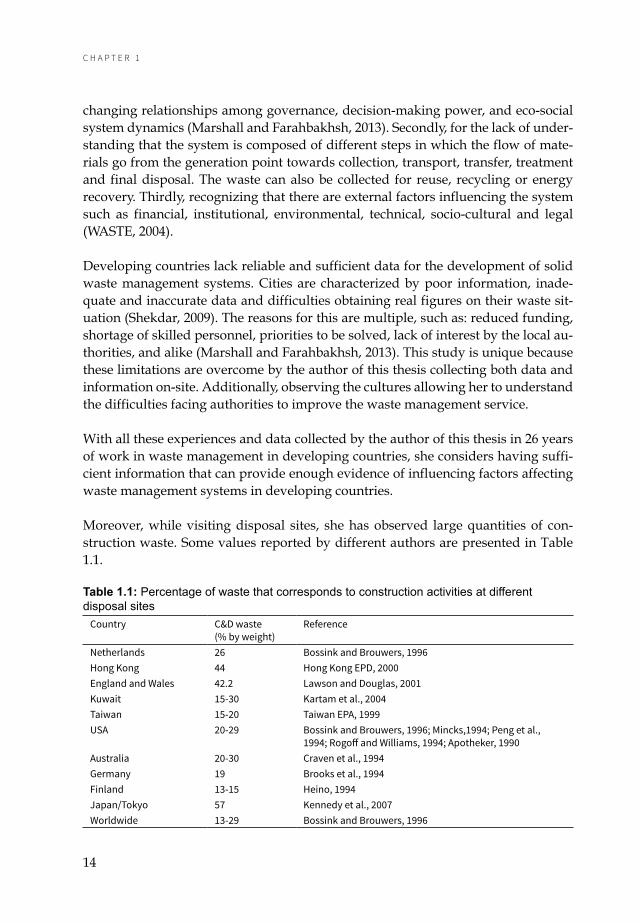
Moreover, while visiting disposal sites, she has observed large quantities of con-struction waste. Some values reported by different authors are presented in Table 1.1.
Table 1.1: Percentage of waste that corresponds to construction activities at different disposal sites
Country C&D waste(% by weight)
Reference
Netherlands 26 Bossink and Brouwers, 1996 Hong Kong 44 Hong Kong EPD, 2000 England and Wales 42.2 Lawson and Douglas, 2001Kuwait 15-30 Kartam et al., 2004 Taiwan 15-20 Taiwan EPA, 1999USA 20-29 Bossink and Brouwers, 1996; Mincks,1994; Peng et al.,
1994; Rogoff and Williams, 1994; Apotheker, 1990 Australia 20-30 Craven et al., 1994 Germany 19 Brooks et al., 1994 Finland 13-15 Heino, 1994 Japan/Tokyo 57 Kennedy et al., 2007Worldwide 13-29 Bossink and Brouwers, 1996
15
I N T R O D U C T I O N
The 20th century witnessed unparalleled increase in infrastructural investments such as housing projects, highways, dams, power plants, pipelines, and railways, among others (Horvath, 2004) as a direct result of the development of Portland cement by J. Aspdin in 1824 and the patent obtained J. Monier in 1867 on the use of imbedded metal (usually steel) in concrete called ferro-concrete or reinforced concrete (Bellis, 2013).
Worldwide the construction and operation of the built environment is estimated to account for high quantities of construction waste, giving as a result materials and energy losses that can impact the resource availability to future generations and environmental loadings (Brunner, 2007). This situation has made the industry look for new solutions. One of these is the pursuit for ecology-friendly environments, encompassing waste reduction strategies which require a detailed understanding of construction waste generation causes (Gavilan, 1994).
Some researchers indicate that the construction industry faces barriers that block them from fabricating structures with less production of waste (Yuan et al., 2011). Others mention that motivators are the most important drivers for waste reduction in the construction sector (Teo and Loosemore, 2001). Skoyles (1987) also points to design and management as two main sources of waste generation or misuse of con-struction materials.
Yuan and Shen (2011) state that developed economies have contributed significant-ly to the progress of research in construction waste management disciplines. Some developing countries such as Malaysia and China have also made good efforts in promoting research in this field. They conclude that for developing countries there are, among others, two major topics to be studied: investigation of the amount of construction waste and benchmarking different waste management performance using “waste generation rates”. According to the authors, the first topic provides fundamental data enabling the public to realize the real situation of construction waste generation and the relation with its causes. The second serves as valuable quantitative information for benchmarking different construction waste manage-ment practices.
16
C H A P T E R 1
1.3 Research AimThis research project aims to provide scientific knowledge in the domains of munici-pal solid waste and construction waste management, with the main goal to improve the performance2 of the system.
The main research question is:
How can waste management systems for municipal solid waste and construction waste be improved?
The research therefore, attempts to answer three sub-questions and a hypothesis discussed below:
Sub-questions for municipal waste management systems are:
1. Who are the stakeholders?2. Which are the factors that influence the performance of the system?
Different actions are taken to find the answers to those questions. Data are collected during the visits made by the author of this thesis to different developing countries in the period 1985-2011. Information is gathered by means of exercises provided to participants during workshops including questions about the stakeholders (Appen-dix 2.3) and the state of the solid waste management system in the city.
Waste management practices are followed by onsite visits to households, hospitals, offices and schools, construction sites, health care centers, agricultural and commer-cial areas. The following characteristics are noted: collection and transportation sys-tems, waste treatment procedures, identification of materials for reuse and recycling and final disposal facilities. The findings are presented, analyzed and validated with relevant stakeholders from the visited sites.
The parameters found during the visits provide an insight for creating the question-naire refer to as “Characterization of waste management practices” (Appendix 2.4) that is used to systematize the gathered information from 1985 to 2009 and to obtain new data about waste management systems in those sites up to 2011. The literature review from 2005 to 2011 permits validation of some of the parameters used in the questionnaire. This information is collected in a database that contains 162 analyzed parameters of thirty six cities. It can be found at URL: http://dx.doi.org/10.4121/uuid:31d9e6b3-77e4-4a4c-835e-5c3b211edcfc
2 Performance: the execution of an action measured against present known standards
17
I N T R O D U C T I O N
The results are initially explored using a Kolmogorov-Smirov to test normally distri-bution of the data. The application of the test proves that the data are not normally distributed. Consequently, a non-standard parametric test is used in the subsequent statistical analysis. Spearman’s correlation coefficient, a non-parametric statistic, al-lows correlating two variables in order to find relationships. Finally, Principal Com-ponent Analysis is used with the objective to establish the linear components or factors that exist within some of the data (Field, 2009).
Sub-question proposed for construction waste generation is:
3. Which are the factors underlying the efficient use of construction materials and its impact on the generation of construction waste during the realization of a building?
Thomas, et al. (2005) indicate that material resources constitute a large portion of a project’s total costs and according to them the loss of materials are the results of inefficient production practices. The inefficiencies of the construction activity can be examined utilizing models or tools that assist answering the question proposed. Some of those models are concerned with efficiency measured in financial terms ignoring the production of pollution (Murty, et al., 2006), while others recognize environmental issues.
The present research does consider as an efficiency model, the interchange of phys-ical flows (material and energy) between the construction system and its natural environment including the processes that take place. Materials and residual materi-als are investigated focusing mainly on reinforced steel, stony materials and wood. These are chosen because of their importance in terms of cost and the potential for generating solid waste (Formoso, et al., 2002). Measures of residuals are collected for each one of them for specific project stage (foundation, structure and roofing). Energy and residual energy are measured in terms of Gross Energy Requirement.
The model chosen for this study is Industrial Metabolism. It aims at the investigation of the industrial system, the mutual interchange of physical flows (materials and en-ergy) between the industrial system and its natural environment (Lambert, 2008b). In 2004, Brunner suggested that Material Flow Analysis (MFA) is an appropriate tool to follow materials from consumption to final disposal in the environment. The result of the application of the tool is a complete and consistent set of information, including flows and stocks of a particular material, flow of wastes and identification of its sources (Hendriks et al., 2000; Brunner and Rechberger, 2004). But the MFA approach presents some limitations. One is that the “metabolism” changes over time and measuring just flows is insufficient to understand the processes that take place.
18
C H A P T E R 1
Therefore, the description of the flows is important as well as the comprehension of the processes behind those flows (Janssen et al., 2001; Gößling-Reisemann, 2008; Lambert, 2008a).
In order to overcome the limitation, a physical model is extended, with the support of the Structured Analysis and Design Technique (SADT) (Marca and McGowan, 1987) that helps to understand and describe the construction process. The construction waste generation model created is a physical model that helps to describe the realization of a building process (Abarca et al., 2010). It comprises eight units that represent the components of the physical flows needed for MFA and the elements that describe the process. The units for the assessment of the flows are: materials, energy, residual products, residual energy and product or building. The elements for the analysis of the construction process are: barriers and motivators for environ-mental building practices; design and management and labor.
The appropriateness of the model is tested in Costa Rica, utilizing real data provid-ed by engineers and practitioners working in the Costa Rican construction industry (Abarca et al., 2010). Firstly, a survey instrument is created based on the information gathered during the literature study. Secondly, structured interviews are carried out on key persons from different organizations related to the construction sector. Thirdly, on site visits are done to collect specific information about waste manage-ment practices. Fourthly, a panel experts’ discussion took place with the participa-tion of forty nine professionals from different sectors, with the objective to explore the meanings of the survey results, to analyze the participants’ views on the topics presented and to collect a wider insight into different opinions (Abarca-Guerrero, 2008; ODI, 2009).
Additionally, a case study is proposed to determine on site firstly, quantities of mate-rials (wood, stony materials and steel) used and produced as waste during the reali-zation of the foundation, structure and roof of the studied building. Secondly to de-termine the amount of residual energy associated to the waste materials and thirdly to determine material management practices and origins of construction waste.
During the data collection on construction waste generation causes, called in this thesis attributes, it is determined that all attributes are equal, but some attributes are more equal than others (adapted from Orwell, 1945, p.133).
As a result, a hypothesis is proposed that states: Various sources have a different effect on construction waste generation.
The literature review and the results of the application of the model with real data provide enough information to create a questionnaire that coveres mainly the topics related to causes of construction waste generation (Appendix 4.2). The survey is
19
I N T R O D U C T I O N
applied to contractors that have to establish the levels of importance of the waste generation sources. The degree of each attribute is calculated using a five-point Lik-ert scale and the null hypothesis tested by Student’s t-Test.
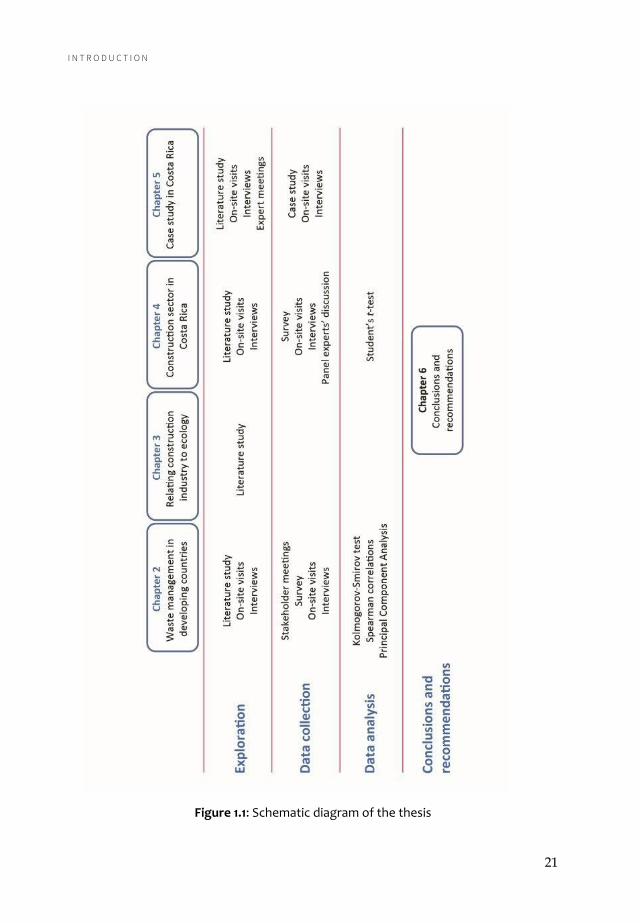
1.4 Research approach and thesis structure Several methods are used to collect and analyze data in order to answer the question proposed. Figure 1.1 provides a schematic diagram of this thesis. It is organized into five chapters (excluding the first chapter) covering two topics: factors affecting the performance of municipal waste management systems and factors influencing con-struction waste generation.
Chapter 2 discusses the challenges solid waste management systems have in develop-ing countries. In order to structure the information provided in literature and the data gathered by the author, the Integrated Sustainable Waste Management mod-el (ISWM) is introduced. The model acknowledges the importance of three cate-gories when analyzing, developing or changing a waste management system. The categories are: the stakeholders that have an interest in solid waste management (SWM), the elements or stages of the movement or flow of materials from the gen-eration points towards treatment and final disposal including recycling and the aspects or “lenses” through which the system is analyzed (WASTE, 2004). The chapter is divided in five sections. The first section introduces the Integrated Sustainable Waste Management (ISWM) Model that allows studying the complex and multi-di-mensional waste management systems in an integral way. Section two describes the stakeholders and factors that influence the elements and aspects of the system. Section three explains the research method for investigating the cities. Section four presents the results and provides a summary of the parameters found affecting the system and finally section six offers conclusions for this chapter.
Chapter 3 develops the conceptual framework for the study on construction waste management. This chapter is divided in six sections. The first section describes the impact on construction activities on the built environment. Section two provides a brief description of the construction industry in developing countries and the key factors affecting the efficient use of construction materials and its impact on the gen-eration of construction waste, during the procurement of a building. Section three introduces some industrial productive efficiency models or tools that could be used to analyze and explain the success in producing as large as possible an output (e.g. dwelling) from a set of given inputs (e.g. construction materials). Section four defines Industrial Metabolism as the model selected to determine the major factors affecting the performance and efficiency of the construction process in developing countries, taking into account environmental considerations. Section five describes the model proposed and denominated “A construction waste generation model”. It is based on Structured Analysis and Design Technique (SADT). It comprises eight units: ma-terials, energy, labor, residual product, residual energy, product or building, barriers
20
C H A P T E R 1
and motivators for environmental building practices, design and management. This model is suggested to be appropriate for analyzing, describing and understanding the construction process in developing countries. Section six provides conclusions of the chapter. Chapter 4 describes the construction sector in Costa Rica and the results of testing the appropriateness of the model. The findings during the study are presented and validated during a panel expert discussion with the participation of 49 professionals related to construction activities. Additionally, this chapter provides information in relation to the attributes and the levels of significance on construction waste gener-ation in the Costa Rican present situation. The chapter is divided in five sections. Section one introduces a set of questions that help to collect information related to the eight units composing the construction waste generation model. Section two describes briefly the construction industry in Costa Rica. Section three presents the methodology used during the two phases of the study. Section four discusses the results on the present situation of Costa Rican construction practices. Section five provides the conclusions of this chapter.
Chapter 5 presents the results obtained during the case study. It has the objective to check, in a real situation, two units of the construction waste reduction mod-el proposed. Firstly, the unit that corresponds to materials is approached by the Bill of Quantities. Secondly, residual materials are analyzed as suggested by Katz and Baum (2011). Thirdly, residual energy, measured in terms of Gross Energy Re-quirement assigned to the materials that turned into waste, is based on the values presented in Table 3.1. Fourthly, design and management is analyzed by two tools: checklist (Appendix 5.1) and free flow mapping. The checklist is developed based in the literature study and the free flow mapping suggested by Shen et al. (2004). The chapter is divided in five sections. Section one proposes the questions to be an-swered in order to determine the information needed for the two units under study. Section two introduces information found during the literature review in relation to materials, residual products, waste generation rates, residual energy, and design and management practices. Section three presents the methodology and the steps followed in order to assure the quality of the data collected. Section four presents the results and the discussion of the findings. Section 5 reports the analysis of the different tools and the conclusions of this chapter.
Finally, Chapter 6 discusses the findings of the research project and concludes this thesis with research implications, recommendations and future directions.
21
I N T R O D U C T I O N
Figure 1.1: Schematic diagram of the thesis
22
C H A P T E R 1
References
Abarca-Guerrero, L., 2008. Sustainable con-struction in Costa Rica: Towards a strategic ap-proach to construction material management for waste reduction (Keynote speaker). Costa Ri-can Congress of Civil Engineers, Costa Rica.
Abarca, L., Maas, G.J., Lambert, A.J.D., 2010. Black box opener, tools to assess material use in the Costa Rica construction sector. In: Pro-ceedings of the CIB World Congress: Building a better world. School of the Built Environment, University of Salford, UK.
Apotheker, S., 1990. Construction and demo-lition debris. The invisible waste stream. Re-source Recycling, 9(12), pp.66-74.
Bellies, M., 2013. The history of concrete and cement. Inventors. Available at: <http://in-ventors.about.com/library/inventors/blcon-crete.htm> [Accessed 03 August 2013].
Bossink, B.A.G., Brouwers, H.J.H., 1996. Con-struction waste: quantification and source evaluation. J. of Construction Engineering and Management, 122(1), pp.55-60.
Brooks, K.A., Adams, C., Demsetz, L.A., 1994. Germany’s construction and demolition de-bris recycling infrastructure: What lessons does it have for the US? In: First Conference of CIB TG 16. Gainesville Fla., pp.647-656.
Brunner, P., 2004. Materials flow analysis and the ultimate sink. Journal of Industrial Ecology, 8(3), pp.4-7.
Brunner, P., 2007. Reshaping urban metabo-lism. Journal of Industrial Ecology, 11(2), pp.11-13.
Brunner, P.H., Rechberger, H., 2004. Practi-cal handbook of material flow analysis. Florida: Lewis Publishers.
Craven, E.J., Okraglik, H.M., Eilenberg, I.M., 1994. Construction waste and a new design methodology. In: First Conference of CIB TG 16. Gainesville Fla., pp.89-98.
Field, A.P., 2009. Discovering statistics using SPSS. 3rd ed. London: Sage.
Formoso, C.T., Soibelman, L., Cesare, C.D., Issato E.L., 2002. Material waste in building industry: main causes and prevention. J. of Construction Engineering and Management, 128(4), pp.316-326.
Gavilan, R.M., 1994. Source evaluation of solid waste in building construction. J of Con-struction Engineering and Management, 120(3), pp.536-552.
Gößling-Reisemann, S., 2008. What is re-source consumption and how can it be mea-sured? Theoretical Considerations. Journal of Industrial Ecology, 12(1), pp.10-25.
Heino, E., 1994. Recycling of construction waste sustainable construction. In: First Con-ference of CIB TG 16. Gainesville Fla., pp.565-572.
Hendriks, C., Obernosterer, R., Müller, D., Kytzia, S., Baccini, P., Brunner, P.H., 2000. Material Flow Analysis: a tool to support environmental policy decision making. Case-studies on the city of Vienna and the Swiss lowlands. Journal Local Environment, 5(3), pp.311-328.
23
I N T R O D U C T I O N
Hong Kong EPD (Hong Kong Environmental Protection Department), 2000. Statistics Data. Hong Kong SAR. Available at: < http://www.epd.gov.hk/epd> [Accessed 8 March 2009].
Hovarth, A., 2004. Construction materials and the environment. Annu. Rev. Environment and Resources, 29, pp.181-204.
Kartam, N., Al-Mutairi, N., Al-Ghusain, I., Al-Humoud, J., 2004. Environmental man-agement of construction and demolition waste in Kuwait. Waste Management Journal, 24(10), pp.1049-1059.
Kennedy, C., Cuddihy, J., Engel-Yan, J., 2007. The changing metabolism of cities. Journal of Industrial Ecology, 11(2), pp.43-59.
Janssen M.A., Bergh, J.C.J.M. van den, Beuke-ring, P.J.H. van, Hoekstra, R., 2001. Changing industrial metabolism methods for analysis. Population and Environment, 23(2), pp.139-156.
Katz, A., Baum, H., 2011. A novel methodol-ogy to estimate the evolution of construction waste in construction sites. Waste Manage-ment Journal, 31(11), pp.353-358.
Lambert, A.J.D., 2008a. Energy, production and process integration. Faculteit Technologie Management, Technische Universiteit Eind-hoven.
Lambert, A.J.D., 2008b. Industrial metabolism: roots and basic principles. In: S. Gupta and A.J.D. Lambert, eds. 2008. Florida: CRC Press.
Lawson, N., Douglas, I., 2001. Recycling con-struction and demolition waste – A UK per-spective. Environmental Management Health, 12(2), pp.146-157.
Marca, D., McGowan, S.L., 1987. Structured Analysis and Design Technique. New York: Mc-Graw-Hill.
Marshall, R.E., Farahbakhsh, V., 2013. Sys-tems approaches to integrated solid waste management in developing countries. Waste Management Journal, 33(4), pp.988–1003.
Mincks, W.R., 1994. The construction contrac-tor’s waste management plan: optimizing control and cost, Sustainable construction. In: First Conference of CIB TG 16. Gainesville Fla., pp.765-774.
Minghua, Z., Xiumin, F., Rovetta, A., Qichang, H., Vicentini, F., Bingkai, L., Giusti, A., Yi, L. 2009. Municipal solid waste man-agement in Pudong New Area, China. Waste Management Journal, 29(3), pp.1227–1233.
Murty, M.N., Kumar, S., Mahua P., 2006. En-vironmental regulation, productive efficien-cy and cost of pollution abatement: a case study of the sugar industry in India. Journal of Environmental Management, 79(1), pp.1–9.
ODI (Oversees Development Institute), 2009. Research tools: Focus group discussions. Available at: <http://www.odi.org.uk/pub-lications/5695-focus-group-discussion> [Ac-cessed 23 November 2012].
Orwell, G. 1945. Animal farm. London: Secker and Warburg.
Peng, C.L., Grosskopt, K.R., Kibert, C.J., 1994. Construction waste management and recy-cling strategies in the United States. Sustain-able Construction. In: First Conference of CIB TG 16. Gainesville Fla., pp.689-696.
24
C H A P T E R 1
Rogoff, M.J., Williams, J.F., 1994. Approaches to implementing solid waste recycling facilities. Park Ridge, N.J: Noyes Publication.
Shekdar, A., 2009. Sustainable solid waste management: An integrated approach for Asian countries. Waste Management Journal, 29(4), pp.1438-1448.
Shen, L.Y., Tam, V.W.Y., Tam, C.M., Drew, D., 2004. Mapping approach for examining waste management on construction sites, J. Construction Engineering and Management, 130(4), pp.472-481.
Skoyles, E.R., 1987. Waste prevention on site. London: Mitchell.
Sujauddin, M., Huda, M.S., Rafiqul Hoque, A.T.M., 2008. Household solid waste char-acteristics and management in Chittagong, Bangladesh. Waste Management Journal, 28(9), pp.1688-1695.
Taiwan EPA (Taiwan Environmental Protec-tion Agency), 1999. Annual Report on disposal of solid and liquid wastes. Taiwan.
Teo, M.M.M., Loosemore, M., 2001. A theory of waste behavior in the construction indus-try. Construction Management and Economics, 19(7), pp.741-751.
Thomas, H.R. Riley, D.R., Messner, J.I., 2005, Fundamental principles of site material man-agement, J. of Construction Engineering and Management, 131(7), pp.808-815.
WASTE. 2004. Integrated Sustainable Waste Management. Available at: <http:waste.nl, click on ISWM under “Approaches”> [Ac-cessed 01 March 2010].
WCED (World Commission on Environment and Development, 1987. Our Common Future. Oxford: Oxford University Press.
Yuan, H., Shen, L., 2011. Trend of the re-search on construction and demolition waste management. Waste Management Journal, 31(4), pp.670-679.
Yuan, H., Shen, L., Wang, J., 2011. Major obstacles to improving the performance of waste management in China’s construction industry. Facilities, 29(5/6), pp.224-242.
Zarate, M.A., Slotnick, J., Ramos, M., 2008. Capacity building in rural Guatemala byimplementing a solid waste manage-ment program. Waste Management, 28(12), pp.2542–2551.
25
W A S T E M A N A G E M E N T I N D E V E L O P I N G C O U N T R I E S
Chapter 2Waste management in developing
countries
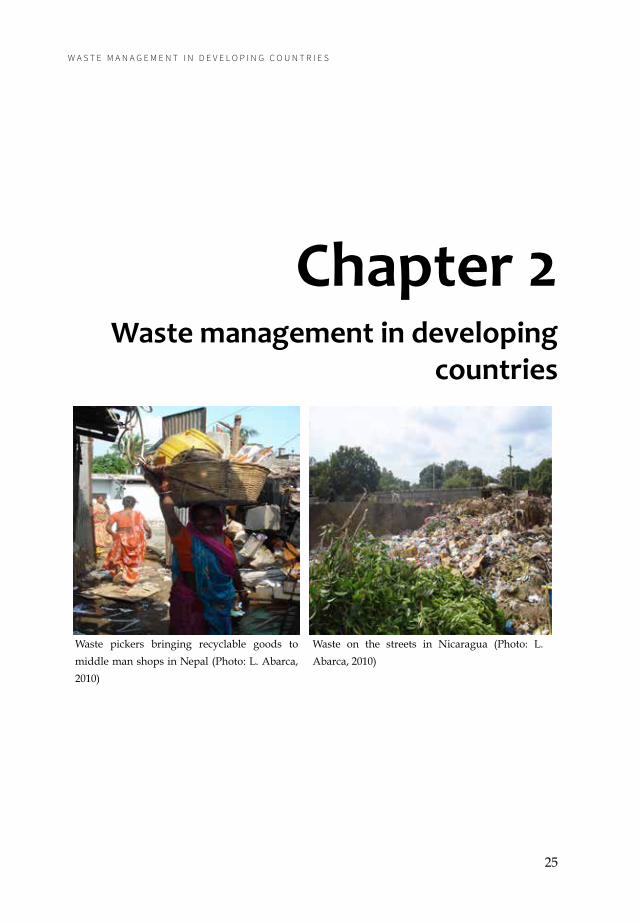
Waste pickers bringing recyclable goods to
middle man shops in Nepal (Photo: L. Abarca,
2010)
Waste on the streets in Nicaragua (Photo: L.
Abarca, 2010)
26
C H A P T E R 2
“The trouble with local governmental leaders is an insufficient appreciation of the relevance of stakeholders; of the implications of pluralism.
The trouble with governmental leaders is that they are not sufficient aware of the context, or the external environment, of whatever it is they are responsible for doing” (adapted from Jaworski, 1996, p. 49).

27
W A S T E M A N A G E M E N T I N D E V E L O P I N G C O U N T R I E S
2. Waste management in developing countries3
2.1 IntroductionThe simplest definition of waste is matter that is discarded, expelled or in excess, but waste is more than what we want to get rid of (Hawinks, 2006). The European Council (1991) defines it as any substance or object that belongs to certain catego-ries (Appendix 2.1) which the holder discards or is required to discard. The OECD (1994) specifies that waste is referred as materials other than radioactive intended for disposal, for reasons specified in Appendix 2.2. These definitions appear to be concerned with the “what to do with it?” dilemma, while the label waste does not necessarily mean that the thing is an ultimate waste, rather, it means that it will be treated as waste (Pongrácz and Pohjola, 2004).
Lox in 1994 (cited in Pongrácz and Pohjola, 2004) proposes that waste is either an output with (‘a negative market’) no economic value from an industrial system or any substance or object that has been used for its intended purpose (or ‘served its intended function’) by the consumer and will not be reused. This definition is most complete since it provides the negative values the system gives to the outputs. Therefore, the last definition suits better in the present research project.
Waste arises from production, transformation or consumption processes. It can be generated during the extraction of raw materials, their processing into intermediate and final products, the consumption of final products, and other human activities (UNSD, 1997).
Sources of solid waste can be classified using different categorizations such as: resi-dential, commercial, institutional, construction and demolition, municipal services, treatment plant sites (including incinerators), industrial and agricultural. The com-ponents or materials found in the waste can be organic which include food wastes, paper, cardboard, plastics, textiles, rubber leather, yard wastes and wood and in-organic which comprise glass, metals, dirt, ash and others. The distributions of the amounts of these wastes vary from country to country. Low income countries pro-duce more organic than middle-income and upper-income economies while inor-ganic is found in higher percentages in high income economies (Tchobanoglous et al., 1993).
Solid waste management may be defined as the discipline associated with the control of generation, storage, collection, transfer and transport, processing and disposal of solid wastes in a manner that is in accord with the best principles (Tchobanoglous
3 This Chapter has been published. Reference: Abarca-Guerrero, L., Maas, G., Hogland, W., 2013. Solid waste management challenges for cities in developing countries. Waste Management Journal, 33(1), pp.220-232. This Journal has an Impact Factor = 2.485. It has been reported as the second most downloaded article in 2013.
28
C H A P T E R 2
et al., 1993). An integral solid waste management system considers the stakeholders that have an interest in a well-organized scheme, the elements or stages of the move-ment or flow of materials from the generation points towards treatment and final disposal and the aspects that enable the system to be efficient (Anschütz et al., 2004). Waste management has the aim of protecting the environment and human health, encouraging resource conservation (Pongrácz and Pohjola, 2004).
Solid waste in developing countries is increasing due to the rise in population levels, booming economy, rapid urbanization and community living standards. (Minghua et al., 2009). Municipalities, usually responsible for waste management in the cities, have the challenge to provide an effective and efficient system to the inhabitants. However, they often face problems which are way beyond the ability of the local governmental leaders to tackle (Sujauddin et al., 2008) mainly due to lack of organi-zation, financial resources, awareness and complexity in the system (Burntley, 2007).
Waste management has been in the international research agenda since more than 25 years ago. In the last years, a large number of research studies have been undertaken to determine influential or success factors affecting waste management systems in cities in developing countries.
The concept of success factors or parameters, also called key variables, strategic fac-tors, key success factors (Leidecker and Bruno, 1984) is usually credited to Daniel in 1962 (Fortune and White, 2006). They are, for any business, the limited number of areas in which results, if they are satisfactory, will insure successful competitive performance for the organization. They are the few key areas where ‘things must go right’ for the business to flourish” (Rockart, 1997).
This study is undertaking success factors as characteristics, conditions, variables, pa-rameters or factors that when properly sustained, maintained or managed can have a significant impact on the success of an organization/institution providing waste management services” (Adapted from Leidecker and Bruno, 1994).
This chapter discusses the stakeholders, the elements and aspects that affect the ef-ficiency of waste management systems in developing countries. This chapter gives the answers on the following sub-questions:
Subquestion 1: Which are the stakeholders in waste management systems in developing countries?
Subquestion 2: Which are the success factors that influence the performance of waste management systems in developing countries?
29
W A S T E M A N A G E M E N T I N D E V E L O P I N G C O U N T R I E S
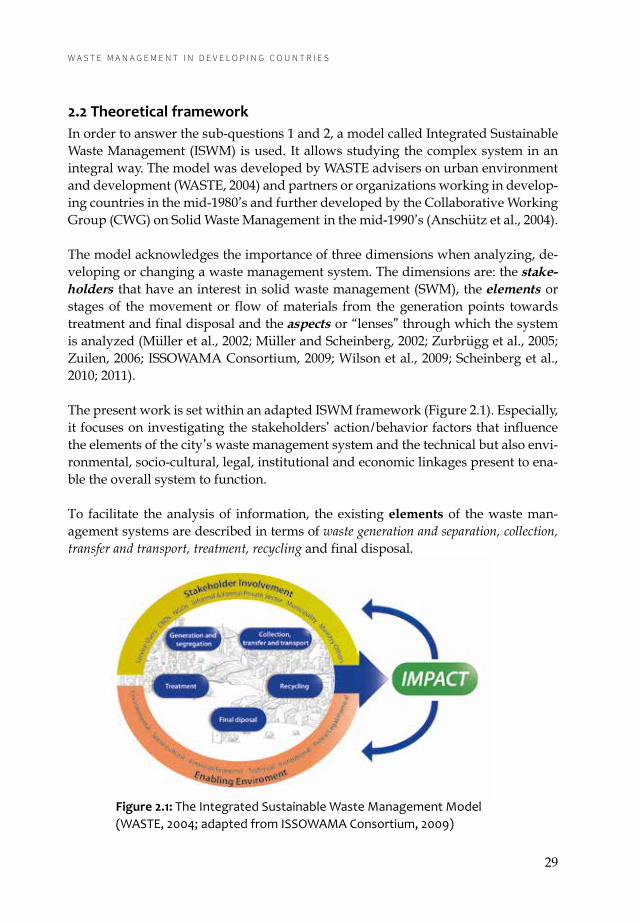
2.2 Theoretical frameworkIn order to answer the sub-questions 1 and 2, a model called Integrated Sustainable Waste Management (ISWM) is used. It allows studying the complex system in an integral way. The model was developed by WASTE advisers on urban environment and development (WASTE, 2004) and partners or organizations working in develop-ing countries in the mid-1980’s and further developed by the Collaborative Working Group (CWG) on Solid Waste Management in the mid-1990’s (Anschütz et al., 2004).
The model acknowledges the importance of three dimensions when analyzing, de-veloping or changing a waste management system. The dimensions are: the stake-holders that have an interest in solid waste management (SWM), the elements or stages of the movement or flow of materials from the generation points towards treatment and final disposal and the aspects or “lenses” through which the system is analyzed (Müller et al., 2002; Müller and Scheinberg, 2002; Zurbrügg et al., 2005; Zuilen, 2006; ISSOWAMA Consortium, 2009; Wilson et al., 2009; Scheinberg et al., 2010; 2011).
The present work is set within an adapted ISWM framework (Figure 2.1). Especially, it focuses on investigating the stakeholders’ action/behavior factors that influence the elements of the city’s waste management system and the technical but also envi-ronmental, socio-cultural, legal, institutional and economic linkages present to ena-ble the overall system to function.
To facilitate the analysis of information, the existing elements of the waste man-agement systems are described in terms of waste generation and separation, collection, transfer and transport, treatment, recycling and final disposal.
Figure 2.1: The Integrated Sustainable Waste Management Model (WASTE, 2004; adapted from ISSOWAMA Consortium, 2009)
30
C H A P T E R 2
2.3 Waste management in developing countriesPast research identifies the stakeholders, people or organizations that may have an interest in an efficient and effective waste management system. The stakeholders reported are: national and local government (Shekdar, 2009), municipal authorities, city corporations, non-governmental organizations (NGO’s), households (Sujauddin et al., 2008), private contractors, Ministries of Health, Environment and Economy and Finance (Geng et al., 2009) and recycling companies (Tai et al., 2011).
Some scholars report success factors influencing the elements of the waste manage-ment systems. According to Sujauddin et al. (2008) the generation of waste is influ-enced by family size, their education level and the monthly income. Households attitudes related to separation of waste are affected by the active support and invest-ment of a real estate company, community residential committees’ involvement for public participation (Zhuang et al., 2008) and fee for collection service based on the waste volume or weight (Scheinberg, 2011). Gender, peer influence, land size, loca-tion of household and membership of environmental organization explain house-hold waste utilization and separation behavior (Ekere et al., 2009). It is stated that the presence of waste pickers in the system promotes the separation of waste at the household level (Abarca et al., 2012). In some cities such as Lima, Peru waste pickers collect –door to door- 98% of the total recyclable materials while in Pune, India it corresponds to 100% (Gunsilius et al., 2011).
It is reported that collection, transfer and transport practices are affected by, improper bin collection systems, poor route planning and lack of information about collection schedule (Hazra and Goel, 2009), insufficient infrastructure (Moghadam et al., 2009), poor roads and number of vehicles available for waste collection (Henry et al., 2006). Organizing the informal sector and promoting micro-enterprises are mentioned by Sharholy et al. (2008) as effective ways of extending affordable waste collection ser-vices.
Waste treatment refers to the activities required to ensure that waste has the least impact on the environment. Burning is a practice commonly used by households in developing countries with the main goal to reduce the volume. Waste pickers normally burn the plastic in electric wires in order to extract the valuable metals and sell them to recycling companies (Hogland, 2013). Composting is also a treatment system experienced in most of developing countries. It is mentioned that despite the relative simplicity several projects initiated over the past decades have failed (Marshall and Farahbakhs, 2013) due to high costs, bad compost quality and poor marketing (Hogland, 2013). Lack of knowledge of treatment systems by authorities is reported as one factor affecting the treatment of waste (Chung and Lo, 2008).
31
W A S T E M A N A G E M E N T I N D E V E L O P I N G C O U N T R I E S
Tadesse et al. (2008) analyze the factors that influence household waste disposal de-cision making. Results show that the supply of waste facilities significantly affects waste disposal choices. Inadequate supply of waste containers and longer distance to these containers increase the probability of waste dumping in open areas and roadsides relative to the use of communal containers. Insufficient financial resources limiting the safe disposal of waste in well-equipped and engineered landfills and absence of legislation are mentioned by Pokhrel and Viraraghavan (2005).
In relation to the pricing for disposal Scheinberg (2011), analyzing the data from “Solid Waste Management in the World’s Cities” (Scheinberg et al., 2010), notes that there are indications that high rates of recovery are associated with tipping fees at the disposal site. High disposal pricing has the effect of more recovery of waste gen-erated, that goes to the value chains or beneficial reuse of waste.
Regarding recycling Gonzalez-Torre and Adenso-Diaz (2005) report that social in-fluences, altruistic and regulatory factors are some of the reasons why certain com-munities develop strong recycling habits. The authors also show that people who frequently go to the bins to dispose of general refuse are more likely to recycle some product at home, and in most cases, as the distance to the recycling bins decreases, the number of fractions that citizens separate and collect at home increases. Ming-hua et al. (2009) state that in order to increase recycling rates the government should encourage markets for recycled materials and increasing professionalism in recy-cling companies. Other factors mentioned by other scholars are financial support for recycling projects and infrastructures (Nissim et al., 2005), recycling companies in the country (Henry et al., 2006), drop-off and buy back centers (Matete and Trois, 2008) and organization of the informal sector (Sharholy et al., 2008).
A new approach for the recovery of recyclable materials is “Landfill mining”. This process consists of excavating existing or closed solid waste disposal sites and sort-ing the excavated materials for recycling. The success depends on the composition of the waste and the effectiveness of the mining method (Joseph et al., 2008).
Waste management is also affected by the aspects or enabling factors that facili-tate the performance of the system. They are: technical, environmental, financial, socio-cultural, institutional and legal.
Literature suggests that technical factors influencing the system are related to lack of technical skills among personnel within municipalities and government authorities (Hazra and Goel, 2009), deficient infrastructure (Moghadam et al., 2009), poor roads and vehicles (Henry et al., 2006), insufficient technologies and reliable data available (Mrayyan and Hamdi, 2006).
32
C H A P T E R 2
Matete and Trois (2008) and Asase et al. (2009) respectively suggest that factors af-fecting the environmental aspect of solid waste management in developing countries are the lack of environmental control systems and evaluation of real impacts. Ekere et al. (2009) propose that the involvement of the population in active environmental organizations is necessary to have better systems.
Municipalities fail to manage solid waste due to financial factors. The huge expend-iture needed to provide the service (Sharholy et al., 2007), the absence of financial support, limited resources, the unwillingness of the users to pay for the service (Su-jauddin et al., 2008) and lack of proper use of economic instruments hamper the delivery of proper waste management services. Sharholy et al., (2008) indicate that the involvement of the private sector is a factor that could improve the efficiency of the system.
It is generally regarded that waste management is the sole duty and responsibility of local authorities, and that the public is not expected to contribute (Vidanaarachchi et al., 2006). The operational efficiency of solid waste management depends upon the active participation of both the municipal agency and the citizens, therefore, socio cultural aspects mentioned by some scholars include people participating in deci-sion making (Sharholy et al., 2008), community awareness and societal apathy for contributing in solutions (Moghadam et al., 2009). Education on waste issues should start at very young age in the schools. Children learn good practices and change their behavior and attitudes, affecting positively the inner circle of family members (Hogland, 2013).
Management deficiencies are often observed in the municipalities. Some researchers have investigated the institutional factors affecting the system and conclude that lo-cal waste management authorities lack of organizational capacities (leadership) and professional knowledge. Besides they agree that the information available is very scanty from the public domain (Chung and Lo, 2008). The extremely limited infor-mation is not complete or is scattered around various agencies concerned, therefore, it is extremely difficult to gain an insight into the complex problem of municipal solid waste management (Seng et al., 2010).
Waste workers are associated with low social status (Vidanaarachchi et al., 2006) with a consequence of low motivation among the solid waste employees. Politicians give low priority to solid waste compared to other municipal activities (Moghadam et al., 2009) with the end result of limited trained and skilled personnel in the munic-ipalities (Sharholy et al., 2008). Positive factors mentioned that improve the system are support from municipal authorities (Zurbrügg et al., 2005) and strategic plans for waste management that allows monitoring and evaluating annually the system (Asase et al., 2009).
33
W A S T E M A N A G E M E N T I N D E V E L O P I N G C O U N T R I E S
Researchers have documented how adequate legislation positively contributes to the development of the integrated waste management system (Asase et al., 2009) while the absence of satisfactory policies (Mrayyan and Hamdi, 2006) and weak regula-tions (Seng et al., 2010) are detrimental to it.
2.4 Research methodologyThe review of literature provides an overview of reported stakeholders and factors affecting waste management systems. Data on country performance indicators are gathered from databases. They are: public health (perinatal mortality, adult mortal-ity, life expectancy at birth and healthy life expectancy at birth (WHO, 2010a, 2010b, 2010c, 2010d; USEPA, 2010), economy (Gross Domestic Product/capita/year) (WB, 2010), and environment (ecological footprint/capita) (Global Footprint Network, 2010), CO2-emission/capita (UN, 2007) were collected. In addition, the following country characterization parameters are selected (persons/km2, % urban popula-tion) (CIA, 2010).
Furthermore, Table 2.1 provides information of some of the characteristics of the thirty six sites visited, in some cases for more than one occasion, in twenty two de-veloping countries in three continents. It also includes Gross Domestic Product per capita per year (GDP/capita/year), the city and the year in which the study takes place, the amount of waste or generation rates per person per day for the studied city and the types of waste arriving to the official disposal site.
Data collection is supported by different contributors in those countries during vis-its made in the period 1985-2011. Information is collected by means of exercises pro-vided to participants during workshops including questions about the stakeholders (Appendix 2.3) and the state of the solid waste management system in the city in relation to the elements, the aspects and the problems associated with them. Waste management practices are followed by on-site visits to households, hospitals, offices and schools, construction sites, health care centers, agricultural and commercial ar-eas. The following characteristics are noted: collection and transportation systems, waste treatment procedures, identification of materials for reuse and recycling and final disposal facilities. The findings are presented, analyzed and validated with relevant stakeholders from the visited sites.
The parameters found during the visits to the sites allow creating a questionnaire (Appendix 2.4) that is used to systematize gathered information before 2009 and to obtain new data about waste management systems in those sites up to 2011. It con-tains 122 questions of which 74 are measured on a five-point Likert-type scale with anchors ranging from never, none, very bad (1) to always, all, excellent (5) (Matell and Jacoby, 1971), as values of actual measurements (5 questions), binary scale (Yes/No) (22 questions) (Ekere et al., 2009) and general information (21 questions). The
34
C H A P T E R 2
literature review from 2005-2011 allows to validate some of the parameters used in the tool as well as to introduce others not reported during the reviewed years.
Prior to data collection the questionnaire is pre-tested for ease of understanding and content validity. A group of stakeholders from 8 municipalities (3 in South Africa, 2 in Indonesia, 1 in Peru, 1 in Kenya, 1 in Philippines) in 5 different countries in 3 continents are asked to criticize the questionnaire for ambiguity, clarity and appro-priateness of the items used to operationalize each construct. The respondents are also requested to assess the extent to which the factors sufficiently address the topics investigated. Based on the feedback received, the instrument is modified according-ly and used to collect information about the state of waste management in the sites.
Due to the amount of information, constructs are prepared from the raw data.1. Household separation as follows: summing up the points provided by the re-
spondent on the five-point variables on extent of waste separation at: house-hold, business, plastic, paper, metal, glass, organic material, battery, electric and electronic municipality level.
2. Sophistication of waste collection system as follows: 1=No organized collection of solid waste; 2=Manpower only (Wheel-barrow and/or hand trolley and/or rickshaw and/or tricycle); 3=Manpower and draught animal; 4=Motorized trans-port (Motorcycle and/or tractor and/or truck) but no compactor used; 5=Mo-torized transport (Motorcycle and/or tractor and/or truck) and compactor used.
3. Environmental awareness campaigns as follows: one point for each positive answer to the nominal variables: environmental awareness campaigns support-ed by municipality; re-use awareness campaigns in the municipality; presence of environmental campaigns in the city; public awareness campaigns for waste management plus the points provided by the respondent on the five-point vari-ables: reduction campaigns in schools and recycling awareness campaigns.
4. Collection efficiency: one point for each positive answer to the nominal varia-ble: structured collection system plus the points provided by the respondent on the five-point variables: amount and suitability of equipment for waste collec-tion, efficiency in the collection system and availability of transportation facili-ties for waste collection.
5. Legislation: one point for each positive answer to the nominal variable: Does environmental legislation exist? Plus the points provided by the respondent on the five-point variables: adequacy of policy and legal frameworks to manage solid waste, enforcement of the law in practice and clear implementation of the laws of the country by the municipality.
6. Local available knowledge as follows: one point for each positive answer to the nominal variable: presence of skilled personnel in the municipality, pres-ence of professionals in the field of waste management working for the munici-pality and universities offering tertiary education in waste management issues.
35
W A S T E M A N A G E M E N T I N D E V E L O P I N G C O U N T R I E S
The results are initially explored using a Kolmogorov-Smirov test. This procedure allows comparing the obtained scores in the sample to a normally distributed set of scores with the same mean and standard deviation. The application of the test proves that the data are not normally distributed. Consequently, a non-standard parametric test is used in the subsequent statistical analysis (Field, 2009).
Spearman’s correlation coefficient is a non-parametric statistic that can be used when the data have violated parametric assumptions such as non-normally distrib-uted data. It allows correlating two variables in order to find relationships. The two variables can be correlated in three different ways: 1. positively related meaning that as one variable increases, the other increases by a proportionate amount (maximum value of 1); 2. not related at all meaning that there is no linear relationship at all and so if one variable changes, the other stay the same (value of 0) and 3. negatively re-lated which would mean that as one variable increases, the other one decreases by a proportionate amount (maximum value of -1) (Field, 2009). The bivariate analysis in this study helps to obtain relationships between city factors.
The significant levels are the boundaries within which the true value of the mean will fall. A 99% significance level is an interval constructed such that in 99% (repre-sented in this study as p< 0.01**) of samples the true value of the population mean falls within its limits. A 95% significance level represents that in 95% (represented in this study by <0.05*) of samples the true value of the population mean falls within that limit). A two tailed test permits to look at both ends (or tails) of the distribution of the population (Field, 2009).
A bi-variate analysis is performed between variables which are reported with sig-nificant levels of p<0.01** (2-tailed); and 0.05>p>0.01* (2-tailed). The variables used are related to technologies, environmental education, socio-cultural, institutional, financial and legal aspects. The information is analyzed using the Statistical Package for Social Sciences (SPSS) Version 17.0.
Principal Component Analysis (PCA) is a multivariate technique for identifying the linear components of a set of variables. It is concerned only with establishing which linear components exists within the data and how a particular variable might con-tribute to that component. PCA is used with orthogonal rotation (varimax) with the objective to establish the linear components or factors that exist within some of the data (Field, 2009).
Kaiser-Meyer-Olkin (KMO) statistic provides information about the adequacy of the PCA to the initial variables measuring the sample adequacy. The value varies be-tween 0 and 1. A value of 0 indicates diffusion in the pattern of correlations (hence PCA is likely to be inappropriate). A value close to 1 indicates that patterns of corre-lations are relatively compact and so PCA should yield distinct and reliable factors.
36
C H A P T E R 2
Kaiser (1974) recommends accepting values greater than 0.5. Values between 0.5 and 0.7 are mediocre, values between 0.7 and 0.8 are good, values between 0.8 and 0.9 are great and values above 0.9 are superb (Field, 2009).
Bartlett’s test of sphericity is applied to examine whether the original data were ap-propriate for factor analysis (Field, 2009).
Cronbach’s alpha is the most common measure of scale reliability. Acceptable values are higher than 0.7 though Cortina in 1993 noted that such general guideline need to be used with caution because the value depends on the number of items on the scale (Field 2009).
2.5 Results and discussionIn this section the results of the analysis and discussion are described utilizing five sub-sections: (i) stakeholders, (ii) generation and separation of waste, (iii) collection, transfer and transport, (iv) treatment, (v) final disposal and (vi) recycling.
Results of descriptive analysis, Spearman’s correlations, reliability tests, Principal Component Analysis (PCA) for each of the elements of the ISWM model are pre-sented.
StakeholdersThe stakeholders of waste management systems are identified during the work-shops. The main “recognized” or formal stakeholders include the local authority, some ministries from central government and private contractors providing servic-es. Participants in the workshops acknowledge the national and the local govern-ments as the most important stakeholders which set up policies and the provision of solid waste management services respectively. The private contractors are also regarded as important stakeholders as well as the service users such as: households, civil organizations, commercial and industrial sector. Less mentioned are education-al and research institutions, political parties, farmers (including poultry, fishery), health care centers, media, donor organizations, Chamber of Commerce and Indus-try, recycling companies, police and religious leaders.
The “unrecognized” or informal stakeholders include waste pickers collecting door to door, at the street or in the disposal site, itinerant waste buyers, junk shop owners and street sweepers.
37
W A S T E M A N A G E M E N T I N D E V E L O P I N G C O U N T R I E S
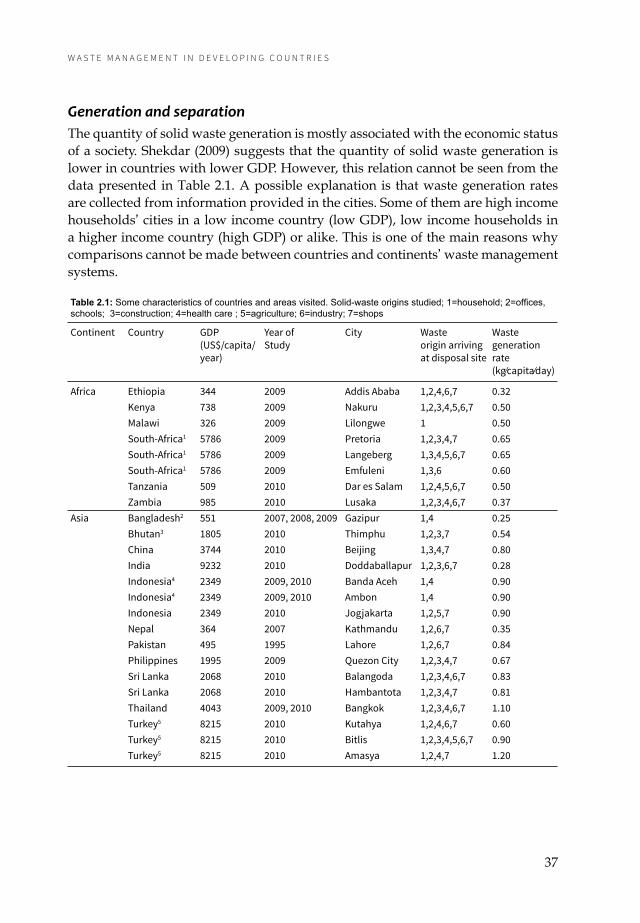
Generation and separationThe quantity of solid waste generation is mostly associated with the economic status of a society. Shekdar (2009) suggests that the quantity of solid waste generation is lower in countries with lower GDP. However, this relation cannot be seen from the data presented in Table 2.1. A possible explanation is that waste generation rates are collected from information provided in the cities. Some of them are high income households’ cities in a low income country (low GDP), low income households in a higher income country (high GDP) or alike. This is one of the main reasons why comparisons cannot be made between countries and continents’ waste management systems.
Table 2.1: Some characteristics of countries and areas visited. Solid-waste origins studied; 1=household; 2=offices, schools; 3=construction; 4=health care ; 5=agriculture; 6=industry; 7=shops
Continent Country GDP(US$/capita/year)
Year of Study
City Waste origin arriving at disposal site
Waste generation rate(kg∕capita∕day)
Africa Ethiopia 344 2009 Addis Ababa 1,2,4,6,7 0.32Kenya 738 2009 Nakuru 1,2,3,4,5,6,7 0.50Malawi 326 2009 Lilongwe 1 0.50South-Africa1 5786 2009 Pretoria 1,2,3,4,7 0.65South-Africa1 5786 2009 Langeberg 1,3,4,5,6,7 0.65South-Africa1 5786 2009 Emfuleni 1,3,6 0.60Tanzania 509 2010 Dar es Salam 1,2,4,5,6,7 0.50Zambia 985 2010 Lusaka 1,2,3,4,6,7 0.37
Asia Bangladesh2 551 2007, 2008, 2009 Gazipur 1,4 0.25Bhutan3 1805 2010 Thimphu 1,2,3,7 0.54China 3744 2010 Beijing 1,3,4,7 0.80India 9232 2010 Doddaballapur 1,2,3,6,7 0.28Indonesia4 2349 2009, 2010 Banda Aceh 1,4 0.90Indonesia4 2349 2009, 2010 Ambon 1,4 0.90Indonesia 2349 2010 Jogjakarta 1,2,5,7 0.90Nepal 364 2007 Kathmandu 1,2,6,7 0.35Pakistan 495 1995 Lahore 1,2,6,7 0.84Philippines 1995 2009 Quezon City 1,2,3,4,7 0.67Sri Lanka 2068 2010 Balangoda 1,2,3,4,6,7 0.83Sri Lanka 2068 2010 Hambantota 1,2,3,4,7 0.81Thailand 4043 2009, 2010 Bangkok 1,2,3,4,6,7 1.10Turkey5 8215 2010 Kutahya 1,2,4,6,7 0.60Turkey5 8215 2010 Bitlis 1,2,3,4,5,6,7 0.90Turkey5 8215 2010 Amasya 1,2,4,7 1.20
38
C H A P T E R 2
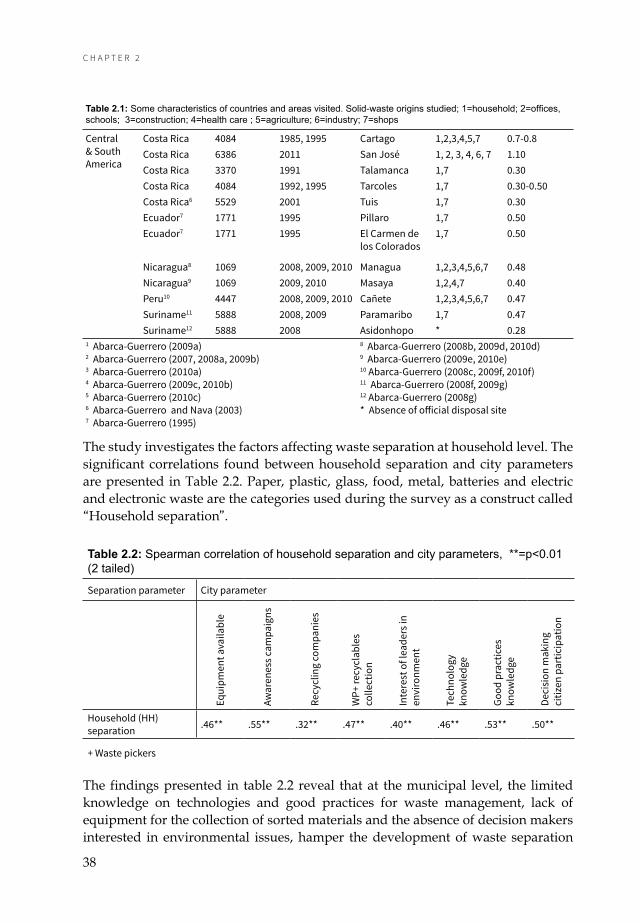
Table 2.1: Some characteristics of countries and areas visited. Solid-waste origins studied; 1=household; 2=offices, schools; 3=construction; 4=health care ; 5=agriculture; 6=industry; 7=shops
Central & South America
Costa Rica 4084 1985, 1995 Cartago 1,2,3,4,5,7 0.7-0.8Costa Rica 6386 2011 San José 1, 2, 3, 4, 6, 7 1.10Costa Rica 3370 1991 Talamanca 1,7 0.30Costa Rica 4084 1992, 1995 Tarcoles 1,7 0.30-0.50Costa Rica6 5529 2001 Tuis 1,7 0.30Ecuador7 1771 1995 Pillaro 1,7 0.50Ecuador7 1771 1995 El Carmen de
los Colorados1,7 0.50
Nicaragua8 1069 2008, 2009, 2010 Managua 1,2,3,4,5,6,7 0.48Nicaragua9 1069 2009, 2010 Masaya 1,2,4,7 0.40Peru10 4447 2008, 2009, 2010 Cañete 1,2,3,4,5,6,7 0.47Suriname11 5888 2008, 2009 Paramaribo 1,7 0.47Suriname12 5888 2008 Asidonhopo * 0.28
1 Abarca-Guerrero (2009a)2 Abarca-Guerrero (2007, 2008a, 2009b)3 Abarca-Guerrero (2010a)4 Abarca-Guerrero (2009c, 2010b)5 Abarca-Guerrero (2010c)6 Abarca-Guerrero and Nava (2003)7 Abarca-Guerrero (1995)
8 Abarca-Guerrero (2008b, 2009d, 2010d)9 Abarca-Guerrero (2009e, 2010e)10 Abarca-Guerrero (2008c, 2009f, 2010f)11 Abarca-Guerrero (2008f, 2009g)12 Abarca-Guerrero (2008g)* Absence of official disposal site
The study investigates the factors affecting waste separation at household level. The significant correlations found between household separation and city parameters are presented in Table 2.2. Paper, plastic, glass, food, metal, batteries and electric and electronic waste are the categories used during the survey as a construct called “Household separation”.
Table 2.2: Spearman correlation of household separation and city parameters, **=p<0.01 (2 tailed)
Separation parameter City parameter
Equi
pmen
t ava
ilabl
e
Awar
enes
s cam
paig
ns
Recy
clin
g co
mpa
nies
WP+
recy
clab
les
colle
ctio
n
Inte
rest
of l
eade
rs in
en
viro
nmen
t
Tech
nolo
gy
know
ledg
e
Good
pra
ctic
es
know
ledg
e
Deci
sion
mak
ing
citiz
en p
artic
ipat
ion
Household (HH) separation .46** .55** .32** .47** .40** .46** .53** .50**
+ Waste pickers
The findings presented in table 2.2 reveal that at the municipal level, the limited knowledge on technologies and good practices for waste management, lack of equipment for the collection of sorted materials and the absence of decision makers interested in environmental issues, hamper the development of waste separation
39
W A S T E M A N A G E M E N T I N D E V E L O P I N G C O U N T R I E S
programs. Awareness campaigns influence the behavior of individuals to segregate waste due to their environmental concern and the need to participate in solutions. The livelihoods of many poor people depend on collecting recyclable materials door to door, on the streets or at the disposal site. These waste pickers often pay a fee, therefore; households separate the waste in order to obtain some coins for it. Recycling companies have appeared in the cities due to the increase of prices on these secondary materials. The combination of these two facts seems to have promoted more separation at the household level. Finally, separation is improved when citizens share responsibility with the municipality on the decision making on the waste system of the city.
The PCA performed with the eight correlated factors allows three dimensions to be found (Table 2.3). The PCA reveals that the there are three most important compo-nents in relation to the separation of waste. These components are:
Awareness. The efficiency on the separation of waste depends on the awareness of citizens and municipal leaders on the impacts of waste management systems in the city.
Knowledge. Decision makers at the municipality are prone to set up waste sepa-ration programs when they are familiar with new and appropriate technologies as well as good practices for the management of waste.
Equipment. The availability of equipment and machinery to manage and recycle waste seem to be key factors that promote separation of waste at the household level.
The factor extraction process shows that awareness explains 44.4 % of the total var-iance of the observed variables, knowledge 17.2% and equipment 11.0%. The three components together account for 72.6% of the initial variance. The KMO measure verifies the sampling adequacy for the analysis, KMO= 0.72 which is above the ac-ceptable limit of 0.5. Bartlett’s test of sphericity χ2 (55) = 351.268, p< 0.001, indicates that correlations between items were sufficiently large for PCA. The Cronbach’s al-pha coefficients suggest that the items of each set of components have internal con-sistencies (are closely related) (Field, 2009).

40
C H A P T E R 2
Table 2.3: Principle Component Analysis of household separation and their related city factors after Varimax rotation with Kaiser normalization converged in 5 iterations; Only components explaining at least 10% of total variance are included; Loadings over 0.50 are considered relevant; n=50Components Loadings % Variance
explainedCronbach’s alpha
Component 1: Awareness 44.4 % 0.7Household separation +0.79Awareness programs +0.64Citizens participation in decision making +0.78Leaders interest in environmental issues +0.59Component 2: Knowledge 17.2% 0.8Municipality knowledge on solid waste management good practices
+0.69
Municipality knowledge on technologies for waste management
+0.75
Component 3: Equipment 11.0% 0.6Equipment available to manage waste +0.57Presence of recycling companies in the region +0.74
Collection, transfer and transport The study shows that municipalities collect waste from the commercial areas with frequencies that vary from 14 times a week (e.g. Amasya) to 1 time a week (e.g. Li-longwe). The collection in the inner city also varies from 14 times a week (e.g. Am-bon) to 0 (e.g. Asidonhopo). In the studied sites the solid waste generated is collected at fixed stations or door to door. Few of the studied sites have transfer stations: Ambon, Jogjakarta, Beijing, Bangkok, Dar es Salam, Emfuleni, Langeberg, Pretoria, Gazipur and Managua.
The door to door collection is done by a variety of systems. They are: rickshaw (e.g. Kathmandu, Beijing), animal traction (e.g. Nicaragua, Lahore), wheelbarrow (e.g. Hambatota, Lusaka), tractor (e.g. Langeberg, Balangoda), truck (e.g., Kuthaya, Na-kuru), compactor (e.g. Banda Aceh, San Jose), tricycle (e.g. Cañete, Gazipur), motor-cycle (e.g. Quezon City, Ambon) and hand trolley (e.g. Masaya, Jogjakarta).
Table 2.4 summarizes the results of a series of correlations between some city factors and household collection, transfer and transport of waste.
Time for collection of waste (schedule) fitting the service users’ needs has a signifi-cant relationship to the availability of waste transportation facilities and the quality of the road. When local leaders are interested in solid waste management issues, they allocate adequate funding for equipment and infrastructure. As a result the stakeholders are willing to pay and also to participate in the solutions for an im-proved service. The providers of waste collection often tend to forget the needs of the service users; therefore the cooperation and coordination between service users and service providers are of great importance.
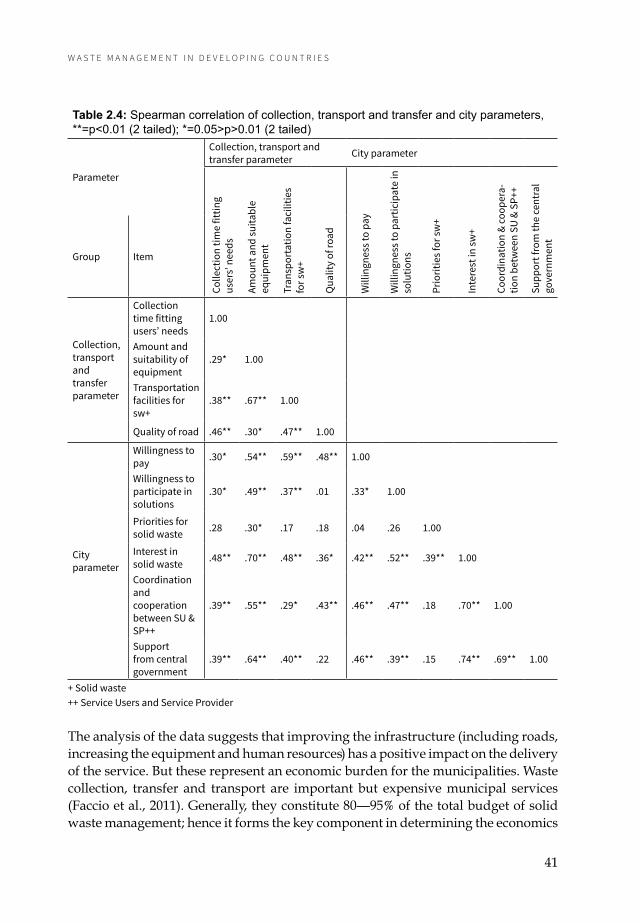
41
W A S T E M A N A G E M E N T I N D E V E L O P I N G C O U N T R I E S
Table 2.4: Spearman correlation of collection, transport and transfer and city parameters, **=p<0.01 (2 tailed); *=0.05>p>0.01 (2 tailed)
Parameter
Collection, transport and transfer parameter City parameter
Colle
ctio
n tim
e fit
ting
user
s’ n
eeds
Amou
nt a
nd su
itabl
e eq
uipm
ent
Tran
spor
tatio
n fa
cilit
ies
for s
w+
Qua
lity
of ro
ad
Will
ingn
ess t
o pa
y
Will
ingn
ess t
o pa
rtic
ipat
e in
so
lutio
ns
Prio
ritie
s for
sw+
Inte
rest
in sw
+
Coor
dina
tion
& co
oper
a-tio
n be
twee
n SU
& S
P++
Supp
ort f
rom
the
cent
ral
gove
rnm
ent
Group Item
Collection, transport and transfer parameter
Collection time fitting users’ needs
1.00
Amount and suitability of equipment
.29* 1.00
Transportation facilities for sw+
.38** .67** 1.00
Quality of road .46** .30* .47** 1.00
City parameter
Willingness to pay .30* .54** .59** .48** 1.00
Willingness to participate in solutions
.30* .49** .37** .01 .33* 1.00
Priorities for solid waste .28 .30* .17 .18 .04 .26 1.00
Interest in solid waste .48** .70** .48** .36* .42** .52** .39** 1.00
Coordination and cooperation between SU & SP++
.39** .55** .29* .43** .46** .47** .18 .70** 1.00
Support from central government
.39** .64** .40** .22 .46** .39** .15 .74** .69** 1.00
+ Solid waste ++ Service Users and Service Provider
The analysis of the data suggests that improving the infrastructure (including roads, increasing the equipment and human resources) has a positive impact on the delivery of the service. But these represent an economic burden for the municipalities. Waste collection, transfer and transport are important but expensive municipal services (Faccio et al., 2011). Generally, they constitute 80–95% of the total budget of solid waste management; hence it forms the key component in determining the economics
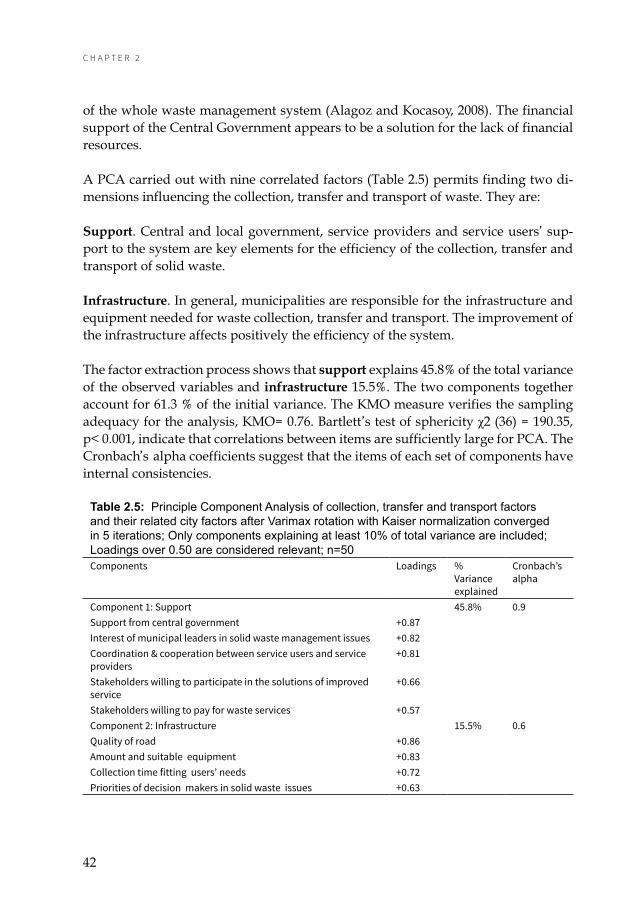
42
C H A P T E R 2
of the whole waste management system (Alagoz and Kocasoy, 2008). The financial support of the Central Government appears to be a solution for the lack of financial resources.
A PCA carried out with nine correlated factors (Table 2.5) permits finding two di-mensions influencing the collection, transfer and transport of waste. They are:
Support. Central and local government, service providers and service users’ sup-port to the system are key elements for the efficiency of the collection, transfer and transport of solid waste.
Infrastructure. In general, municipalities are responsible for the infrastructure and equipment needed for waste collection, transfer and transport. The improvement of the infrastructure affects positively the efficiency of the system.
The factor extraction process shows that support explains 45.8% of the total variance of the observed variables and infrastructure 15.5%. The two components together account for 61.3 % of the initial variance. The KMO measure verifies the sampling adequacy for the analysis, KMO= 0.76. Bartlett’s test of sphericity χ2 (36) = 190.35, p< 0.001, indicate that correlations between items are sufficiently large for PCA. The Cronbach’s alpha coefficients suggest that the items of each set of components have internal consistencies.
Table 2.5: Principle Component Analysis of collection, transfer and transport factors and their related city factors after Varimax rotation with Kaiser normalization converged in 5 iterations; Only components explaining at least 10% of total variance are included; Loadings over 0.50 are considered relevant; n=50Components Loadings %
Variance explained
Cronbach’s alpha
Component 1: Support 45.8% 0.9Support from central government +0.87Interest of municipal leaders in solid waste management issues +0.82Coordination & cooperation between service users and service providers
+0.81
Stakeholders willing to participate in the solutions of improved service
+0.66
Stakeholders willing to pay for waste services +0.57Component 2: Infrastructure 15.5% 0.6Quality of road +0.86Amount and suitable equipment +0.83Collection time fitting users’ needs +0.72Priorities of decision makers in solid waste issues +0.63

43
W A S T E M A N A G E M E N T I N D E V E L O P I N G C O U N T R I E S
Treatment This research finds that fourteen of the investigated sites do not practice composting, while twenty one compost organic waste up to some extent, either at the household level, or by the private sector or the municipality. In relation to domestic burning of waste, it is found that twenty two of the sites report the practice of open burning of waste at the household level with the objective to reduce the volume.
Table 2.6 shows the relations between the level of composting, domestic burning and waste treated before disposal with some city parameters.
Table 2.6: Spearman correlation of waste treatment and city parameters, **=p<0.01 (2 tailed); *=0.05>p>0.01 (2 tailed)
Parameter
Treatment parameter City parameter
Leve
l of
com
post
ing
Leve
l of
dom
estic
bu
rnin
g
Was
te tr
eate
d be
fore
dis
posa
l
Suita
bilit
y of
in
frast
ruct
ure
Lead
ers i
nter
est
in e
nviro
nmen
t
Effic
ienc
y of
m
unic
ipal
m
anag
emen
t
Group Item
Treatment parameter
Level of composting 1.00
Level of domestic burning
.39** 1.00
Waste treated before disposal .24 -.11 1.00
City parameter
Suitability of infrastructure .33* -.32* .29* 1.00
Leaders interest in environment
.20 -.28 .33* .52** 1.00
Efficiency of municipal management
.14 -.40** .29* .55** .52** 1.00
Local knowledge .35** 0-.06 -.01 -.10 -.09 -.16
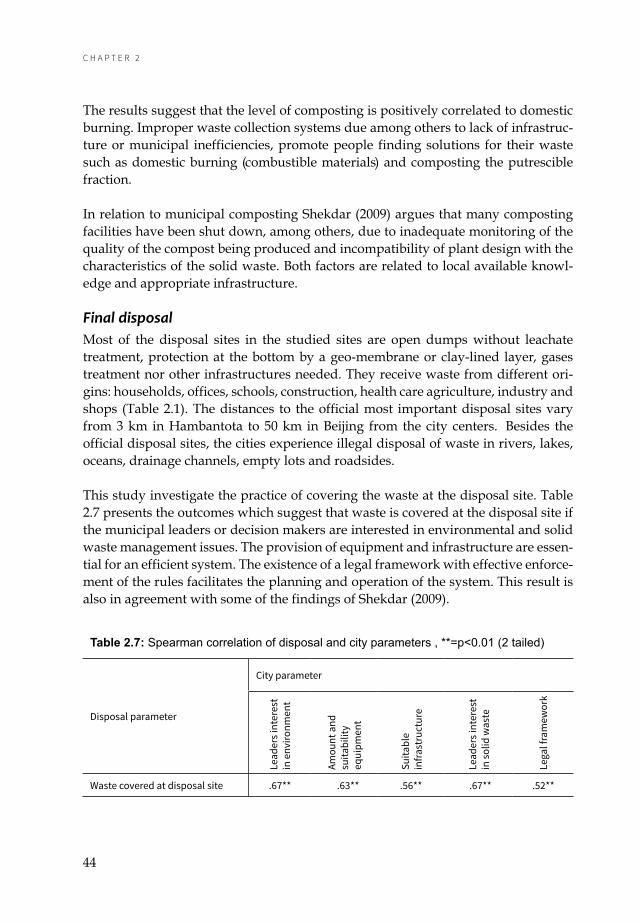
44
C H A P T E R 2
The results suggest that the level of composting is positively correlated to domestic burning. Improper waste collection systems due among others to lack of infrastruc-ture or municipal inefficiencies, promote people finding solutions for their waste such as domestic burning (combustible materials) and composting the putrescible fraction.
In relation to municipal composting Shekdar (2009) argues that many composting facilities have been shut down, among others, due to inadequate monitoring of the quality of the compost being produced and incompatibility of plant design with the characteristics of the solid waste. Both factors are related to local available knowl-edge and appropriate infrastructure.
Final disposal Most of the disposal sites in the studied sites are open dumps without leachate treatment, protection at the bottom by a geo-membrane or clay-lined layer, gases treatment nor other infrastructures needed. They receive waste from different ori-gins: households, offices, schools, construction, health care agriculture, industry and shops (Table 2.1). The distances to the official most important disposal sites vary from 3 km in Hambantota to 50 km in Beijing from the city centers. Besides the official disposal sites, the cities experience illegal disposal of waste in rivers, lakes, oceans, drainage channels, empty lots and roadsides.
This study investigate the practice of covering the waste at the disposal site. Table 2.7 presents the outcomes which suggest that waste is covered at the disposal site if the municipal leaders or decision makers are interested in environmental and solid waste management issues. The provision of equipment and infrastructure are essen-tial for an efficient system. The existence of a legal framework with effective enforce-ment of the rules facilitates the planning and operation of the system. This result is also in agreement with some of the findings of Shekdar (2009).
Table 2.7: Spearman correlation of disposal and city parameters , **=p<0.01 (2 tailed)
Disposal parameter
City parameter
Lead
ers i
nter
est
in e
nviro
nmen
t
Amou
nt a
nd
suita
bilit
y eq
uipm
ent
Suita
ble
infra
stru
ctur
e
Lead
ers i
nter
est
in so
lid w
aste
Lega
l fra
mew
ork
Waste covered at disposal site .67** .63** .56** .67** .52**
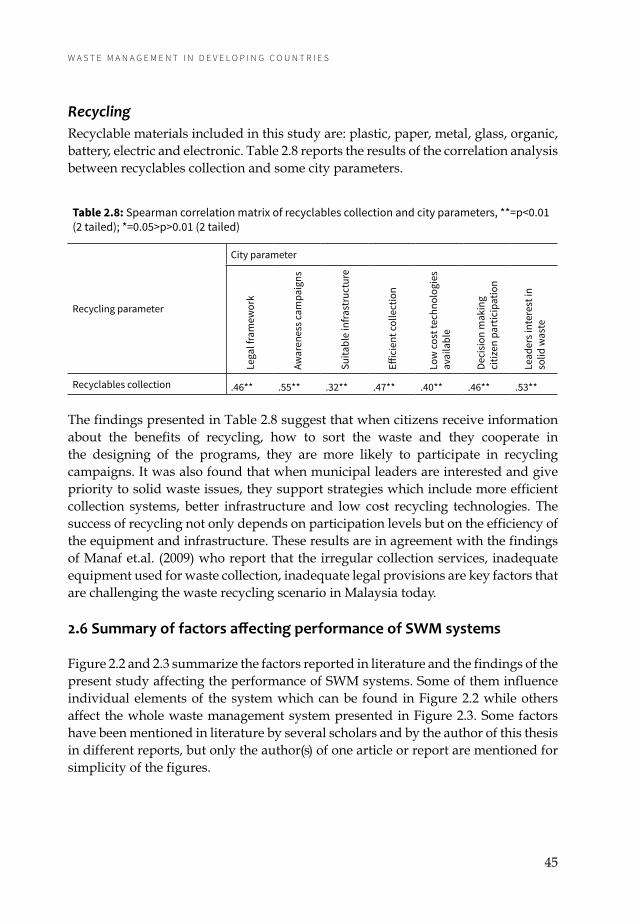
45
W A S T E M A N A G E M E N T I N D E V E L O P I N G C O U N T R I E S
RecyclingRecyclable materials included in this study are: plastic, paper, metal, glass, organic, battery, electric and electronic. Table 2.8 reports the results of the correlation analysis between recyclables collection and some city parameters.
Table 2.8: Spearman correlation matrix of recyclables collection and city parameters, **=p<0.01 (2 tailed); *=0.05>p>0.01 (2 tailed)
Recycling parameter
City parameterLe
gal f
ram
ewor
k
Awar
enes
s cam
paig
ns
Suita
ble
infra
stru
ctur
e
Effic
ient
colle
ctio
n
Low
cost
tech
nolo
gies
av
aila
ble
Deci
sion
mak
ing
citiz
en p
artic
ipat
ion
Lead
ers i
nter
est i
n so
lid w
aste
Recyclables collection .46** .55** .32** .47** .40** .46** .53**
The findings presented in Table 2.8 suggest that when citizens receive information about the benefits of recycling, how to sort the waste and they cooperate in the designing of the programs, they are more likely to participate in recycling campaigns. It was also found that when municipal leaders are interested and give priority to solid waste issues, they support strategies which include more efficient collection systems, better infrastructure and low cost recycling technologies. The success of recycling not only depends on participation levels but on the efficiency of the equipment and infrastructure. These results are in agreement with the findings of Manaf et.al. (2009) who report that the irregular collection services, inadequate equipment used for waste collection, inadequate legal provisions are key factors that are challenging the waste recycling scenario in Malaysia today.
2.6 Summary of factors affecting performance of SWM systems
Figure 2.2 and 2.3 summarize the factors reported in literature and the findings of the present study affecting the performance of SWM systems. Some of them influence individual elements of the system which can be found in Figure 2.2 while others affect the whole waste management system presented in Figure 2.3. Some factors have been mentioned in literature by several scholars and by the author of this thesis in different reports, but only the author(s) of one article or report are mentioned for simplicity of the figures.
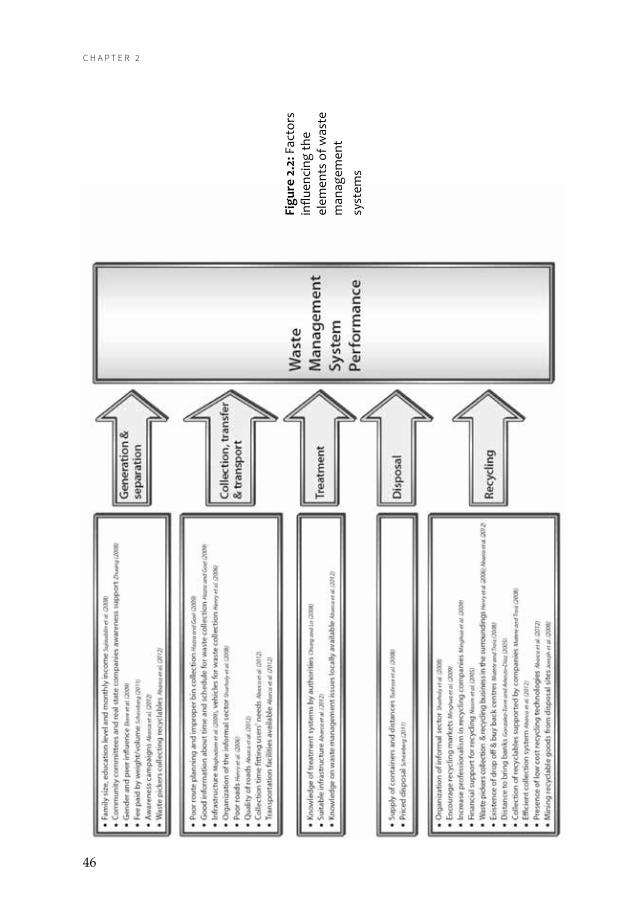
46
C H A P T E R 2
Figu
re 2
.2: F
acto
rs
influ
enci
ng th
e el
emen
ts o
f was
te
man
agem
ent
syst
ems
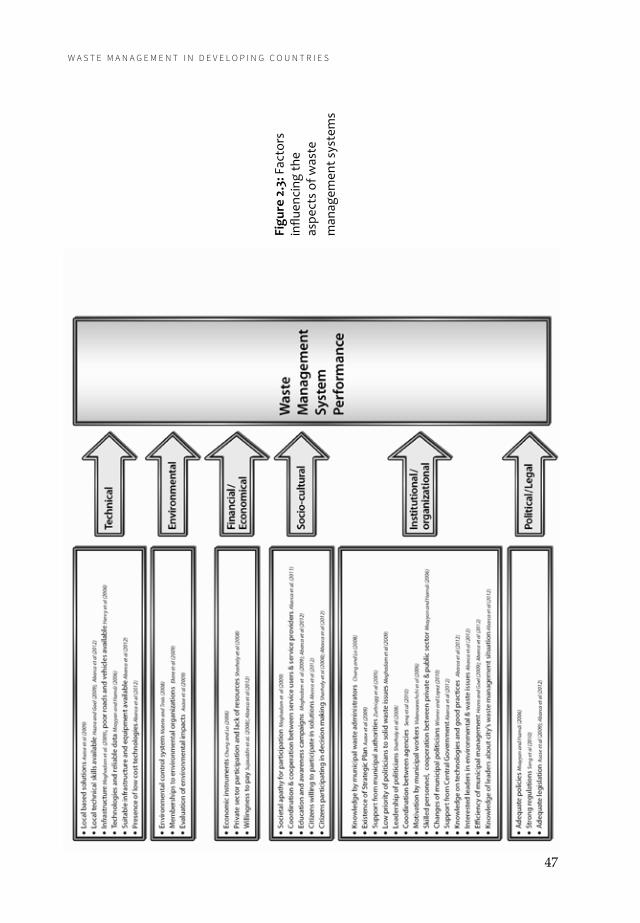
47
W A S T E M A N A G E M E N T I N D E V E L O P I N G C O U N T R I E S
Figu
re 2
.3: F
acto
rs
influ
enci
ng th
e as
pect
s of
was
te
man
agem
ent s
yste
ms
48
C H A P T E R 2
2.7 ConclusionsThe author recognizes various stages of waste management systems within the de-veloping world. The countries are at different levels defined by their own priorities for the implementation of an effective and efficient system. According to Wilson (2007) the priorities clearly established by developed countries are: public health, environmental protection, resource value of waste and climate change. At present the priorities are public concern and awareness; and moving from the concept of ‘end-of-pipe’ waste management towards a more holistic resource management. On the contrary, developing countries are still struggling to set up waste management systems for the improvement of public health and environmental protection. Some countries in the developing world have made important steps towards recycling or valorisation of waste and climate change.
During this study, it was found that the studied cities are a mixture of cultures and so is the variety of solid waste management systems. The outcome of this analyti-cal research provides a comprehensive analysis on stakeholders. Moreover, it offers some key factors affecting waste management systems in developing countries.
The key findings are outlined below:
Waste management involves a large number of different stakeholders, with differ-ent fields of interest. They all play a role in shaping the system of a city, but often it is seen only as a responsibility of the local authorities. In the best of the cases, the citizens are considered co-responsible together with the municipality. Detailed un-derstandings on who the stakeholders are and the responsibilities they have in the structure are important steps in order to establish an efficient and effective system. Communication transfer between the different stakeholders is of high importance in order to get a well-functioning waste management system in the cities.
In many developing countries, waste pickers, though being informal, are an integral part of the waste management systems. They make significant environmental, so-cial and economic contributions. The recognition and integration of these informal workers into formal systems should take into account public policies, association models, capacity development, business approaches, social recognition, and alike. The actions to be taken are country specific.
Solid waste management is a complex issue due to the variety of factors affecting it. Municipalities in general seek for equipment as a path to find solutions to the di-versity of problems they face. This study shows that an effective system is not only based in technological solutions but also environmental, socio cultural, legal, insti-tutional and economic linkages that should be present to enable the overall system to function.
49
W A S T E M A N A G E M E N T I N D E V E L O P I N G C O U N T R I E S
Solid waste services have a cost as any other services provided but in general the expenditures are not recovered. Resources are required with the objective of having skilled personnel, appropriate equipment, right infrastructure, proper maintenance and operation. The financial support of the central government, the interest of the municipal leaders in waste management issues, the participation of the service users and the proper administration of the funds are essential for a modernized sustain-able system.
Fundamental is to produce reliable data and to create proper information channels within and between municipalities. Governmental leaders, responsible for planning and policy making, need to be well informed about the situation of the cities in or-der to make positive changes, developing integrated waste management strategies adapted to the needs of the citizens considering their ability to pay for the services.
Universities, research centers and centers of excellence have a very important role in preparing professionals and technicians in environmental fields, including waste management. Some developing countries have already seen the positive effects of investing in education and research by having cleaner cities, citizens assuming their responsibilities and higher status of solid waste workers.
The questionnaire prepared to structure and collect information enabled to develop a snap shot or baseline information on what is happening in the city (Appendix 2.4). It is relatively easy to use, applicable for urban and rural settings and can be applied by people with different education levels.
The information provided about the factors influencing solid waste management systems is very useful. It can be used by any individual or organization interested in planning, changing or implementing a waste management system in a city. Ad-ditionally, it gives valuable information for the analysis of waste management of specific flows of materials such as construction waste.
50
C H A P T E R 2
References
Abarca-Guerrero L., 1995. Integrated Solid Waste Management in two municipalities in Ecuador. Mission Report for Deutsche Ge-sellschaft für Technische Zusammenarbeit.
Abarca Guerrero L., 2007, 2008a, 2009b. In-tegrated Solid Waste Management in Gazipur, Bangladesh. Mission Reports for WASTE. IS-SUE 2 Program.
Abarca-Guerrero L., 2008b, 2009d, 2010d. In-tegrated Solid Waste Management in Managua. Mission Reports for WASTE. ISSUE 2 Pro-gram.
Abarca-Guerrero L., 2008c, 2009f, 2010f. Inte-grated Solid Waste Management in Cañete. Mis-sion Reports for WASTE. ISSUE 2 Program.
Abarca-Guerrero L., 2008f, 2009g. Integrated Solid Waste Management in Paramaribo. Mis-sion Reports for WASTE. ISSUE 2 Program.
Abarca-Guerrero L., 2008g. Integrated Solid Waste Management in Asidonhopo. Mission Re-ports for WASTE. ISSUE 2 Program.
Abarca Guerrero L., 2009a. Integrated Solid Waste Management in four municipalities in South Africa. Mission Report for VNG Inter-national. ‘s-Gravenhage: Co-operation Agen-cy of the Association of Netherlands Munic-ipalities.
Abarca Guerrero L., 2009c, 2010b Integrated Solid Waste Management in two municipalities in Indonesia. Mission Report for VNG Inter-national. ‘s-Gravenhage: Co-operation Agen-cy of the Association of Netherlands Munic-ipalities.
Abarca-Guerrero L., 2009e, 2010e. Integrated Solid Waste Management in Masaya, Nicara-gua. Mission Report for VNG International. ‘s-Gravenhage: Co-operation Agency of the Association of Netherlands Municipalities.
Abarca Guerrero L., 2010a. Integrated Solid Waste Management in Timphu, Bhutan. Mis-sion Reports for UNDP. PPP-ISWM Program.
Abarca Guerrero L., 2010c. Integrated Solid Waste Management in three municipalities in Turkey. Mission Report for WASTE and Roy-al Haskoning for project “Technical Assis-tance and Provision of Supervision Services for the Implementation of Three Solid Waste Management Projects in Amasya, Bitlis and Kütahya in Turkey. EU funded project.
Abarca L., Maas, G., Hogland, W., 2012. Fac-tors influencing the performance of waste management systems. In: Proceedings ISWA World Solid Waste Congress. Florence, Italy, 17-19 September 2012.
Abarca-Guerrero L, Nava BI., 2003.Voluntad de pago y plan de manejo de desechos en la comunidad de Tuis, Turrialba. Tecnologia en Marcha, 16(3), pp.92-101.
Abarca, L., Rudin, V., vd Berg, S., 2013. Oper-ational guide for mainstreaming gender in inclu-sive recycling projects and programmes. Frame-work of the Regional Initiative for Inclusive Recycling. Inter-American Development Bank, FOMIN & INE/WSA.
Alagoz, A.Z., Kocasoy, G., 2008. Improve-ment and modification of the routing sys-tem for the health-care waste collection and transportation in Istanbul. Waste Management
51
W A S T E M A N A G E M E N T I N D E V E L O P I N G C O U N T R I E S
Journal, 28(8), 1461–1471.
Anschütz, J., Ijgosse, J. and Scheinberg, A., 2004. Putting ISWM to Practice. Gouda: WASTE.
Asase, M., Yanful, E.K., Mensah, M., Stan-ford, J., Amponsah, S., 2009. Comparison of municipal solid waste management systems in Canada and Ghana: A case study of the cit-ies of London, Ontario, and Kumasi, Ghana. Waste Management Journal, 29(10), pp.2779-2786.
Burntley, S.J., 2007. A review of munici-pal solid waste composition in the United Kingdom. Waste Management Journal, 27(10), pp.1274–1285.
Chung S., Lo, C., 2008. Local waste manage-ment constraints and waste administrators in China. Waste Management Journal, 28(2), pp.272-281.
CIA (Central Intelligence Agency), 2010. The world factbook 2010. Washington, DC. Avail-able at: <http://cia.gov.library.publications.the-world-factbook> [Accessed 21 February 2011].
Ekere, W., Mugisha, J., Drake, L., 2009. Fac-tors influencing waste separation and utiliza-tion among households in the Lake Victoria Crescent, Uganda. Waste Management Journal, 29(12), pp.3047–3051.
European Council, 1991, Council Direc-tive 75/442/EEC modified by Directive 91/156/EEC on waste. Available at: <http://eur-lex.europa.eu/smartapi/cgi/sga_doc? smartapi!celexapi!prod!CELEXnumdoc&lg= EN&numdoc=31991L0156&model=guichett > [Accessed 2 December 2011].
Faccio, M., Persona, A., Zanin, G., 2011. Waste collection multi objective model with real time traceability data. Waste Management Journal, 31(12), pp.2391-2405.
Field, A.P., 2009. Discovering statistics using SPSS. 3rd ed. London: Sage.
Fortune, J., White, D., 2006. Framing of pro-ject critical success factors by a systems mod-el. International Journal of Project Management, 24(1), pp.53–65.
Geng, Y., Zhu, Q., Doberstein, B., Fujita, T., 2009. Implementing China’s circular econo-my concept at the regional level: A review of progress in Dalian, China. Waste Management Journal, 29(2), pp.996-1002.
Global Footprint Network. Footprint Science: Data and results. Oakland, California, USA, 2010. Available at: <http:footprintnetwork.org.en.index.php.GFN.page.glossary> [Ac-cessed 22 November 2010].
Gonzalez-Torre, P.L., Adenso-Diaz, B., 2005. Influence of distance on the motivation and frequency of household recycling. Waste Management Journal, 25(1), pp.15–23.
Gunsilius, E., Chaturvedi, B., Scheinberg, A., 2011. The economics of the informal sector in sol-id waste management. Collaborative Working Group on Solid Waste Management in low and middle income Countries. Deutsche Ge-sellschaft für Internationale Zusammenarbeit GmbH.
Hawkins, G., 2006. The ethics of waste. How to relate to rubbish. Maryland: Rowman & Little-field Publishers, Inc.
52
C H A P T E R 2
Hazra, T., Goel, S., 2009. Solid waste man-agement in Kolkata, India: Practices and challenges. Waste Management Journal, 29(1), pp.470–478.
Henry, R.K., Yongsheng, Z., Jun, D., 2006. Municipal solid waste management chal-lenges in developing countries – Kenyan case study. Waste Management Journal, 26(1), pp.92–100.
Hogland, W., 2013. Discussion on waste man-agement issues. Linnaeus University. Personal communication.
ISSOWAMA Consortium, 2009. Integrated Sustainable Solid Waste Management in Asia. Seventh Framework Programme. European Commission.
Jaworski, J.,. B.S. Flowers ed., 1996. Synhronic-ity: the inner path of leadership. California: Ber-rett-Koehler Publishers, Inc.
Joseph, K., Nagendran, R., Thanasekaran, K., Visvanathan, C., Hogland, W., 2008. Dumping site rehabilitation manual. Centre for Environ-mental Studies, Anna University, Chennai, India.
Kaiser, H.F., 1974. An index of factorial sim-plicity. Psychometrika, 39, pp.401-415.
Leidecker, J., Bruno, S.V., 1984. Identifying and using critical success factors. Long Range Planning, 17(1), pp.23-32.
Manaf, L. A., Samah, M.A.A., Zukki, N.I.M., 2009. Municipal solid waste management in Malaysia: Practices and challenges. Waste Management Journal, 29(11), pp.2902–2906.
Marshall, R.E., Farahbakhsh, K., 2013. Sys-
tems approaches to integrated solid waste management in developing countries. Waste Management Journal, 33(4), pp.988-1003.
Matell, M.S., Jacoby, J., 1971. Is there an op-timal number of alternatives for Likert scale items? I. Reliability and validity. Educational and Psychological Measurement, 31(3), pp.657-674.
Matete, N., Trois, C., 2008. Towards Zero Waste in emerging countries – A South Af-rican experience. Waste Management Journal, 28(8), pp.1480–1492.
Minghua, Z., Xiumin, F., Rovetta, A., Qichang, H., Vicentini, F., Bingkai, L., Giusti, A., Yi, L. 2009. Municipal solid waste man-agement in Pudong New Area, China. Waste Management Journal, 29(3), pp.1227–1233.
Moghadam, M.R.A., Mokhtarani, N., Mokhtarani, B., 2009. Municipal solid waste management in Rasht City, Iran. Waste Man-agement Journal, 29(1), pp.485–489.
Mrayyan, B., Hamdi, M.R. 2006. Manage-ment approaches to integrated solid waste in industrialized zones in Jordan: A case of Zarqa City. Waste Management Journal, 26(2), pp.195–205.
Müller, M.S., Iyer, A., Keita, M., Sacko, B., Traore D., 2002. Different interpretations of community participation in waste manage-ment. in Bamako and Bangalore: some meth-odological considerations. Environment and Urbanization, 14(2), pp.241-258.
Müller, M.S., Scheinberg, A., 2002. Gen-der linked livelihoods from modernizing the waste management recycling sector: a framework for analysis and decision mak-
53
W A S T E M A N A G E M E N T I N D E V E L O P I N G C O U N T R I E S
ing. Gender and waste economy. Vietnamese and international experiences. CIDA funded project.
Nissim, I., Shohat, T., Inbar, Y., 2005. From dumping to sanitary landfills – solid waste management in Israel. Waste Management Journal, 25(3), pp.323–327.
OECD (Organisation for Economic Co-op-eration and Development), 1994, Decisions of the Council on the reduction of transfrontier movements of wastes. 27 May 1988C(88)90/Final amendment on 28th – 29th July 1994-C(94)152/FINAL. Available at: <http://acts.oecd.org/Instruments/ShowInstrument-View.aspx?InstrumentID=64&Lang=en&-Book=False> [Accessed 2 December 2011].
Pokhrel, D., Viraraghavan, T., 2005. Munici-pal solid waste management. in Nepal: prac-tices and challenges. Waste Management Jour-nal, 25(5), pp.555–562.
Pongrácz, E., Pohjola, V.J., 2004. Re-defining waste, the concept of ownership and the role of waste management. Resources, conservation and recycling, 40(2), pp.141-153.
Rockart, J.F., 1997. Chief executives de-fine their own data needs. Harvard Bus Rev, (March–April), pp.81–93.
Scheinberg, A., 2011. Value added: Modes of sustainable recycling in the modernisation of Waste Management. systems. Ph.D. Wagenin-gen University, Netherlands.
Scheinberg, A., Wilson, D.C., Rodic, L., 2010. Solid Waste Management. in the World’s Cities. UN-Habitat’s Third Global Report on the State of Water and Sanitation in the World’s Cities. New-castle-upon-Tyne: EarthScan.
Scheinberg, A., Spies, S., Simpson, M.H., Mol A.P.J., 2011. Assessing urban recycling in low-and-middle income countries: Building on modernized mixtures. Habitat International, 35(2), pp.188-198.
Seng, B., Kaneko, H., Hirayama, K., Katay-ama-Hirayama, K., 2010. Municipal solid waste management. in Phnom Penh, capital city of Cambodia. Waste Management. & Re-search, 29(5), pp.491–500.
Sharholy, M., Ahmad, K., Vaishya, R.C., Gup-ta, R.D., 2007. Municipal solid waste char-acteristics and management in Allahabad, India. Waste Management Journal, 27(4), pp.490–496.
Sharholy, M., Ahmad, K., Mahmood, G., Trivedi, R.C., 2008. Municipal solid waste management. in Indian cities. A review. Waste Management Journal, 28(2), pp.459–467.
Shekdar, A., 2009. Sustainable solid waste management: An integrated approach for Asian countries. Waste Management Journal, 29(4), pp.1438–1448.
Sujauddin, M., Huda, M.S., Rafiqul Hoque A.T.M., 2008. Household solid waste char-acteristics and management in Chittagong, Bangladesh. Waste Management Journal, 28(9), pp.1688-1695.
Tadesse, T., Ruijs, A., Hagos, F., 2008. House-hold waste disposal in Mekelle city, Northern Ethiopia. Waste Management Journal, 28(10), 2003–2012.
Tai, J., Zhang, W., Che, Y., Feng, D., 2011. Mu-nicipal solid waste source-separated collec-tion in China: A comparative analysis. Waste Management Journal, 31(8), pp.1673–1682.
54
C H A P T E R 2
Tchobanoglous, G., Theisen, H., Vigil, S.A., 1993. Integrated solid waste management. Engi-neering principles and management issues. Sin-gapore: McGraw Hill, Inc.
UN (United Nations), 2007. UN data: A world of information. Data CO2 emissions. New York, USA. Available at: <http:data.un.org.Data.aspx?q=CO2+emissions&d=MDG&f=series-RowID%3a751> [Accessed 14 March 2011].
UNSD (United Nations Statistics Division), 1997. Glossary of Environment Statistics. Avail-able at: <http://unstats.un.org/unsd/envi-ronmentgl> [Accessed 12 September 2013].
USEPA (USA Environmental Protection Agency), 2010. Wastes - hazardous waste. Washington, DC. Available at: <http:epa.gov.osw.hazard> [Accessed 21 February 2011].
Vidanaarachchi, C.K., Yuen, S.T.S., Pilapiti-ya, S., 2006. Municipal solid waste manage-ment. in the Southern Province of Sri Lanka: Problems, issues and challenges. Waste Man-agement Journal, 26(8), pp.920–930.
WASTE. 2004. Integrated Sustainable Waste Management. Available at: <http:waste.nl, click on ISWM under “Approaches”>. [Ac-cessed 01 March 2010].
WB (World Bank), 2010. Data Catalogue. Washington, DC, USA. Available at: <http:.data.worldbank.org.indicators> [Accessed 06 March 2011].
WHO (World Health Organisation), 2010a. World Health Statistics. Indicator Compendi-um, Interim Report. Available at: <http:who.int.healthinfo.statistics.indneonatalmortality.en> [Accessed 01 January 2010].
WHO (World Health Organisation), 2010b. Health topics. Life expectancy. Washington, DC, USA. Available at: <http:who.int.topics.life_expectancy.en> [Accessed 01 October 2010].
WHO (World Health Organisation), 2010c. Health care waste management. Washington, DC, USA. Available at: <http:healthcare-waste.org.en.115_overview.html> [Accessed 01 October 2010].
WHO (World Health Organisation), 2010d. Neonatal and perinatal mortality. Country, re-gional and country estimates. Washington, DC, USA. Available at: <http:.whqlibdoc.who.int.publications.2006.9241563206_eng.pdf> [Ac-cessed 02 March 2011].
Wilson, D.C., Araba, A., Chinwah, K., Chee-seman, C.R., 2009. Building recycling rates through the informal sector. Waste Manage-ment Journal, 29(2), pp.629-635.
Zhuang, Y., Wu, S.W., Wang, Y.L., Wu, W.Z., Chen, Y.X., 2008. Source separation of house-hold waste: A case study in China. Waste Management Journal, 28(10), pp.2022–2030.
Zuilen, L.F., 2006. Planning of an integrated solid waste management. system in Suriname: A case study in Greater Paramaribo with focus on households. PhD Thesis. Ghent University, Belgium.
Zurbrügg, C., Drescher, S., Rytz, I., Sinha, M., Enayetullah, I., 2005. Decentralised compost-ing in Bangladesh, a win-win situation for all stakeholders. Resources, Conservation and Re-cycling, 43(3), pp.281-292.
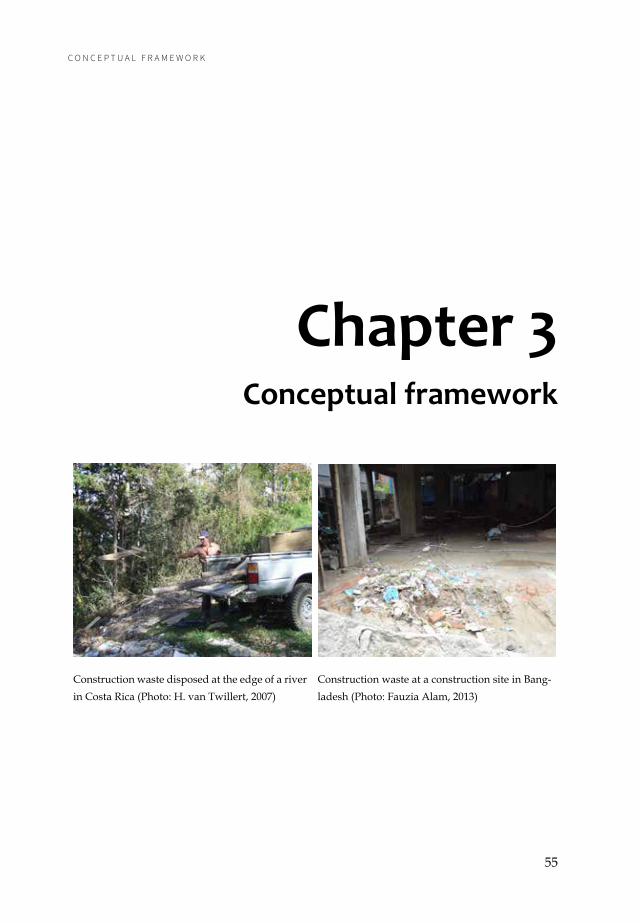
55
C O N C E P T U A L F R A M E W O R K
Chapter 3Conceptual framework
Construction waste disposed at the edge of a river
in Costa Rica (Photo: H. van Twillert, 2007)
Construction waste at a construction site in Bang-
ladesh (Photo: Fauzia Alam, 2013)
56
C H A P T E R 3
“The intention and the result of a scientific enquire is to obtain an understanding and a control of some part of the universe. No substantial part of the universe is so simple that it can be grasped and controlled without abstraction. Abstraction consists in replacing that part of the universe under consideration by a model of similar but simpler structure” (Rosenblueth and Wiener, 1945, p. 316).
57
C O N C E P T U A L F R A M E W O R K
3. Conceptual framework4
3.1 IntroductionDuring the study on municipal waste management (Chapter 2) it is observed the big amounts of construction waste are produced in developing countries. At the same time it is recognized the important role of the construction industry in supporting a world of continuing population growth and social and economic development. Consequently, the twentieth century witnessed an increase in infrastructural invest-ments (e.g. highways, dams, power plants, pipelines, and railways). Simultaneously, the construction industry has to comply with a growing number of environmental rules and regulations but also it is expected to proactively internalize environmental performance in a way similar to that of other industries (Horvath, 2004).
The construction industry is perceived as a major contributor to environmental deg-radation. Tthe construction and operation of the built environment worldwide is es-timated to account for: 12-16% of fresh water consumption, 25% of wood harvested, 30-40% of energy consumption, 40% of virgin materials extracted (Macozoma, 2002), up to 57% solid waste generation ending up in disposal sites (Table 1.1), noise, dust and gas emissions (Lu and Yuan, 2011), 20-30% of greenhouse emissions, up to 15% of purchased materials at jobsite ending up as waste, change of land use, including clearing of existing flora, other indoor and outdoor emissions, aesthetic degrada-tion, opportunities for corruption, disruption of communities, including through inappropriate design and materials and health risks on worksites and for building occupants (UNEP, 2003).
Building construction has traditionally been a linear progression consisting of in-puts (e.g. raw materials) and outputs (e.g. waste). This approach assumes that there is an unlimited supply of resources that provide inputs for the process, and that there is a bottomless pit that absorbs the outputs (Macozoma, 2002). Nevertheless, material waste is recognized as a major problem in the construction industry which has important implications both for the efficiency of the industry and for the envi-ronmental impact of construction projects (Formoso, et al., 2002).
It is reported in literature that five high income countries, Hong Kong, Australia, United States of America, United Kingdom and Sweden, have contributed the most towards construction and demolition (C&D) waste studies. This indicates to a large extent that this topic is higher on the research agenda in more developed countries compared with that in the developing world (Yuan and Shen, 2011). On the contra-ry, developing countries are characterized by poor information systems, inadequate and inaccurate data, especially those related to the construction activity. Reasons for
4 In process of publication Waste Management Journal
58
C H A P T E R 3
the lag of waste management research may be multiple, such as: lack of funding, shortage of skilled personnel, absence of regulations, lower awareness for perform-ing construction waste management in the construction sector, less pressure of land resources used for construction waste disposal, and others (Kofoworola and Ghee-wala, 2009; Yuan and Shen, 2011).
In an effort to bridge some of these gaps, the objective of this chapter is to develop a model, based on principles provided by literature. The goal is to unveil the major factors affecting the performance and efficiency of the construction process during the realization stage, taking into account environmental considerations. Two stages are proposed: 1. to examine some industrial productive efficiency models or tools that explain the success in producing as large as possible an output (e.g. dwelling) from a set of given inputs (e.g. construction materials) (Farrell, 1957); and 2. to con-struct a model that allows determining the key factors affecting the use of construc-tion materials and the causes of construction waste generation.
The conceptual model constructed would allow answering sub-question 3:
Which are the key factors underlying the efficient5 use of construction materials and its impact6 on the generation of construction waste during the realization of a building?
3.2 Construction industry in developing countriesThe construction industry contributes to a significant percentage of the Gross Do-mestic Product (GDP) in developing countries, providing employment to a substan-tial portion of the working population (Ngowi, 2002). In those countries, this sector consists overwhelmingly of micro, small and medium-sized enterprises (MSMEs), or more accurately ‘micro firms’ with ten or fewer employees (UNEP, 2003).
Thomas (2002) states that in most of the developing countries, the construction tech-nologies do not meet the functional requirements set for the construction industry in general. There is a contradictory situation of a long history of traditional construc-tion from locally available materials and a rich stock of recent construction-related research and development results which are not put into practice. There is a lack of development of basic simple equipment and often there are few qualified equip-ment operators. The organizational structure is rather diffuse; activities are carried out on an ad-hoc basis. Material components are typically sized to facilitate manual handling because smaller construction equipment like forklifts and rough terrain cranes are almost nonexistent. Fabrication facilities are limited. Masonry units and batching of concrete is done on site. Additionally, developing countries are char-
5 In process of publication Waste Management Journal6 Impact: effect
59
C O N C E P T U A L F R A M E W O R K
acterized by a lack of resources and expertise, slow response to the environmental impact of the activity (Ofori, 2000) and insufficient communication structure (van Egmond, 1999).
Hartkopf, et al., (2009) report that a growing amount of private clients are choosing to bypass general contractors and the more formal procedures for awarding con-tracts, in favor of buying materials and managing the process themselves, while engaging directly with informal sector enterprises to supply labor. This “informal sector has been analyzed by Wells (2012) in which she defines informality as ab-sence of regulations. She states that the construction activity is subject to a number of different spheres of regulation. She develops four spheres as follows: Firstly, in terms of conditions of employment for the construction workers. Labor legislation protects a tiny minority of workers and in countries which previously covered a bigger number of workers; recently they are avoiding the high on-costs associated with registering workers. They do this by engaging workers on a casual basis or by outsourcing their labor supply. Secondly, in terms of enterprises that are involved in production, notably contractors, subcontractors and material suppliers. In most countries, every enterprise must have a license to engage in economic activities, but literature reports the absence of registered organizations participating in the activ-ity. Thirdly, regulation comprises the rules, regulations and agreed procedures for the organization of the construction process. The various steps include the hiring of architects and engineers to design the product, formal procedures for the appoint-ment of construction contractors and sub-contractors and the use of contracts to set up responsibilities. However, there is an alternative way of organizing production, with fewer participant, more flexible arrangements and less dependence on contract that are enforceable by law. Fourthly is the regulation related to the product. In most countries, planning permits are generally required for new construction. Building plans have to be submitted and approved before construction begins and the final structure inspected. However, in many countries these regulations are only partially applied or not applied at all.
The construction industry is consistently ranked as one of the most corrupt: large payments to gain or alter contracts and circumvent regulations are common. The impact of corruption goes beyond bribe payments to poor quality construction of buildings or infrastructure and low funding for maintenance –and this is where the major impact of corruption is felt (Kenny 2007). A recent example is the disaster in Bangladesh’s garment industry, in which a building collapsed killing more than one thousand workers due to extremely poor quality iron rods and cement (The Telegraph, 2013).
60
C H A P T E R 3
Considerable quantities of construction waste are annually generated globally and developing countries are not an exception. Studies from Costa Rica reported the following amounts per built area (m2): 11-25 kg/m2 (Villalobos, 1995), 300-700 kg/m2
(Ramirez-Cartin, 1995) and 115 kg/m2 (Leandro, 2007).
Material resources constitute a large portion of a project’s total costs and according to different authors the loss of materials are the result of inefficient production prac-tices (Thomas, et al., 2005). This statement brings to the research question: which are the key factors affecting the efficient use of construction materials and its impact on the generation of construction waste during the procurement of a building?
In order to answer the question, some existing models and tools that could assist in understanding the efficiency of the industrial sector are examined. They are: 1. In-dustrial Organization, 2. Competitive Strategy, 3. Environmental Economics, 4. Eco-logical Economics, 5. Life Cycle Assessment, 6. Industrial Ecology and 7. Industrial Metabolism.
3.3 Industrial Productive Efficiency ModelsSome of those models are concerned with efficiency measured in financial terms ig-noring the production of pollution (Murty, et al., 2006), while others recognize envi-ronmental issues. The models or tools chosen are explained in the following section.
In early years industrial efficiency has received research from economic disciplines while at present, environmental models and tools have been included. Some of those are:
1. Industrial Organization2. Competitive Strategy3. Environmental Economics4. Ecological Economics5. Life Cycle Assessment6. Industrial Ecology 7. Industrial Metabolism
Industrial Organization Industrial Organization and Competitive Strategy models are interested in finding correlations between the characteristics of the industry and the propensity of the sector to be efficient but also adopting environmental approaches to their produc-tion. Industrial Organization focusses specifically on the characterization of market structure, its determinants and implications. However, the Industrial Organization economists are not generally curious about how market structure shapes the envi-ronmental behavior of industries. In fact, many economists would be more inclined
61
C O N C E P T U A L F R A M E W O R K
to ask how environmental regulations and related pressures affect market structure and firm behavior because environmental concerns are seen as exogenous, as an ex-ternal factor (potentially) distorting industry structure and behavior (Lifset, 1997a).
Competitive StrategyPorter (1980) introduces Competitive Strategy. It considers the same issues as In-dustrial Organization but the tools are used to determine how firms can improve their bottom line. The competitive advantage is defined in terms of relative cost and relative prices, thus linking it directly to profitability and environmental issues are not taken into consideration.
Environmental Economics Environmental Economics, during the 70’s, make an important contribution to the understanding of the interaction between human activities and the environment (Freeman, et al., 1973), albeit from a financial rather than a physical point of view. One of the aims of this science is the quantification of tariffs, taxes, and costs or ben-efits that are related to specific environment-related measures. A general character-istic is that environmental economics usually use highly aggregated models, which do not include process characteristics and physical laws in their models (Lambert, 2008a).
Ecological Economics Ecological Economics, on the contrary, connects economic theory with physical laws, particularly mass conservation, energy conservation and increase of disorder. This branch of economic science considers matter and energy, rather than labor and cap-ital, as basic production factors of any economic system (Boulding, 1966; Lawton, 1999).
Life Cycle Assessment Life Cycle Assessment (LCA) is a well-developed international and standardized tool of the series ISO 14040. It is aimed at quantifying various selected aspects of environmental impact of a product or a material in the course of its complete life-cy-cle, which is meant from cradle to grave (Guinée, et al., 1993a,b). But a drawback is that it does not include a complete mass balance, but is confined to a restricted set of environmental impact classes and it does not deal in a natural way with recycling and exchange of materials between various production chains (Tillman et al., 1994).
Industrial Ecology Industrial Ecology is an interdisciplinary system approach to environmental prob-lems arising from industrial activities (Evan, 1974). It is a model based on adapta-tions of ecosystem behaviors to human activities. Its focus is on depletion of natural
62
C H A P T E R 3
resources, impact on human well-being, and impact on life. It examines the rela-tionship between technological societies and the environment through the lenses of the flow of material and products (Gupta and Lambert, 2008). This model receives useful perspectives from Industrial Organization and Competitive Strategy by pro-viding a framework for examining the factors that shape environmental practices and outcomes at scales beyond the individual firms (Lifset, 1997b; Rajeski, 1997).
Industrial Metabolism Industrial Metabolism is introduced by Ayres and Simonis (1994) inspired by In-dustrial Ecology ideas. They define it as the whole integrated collection of physical processes that convert raw materials, plus labor, into finished products and wastes in a (more or less) steady-state (Janssen, et al., 2001; Lambert, 2008b). It uses Material Flow Analysis (MFA) as a tool to follow the materials from consumption to the final disposal in the environment (Brunner, 2004).
This concept of Industrial Metabolism is useful to analyze material flows in industri-al sectors (Moll and Femia, 1997; Zangerl-Weisz and Schandl, 1997; Bringezu, 2003). It allows looking into the efficiency of the construction process by describing materi-al and energy resources used in the construction sector to process them into edifices and export wastes. This concept is explained in more detail in the following section.
3.4 Modeling methodIndustrial Metabolism is a modeling method aiming at the investigation of the in-dustrial system, the mutual interchange of physical flows (materials and energy) between the industrial system and its natural environment (Lambert, 2008b). The main characteristics of industrial metabolism are:
• It is an integrated view• It is based on systems theory• It can be applied on various levels of aggregation, varying from process-oriented
to global• It has an emphasis on physical flows, which are materials and energy flows• It is quantitatively oriented• It is life-cycle oriented• It attempts to minimize the environmental impact of these flows via mimicking
the natural cycles
In order to analyze the interchange of physical flows (materials and energy), Brun-ner (2004) suggests Material Flow Analysis (MFA) as an appropriate tool to follow materials from consumption to final disposal in the environment. MFA delivers a complete and consistent set of information, including flows and stocks of a particu-
63
C O N C E P T U A L F R A M E W O R K
lar material, flow of wastes and identification of its sources (Hendriks et al., 2000; Brunner and Rechberger, 2004).
The MFA approach presents some limitations. One is that the “metabolism” changes over time and measuring just flows is insufficient to understand the processes that take place. Therefore, the description of the flows is important as well as the com-prehension of the processes behind those flows. There is a need for models describ-ing the internal transformations of matter and energy to assess the efficiency (and sustainability) of the system. This limitation present in the MFA is approached by considering the production process as a “black box” in which the internal structure has to be studied wherein a set of transformation processes with their mutual rela-tionships will be discovered (Janssen et al., 2001; Gößling-Reisemann, 2008; Lam-bert, 2008a).
In order to overcome the limitation, the physical model is extended, with the support of the Structured Analysis and Design Technique (SADT) (Marca and McGowan, 1987) that helps to understand and describe the construction process. A more de-tailed explanation is presented in the next section.
3.5 Construction waste generation model The construction waste generation model is a physical model that helps to describe the realization of a building process (Abarca et al., 2010). It comprises eight units that represent the components of the physical flows needed for MFA and the elements that describe the process (Figure 3.1). The units for the assessment of the flows are: (1) materials, (2) energy; (3) residual products; (4) residual energy; and (5) product or building. The elements for the analysis of the construction process are: (6) barriers and motivators for environmental building practices; (7) design and management and (8) labor. Each element is discussed in detail in the following sub-sections.

64
C H A P T E R 3
Figure 3.1: Construction waste generation model
MaterialsDifferent factors affect the choice of con-struction materials, being the most impor-tant ones climate, availability and econom-ic aspects. Different materials and forms of construction are developed in different parts of the world as a result of climatic dif-ferences (Duggal, 1998).
In most countries the predominant con-struction materials are reinforced concrete, masonry and bricks.
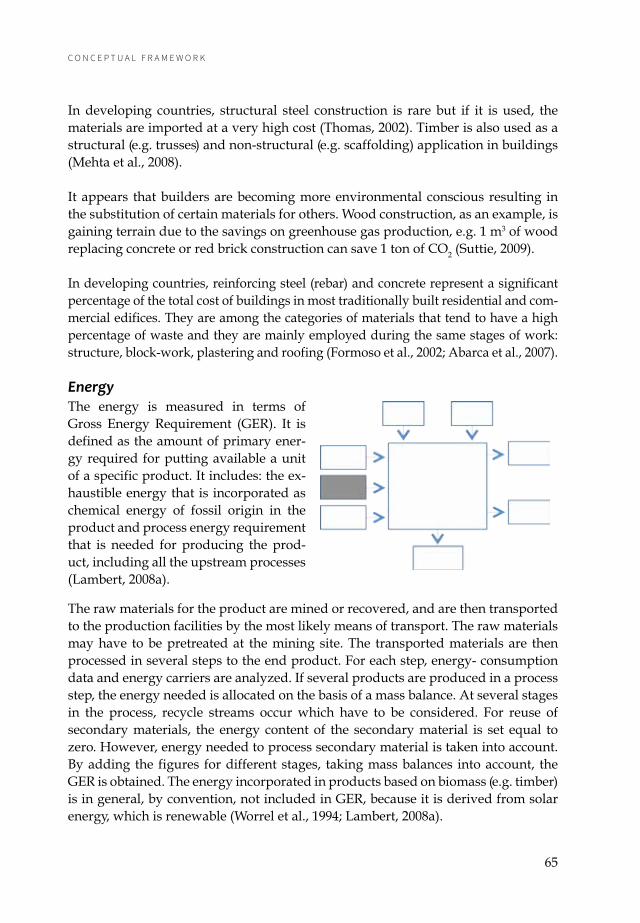
65
C O N C E P T U A L F R A M E W O R K
In developing countries, structural steel construction is rare but if it is used, the materials are imported at a very high cost (Thomas, 2002). Timber is also used as a structural (e.g. trusses) and non-structural (e.g. scaffolding) application in buildings (Mehta et al., 2008).
It appears that builders are becoming more environmental conscious resulting in the substitution of certain materials for others. Wood construction, as an example, is gaining terrain due to the savings on greenhouse gas production, e.g. 1 m3 of wood replacing concrete or red brick construction can save 1 ton of CO2 (Suttie, 2009).
In developing countries, reinforcing steel (rebar) and concrete represent a significant percentage of the total cost of buildings in most traditionally built residential and com-mercial edifices. They are among the categories of materials that tend to have a high percentage of waste and they are mainly employed during the same stages of work: structure, block-work, plastering and roofing (Formoso et al., 2002; Abarca et al., 2007).
EnergyThe energy is measured in terms of Gross Energy Requirement (GER). It is defined as the amount of primary ener-gy required for putting available a unit of a specific product. It includes: the ex-haustible energy that is incorporated as chemical energy of fossil origin in the product and process energy requirement that is needed for producing the prod-uct, including all the upstream processes (Lambert, 2008a).
The raw materials for the product are mined or recovered, and are then transported to the production facilities by the most likely means of transport. The raw materials may have to be pretreated at the mining site. The transported materials are then processed in several steps to the end product. For each step, energy- consumption data and energy carriers are analyzed. If several products are produced in a process step, the energy needed is allocated on the basis of a mass balance. At several stages in the process, recycle streams occur which have to be considered. For reuse of secondary materials, the energy content of the secondary material is set equal to zero. However, energy needed to process secondary material is taken into account. By adding the figures for different stages, taking mass balances into account, the GER is obtained. The energy incorporated in products based on biomass (e.g. timber) is in general, by convention, not included in GER, because it is derived from solar energy, which is renewable (Worrel et al., 1994; Lambert, 2008a).
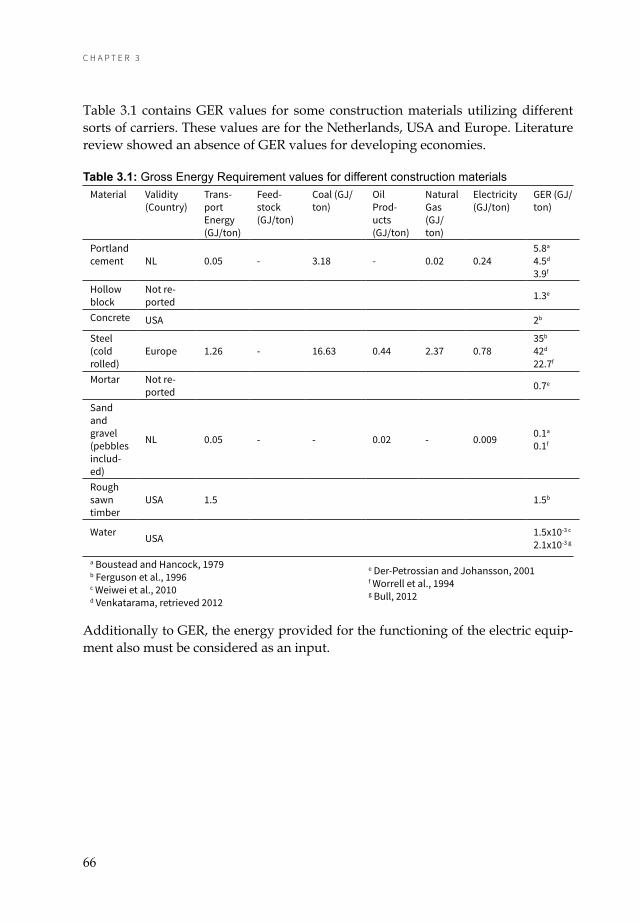
66
C H A P T E R 3
Table 3.1 contains GER values for some construction materials utilizing different sorts of carriers. These values are for the Netherlands, USA and Europe. Literature review showed an absence of GER values for developing economies.
Table 3.1: Gross Energy Requirement values for different construction materials Material Validity
(Country)Trans-port Energy(GJ/ton)
Feed-stock (GJ/ton)
Coal (GJ/ton)
Oil Prod-ucts(GJ/ton)
Natural Gas (GJ/ton)
Electricity (GJ/ton)
GER (GJ/ton)
Portland cement NL 0.05 - 3.18 - 0.02 0.24
5.8a
4.5d
3.9f
Hollow block
Not re-ported 1.3e
Concrete USA 2b
Steel (cold rolled)
Europe 1.26 - 16.63 0.44 2.37 0.7835b
42d
22.7f
Mortar Not re-ported 0.7e
Sand and gravel(pebbles includ-ed)
NL 0.05 - - 0.02 - 0.009 0.1a
0.1f
Rough sawn timber
USA 1.5 1.5b
Water USA 1.5x10⁻³ c
2.1x10⁻³ g
a Boustead and Hancock, 1979b Ferguson et al., 1996 c Weiwei et al., 2010d Venkatarama, retrieved 2012
e Der-Petrossian and Johansson, 2001f Worrell et al., 1994g Bull, 2012
Additionally to GER, the energy provided for the functioning of the electric equip-ment also must be considered as an input.
67
C O N C E P T U A L F R A M E W O R K
LaborConstruction laborers perform a wide range of physically demanding tasks dur-ing the realization of a building. Labor in the construction sector in the developing world represents 2-3% of GDP, and 74% of the 111 million of the world’s workers of the industrial sector. Developing countries account for 23% of global construction. It can be concluded that the activity is more labor intensive (UNEP, 2003) with low skilled human resources and a shortage of professionals at the level of management, supervision and Research & Development personnel (van Egmond, 1999).
Construction workers on site can be skilled and unskilled (Huda et al., 2008) but due to increased competition, permanent labor force are replaced by unskilled workers recruited for short periods on a casual basis with contracts of employment being verbal and labor conditions unprotected. (Wells, 2007). Another trend is that of in-creasing subcontracting of work by main contractors. So, the latter are progressively relying on the former instead of employing their own personnel. The cost of labor is much less than in industrialized countries. This relatively low cost has a profound effect on construction practices, making construction work very labor-intensive (Thomas, 2002).
Barriers and motivators for environmental building practicesIn the context of this thesis a barrier is an impediment that blocks the construction industry from producing edifices that promotes waste reduction. On the contra-ry a motivator is a factor for the industry to produce edifices reducing the overall environmental footprint. The major barri-ers and motivators reported in literature have been grouped according to the fol-lowing categories (Chapter 2): financial/economic, institutional, environmental, technical, socio-cultural and legal/policy related.

68
C H A P T E R 3
BarriersThe identification of major barriers to implementing construction waste reduction practices, allows uncovering the obstacles for the improvement of construction per-formance (Yuan et al., 2011) (Appendix 3.1).
Financial Literature suggests that financial obstacles are related to the absence of markets receiving recycled construction products which jeopardize efforts for construction waste recycling or minimization practices (Yuan et al., 2011). They also mention that the sector is reluctant to conduct construction waste management because they per-ceived that it would result in higher project costs. Moreover, there is an absence of economic penalizing methods for inappropriate waste management hampering construction waste reduction practices. Teo and Loosemore (2001) investigate the at-titudinal forces that shape behavior at the operative level and find, that the workers consider the financial benefits from waste reduction to be inequitably distributed. There is also a perception that waste reduction activities are not cost-effective, effi-cient, practical or compatible with core construction activities. They also determine the unwillingness of the workers to segregate for recycling or re-using materials that have low economic value or are difficult to reuse.
Institutional Kuijsters (2004), studying the Chilean building sector, and Yuan et al. (2011) sug-gests that institutional barriers are related to designers not paying attention to waste reduction while designing a building. Kuijsters (2004) also mentions that the incon-sistencies between different governmental agencies and the lack of coordination among divisions for the application of environmental regulations are barriers for the reduction of waste in the construction industry. Other barriers mentioned are the unavailability of waste management procedures (collection, separation, transporta-tion and disposal of construction waste) (Manowong, 2012), lack of managerial com-mitment and support for the application of better construction practices, absence of norms or performance standards for managing construction waste and lack of integration of operatives’ expertise and experience in waste management processes. In addition, internally, individual responsibilities for waste management is poorly defined, inadequately communicated and are perceived as irrelevant to operatives (Teo and Loosemore, 2001).
EnvironmentalAwareness and education are mentioned as two major topics in relation to envi-ronmental barriers for improved construction practices. It is concluded that there is a lack of sustainable building education at university level (Kuijsters, 2004), in-adequate training of construction workers on waste handling issues, absence of awareness on clients about sustainable housing and the impact of the activity on the environment (Yuan et al., 2011). The government and the private sector are more
69
C O N C E P T U A L F R A M E W O R K
interested on housing deficit than in environmental issues. Furthermore, healthcare and waste handling training are essential to prevent risks of workers from being exposed to wastes on-site and off-site. When this is provided, stakeholders feel more motivated to voluntarily deal with wastes (Manowong, 2012).
Technical There are sufficient technologies available in the market for building with less pro-duction of construction waste (Thomas, 2002) but there are technical barriers ham-pering those practices. The causes can be various: insufficient knowledge on how to implement eco-technologies (Kuijsters, 2004) and deficient education for practition-ers and on site operatives on waste reduction practices which result in poor skills during the construction process (Yuan et al., 2011).
Sociocultural Reported socio cultural barriers are the lack of awareness on environmental issues on the clients and construction workers which has created a behavior in which cli-ents have a low demand for sustainable buildings (Kuijsters, 2004). Yuan et al. (2011) found that traditional construction culture and behavior is a significant barrier to the promotion of construction and demolition waste management in China, e.g. conven-tional cast in-situ construction is still the preferable technique against prefabrication.
Furthermore, Teo and Loosemore (2001) report that waste reduction efforts will never be sufficient to completely eliminate waste because it is accepted as an inev-itable by-product of the construction activity. Manowong (2012), investigating the construction sector in Thailand, reports that gender equality has a direct causal ef-fect on construction waste management efforts. Women are more sensible for these issues which influence on stimulating the effectiveness of policies and planning for management of construction waste and pollution.
Legal Many developing economies created regulations that address the generation of waste by the construction sector. Yuan et al. (2011) and Manowong (2012) have re-ported that legal barriers hampering waste reduction practices are related to insuffi-cient policies in place, if policies exist they are difficult to put into practice and very often the absence of enforcement mechanisms.
MotivatorsSome scholars have identified financial, technical and socio-cultural and legal moti-vators in relation to construction waste reduction (Appendix 3.2).
70
C H A P T E R 3
Financial Chini (2007) indicates that higher disposal cost for construction materials at landfill site increases the use of recycled materials not ending up in the disposal sites.
Technical Companies with a waste management culture within the organization invest in con-struction waste management by employing waste management workers, purchas-ing equipment and/or machines for waste minimization and improving workers’ skills. Other technical motivators include: site space for performing waste manage-ment, low-waste construction technologies, service experience and development of specifications and guidelines for the use of recycled materials, (Yuan et al., 2012).
Sociocultural Teo and Loosemore (2001) examines socio-cultural motivators and find that the ma-jor practitioners are unlikely to perceive waste management with great importance on projects unless managers make it a priority and provide the necessary support-ing facilities, incentives and resources. Chini (2007) reports that recycled aggregates would have greater acceptance by the public when there are specific guidelines for their use.
Legal Construction waste reduction practices are motivated when a legal framework is in place that considers environmental regulations and recycling mandates (Yuan et al., 2012).
Design and managementDesign and management are according to many authors the two main sources of the generation of waste or misuse of construction materials.
DesignSkoyles in 1987 stated that the availability of workers to undertake their jobs effectively and efficiently depends on using well-designed tools and knowledge. It might not be thought that edification designers contribute to waste; after all they are only remotely connected withon-site operations. But designers should be aware the role they play in avoiding waste at the construction sites.

71
C O N C E P T U A L F R A M E W O R K
The “Lean” concept places emphasis on integration of the design and construction processes in order to eliminate, among others, waste. The concept is initially pio-neered and developed by the large Japanese car manufacturers and moved to other production processes (Harris and McCaffer, 2006).
However the review of literature demonstrates that “Lean” concept is hardly em-bedded in the construction sector. The lack of quality in construction activities and the waste generated on site can be attributed to: the imperfections on the design (Formoso et al., 2002) and specifications (Osmani, 2008), to structural design being poor in terms of standardization and detailing and the need to cut blocks or other materials due to the absence of modular coordination (Formoso et al., 2002). Other causes attributed to the design phase are: poor integration of building subsystems, lack of detailing and optimization, imprecise specification of components, machin-ery (Formoso et al., 2002), tools (Begun et al., 2006) and human resources needed (Zhang et al., 2005). It is also mentioned the absence of storage planning (Bossink and Brouwers, 1996) and space (Navon and Berkovich, 2005), site layout planning and distributions of the workplaces (Zhang et al., 2005).
A bad design may lead to two causes of waste generation: design and detailing mis-takes; and change in orders. Design and detailing errors result from mistakes in engineering and design. If materials are purchased based on wrong design specifi-cations may result as waste if they cannot be resold or returned to the vendor. The builder’s only option may be to dispose of the materials. Moreover, if the builder already installed the materials and is forced to take the flawed portion of the struc-ture apart, s/he may not be able to salvage them. Again, waste may result. The same holds true for change orders. Additionally, supplier contracts are often signed and construction has begun before plans and designs are complete. Surplus materials are much more prevalent on these types of projects (Gavilan and Bernold, 1994).
Construction waste reduction can be achieved through changes in design concepts and through material and construction method selections. It must not be assumed that all waste is due to site practice although much it is. This practice should be con-sidered at an early stage and by all parties involved in the building process (Poon, 2007).
ManagementIn relation to management, builders have become increasingly conscious about their principal resources, which can be grouped under the broad heads of labor, time, money, management and materials (Wyatt, 1978). Literature shows that attention is given mainly to labor costs, incentive schemes, productivity and production, plant management and control but less attention is given to materials and their manage-ment.
72
C H A P T E R 3
One of the first studies found in literature related to materials wastage dates from 1976 in which Skoyles started to analyze the misuse of materials by the construction sector. His conclusion is that materials and labor spent on handling them to the fix-ing position, account for nearly half the cost of traditionally constructed building and the waste occurring in practice is on average about double the losses generally assumed or allowed for in estimating.
Since then, the importance of materials management and control has been estab-lished. Wyatt (1978) suggests that wastage of materials arise from inadequate moni-toring or administration, or poor housekeeping. Chai and Yitzchakov (1995 cited in Navon and Berkovich, 2005) mentioned the importance of monitoring the flow of materials, correctness and the data associated with them, such as their quantities, status of orders, inventory levels, and alike. They asserted that the main problem is the lack of up to date relevant information, including the absence of a dedicated person as storekeeper.
Shen et al. (2004) find that waste handling is an unsafe and unclean operation, labor intensive with many procedures and hardly any application of mechanical facili-ties, often with poor coordination and supervision of the staff which creates double handling of the waste. They also report that most of the sites studied had a lack of waste sorting procedures, no consideration for reusing or recycling. This practice is associated with underdeveloped culture(s) among site staff and collection locations. It was also found that the absence of delivery facilities is time consuming due to the scattered waste locations.
Material management and labor productivity has also been studied and it is esti-mated the work-hour losses resulting from ineffective practices. The authors argue that formal material management programs have the potential to yield significant construction cost savings due to the fact that material resources constitute a large portion of a project’s total costs (Thomas et al., 1989; Thomas et al., 1999; Thomas and Sanvido, 2000; Formoso et al., 2002; Navon and Berkovich, 2005; Thomas et al., 2005). Some authors explain the benefits of the application of materials management and control systems in order to: increase productivity and avoid delays due to the availability of the right materials prior to work commencement and the ability to plan the work activities according to the availability of materials (Bell and Stukhart, 1987; Akintoye, 1995).
More detailed planning of materials and process requirements and better material handling are needed in order to reduce construction waste. Gavilan and Bernold (1994) emphasize that waste reduction is the best and generally most economical way to improve the use of materials and to cut costs. Bossink and Brouwers (1996) provide the same conclusion in which they analyze different causes for the produc-tion of waste and the most significant ones are related to management, being the
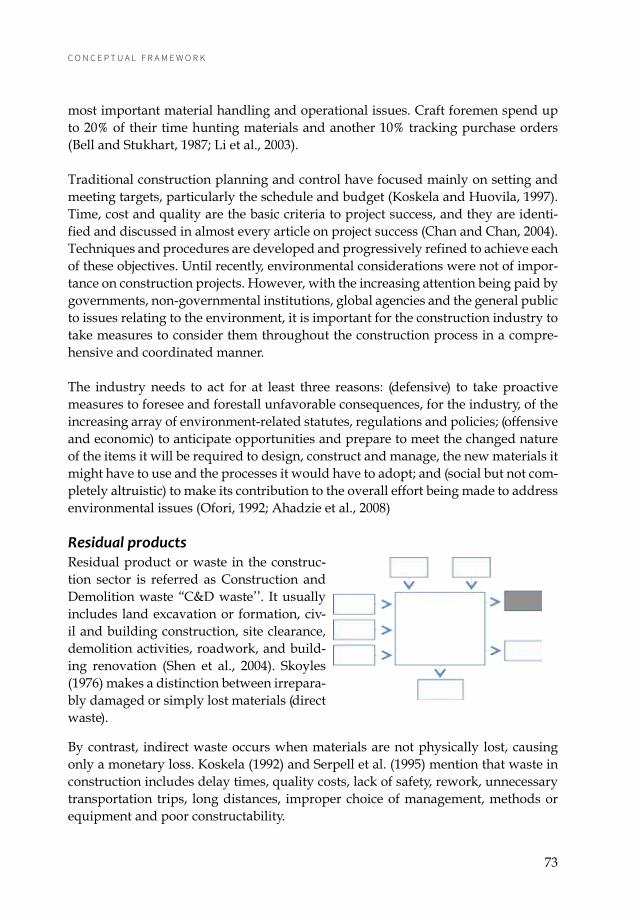
73
C O N C E P T U A L F R A M E W O R K
most important material handling and operational issues. Craft foremen spend up to 20% of their time hunting materials and another 10% tracking purchase orders (Bell and Stukhart, 1987; Li et al., 2003).
Traditional construction planning and control have focused mainly on setting and meeting targets, particularly the schedule and budget (Koskela and Huovila, 1997). Time, cost and quality are the basic criteria to project success, and they are identi-fied and discussed in almost every article on project success (Chan and Chan, 2004). Techniques and procedures are developed and progressively refined to achieve each of these objectives. Until recently, environmental considerations were not of impor-tance on construction projects. However, with the increasing attention being paid by governments, non-governmental institutions, global agencies and the general public to issues relating to the environment, it is important for the construction industry to take measures to consider them throughout the construction process in a compre-hensive and coordinated manner.
The industry needs to act for at least three reasons: (defensive) to take proactive measures to foresee and forestall unfavorable consequences, for the industry, of the increasing array of environment-related statutes, regulations and policies; (offensive and economic) to anticipate opportunities and prepare to meet the changed nature of the items it will be required to design, construct and manage, the new materials it might have to use and the processes it would have to adopt; and (social but not com-pletely altruistic) to make its contribution to the overall effort being made to address environmental issues (Ofori, 1992; Ahadzie et al., 2008)
Residual productsResidual product or waste in the construc-tion sector is referred as Construction and Demolition waste ‘‘C&D waste’’. It usually includes land excavation or formation, civ-il and building construction, site clearance, demolition activities, roadwork, and build-ing renovation (Shen et al., 2004). Skoyles (1976) makes a distinction between irrepara-bly damaged or simply lost materials (direct waste).
By contrast, indirect waste occurs when materials are not physically lost, causing only a monetary loss. Koskela (1992) and Serpell et al. (1995) mention that waste in construction includes delay times, quality costs, lack of safety, rework, unnecessary transportation trips, long distances, improper choice of management, methods or equipment and poor constructability.
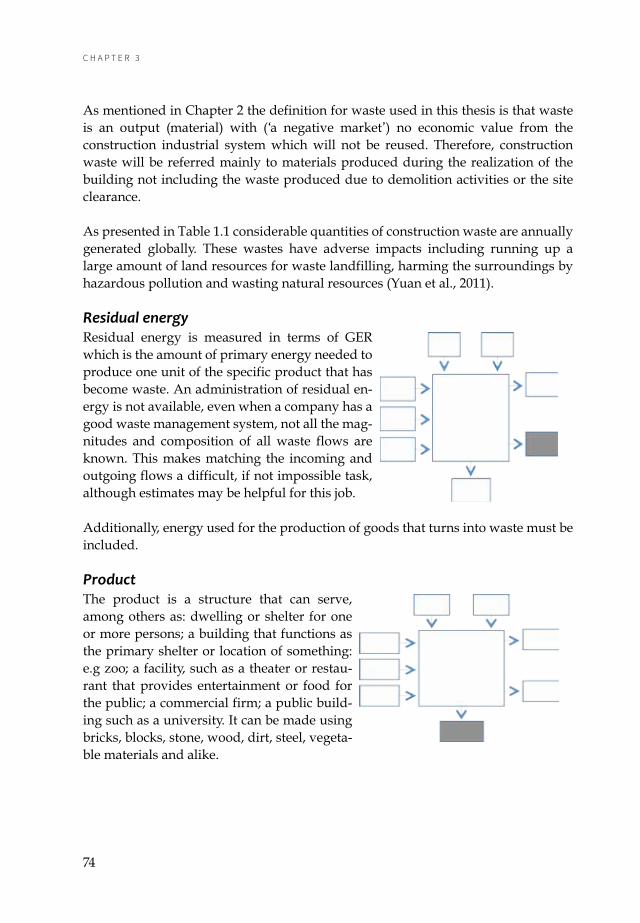
74
C H A P T E R 3
As mentioned in Chapter 2 the definition for waste used in this thesis is that waste is an output (material) with (‘a negative market’) no economic value from the construction industrial system which will not be reused. Therefore, construction waste will be referred mainly to materials produced during the realization of the building not including the waste produced due to demolition activities or the site clearance.
As presented in Table 1.1 considerable quantities of construction waste are annually generated globally. These wastes have adverse impacts including running up a large amount of land resources for waste landfilling, harming the surroundings by hazardous pollution and wasting natural resources (Yuan et al., 2011).
Residual energyResidual energy is measured in terms of GER which is the amount of primary energy needed to produce one unit of the specific product that has become waste. An administration of residual en-ergy is not available, even when a company has a good waste management system, not all the mag-nitudes and composition of all waste flows are known. This makes matching the incoming and outgoing flows a difficult, if not impossible task, although estimates may be helpful for this job.
Additionally, energy used for the production of goods that turns into waste must be included.
ProductThe product is a structure that can serve, among others as: dwelling or shelter for one or more persons; a building that functions as the primary shelter or location of something: e.g zoo; a facility, such as a theater or restau-rant that provides entertainment or food for the public; a commercial firm; a public build-ing such as a university. It can be made using bricks, blocks, stone, wood, dirt, steel, vegeta-ble materials and alike.
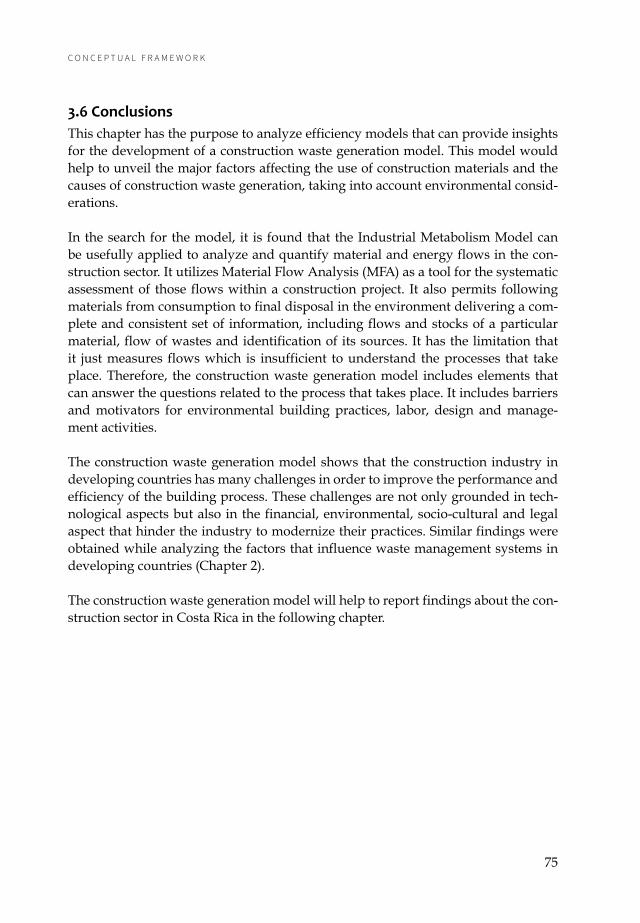
75
C O N C E P T U A L F R A M E W O R K
3.6 Conclusions This chapter has the purpose to analyze efficiency models that can provide insights for the development of a construction waste generation model. This model would help to unveil the major factors affecting the use of construction materials and the causes of construction waste generation, taking into account environmental consid-erations.
In the search for the model, it is found that the Industrial Metabolism Model can be usefully applied to analyze and quantify material and energy flows in the con-struction sector. It utilizes Material Flow Analysis (MFA) as a tool for the systematic assessment of those flows within a construction project. It also permits following materials from consumption to final disposal in the environment delivering a com-plete and consistent set of information, including flows and stocks of a particular material, flow of wastes and identification of its sources. It has the limitation that it just measures flows which is insufficient to understand the processes that take place. Therefore, the construction waste generation model includes elements that can answer the questions related to the process that takes place. It includes barriers and motivators for environmental building practices, labor, design and manage-ment activities.
The construction waste generation model shows that the construction industry in developing countries has many challenges in order to improve the performance and efficiency of the building process. These challenges are not only grounded in tech-nological aspects but also in the financial, environmental, socio-cultural and legal aspect that hinder the industry to modernize their practices. Similar findings were obtained while analyzing the factors that influence waste management systems in developing countries (Chapter 2).
The construction waste generation model will help to report findings about the con-struction sector in Costa Rica in the following chapter.
76
C H A P T E R 3
References
Abarca, L., Scheublin F.M., van Twillert, H., 2007. Assessment of construction waste man-agement practice: A case study in Costa Rica. In: Kaczala, F., Juanga, J., Hogland, W. and Marques, M. (eds): Eco-Tech 2007. Proceedings of the 6th International Conference on Technolo-gies for waste and waste treatment, energy from waste, remediation of contaminated sites and emissions related to climate, Kalmar, Sweden 26-28 November, pp.71-81.
Abarca, L., Maas, G.J., Lambert, A.J.D., 2010. Black box opener, tools to assess material use in the Costa Rica construction sector. Proceed-ings of the CIB World Congress: Building a better world. School of the Built Environment, Uni-versity of Salford, UK.
Ahadzie, D.K., Proverbs, D.G., Olomolaiye, P.O., 2008. Critical success criteria for mass house building projects in developing coun-tries. International Journal of Project Manage-ment, 26(6), pp.675–687.
Akintoye, A., 1995. Just in time application for building material management. Construc-tion Management and Economics, 13(2), pp.105-113.
Ayres, R.U., Simonis, U.E. eds., 1994. Indus-trial Metabolism. Tokyo: United Nations Uni-versity Press.
Begun, R.A., Siwar, C., Pereira, J.J., Jaafar, A.H., 2006. A benefit-cost analysis on the economic feasibility of construction waste minimization: The case of Malaysia. Journal Resources, Conservation and Recycling, 48(1), pp.86-98.
Bell, L.C., Stukhart, G., 1987. Costs and bene-fits of material management systems. Journal of Construction Engineering and Management, 113(2), pp.222-234.
Bossink, B.A.G., Brouwers, H.J.H., 1996. Con-struction waste: quantification and source evaluation. J. of Construction Engineering and Management, 122(1), pp.55-60.
Boulding, K.E., 1966. The economics of the coming spaceship Earth. In: H. Jarrett, ed. Environmental Quality in a Growing Economy. Baltimore: John Hopkins Press, pp.3-14.
Boustead, I., Hancock, G. F., 1979. Handbook of Industrial Energy Analysis. Ellis Horwood, Chichester.
Bringezu, S., 2003. Industrial Ecology and material flow analysis. Basic concepts, policy relevance and some case studies. In: D. Bourg and S. Erkman eds. Perspectives on Industrial Ecology. Sheffield: Greenleaf Publishing Lim-ited.
Brunner, P., 2004. Materials flow analysis and the ultimate sink. Journal of Industrial Ecology, 8(3), pp.4-7.
Brunner, P.H., Rechberger, H., 2004. Practi-cal handbook of material flow analysis. Florida: Lewis Publishers.
Bull, J., 2012. Embodied energy and embodied carbon in water. OcoCarbon Blog. Available at: <http://oco-carbon.com/wp-content/up-loads/2011/10/WaterTable.jpg> [Accessed 6 September 2012].
77
C O N C E P T U A L F R A M E W O R K
Chan, A.P.C., Chan, A.P.L., 2004. Key perfor-mance indicators for measuring construction success. Benchmarking: An International Jour-nal, 11(2), pp.203-221.
Chini, A.R., 2007. General issues of construc-tion materials recycling in USA. In: Proceed-ings of Sustainable construction 2007-Materials and Practices, Lisbon, Portugal, pp.848-855.
Der-Petrossian, B., Johansson, E., 2001. Construction and Environment – Improv-ing energy efficiency. Building Issues, 10(2), pp.1-21. Available at: <http:www.google.co.uk/search?hl=en&q=embodied+energy+ hallow+block&meta=> [Accessed 6 Septem-ber 2012].
Duggal, S.K., 1998. Building materials. Rotter-dam: A.A. Balkema.
Evan, H.Z., 1974. Socio-Economic and labour aspects of pollution control in the chemical industries. Journal for International Labour Re-view, 110(3), pp.219-233.
Farrell, M.J., 1957. The measure of productive efficiency. Journal of the Royal Statistical Socie-ty, 120(3), p.11.
Ferguson, I., La Fontaine, B., Vinden, P., Bren,L., Hateley, R., Hermesec, B., 1996. Envi-ronmental properties of timber. Research Paper commissioned by the Forest & Wood Prod-ucts Research 7 Development Corporation. Available at: <http://www.google.co.uk/search?hl=en&q=timber+and+embod-ied+energy&meta=> [Accessed 6 September 2012].
Formoso, C.T., Soibelman, L., Cesare, C.D., Issato E.L., 2002. Material waste in building industry: main causes and prevention. J. of
Construction Engineering and Management, 128(4), pp.316-326.
Freeman, A.M., Haveman, R.H., Kneese, A.V., 1973. The economics of Environmental Pol-icy. London: Wiley.
Gavilan, R.M., Bernold, L.E., 1994. Source evaluation of solid waste in building con-struction. Journal of Construction Engineering and Management, 122(1), pp.55-60.
Gößling-Reisemann, S., 2008. What is re-source consumption and how can it be meas-ured? Theoretical Considerations. Journal of Industrial Ecology, 12(1), pp.10-25.
Guinée, J.B., Udo de Haes, H.A., Huppes, G., 1993a. Quantitative life cycle assessment of products 1: Goal definition and inventory. Journal of Cleaner Production, 1(1), pp.3-13.
Guinée, J.B., Heijungs, R., Udo de Haes, H.A., Huppes, G., 1993b. Quantitative life cycle assessment of products 2: Classification, val-uation and improvement analysis. Journal of Cleaner Production, 1(2), pp.81-91.
Gupta S.M., Lambert, A.J.D. eds., 2008. Envi-ronment conscious manufacturing. New York: CRC Press.
Harris, F., McCaffer, R., 2006. Modern con-struction management. Sixth ed. Oxford: Blackwell Publishing.
Hartkopf, V., Yan, X., Aziz, A., 2009. Case studies of high performance sustainable buildings. United Nations Environment Programme Sustainable Building & Construction Initia-tive (UNEP SBCI), Carnegie Mellon Univer-sity.
78
C H A P T E R 3
Hendriks, C., Obernosterer, R., Müller, D., Kytzia, S., Baccini, P., Brunner, P.H., 2000. Material Flow Analysis: a tool to support environmental policy decision making. Case-studies on the city of Vienna and the Swiss lowlands. Journal Local Environment, 5(3), pp.311-328.
Horvath, A., 2004. Construction materials and the environment. Annu. Rev. Environmen-tal Resources, 29, pp.181-204.
Huda, S.M.K, Farooqui R.U., Saqib, M., 2008. Finding ways for enhancing postgraduate level education in construction management in Pakistan. In: First International Conference on Construction in Developing Countries (IC-CIDC–I). Advancing and integrating construc-tion education, research & practice. Karachi, Pa-kistan August 4-5, 2008. Available at: <http://www.google.co.uk/search?hl=en&q=con-struction+industry+developing+coun-tries&meta> [Accessed 11 November 2011].
Janssen M.A., Bergh, J.C.J.M. van den Beuker-ing, P.J.H., van Hoekstra, R., 2001. Changing industrial metabolism methods for analysis. Population and Environment, 23(2), pp.139-156.
Kennedy, C., Cuddihy, J., Engel-Yan, J., 2007. The changing metabolism of cities. Journal of Industrial Ecology, 11(2), pp.43-59.
Kenny, C., 2007. Construction, corrup-tion and developing countries. World Bank Policy Research Working Paper 4271. Available at: <http://econ.worldbank.o r g / e x t e r n a l / d e f a u l t / m a i n ? p a g e P -K=64165259&theSitePK=477872&piP-K=64165421&menuPK=64166093&entity-ID=000016406_20070626142601> [Accessed 11 November 2011].
Kofoworola, O.F., Gheewala, S.H., 2009. Esti-mation of construction waste generation and management in Thailand. Waste Management Journal, 29(2), pp.731-738.
Koskela, L., 1992. Application of the new pro-duction philosophy to construction. Technical Report No. 72, CIFE, Stanford University.
Koskela, L., Huovila, P., 1997. On foundations of concurrent engineering. First Conference or-ganized by Institute of Structural Engineers. London.
Kuijsters A., 2004. Environmental response of the Chilean building sector. MSc. Eindhoven University of Technology.
Lambert, A.J.D., 2008a. Energy, production and process integration. Faculteit Technologie Management, Technische Universiteit Eind-hoven.
Lambert, A.J.D., 2008b. Industrial metabolism: roots and basic principles. In: S. Gupta and A.J.D. Lambert, eds. 2008. Florida: CRC Press.
Lawton, J.H., 1999. Are there general laws in ecology? Oikos, 84, pp.177-192.
Leandro, A., 2007. Administración y manejo de los desechos en proyectos de construcción Etapa II. Alternativas de manejo. Centro de Investigaciones en Vivienda y Construcción CIVCO. Instituto Tecnologico de Costa Rica.
Li, H., Kong, C.W., Pang, Y.C., Shi, W.Z., Yu, L., 2003. Internet based geographical infor-mation systems for E-commerce application in construction material procurement. Jour-nal of Construction Engineering and Manage-ment, 129(6), pp.689-697.
79
C O N C E P T U A L F R A M E W O R K
Lifset, R., 1997a. Relating industry to ecology. Journal of Industrial Ecology, 1(2), pp.1-2.
Lifset, R., 1997b. Why industrial ecology. Journal of Industrial Ecology, 1(4), pp.1-2.
Lu, W., Yuan, H., 2011. A framework for understanding waste management studies in construction. Waste Management Journal, 31(6), pp.1252-1260.
Macozoma D., 2002. International report on construction site waste management and mini-misation, International Council for Research and Innovation in Building and Construc-tion. Rotterdam. Available at: <http://www. cibworld. nl/pag-es/begin/pub278/06construction> [Accessed 13 March 2007].
Manowong, E., 2012. Investigating factors influencing construction waste management efforts in developing countries: an experi-ence from Thailand. Waste Management and Research, 30(1), pp.56-71.
Marca, D., McGowan, S.L., 1987. Structured Analysis and Design Technique. New York: McGraw-Hill.
Mehta, M., Scarborough, W., Armpriest, D., 2008. Building construction. Principles, materi-als and systems. New Jersey:Pearson Prentice Hall.
Moll, S., Femia, A., 1997. Production, ma-terial input and labor – an illustrative in-put-output analysis. In: Regional and nation-al materials flow accounting: From paradigm to practice of sustainability. ConAccount Workshop. Leiden, the Netherlands, 21-23 Jan-uary 1997. Wuppertal Special 4. Edited by S. Bringezu et al. Wupperal: Wuppertal Insti-tute.
Murty, M.N., Kumar, S., Mahua P., 2006. En-vironmental regulation, productive efficien-cy and cost of pollution abatement: a case study of the sugar industry in India. Journal of Environmental Management, 79(1), pp.1–9.
Navon, R., Berkovich, O., 2005. Development and on-site evaluation of an automated mate-rials management and control model. Journal of Construction Engineering and Management, 131(12), pp.1328-1336.
Ngowi, A., 2002. Challenges facing con-struction industries in developing coun-tries. Building Research & Information, 30(3), pp.149–151.
Ofori, G., 1992. The environment: the fourth construction project objective?. Construction Management and Economics, 10(5), pp.369-395.
Ofori, G., 2000. Challenges of construction in-dustries in developing countries, lessons from various countries. [pdf] Available at: <http://www.google .co.uk/search?hl=en&q= Challenges+of+construction+industries +in+developing+countries%2C+lessons +from+various+countries&meta> [Accessed 11 November 2011].
Osmani, M. Glass, J., Price, A.D.F., 2008. Ar-chitects’ perspectives on construction waste reduction by design. Waste Management, 28(7), pp.1147–1158.
Poon, C. S., 2007. Reducing construction waste. Waste Management Journal, 27(11), pp.1715-1716.
Porter, M., 1980. Competitive strategy: Tech-niques for analyzing industries and competitors. New York: Free Press.
80
C H A P T E R 3
Rajeski, D., 1997. Mars, materials, and three morality plays: Materials Flows and envi-ronmental policy. Journal of Industrial Ecology, 1(4), pp.13-18.
Ramirez-Cartin, M., 1995. Impacto fisico y fi-nanciero de la generacion de desechos solidos en la construccion de dos proyectos hoteleros. Tesis de grado. Universidad de Costa Rica, San Jose, Costa Rica.
Rosenblueth, A., Wiener, N., 1945. The role of models in science. Philosophy of Science, 12(4), pp.316-321.
Serpell, A.; Venturi, A., Contreras, J., 1995. Characterization of waste in building con-struction projects. In L. Alarcon, ed. 1997. Lean Construction. The Netherlands.
Shen, L.Y., Tam, V.W.Y., Tam, C.M., Drew, D., 2004. Mapping approach for examining waste management on construction sites. Journal of Construction Engineering and Man-agement, 130(4), pp.472–481.
Skoyles, E.R., 1976. Materials wastage - a misuse of resources. Building Research and Practice, 4(4), pp.232-243.
Skoyles, E.R., 1987. Waste prevention on site. London: Mitchell.
Suttie, E., 2009. Wood for material substitu-tion. Construction with wood. BRE Timber. Available at: <http://www.forestry.gov.uk/pdf/SUTTIEFCCC280109.pdf/$file/SUT-TIEFCCC280109.pdf> [Accessed 28 March 2013].
Teo, M.M.M., Loosemore, M., 2001. A theory of waste behavior in the construction indus-try. Construction Management and Economics, 19(7), pp.741-751.
The Telegraph newspaper, 2013. Poor quality construction materials to blame for deadly Bang-ladesh factory collapse. Available at: <http://www.telegraph.co.uk/news/worldnews/asia/bangladesh/10075098/Poor-quali-ty-construction-materials-to-blame-for-dead-ly-Bangladesh-factory-collapse.html> [Ac-cessed 18 September 2013].
Thomas, H.R., 2002. 2000 Peurifoy Lecture: Construction practices in developing coun-tries. Journal of Construction Engineering and Management, 128(1), pp.1-7.
Thomas, H.R. Riley, D.R., Messner, J.I., 2005, Fundamental principles of site material man-agement, J. of Construction Engineering and Management, 131(7), pp.808-815.
Thomas, H. R., Sanvido, V.E., Sanders, S. R., 1989. Impact of material management on productivity – a case study. Journal of Con-struction Engineering and Management, 115(3), pp.370-384.
Thomas, H. R., Riley, D.R., Sanvido, V.E., 1999. Loss of labour productivity due to deliver methods and weather. Journal Construction Engineering and Management, 125(1), pp.39-46.
Thomas, H.R., Sanvido, V.E, 2000. Role of fab-ricator in labor productivity. Journal of Con-struction Engineering and Management, 126(5), pp.358-365.
Tillman, A., Ekvall, T., Baumann, H., Ryd-berg, T., 1994. Choice of system boundaries in life cycle assessment. Journal of Cleaner Pro-duction, 2(1), pp.21-29.
81
C O N C E P T U A L F R A M E W O R K
UNEP (United Nations Environment Pro-gram). Industry and Environment, 2003. Sustainable building and construction: facts and figures. September, pp 5-8. Available at: <http://www.unep.fr/shared/docs/review/vol26no2-3/005-098.pdf> [Accessed 9 Sep-tember 2008].
van Egmond, E.L.C., 1999. Technology map-ping for technology management. Ph.D. Eind-hoven University of Technology. Delft: Delft University Press.
Villalobos, A., 1995. Estudio de generación de desechos en la construcción de viviendas en mam-postería. Proyecto de Graduación para optar por el grado de Licenciatura en Ingeniería Civil, Escuela de Ingeniería Civil, Universi-dad de Costa Rica, San José, Costa Rica.
Venkatarama, B. V., Buildings. Department of Civil Engineering. Indian Institute of Science, Bangalore. Available at: <http://www.goog-le.co.uk/search?hl=en&q=embodied+ener-gy+in+mortar&meta=> [Accessed 7 Septem-ber 2012].
Weiwei, M., Fuzhan, N. Eckelman, M.J., Zhang, Q., Zimmerman, J.B., 2010. Measur-ing the embodied energy in drinking water supply systems: A case study in the Great Lakes Region. Environmental Science and Tech-nology, 44(24), pp.tt9516–9521.
Wells, J., 2007. Informality in the construction sector in developing countries. Construction Management and Economics, 25(1), pp.87–93.
Wells, J., 2012. Informal construction activity in developing countries. In: New perspectives on construction in developing countries. G. Ofori, ed. 2012. London: Spoon Press.
Wyatt, D.P., 1978. Materials management Part I. The Institute of Building Englemere, Kings Ride, Ascot, Berkshire, UK.
Worrell, E., van Heijningen, R.J.J., de Castro, J.F.M., Hazewinkel, J.H.O., de Beer, J.G. Faaij, A.P.C., Vringer, K., 1994. New Gross Energy requirements figures for materials produc-tion. Energy, 19(6), pp.627-640.
Yuan, H., Shen, L., 2011. Trend of the re-search on construction and demolition waste management. Waste Management Journal, 31(4), pp.670-679.
Yuan, H., Shen, L., Wang, J., 2011. Major obstacles to improving the performance of waste management in China’s construction industry. Facilities, 29(5/6), pp.224-242.
Yuan, H., Chini, A., Lu, Y., Shen, L., 2012. A dynamic model for assessing the effects of management strategies on the reduction of construction and demolition waste. Waste Management Journal, 32(3), pp.521-531.
Zangerl-Weisz, H., Schandl, H., 1997. Esti-mating sectoral material balances: A case study of chemical production in Austria. In: Regional and national materials flow ac-counting: From paradigm to practice of sus-tainability. ConAccount Workshop. Leiden, the Netherlands, 21-23 January 1997. Wuppertal Special 4. Edited by S. Bringezu et al. Wup-peral: Wuppertal Institute.
Zhang, J., Eastham, D., Bernold, L., 2005. Waste-based management in residential con-struction. J. Construction Engineering Manage-ment, 131(4), pp.423-430.

82
C H A P T E R 3
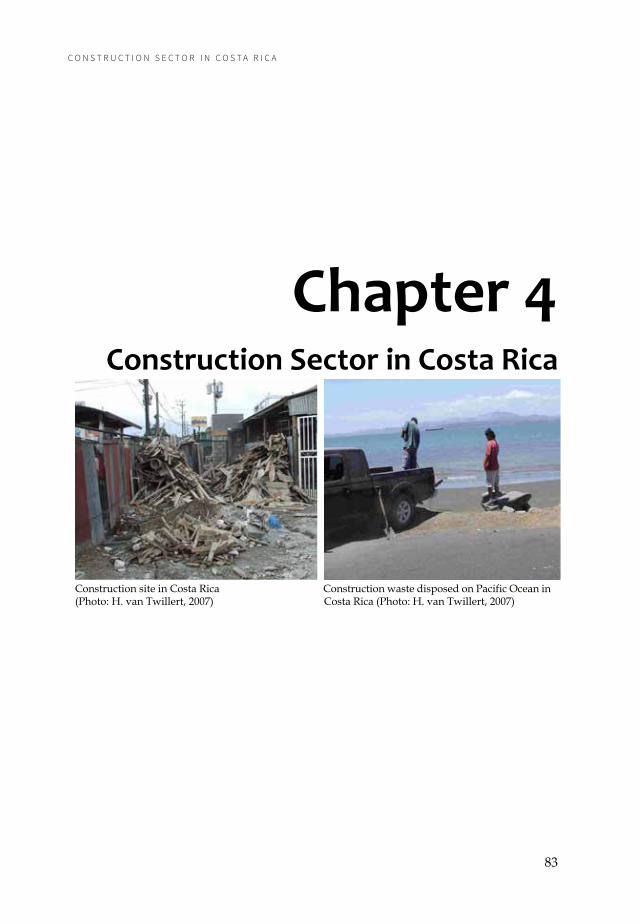
83
C O N S T R U C T I O N S E C T O R I N C O S T A R I C A
Chapter 4Construction Sector in Costa Rica
Construction site in Costa Rica (Photo: H. van Twillert, 2007)
Construction waste disposed on Pacific Ocean in Costa Rica (Photo: H. van Twillert, 2007)
84
C H A P T E R 4
The environment and future generations call for a radical change in the construction industry in developing countries. A switch from a wasteful activity to reduce, reuse, recycle and safe disposal approaches. The present and future generations deserve our efforts.

85
C O N S T R U C T I O N S E C T O R I N C O S T A R I C A
4. Construction Sector in Costa Rica 7
4.1 IntroductionIn Chapter 3, a construction waste generation model (Figure 3.1) is proposed as a way to understand and describe the construction process. That chapter introduc-es eight units that describe the modeling elements. The units for the assessment of the flows are: materials, energy; residual products; residual energy and product (building). The elements for the analysis of the construction process are: barriers and motivators for environmental building practices; design and management and labor. Sub-question 3 proposed in Chapter 1 of this thesis is assessed in this chapter by analyzing seven of the eight units that describe the model.
The purpose of this chapter is then to report the appropriateness of the construc-tion waste generation model used to examine the construction process and the chal-lenges the construction industry is facing to improve their practices. The proposed model, based on principles of Industrial Metabolism, uses real data provided by en-gineers and practitioners working in the Costa Rican construction industry (Abarca et al., 2010b).
The research of the construction sector in Costa Rica is done in two phases. The first phase allows finding the answers to the following questions (Marca and McGowan, 1987):
(Q1): Which are the most important materials used in the construction phase? (Q2): How much is the energy associated with those input materials?(Q3): What are the workers’ skills on the construction sites?(Q4): Which are the barriers and motivators for environmental building practices?(Q5): Which are the design and management practices influencing waste generation during the procurement of a building? (Q6): Which is the quantity of the most significant materials turned into waste dur-ing the construction of a building?(Q7): How much energy is associated with the wasted materials?
The second phase collects information from engineers and architects to test the fol-lowing hypothesis:
Hypothesis (H0): various sources have a different effect on construction waste generation.
7 In process to be reviewed in Waste Management Journal
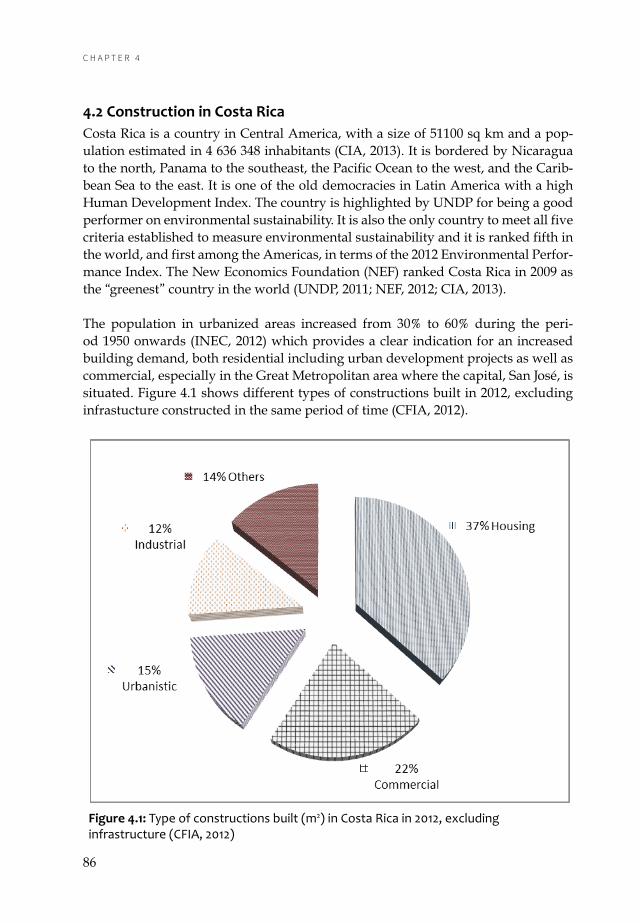
86
C H A P T E R 4
4.2 Construction in Costa RicaCosta Rica is a country in Central America, with a size of 51100 sq km and a pop-ulation estimated in 4 636 348 inhabitants (CIA, 2013). It is bordered by Nicaragua to the north, Panama to the southeast, the Pacific Ocean to the west, and the Carib-bean Sea to the east. It is one of the old democracies in Latin America with a high Human Development Index. The country is highlighted by UNDP for being a good performer on environmental sustainability. It is also the only country to meet all five criteria established to measure environmental sustainability and it is ranked fifth in the world, and first among the Americas, in terms of the 2012 Environmental Perfor-mance Index. The New Economics Foundation (NEF) ranked Costa Rica in 2009 as the “greenest” country in the world (UNDP, 2011; NEF, 2012; CIA, 2013).
The population in urbanized areas increased from 30% to 60% during the peri-od 1950 onwards (INEC, 2012) which provides a clear indication for an increased building demand, both residential including urban development projects as well as commercial, especially in the Great Metropolitan area where the capital, San José, is situated. Figure 4.1 shows different types of constructions built in 2012, excluding infrastucture constructed in the same period of time (CFIA, 2012).
Figure 4.1: Type of constructions built (m2) in Costa Rica in 2012, excluding infrastructure (CFIA, 2012)
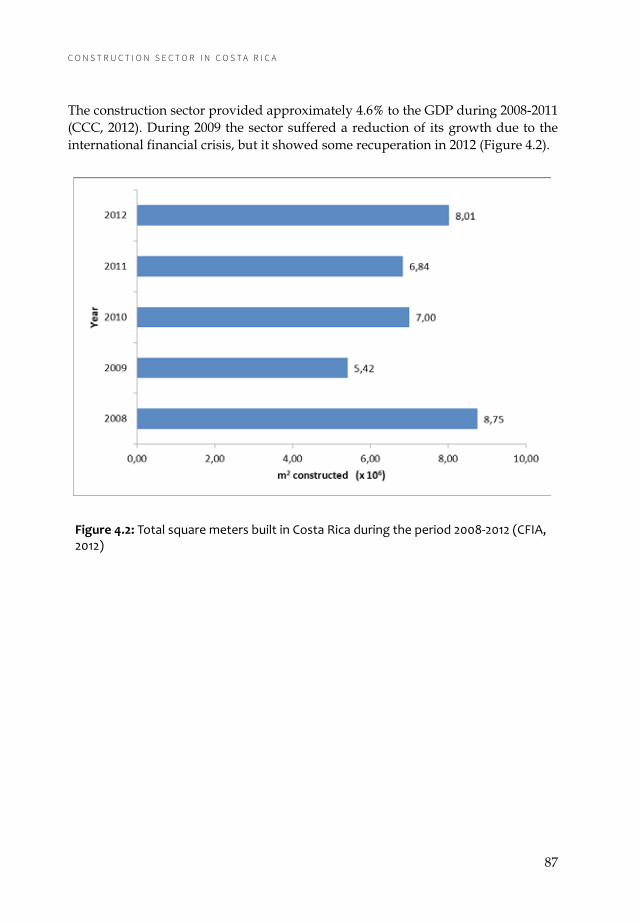
87
C O N S T R U C T I O N S E C T O R I N C O S T A R I C A
The construction sector provided approximately 4.6% to the GDP during 2008-2011 (CCC, 2012). During 2009 the sector suffered a reduction of its growth due to the international financial crisis, but it showed some recuperation in 2012 (Figure 4.2).
Figure 4.2: Total square meters built in Costa Rica during the period 2008-2012 (CFIA, 2012)
88
C H A P T E R 4
4.3 Research methodology
Literature reviewThe literature review provides the items tapping the theoretical constructs for the research introduced in Chapter 3. Various authors have written about the materials used in the construction activities in developing countries and the energy associated with those products (van Egmond, 1999; Worrell, et al., 1994; Ferguson et al., 1996; Der-Petrossian and Johansson, 2001; Bolaños, 2012). Labor issues are described by Osmani, et al., (2008). Bossink and Brouwers (1996) give an overview of reported factors influencing construction waste generation while the barriers and motiva-tors for the companies to improve their construction practices for waste reduction are provided by Teo and Loosemore (2001), Kuijsters (2004), Ekanayake and Ofori (2004), Yuan et al. (2011), Manowong (2012) and Yuan et al. (2012).
Data collectionThe data are collected in two phases. The first phase allows analyzing the eight units proposed for the construction waste generation model. It utilizes a mixed method approach, in which a survey instrument is applied, structured interviews are held, on-site visits take place and a panel experts’ discussion validate the collected infor-mation. The second phase employs a survey method which provides more in depth information related to the level of importance of the waste generation sources. These methods are explained in more detail in the following section.
First phase This research phase is conducted in collaboration with a student of Eindhoven Uni-versity of Technology and the Research Center for Housing and Construction of the Costa Rica Institute of Technology. The student applies the survey instrument, visits the construction places and interviews key stakeholders of the Costa Rican construction industry. The author of this thesis is responsible for the panel of ex-perts’ discussion.
89
C O N S T R U C T I O N S E C T O R I N C O S T A R I C A
Survey instrumentA questionnaire is constructed based on the information gathered during the liter-ature study (Appendix 4.1). It contains 12 questions that covers a number of topics: construction waste quantities, composition, sources of construction waste genera-tion, barriers and motivators for construction waste reduction practices (Kuijsters, 2004). It includes a combination of rating scales, multiple-choice questions and open-ended questions. Responses are requested based on current or recently com-pleted building design projects. The questions are measured by a five-point Lik-ert-type scale with anchors ranging from never, none (1) to always, all, extensive (5) (Matell and Jacoby, 1971) (2 questions); as values of actual measurements (1 ques-tion); binary scale (Yes/No) (5 questions) (Ekere et al., 2009); and general information (4 questions).
Prior to data collection, the survey instrument is pre-tested for ease of understand-ing and content validity in two stages. In the first stage, seven experienced construc-tion engineers from the Research Center for Housing and Construction of the Costa Rica Institute of Technology, are asked to critique the questionnaire for ambiguity, clarity and appropriateness of the items used to operationalize each construct (De Vellis, 1991). These researchers are also required to include new constructs and to assess the extent to which the indicators sufficiently address the subject under study for the Costa Rican context (Dillman, 1978). Based on the feedback received from these researchers, the instrument is modified to enhance clarity and appropriateness of the measures purporting to tap the constructs. In the second stage, the survey instrument is sent via e-mail to 419 main contractors registered in the Federation of Engineers and Architects (CFIA). The advantages of sending it by email are: it was less expensive than paying for postage or for interviewers, it deliveres the tool in seconds and the research shows that respondents may answer more honestly than with paper surveys or interviews. The disadvantages are that the population and sample is limited to those with access to computer and online network and more in-struction and orientation is necessary for respondents to complete the questionnaire (CSU, 2012).
The received information is stored on a SQL Server 2005 database. Efforts are made to ensure high responses from respondents. These include: a personalized cover let-ter; a confidentiality statement to assure strict confidence on the information pro-vided; telephone follow-ups of all non-respondents after one week from the initial e-mailing of questionnaires; and further telephone calls to re-contact all the remain-ing non-respondents.
90
C H A P T E R 4
The data collected is edited, in order to detect errors and omissions. Editing is done to assure that the data are accurate, consistent with other facts gathered uniformly and entered for the coding process. The information is analyzed using the Statistical Package for Social Sciences (SPSS) Version 14.0 for Windows. Descriptive techniques are used to analyze the information collected.
Interview dataStructured interviews are carried out on key persons from different organizations related to the construction sector. They are intended for enriching the data of the survey and for the elaboration and interpretation on the results obtained from the questionnaires.
There are 30 interviewees in total corresponding to: 20 workers on site, 3 research-ers from educational institutions, 3 consultancy construction companies, 2 members from the Costa Rican Construction Chamber and Federation of Engineers, 1 govern-mental agency, 1 contractor and 1 environmental organization.
Onsite visitsFive on site visits are carried out after receiving the questionnaire responses and the data collected in the interviews. Semi-structured questions are asked for general and specific information about waste management practices on site.
Panel experts’ discussionA panel of experts’ discussion takes place with the objective to explore the meanings of the survey results, to analyze the participants’ views on the presented topics and to collect a wider insight into different opinions (ODI, 2009).
The group is composed of 49 professionals from the construction industry, including companies that participated in the survey, representatives of CFIA, academic sector, Costa Rican Construction Chamber and Cleaner Production Center. It is conduct-ed over approximately two hours, beginning with a 30 minute presentation of the research’s results. This provides opportunities for the clarification of responses, for follow-up questions, and for the probing of responses. Each of the group members is free to express his/her minds openly.
Additionally, the findings are presented in the Costa Rican Congress of Civil Engi-neers held in 2008 (Abarca-Guerrero, 2008).
91
C O N S T R U C T I O N S E C T O R I N C O S T A R I C A
Second phase
The research is conducted in collaboration with a student from the University of Costa Rica (UCR) who applies the survey instrument.
Survey instrumentThe results of the first phase provide information to prepare a questionnaire with a total of 3 queries that cover a number of topics related to causes of construction waste generation (Appendix 4.2). The objective is to establish the levels of impor-tance of waste generation sources.
The respondents are asked to rate pre-determined attributes according to their po-tential contribution to the generation of waste on site from their own experience (Ekanayake and Ofori, 2004). They are asked to add new attributes if necessary. The first part of the survey seeks respondents’ and companies’ details to ascertain the profile. The questions are measured by a five-point Likert-type scale with anchors ranging from not significant (1) to most significant (5) (Ekanayake and Ofori, 2004) (1 question) and general information (2 questions).
Prior to data collection, the survey instrument is pre-tested for content validity by ten experienced construction engineers and architects, three from two universities and seven from construction companies with more than five years of experience. The respondents are also asked to assess the extent to which the parameters sufficiently address the topics investigated. Based on the feedback received, the instrument is modified. Once the questionnaire is improved it is sent via e-mail to 419 main con-tractors registered in the Federation of Engineers and Architects (CFIA). Efforts are made to ensure high responses from respondents. These include: a personalized cover letter; a confidentiality statement to assure strict confidence on the informa-tion provided and on-site visits and interview with the managers of the projects. A total of 87 persons responded.
The data collected is edited, in order to detect errors and omissions. Editing is done to assure that the data are accurate, consistent with other facts gathered uniform-ly entered for the coding process. The information is analyzed using the Statistical Package for Social Sciences (SPSS) Version 14.0 for Windows. Inferential and de-scriptive techniques were used to analyze the variables, including central tendency and z analysis with a demarcation level of significance at 0.05.
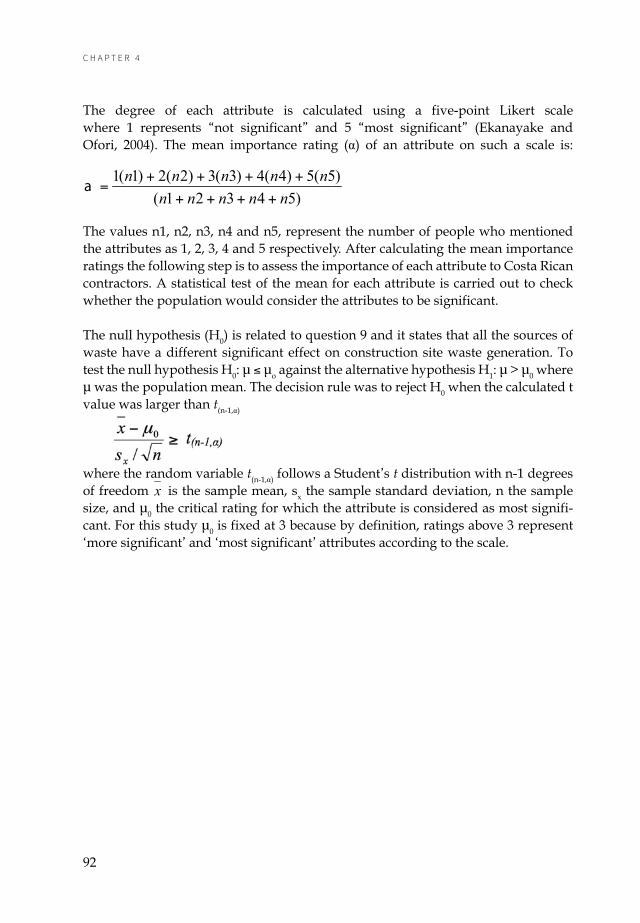
92
C H A P T E R 4
The degree of each attribute is calculated using a five-point Likert scale where 1 represents “not significant” and 5 “most significant” (Ekanayake and Ofori, 2004). The mean importance rating (α) of an attribute on such a scale is:
)54321()5(5)4(4)3(3)2(2)1(1
nnnnnnnnnn
++++
++++=a
The values n1, n2, n3, n4 and n5, represent the number of people who mentioned the attributes as 1, 2, 3, 4 and 5 respectively. After calculating the mean importance ratings the following step is to assess the importance of each attribute to Costa Rican contractors. A statistical test of the mean for each attribute is carried out to check whether the population would consider the attributes to be significant.
The null hypothesis (H0) is related to question 9 and it states that all the sources of waste have a different significant effect on construction site waste generation. To test the null hypothesis H0: μ ≤ μo against the alternative hypothesis H1: μ > μ0 where μ was the population mean. The decision rule was to reject H0 when the calculated t value was larger than t(n-1,α)
where the random variable t(n-1,α) follows a Student’s t distribution with n-1 degrees of freedom x is the sample mean, sx the sample standard deviation, n the sample size, and μ0 the critical rating for which the attribute is considered as most signifi-cant. For this study μ0 is fixed at 3 because by definition, ratings above 3 represent ‘more significant’ and ‘most significant’ attributes according to the scale.
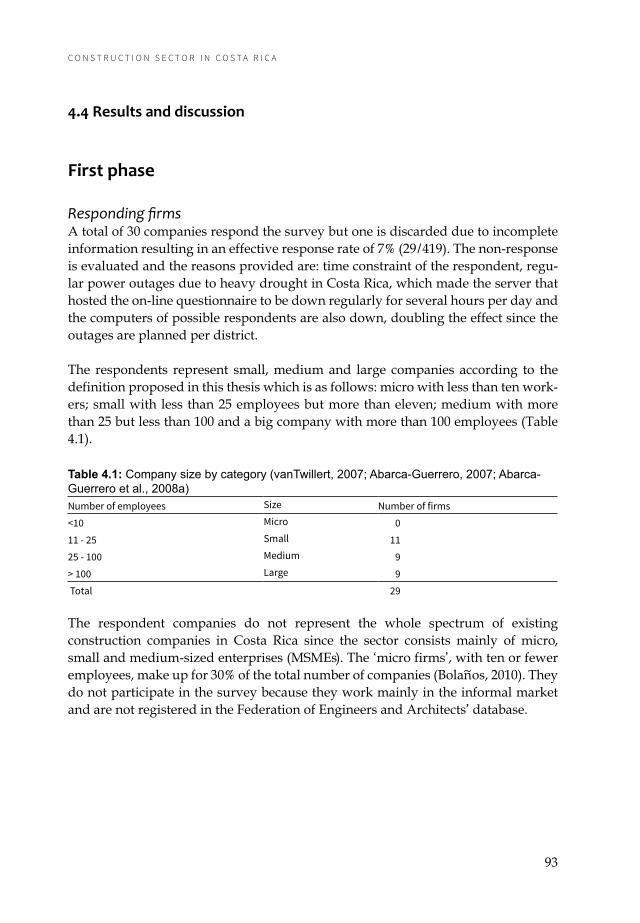
93
C O N S T R U C T I O N S E C T O R I N C O S T A R I C A
4.4 Results and discussion
First phase
Responding firmsA total of 30 companies respond the survey but one is discarded due to incomplete information resulting in an effective response rate of 7% (29/419). The non-response is evaluated and the reasons provided are: time constraint of the respondent, regu-lar power outages due to heavy drought in Costa Rica, which made the server that hosted the on-line questionnaire to be down regularly for several hours per day and the computers of possible respondents are also down, doubling the effect since the outages are planned per district.
The respondents represent small, medium and large companies according to the definition proposed in this thesis which is as follows: micro with less than ten work-ers; small with less than 25 employees but more than eleven; medium with more than 25 but less than 100 and a big company with more than 100 employees (Table 4.1).
Table 4.1: Company size by category (vanTwillert, 2007; Abarca-Guerrero, 2007; Abarca-Guerrero et al., 2008a)Number of employees Size Number of firms
<10 Micro 0
11 - 25 Small 11
25 - 100 Medium 9
> 100 Large 9
Total 29
The respondent companies do not represent the whole spectrum of existing construction companies in Costa Rica since the sector consists mainly of micro, small and medium-sized enterprises (MSMEs). The ‘micro firms’, with ten or fewer employees, make up for 30% of the total number of companies (Bolaños, 2010). They do not participate in the survey because they work mainly in the informal market and are not registered in the Federation of Engineers and Architects’ database.
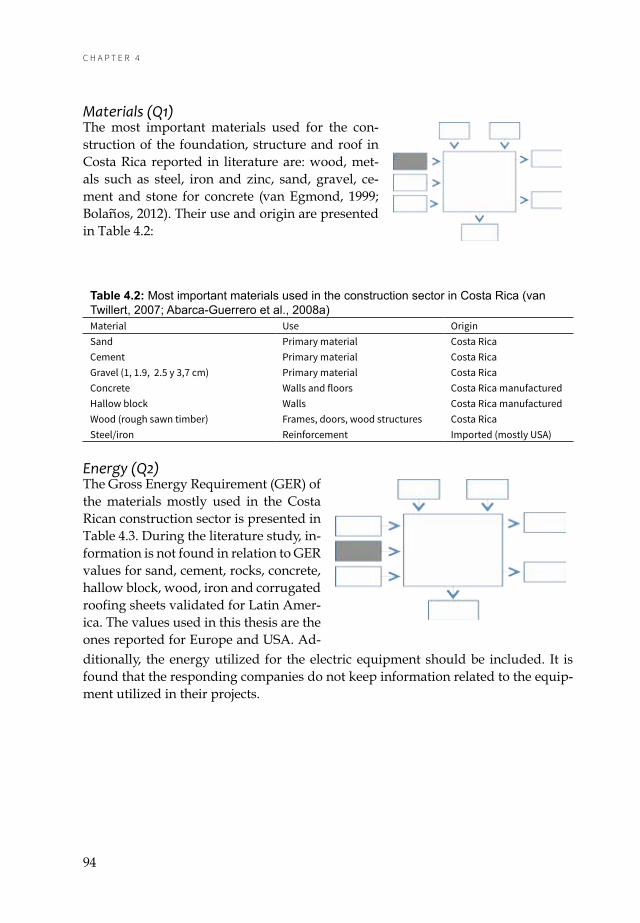
94
C H A P T E R 4
Materials (Q1)The most important materials used for the con-struction of the foundation, structure and roof in Costa Rica reported in literature are: wood, met-als such as steel, iron and zinc, sand, gravel, ce-ment and stone for concrete (van Egmond, 1999; Bolaños, 2012). Their use and origin are presented in Table 4.2:
Table 4.2: Most important materials used in the construction sector in Costa Rica (van Twillert, 2007; Abarca-Guerrero et al., 2008a)Material Use OriginSand Primary material Costa RicaCement Primary material Costa RicaGravel (1, 1.9, 2.5 y 3,7 cm) Primary material Costa RicaConcrete Walls and floors Costa Rica manufacturedHallow block Walls Costa Rica manufacturedWood (rough sawn timber) Frames, doors, wood structures Costa RicaSteel/iron Reinforcement Imported (mostly USA)
Energy (Q2)The Gross Energy Requirement (GER) of the materials mostly used in the Costa Rican construction sector is presented in Table 4.3. During the literature study, in-formation is not found in relation to GER values for sand, cement, rocks, concrete, hallow block, wood, iron and corrugated roofing sheets validated for Latin Amer-ica. The values used in this thesis are the ones reported for Europe and USA. Ad-
ditionally, the energy utilized for the electric equipment should be included. It is found that the responding companies do not keep information related to the equip-ment utilized in their projects.
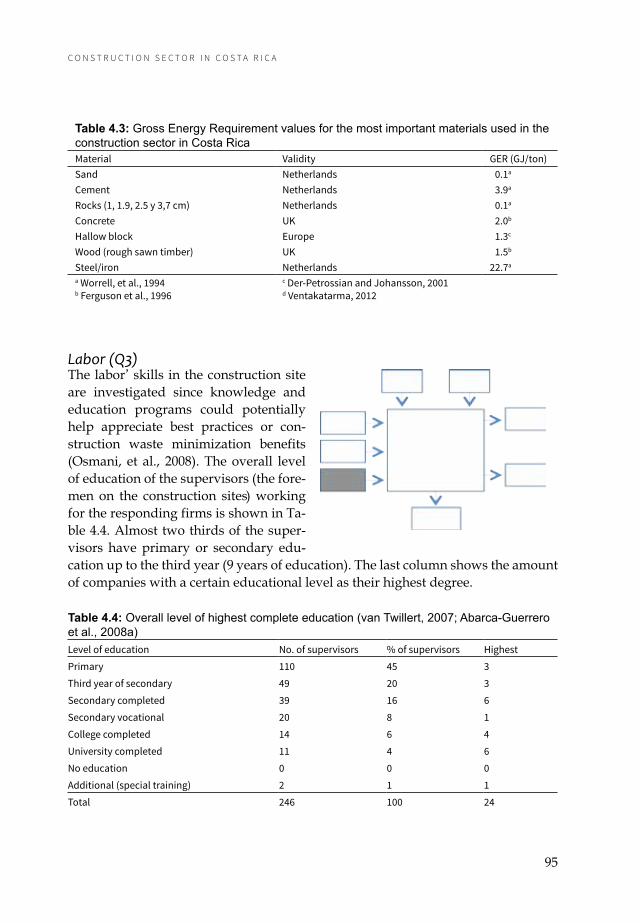
95
C O N S T R U C T I O N S E C T O R I N C O S T A R I C A
Table 4.3: Gross Energy Requirement values for the most important materials used in the construction sector in Costa RicaMaterial Validity GER (GJ/ton)Sand Netherlands 0.1a
Cement Netherlands 3.9a
Rocks (1, 1.9, 2.5 y 3,7 cm) Netherlands 0.1a
Concrete UK 2.0b
Hallow block Europe 1.3c
Wood (rough sawn timber) UK 1.5b
Steel/iron Netherlands 22.7a
a Worrell, et al., 1994b Ferguson et al., 1996
c Der-Petrossian and Johansson, 2001d Ventakatarma, 2012
Labor (Q3)The labor’ skills in the construction site are investigated since knowledge and education programs could potentially help appreciate best practices or con-struction waste minimization benefits (Osmani, et al., 2008). The overall level of education of the supervisors (the fore-men on the construction sites) working for the responding firms is shown in Ta-ble 4.4. Almost two thirds of the super-visors have primary or secondary edu-cation up to the third year (9 years of education). The last column shows the amount of companies with a certain educational level as their highest degree.
Table 4.4: Overall level of highest complete education (van Twillert, 2007; Abarca-Guerrero et al., 2008a)Level of education No. of supervisors % of supervisors Highest
Primary 110 45 3
Third year of secondary 49 20 3
Secondary completed 39 16 6
Secondary vocational 20 8 1
College completed 14 6 4
University completed 11 4 6
No education 0 0 0
Additional (special training) 2 1 1
Total 246 100 24
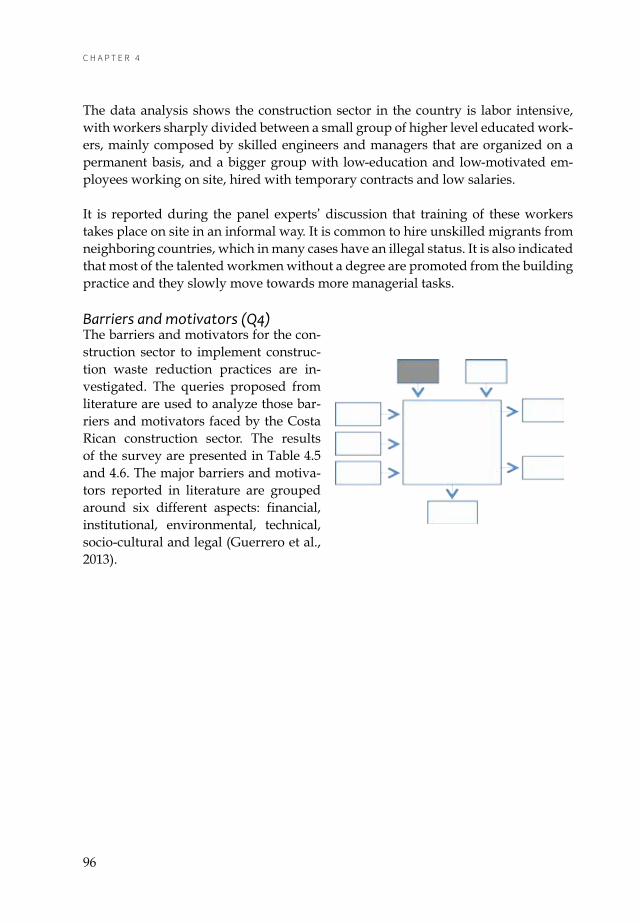
96
C H A P T E R 4
The data analysis shows the construction sector in the country is labor intensive, with workers sharply divided between a small group of higher level educated work-ers, mainly composed by skilled engineers and managers that are organized on a permanent basis, and a bigger group with low-education and low-motivated em-ployees working on site, hired with temporary contracts and low salaries.
It is reported during the panel experts’ discussion that training of these workers takes place on site in an informal way. It is common to hire unskilled migrants from neighboring countries, which in many cases have an illegal status. It is also indicated that most of the talented workmen without a degree are promoted from the building practice and they slowly move towards more managerial tasks.
Barriers and motivators (Q4) The barriers and motivators for the con-struction sector to implement construc-tion waste reduction practices are in-vestigated. The queries proposed from literature are used to analyze those bar-riers and motivators faced by the Costa Rican construction sector. The results of the survey are presented in Table 4.5 and 4.6. The major barriers and motiva-tors reported in literature are grouped around six different aspects: financial, institutional, environmental, technical, socio-cultural and legal (Guerrero et al., 2013).
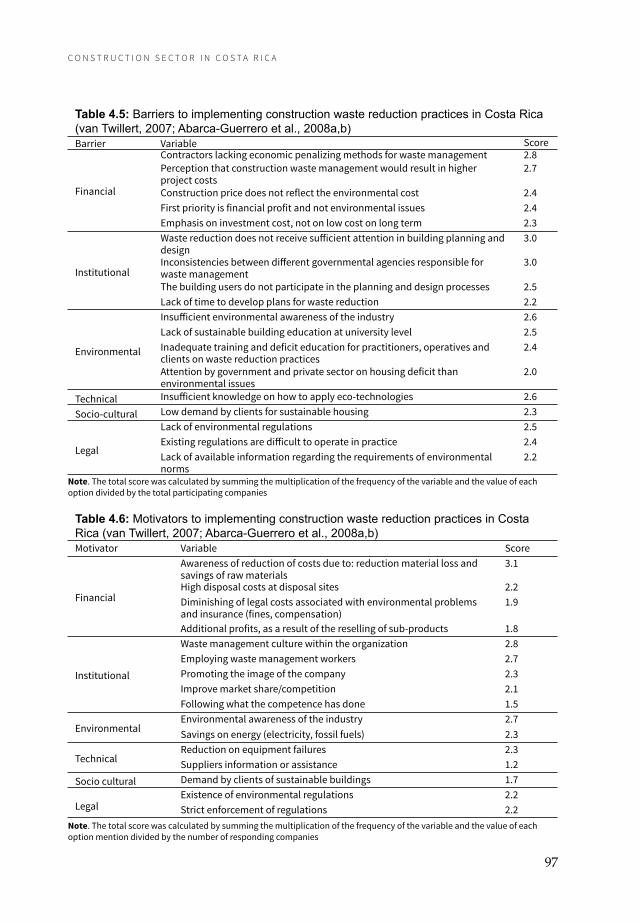
97
C O N S T R U C T I O N S E C T O R I N C O S T A R I C A
Table 4.5: Barriers to implementing construction waste reduction practices in Costa Rica (van Twillert, 2007; Abarca-Guerrero et al., 2008a,b)Barrier Variable Score
Financial
Contractors lacking economic penalizing methods for waste management 2.8Perception that construction waste management would result in higher project costs
2.7
Construction price does not reflect the environmental cost 2.4First priority is financial profit and not environmental issues 2.4Emphasis on investment cost, not on low cost on long term 2.3
Institutional
Waste reduction does not receive sufficient attention in building planning and design
3.0
Inconsistencies between different governmental agencies responsible for waste management
3.0
The building users do not participate in the planning and design processes 2.5Lack of time to develop plans for waste reduction 2.2
Environmental
Insufficient environmental awareness of the industry 2.6Lack of sustainable building education at university level 2.5Inadequate training and deficit education for practitioners, operatives and clients on waste reduction practices
2.4
Attention by government and private sector on housing deficit than environmental issues
2.0
Technical Insufficient knowledge on how to apply eco-technologies 2.6
Socio-cultural Low demand by clients for sustainable housing 2.3
Legal
Lack of environmental regulations 2.5Existing regulations are difficult to operate in practice 2.4Lack of available information regarding the requirements of environmental norms
2.2
Note. The total score was calculated by summing the multiplication of the frequency of the variable and the value of each option divided by the total participating companies
Table 4.6: Motivators to implementing construction waste reduction practices in Costa Rica (van Twillert, 2007; Abarca-Guerrero et al., 2008a,b)Motivator Variable Score
Financial
Awareness of reduction of costs due to: reduction material loss and savings of raw materials
3.1
High disposal costs at disposal sites 2.2Diminishing of legal costs associated with environmental problems and insurance (fines, compensation)
1.9
Additional profits, as a result of the reselling of sub-products 1.8
Institutional
Waste management culture within the organization 2.8Employing waste management workers 2.7Promoting the image of the company 2.3Improve market share/competition 2.1Following what the competence has done 1.5
EnvironmentalEnvironmental awareness of the industry 2.7Savings on energy (electricity, fossil fuels) 2.3
TechnicalReduction on equipment failures 2.3Suppliers information or assistance 1.2
Socio cultural Demand by clients of sustainable buildings 1.7
LegalExistence of environmental regulations 2.2Strict enforcement of regulations 2.2
Note. The total score was calculated by summing the multiplication of the frequency of the variable and the value of each option mention divided by the number of responding companies
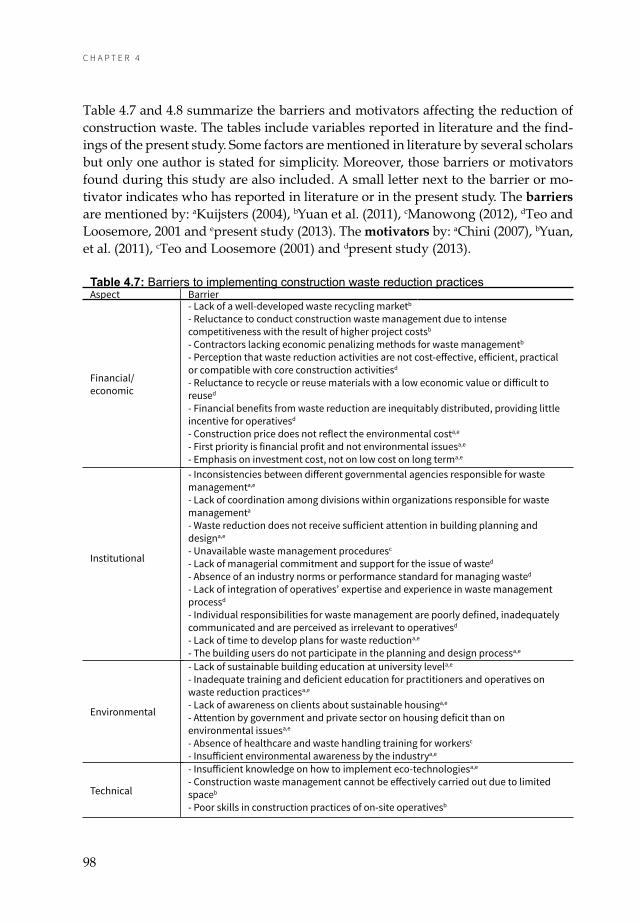
98
C H A P T E R 4
Table 4.7 and 4.8 summarize the barriers and motivators affecting the reduction of construction waste. The tables include variables reported in literature and the find-ings of the present study. Some factors are mentioned in literature by several scholars but only one author is stated for simplicity. Moreover, those barriers or motivators found during this study are also included. A small letter next to the barrier or mo-tivator indicates who has reported in literature or in the present study. The barriers are mentioned by: aKuijsters (2004), bYuan et al. (2011), cManowong (2012), dTeo and Loosemore, 2001 and epresent study (2013). The motivators by: aChini (2007), bYuan, et al. (2011), cTeo and Loosemore (2001) and dpresent study (2013).
Table 4.7: Barriers to implementing construction waste reduction practices Aspect Barrier
Financial/economic
- Lack of a well-developed waste recycling marketb
- Reluctance to conduct construction waste management due to intense competitiveness with the result of higher project costsb
- Contractors lacking economic penalizing methods for waste managementb
- Perception that waste reduction activities are not cost-effective, efficient, practical or compatible with core construction activitiesd
- Reluctance to recycle or reuse materials with a low economic value or difficult to reused
- Financial benefits from waste reduction are inequitably distributed, providing little incentive for operativesd - Construction price does not reflect the environmental costa,e
- First priority is financial profit and not environmental issuesa,e
- Emphasis on investment cost, not on low cost on long terma,e
Institutional
- Inconsistencies between different governmental agencies responsible for waste managementa,e
- Lack of coordination among divisions within organizations responsible for waste managementa
- Waste reduction does not receive sufficient attention in building planning and designa,e
- Unavailable waste management proceduresc
- Lack of managerial commitment and support for the issue of wasted
- Absence of an industry norms or performance standard for managing wasted
- Lack of integration of operatives’ expertise and experience in waste management processd
- Individual responsibilities for waste management are poorly defined, inadequately communicated and are perceived as irrelevant to operativesd - Lack of time to develop plans for waste reductiona,e
- The building users do not participate in the planning and design processa,e
Environmental
- Lack of sustainable building education at university levela,e
- Inadequate training and deficient education for practitioners and operatives on waste reduction practicesa,e
- Lack of awareness on clients about sustainable housinga,e
- Attention by government and private sector on housing deficit than on environmental issuesa,e
- Absence of healthcare and waste handling training for workersc
- Insufficient environmental awareness by the industrya,e
Technical
- Insufficient knowledge on how to implement eco-technologiesa,e - Construction waste management cannot be effectively carried out due to limited spaceb
- Poor skills in construction practices of on-site operativesb
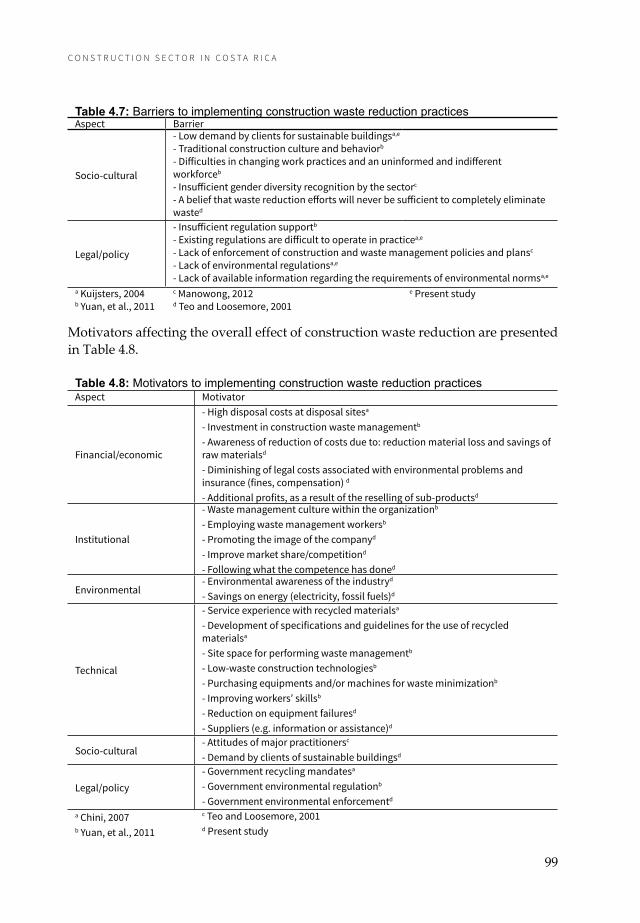
99
C O N S T R U C T I O N S E C T O R I N C O S T A R I C A
Table 4.7: Barriers to implementing construction waste reduction practices Aspect Barrier
Socio-cultural
- Low demand by clients for sustainable buildingsa,e
- Traditional construction culture and behaviorb - Difficulties in changing work practices and an uninformed and indifferent workforceb
- Insufficient gender diversity recognition by the sectorc
- A belief that waste reduction efforts will never be sufficient to completely eliminate wasted
Legal/policy
- Insufficient regulation supportb
- Existing regulations are difficult to operate in practicea,e
- Lack of enforcement of construction and waste management policies and plansc - Lack of environmental regulationsa,e
- Lack of available information regarding the requirements of environmental normsa,e
a Kuijsters, 2004b Yuan, et al., 2011
c Manowong, 2012d Teo and Loosemore, 2001
e Present study
Motivators affecting the overall effect of construction waste reduction are presented in Table 4.8.
Table 4.8: Motivators to implementing construction waste reduction practicesAspect Motivator
Financial/economic
- High disposal costs at disposal sitesa
- Investment in construction waste managementb
- Awareness of reduction of costs due to: reduction material loss and savings of raw materialsd - Diminishing of legal costs associated with environmental problems and insurance (fines, compensation) d
- Additional profits, as a result of the reselling of sub-productsd
Institutional
- Waste management culture within the organizationb
- Employing waste management workersb - Promoting the image of the companyd
- Improve market share/competitiond
- Following what the competence has doned
Environmental- Environmental awareness of the industryd
- Savings on energy (electricity, fossil fuels)d
Technical
- Service experience with recycled materialsa - Development of specifications and guidelines for the use of recycled materialsa
- Site space for performing waste managementb
- Low-waste construction technologiesb
- Purchasing equipments and/or machines for waste minimizationb
- Improving workers’ skillsb
- Reduction on equipment failuresd
- Suppliers (e.g. information or assistance)d
Socio-cultural- Attitudes of major practitionersc - Demand by clients of sustainable buildingsd
Legal/policy- Government recycling mandatesa - Government environmental regulationb - Government environmental enforcementd
a Chini, 2007b Yuan, et al., 2011
c Teo and Loosemore, 2001d Present study
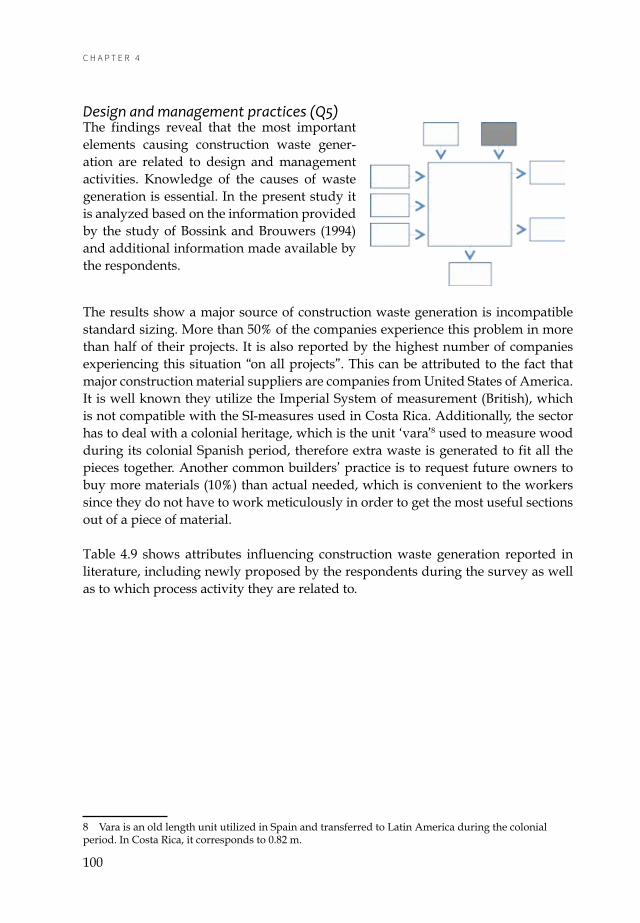
100
C H A P T E R 4
Design and management practices (Q5)The findings reveal that the most important elements causing construction waste gener-ation are related to design and management activities. Knowledge of the causes of waste generation is essential. In the present study it is analyzed based on the information provided by the study of Bossink and Brouwers (1994) and additional information made available by the respondents.
The results show a major source of construction waste generation is incompatible standard sizing. More than 50% of the companies experience this problem in more than half of their projects. It is also reported by the highest number of companies experiencing this situation “on all projects”. This can be attributed to the fact that major construction material suppliers are companies from United States of America. It is well known they utilize the Imperial System of measurement (British), which is not compatible with the SI-measures used in Costa Rica. Additionally, the sector has to deal with a colonial heritage, which is the unit ‘vara’8 used to measure wood during its colonial Spanish period, therefore extra waste is generated to fit all the pieces together. Another common builders’ practice is to request future owners to buy more materials (10%) than actual needed, which is convenient to the workers since they do not have to work meticulously in order to get the most useful sections out of a piece of material.
Table 4.9 shows attributes influencing construction waste generation reported in literature, including newly proposed by the respondents during the survey as well as to which process activity they are related to.
8 Vara is an old length unit utilized in Spain and transferred to Latin America during the colonial period. In Costa Rica, it corresponds to 0.82 m.
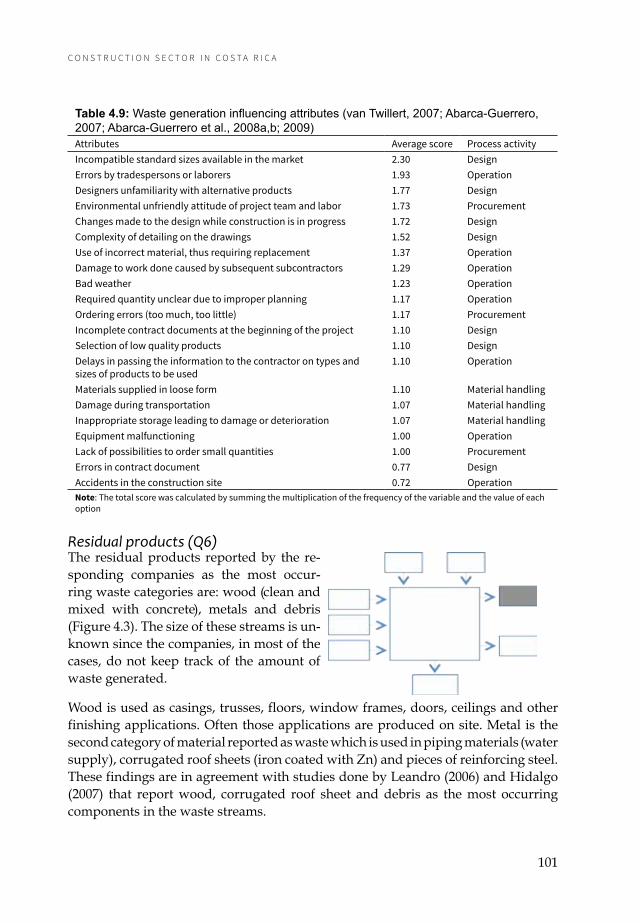
101
C O N S T R U C T I O N S E C T O R I N C O S T A R I C A
Table 4.9: Waste generation influencing attributes (van Twillert, 2007; Abarca-Guerrero, 2007; Abarca-Guerrero et al., 2008a,b; 2009)Attributes Average score Process activityIncompatible standard sizes available in the market 2.30 DesignErrors by tradespersons or laborers 1.93 OperationDesigners unfamiliarity with alternative products 1.77 DesignEnvironmental unfriendly attitude of project team and labor 1.73 ProcurementChanges made to the design while construction is in progress 1.72 DesignComplexity of detailing on the drawings 1.52 DesignUse of incorrect material, thus requiring replacement 1.37 OperationDamage to work done caused by subsequent subcontractors 1.29 OperationBad weather 1.23 OperationRequired quantity unclear due to improper planning 1.17 OperationOrdering errors (too much, too little) 1.17 ProcurementIncomplete contract documents at the beginning of the project 1.10 DesignSelection of low quality products 1.10 DesignDelays in passing the information to the contractor on types and sizes of products to be used
1.10 Operation
Materials supplied in loose form 1.10 Material handlingDamage during transportation 1.07 Material handlingInappropriate storage leading to damage or deterioration 1.07 Material handlingEquipment malfunctioning 1.00 OperationLack of possibilities to order small quantities 1.00 ProcurementErrors in contract document 0.77 DesignAccidents in the construction site 0.72 OperationNote: The total score was calculated by summing the multiplication of the frequency of the variable and the value of each option
Residual products (Q6)The residual products reported by the re-sponding companies as the most occur-ring waste categories are: wood (clean and mixed with concrete), metals and debris (Figure 4.3). The size of these streams is un-known since the companies, in most of the cases, do not keep track of the amount of waste generated.
Wood is used as casings, trusses, floors, window frames, doors, ceilings and other finishing applications. Often those applications are produced on site. Metal is the second category of material reported as waste which is used in piping materials (water supply), corrugated roof sheets (iron coated with Zn) and pieces of reinforcing steel. These findings are in agreement with studies done by Leandro (2006) and Hidalgo (2007) that report wood, corrugated roof sheet and debris as the most occurring components in the waste streams.
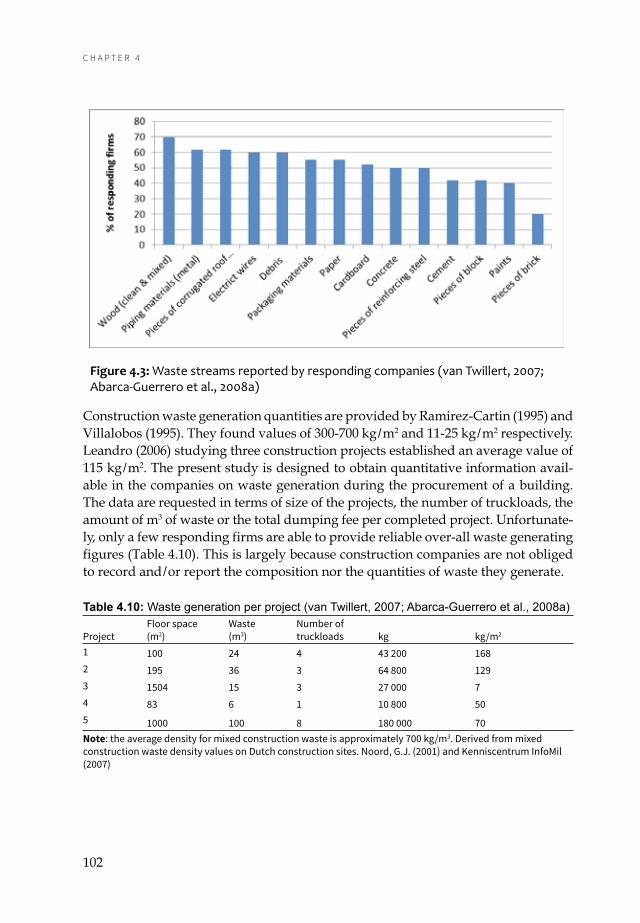
102
C H A P T E R 4
Figure 4.3: Waste streams reported by responding companies (van Twillert, 2007; Abarca-Guerrero et al., 2008a)
Construction waste generation quantities are provided by Ramirez-Cartin (1995) and Villalobos (1995). They found values of 300-700 kg/m2 and 11-25 kg/m2 respectively. Leandro (2006) studying three construction projects established an average value of 115 kg/m2. The present study is designed to obtain quantitative information avail-able in the companies on waste generation during the procurement of a building. The data are requested in terms of size of the projects, the number of truckloads, the amount of m3 of waste or the total dumping fee per completed project. Unfortunate-ly, only a few responding firms are able to provide reliable over-all waste generating figures (Table 4.10). This is largely because construction companies are not obliged to record and/or report the composition nor the quantities of waste they generate.
Table 4.10: Waste generation per project (van Twillert, 2007; Abarca-Guerrero et al., 2008a)
ProjectFloor space(m2)
Waste(m3)
Number of truckloads kg kg/m2
1 100 24 4 43 200 1682 195 36 3 64 800 1293 1504 15 3 27 000 74 83 6 1 10 800 505 1000 100 8 180 000 70Note: the average density for mixed construction waste is approximately 700 kg/m 3. Derived from mixed construction waste density values on Dutch construction sites. Noord, G.J. (2001) and Kenniscentrum InfoMil (2007)

103
C O N S T R U C T I O N S E C T O R I N C O S T A R I C A
The answers show that most of the companies (83%) participating in the survey are not aware and do not keep track of the total amount of waste generated and in 22% of the cases they do not know the final destination of the waste they produce. Of the visited construction sites, four of the five illustrate these findings and the interviews with the supervisors clearly also confirm the facts. In the Costa Rican waste man-agement legislation (SCIJ, 2013), it is mentioned that all waste generators must keep an updated control of the amounts of waste produced and proper registration of the final disposal sites. Enforcement of the law is still a challenge in the country.
A waste management plan (WMP) puts the waste issue on the map, making it the first step to identify whether potential waste problem exists (Poon, et al., 2004). The results presented in Table 4.11 indicate that few companies (13%) have a waste man-agement plan or an employee/manager with the responsibility of guarantying an ef-ficient and responsible waste handling at the start of the projects. Companies report (13%) they have both (plan and manager), but 74% of the responding firms do not have a plan nor manager. This reflects the fact that working in an environmentally friendly way is not institutionalized yet within the construction companies in Costa Rica.
Table 4.11: Use of waste plan and/or waste manager (van Twillert, 2007; Abarca-Guerrero et al., 2008a)
Number of companiesPercentage of companies
Plan only 1 3Manager only 3 10Both 4 13None 22 74 Total 30 100%
Residual energy (Q7)The residual energy in the construction materials produced as waste is related to the embedded energy of: sand, gravel and pebbles (0.1 GJ/ton), cement (3.9 GJ/ton), concrete (1.1 GJ/ton), hallow blocks (1.3 GJ/ton), wood (rough sawn timber) (1.5 GJ/ton) and steel (22.7 GJ/ton). The values are reported in Table 3.1 and are valid for Europe and USA.
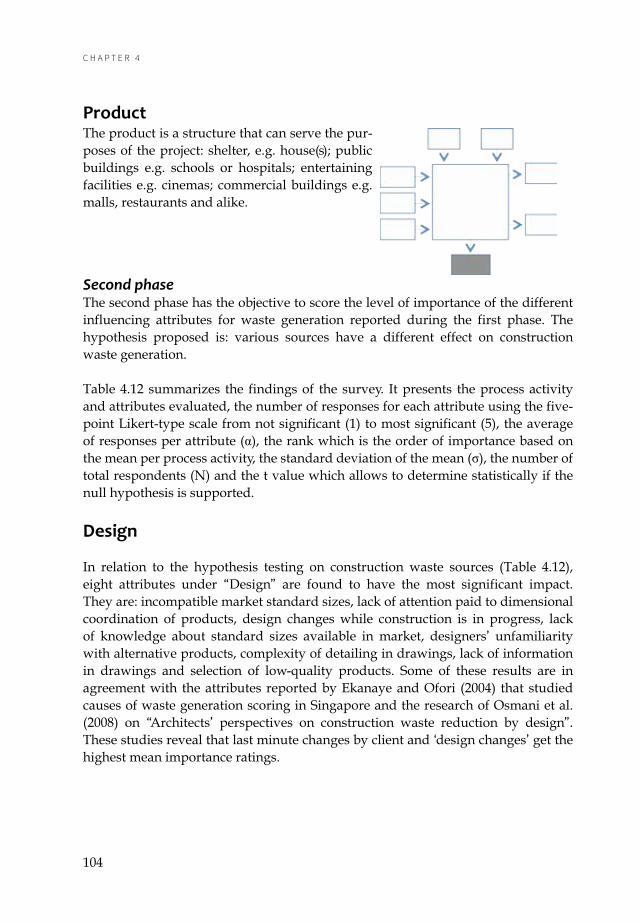
104
C H A P T E R 4
ProductThe product is a structure that can serve the pur-poses of the project: shelter, e.g. house(s); public buildings e.g. schools or hospitals; entertaining facilities e.g. cinemas; commercial buildings e.g. malls, restaurants and alike.
Second phaseThe second phase has the objective to score the level of importance of the different influencing attributes for waste generation reported during the first phase. The hypothesis proposed is: various sources have a different effect on construction waste generation.
Table 4.12 summarizes the findings of the survey. It presents the process activity and attributes evaluated, the number of responses for each attribute using the five-point Likert-type scale from not significant (1) to most significant (5), the average of responses per attribute (α), the rank which is the order of importance based on the mean per process activity, the standard deviation of the mean (σ), the number of total respondents (N) and the t value which allows to determine statistically if the null hypothesis is supported.
Design
In relation to the hypothesis testing on construction waste sources (Table 4.12), eight attributes under “Design” are found to have the most significant impact. They are: incompatible market standard sizes, lack of attention paid to dimensional coordination of products, design changes while construction is in progress, lack of knowledge about standard sizes available in market, designers’ unfamiliarity with alternative products, complexity of detailing in drawings, lack of information in drawings and selection of low-quality products. Some of these results are in agreement with the attributes reported by Ekanaye and Ofori (2004) that studied causes of waste generation scoring in Singapore and the research of Osmani et al. (2008) on “Architects’ perspectives on construction waste reduction by design”. These studies reveal that last minute changes by client and ‘design changes’ get the highest mean importance ratings.
105
C O N S T R U C T I O N S E C T O R I N C O S T A R I C A
Construction processFive attributes are found under “Construction process”. They are: ordering errors (too much or too little), lack of possibility to order small quantities, and design chang-es while construction is in progress. These attributes are also reported by Ekanage and Ofori study in 2004. Additionally this study finds that the use of incorrect ma-terial thus requiring replacement and purchases not complying with specifications are waste generation sources. Gavilan and Bernold (1994) report errors in ordering and shipping as the main cause of construction waste generation in the construction process.
Material managementFive attributes are shown under “Materials management”. They are: damages while transporting, inappropriate site storage, unfriendly attitudes of project team and workers, lack of environmental awareness of employees on site and lack of techni-cal direction for workers on site. The t test of the means on the attribute materials supplied loose shows that the attribute is not significant contributor to site waste generation. Some of these results are also in agreement with the ones reported by Gavilan and Bernold (1994) in which they indicate that improper handling and stor-age of construction materials is a cause for waste generation while Ekanage and Ofori (2004) report inappropriate site storage as the only cause.
OperationFive attributes are presented in Table 4.12 as “Operation” related. They are: use of incorrect material thus requiring replacement, damage to work done due to subse-quent trade persons, required quantity unclear due to improper planning, delays in providing information to contractors regarding types and sizes of products to be used and errors by trades persons or laborers. The t test of the means on the attrib-utes accidents due to negligence and malfunctioning of equipment show that the attributes are not significant contributor to site waste generation. Both findings are in agreement with the results presented by Ekanage and Ofori (2004).
ResidualsThree attributes are reported as “Residuals”. They are: waste from application pro-cesses, packaging material and pre-existing demolition.
OthersTwo attributes under “Others” are identified. They are: lack of material control on site and lack of waste management plan. The t test of the means on the attributes show that three attributes are not significant contributors to site waste generation: theft, natural disaster and inclement weather.
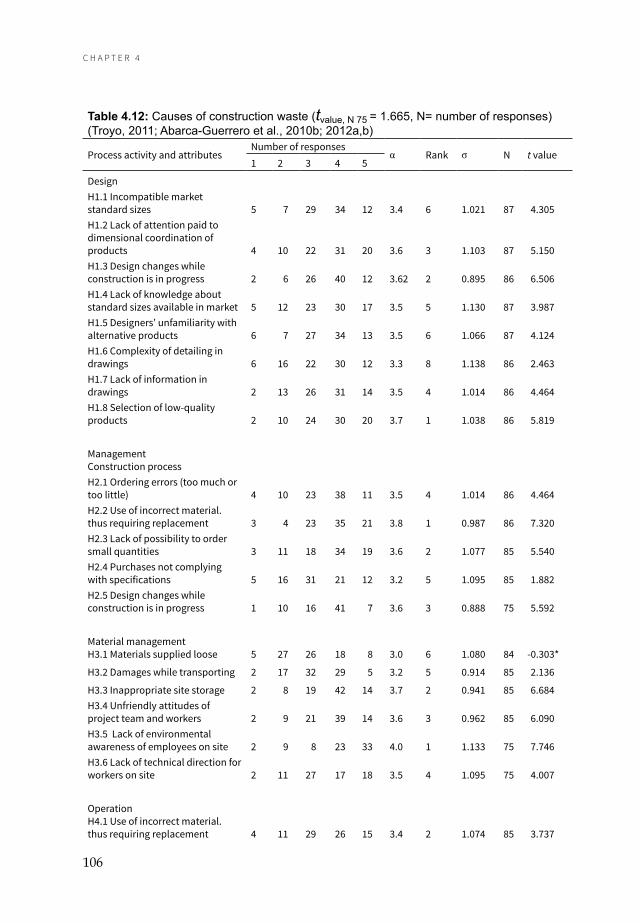
106
C H A P T E R 4
Table 4.12: Causes of construction waste (tvalue, N 75 = 1.665, N= number of responses) (Troyo, 2011; Abarca-Guerrero et al., 2010b; 2012a,b)
Process activity and attributesNumber of responses
α Rank σ N t value1 2 3 4 5
Design H1.1 Incompatible market standard sizes 5 7 29 34 12 3.4 6 1.021 87 4.305H1.2 Lack of attention paid to dimensional coordination of products 4 10 22 31 20 3.6 3 1.103 87 5.150H1.3 Design changes while construction is in progress 2 6 26 40 12 3.62 2 0.895 86 6.506H1.4 Lack of knowledge about standard sizes available in market 5 12 23 30 17 3.5 5 1.130 87 3.987H1.5 Designers’ unfamiliarity with alternative products 6 7 27 34 13 3.5 6 1.066 87 4.124H1.6 Complexity of detailing in drawings 6 16 22 30 12 3.3 8 1.138 86 2.463H1.7 Lack of information in drawings 2 13 26 31 14 3.5 4 1.014 86 4.464H1.8 Selection of low-quality products 2 10 24 30 20 3.7 1 1.038 86 5.819
ManagementConstruction processH2.1 Ordering errors (too much or too little) 4 10 23 38 11 3.5 4 1.014 86 4.464H2.2 Use of incorrect material. thus requiring replacement 3 4 23 35 21 3.8 1 0.987 86 7.320H2.3 Lack of possibility to order small quantities 3 11 18 34 19 3.6 2 1.077 85 5.540H2.4 Purchases not complying with specifications 5 16 31 21 12 3.2 5 1.095 85 1.882H2.5 Design changes while construction is in progress 1 10 16 41 7 3.6 3 0.888 75 5.592
Material managementH3.1 Materials supplied loose 5 27 26 18 8 3.0 6 1.080 84 -0.303*
H3.2 Damages while transporting 2 17 32 29 5 3.2 5 0.914 85 2.136
H3.3 Inappropriate site storage 2 8 19 42 14 3.7 2 0.941 85 6.684H3.4 Unfriendly attitudes of project team and workers 2 9 21 39 14 3.6 3 0.962 85 6.090H3.5 Lack of environmental awareness of employees on site 2 9 8 23 33 4.0 1 1.133 75 7.746H3.6 Lack of technical direction for workers on site 2 11 27 17 18 3.5 4 1.095 75 4.007
OperationH4.1 Use of incorrect material. thus requiring replacement 4 11 29 26 15 3.4 2 1.074 85 3.737
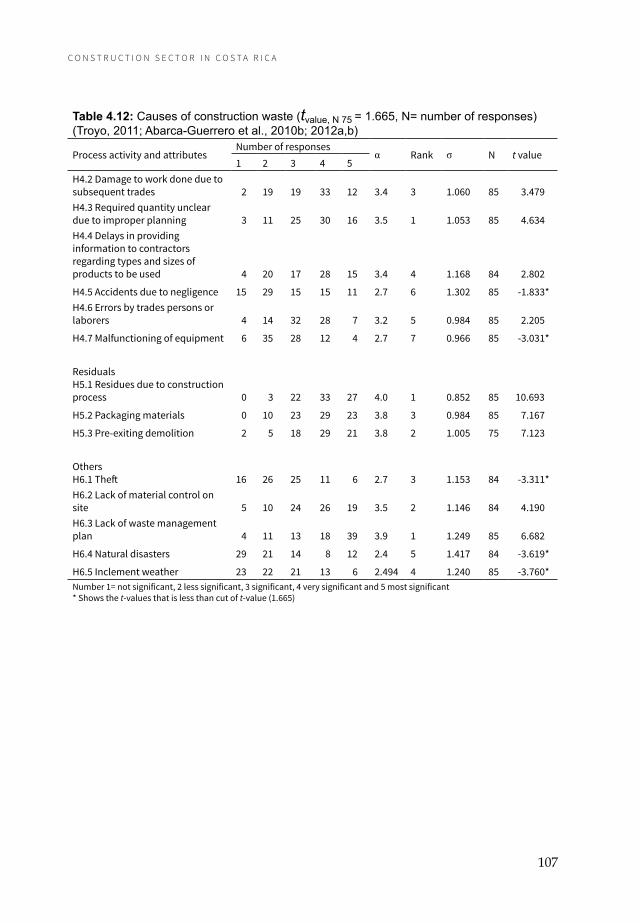
107
C O N S T R U C T I O N S E C T O R I N C O S T A R I C A
Table 4.12: Causes of construction waste (tvalue, N 75 = 1.665, N= number of responses) (Troyo, 2011; Abarca-Guerrero et al., 2010b; 2012a,b)
Process activity and attributesNumber of responses
α Rank σ N t value1 2 3 4 5
H4.2 Damage to work done due to subsequent trades 2 19 19 33 12 3.4 3 1.060 85 3.479H4.3 Required quantity unclear due to improper planning 3 11 25 30 16 3.5 1 1.053 85 4.634H4.4 Delays in providing information to contractors regarding types and sizes of products to be used 4 20 17 28 15 3.4 4 1.168 84 2.802
H4.5 Accidents due to negligence 15 29 15 15 11 2.7 6 1.302 85 -1.833*H4.6 Errors by trades persons or laborers 4 14 32 28 7 3.2 5 0.984 85 2.205
H4.7 Malfunctioning of equipment 6 35 28 12 4 2.7 7 0.966 85 -3.031*
ResidualsH5.1 Residues due to construction process 0 3 22 33 27 4.0 1 0.852 85 10.693
H5.2 Packaging materials 0 10 23 29 23 3.8 3 0.984 85 7.167
H5.3 Pre-exiting demolition 2 5 18 29 21 3.8 2 1.005 75 7.123
OthersH6.1 Theft 16 26 25 11 6 2.7 3 1.153 84 -3.311*H6.2 Lack of material control on site 5 10 24 26 19 3.5 2 1.146 84 4.190H6.3 Lack of waste management plan 4 11 13 18 39 3.9 1 1.249 85 6.682
H6.4 Natural disasters 29 21 14 8 12 2.4 5 1.417 84 -3.619*
H6.5 Inclement weather 23 22 21 13 6 2.494 4 1.240 85 -3.760*Number 1= not significant, 2 less significant, 3 significant, 4 very significant and 5 most significant * Shows the t-values that is less than cut of t-value (1.665)
108
C H A P T E R 4
4.5 ConclusionsThis chapter shows how appropriate the construction waste generation model ap-plied in Costa Rica to determine the most important challenges the construction sector faces while improving their construction practices. It illustrates design and management practices play a very important role in waste generation. It also expos-es the barriers the sector is facing in the effort to be more efficient, but also which motivators can be used to accelerate the process. The model also helps to determine materials and energy used for the procurement of buildings as well as waste gener-ation and residual energy loss due to inefficiencies. The model determined the level of education of the working construction force in the Costa Rican setting. The model is applied in Costa Rica but can be applied to other developing countries as a means to study construction waste generation.
This study adds to knowledge on construction waste and it widens the understand-ing of construction waste sources and their degree of significance. The results point out that various sources have a different effect on construction waste generation.
The literature study presents limited information, including discrepancies found on the reports of construction waste quantities. During this study, the participating companies report waste generation with significant variations (7-168 kg/m2). Partic-ipants acknowledge not keeping reliable records. The analysis on the composition of waste confirms the presence of recyclable materials. Chinchilla (2007) also found, by performing a material flow analysis in some construction projects in Costa Rica, that up to 80% of the materials produced as waste are recyclable.
Furthermore, some of the waste materials generated, e.g. concrete and steel, are energy intensive during production with high CO2 emissions. Each metric ton of cement or concrete produced as waste represents 5 GJ or 1.4 GJ respectively lost in legal or illegal disposal sites. Each ton of unused steel represents 30 GJ of energy dissipated to the environment (NRMCA, 2008, p.8).
Construction material waste generation is complex due to the large number of in-fluencing factors. Therefore, understanding the causes of the inefficiencies in the use of materials could contribute to diminish environmental pressure and increase construction industry revenues.
The construction sector in Costa Rica is labor intensive, relying mainly on unskilled workers, trained on site and moving rapidly among construction projects. The same situation is reported in Indonesia, 51% of the workforce consisted of unskilled work-ers (Alwi et.al., 2002).

109
C O N S T R U C T I O N S E C T O R I N C O S T A R I C A
This study intends to contribute and extend a growing research stream document-ing construction sector challenges in developing countries. Identifying major barri-ers and motivators for waste reduction practices, allows the user to determine which ones must be implemented to improve the performance of the sector. Table 4.7 and 4.8 show barriers and motivators associated with financial, institutional, environ-mental, technical, socio-cultural and legal aspects. Similar findings are obtained by Guerrero et al. (2013) analyzing factors that influence waste management system.
A comparison on the impact of certain variables on waste management systems at a city level (Guerrero et al., 2013) and those that influence the construction company’s waste reduction practices at the company level, show the presence and absence of economic instruments or other financial benefits are motivators or barriers respec-tively. A more efficient waste management system in a city as well as waste reduction practices in the construction sector. Similarly, the coordination among departments, the presence of waste management plans and the leadership and commitment of decision makers at the municipal level or at the construction company level appears to influence the performance of the systems in both cases. Awareness and skills of citizens and employees at the city level or at the company level are crucial for an efficient system. The attitudes of the practitioners and clients as well as the citizens and the presence of an efficient, sufficient and well enforced legal system seem to be influential in the performance of waste management systems in the cities as well as waste reduction practices in the construction sector.
Future research in relation to barriers and motivators for construction waste reduc-tion practices could be the investigation of limitations faced in the present study. During the preparation of the survey, few articles are found on studies that had ana-lyzed barriers and motivators for waste reduction practices. Therefore a new survey template is introduced (Appendix 4.3) which considers all the items described in Tables 4.7 and 4.8.
Another limitation of this research concerns the sample population, drawn from a list of CFIA members. It can be claimed the results of this research are applicable only to firms in that population. In order to portray the true scope of the Costa Rican construction industry, future research should include micro-firms representing thir-ty percent of the total construction companies. These enterprises are not included on the CFIA database.
110
C H A P T E R 4
References
Abarca-Guerrero, L., 2007. Assessment of construction waste management practice: a case study in Costa Rica. In: Proceedings of Kalmar ECO-TECH’07: International Confer-ence on Technologies for Waste and Wastewater Treatment, Energy from Waste, Remediation of Contaminated Sites and Emissions Related to Climate. Kalmar: University of Kalmar, Swe-den, 26-28 November 2007.
Abarca-Guerrero, L., 2008. Sustainable con-struction in Costa Rica: Towards a strategic ap-proach to construction material management for waste reduction (Keynote speaker). Costa Ri-can Congress of Civil Engineers, Costa Rica.
Abarca-Guerrero L, Scheublin FM, Eg-mond-de Wilde de Ligny ELC van, Lambert AJD., 2008a. Sustainable Construction: To-wards a strategic approach to construction material management for waste reduction (Poster). 10th PhD symposium of the Research School Integral Design Structures. Delft: Tech-nische Universiteit. Available at: <www.os-bouw.nl/phd_projects_2008/Abarca_2008.pdf> [Accessed 3 November 2009].
Abarca-Guerrero L, Scheublin FM, Eg-mond-de Wilde de Ligny ELC van, 2008b. Sustainable construction in Costa Rica: To-wards a strategic approach to construction material management for waste reduction. In: Proceedings BuHu 8th International Post-graduate Research Conference. Prague, Czech Republic, pp.452-462. ISSN: 1759-0574.. ISSN: 1759-0574.
Abarca-Guerrero L, Scheublin FM, Eg-mond-de Wilde de Ligny ELC van, Lambert AJD., 2009. Metabolism of materials by the construction sector in developing countries:
Costa Rica as case study. In: Proceedings of Third CIB International Conference on Smart and Sustainable Built Environments. SASBE 2009. Delft, The Netherlands.
Abarca-Guerrero, L., Troyo- Valverde, F., Maas, G., 2010a. Construction waste manage-ment in Costa Rica. Congreso de Ingeniería Civil, Infraestructura: desafío de la década. San José, Costa Rica.
Abarca, L., Maas, G.J., Lambert, A.J.D., 2010b. Black box opener, tools to assess material use in the Costa Rica construction sector. In: Pro-ceedings of the CIB World Congress: Building a better world. School of the Built Environment, University of Salford, UK, 10-13 May 2010.
Abarca-Guerrero, Maas, G.J, Lambert, A.J.D., Troyo-Valverde, F., 2012a. Construction waste in Costa Rica. In: Proceedings ISWA World Solid Waste Congress. Florence, Italy, 17-19 September 2012.
Abarca-Guerrero, Maas, G.J, Lambert, A.J.D., 2012b. Construction waste generation due to design phase. Gerontechnology, 11(2), pp.137-138.
Alwi, S.; Hampson, K., Mohamed, S., 2002. Waste in the Indonesian Construction Pro-ject. In: Proceedings of the 1st International Con-ferences of CIB W107 – Creating a Sustainable Construction Industry in Developing Countries. South Africa, 11-13 November 2002.
Bolaños, F., 2010. Discussion on Sizes of Costa Rican companies. Federation of Engineers and Architects (CFIA). Personal communication.
111
C O N S T R U C T I O N S E C T O R I N C O S T A R I C A
Bolaños, F., 2012. Discussion on materials used in the construction sector and variables affecting construction waste generation. Federation of Engineers and Architects (CFIA). Personal communication.
Bossink, B.A.G, Brouwers, H.J.H., 1996. Con-struction waste: quantification and source evaluation. J. of Construction Engineering and Management, 122(1), pp.55-60.
CCC (Camara Costarricense de la Construc-cion), 2012. Available at: <http://www.con-struccion.co.cr/> [Accessed 01 October 2012].
CFIA (Colegio Federado de Ingenieros y Ar-quitectos), 2012. Indicadores CFIA de la Con-strucción Costa Rica. Available at: <http://www.cfia.or.cr/descargas_2013/estadisticas/estadisticas_2012.pdf> [Accessed 03 April 2012].
Chinchilla, L., 2007. Resultados estudio de desechos de empresa constructora Fomento Urbano. Foro Manejo de desechos en Costa Rica, 13th September, 2007.
Chini, A.R., 2007. General issues of construc-tion materials recycling in USA. In: Proceed-ings of Sustainable construction 2007-Materials and Practices. Lisbon, Portugal, pp.848-855.
CIA (Central Intelligence Agency), 2013. The World Factbook. Available at: <https://www.cia.gov/library/publications/the-world-factbook> [Accessed 28 February 2013].
CSU (Colorado State University) 2012. Elec-tronic Survey. Available at: <http://writ-ing.colostate.edu/guides/page.cfm?page-id=1406> [Accessed 22 November 2012].
De Vellis, R.F., 1991. Scale Development: Theo-ry and Applications. Newbury Park, CA: Sage Publications.
Der-Petrossian, B., Johansson, E., 2001. Con-struction and Environment Improving en-ergy efficiency. Building Issues, 10(2), pp.1-21. Available at <http://www.google.co.uk/search?hl=en&q=embodied+energy+hallow +block&meta=> [Accessed 6 September 2012].
Dillman, D.A., 1978. Mail and telephone sur-veys: the total design method. New York: John Wiley & Sons.
Ekanayake, L.L., Ofori, G., 2004. Building waste assessment score: design-based tool. Building and Environment, 39(7), pp.851-861.
Ekere, W., Mugisha, J., Drake, L., 2009. Fac-tors influencing waste separation and utiliza-tion among households in the Lake Victoria crescent, Uganda. Waste Management Journal, 29(12), 3047–3051.
Ferguson, I., La Fontaine, B., Vinden, P., Bren, L., Hateley, R., Hermesec, B., 1996. Environ-mental properties of timber. Research Paper commissioned by the Forest & Wood Prod-ucts Research 7 Development Corporation. Available at: <http://www.google.co.uk/search?hl=en&q=timber+and+embod-ied+energy&meta=> [Accessed 06 Septem-ber 2012].
Gavilan, R.M., Bernold, L.E., 1994. Source evaluation of solid waste in building con-struction. Journal of Construction Engineering and Management, 122(1), pp.55-60.
112
C H A P T E R 4
Guerrero, L.A., Maas, G., Hogland, W., 2013. Solid waste management challenges for cities in developing countries. Waste Management Journal, 33(1), pp.220-232.
Hidalgo, A., 2007. Resultados estudio del Cen-tro Nacional de Producción más Limpia. Foro Manejo de desechos en Costa Rica, 13th Sep-tember, 2007.
INEC (Instituto Nacional de Estadistica y Censos), 2012. Estadisticas. Available at: <http://www.inec.go.cr/Web/Home/pag-Principal.aspx#> [Accessed 14 February 2012].
Kenniscentrum InfoMil, 2007. Available at: <www.infomil.nl> (Accessed 02.02.2007).
Kuijsters A., 2004. Environmental response of the Chilean building sector. MSc. Eindhoven University of Technology.
Leandro, A.G., 2006. Discussion on quantities and sources of construction waste generation. Re-searcher Costa Rica Institute of Technology, Personal communication.
Manowong, E., 2012. Investigating factors influencing construction waste management efforts in developing countries: an experi-ence from Thailand. Waste Management and Research, 30(1), pp.56-71.
Marca, D., McGowan, S.L., 1987. Structured Analysis and Design Technique. New York: McGraw-Hill.
Matell, M.S., Jacoby, J., 1971. Is there an op-timal number of alternatives for Likert scale items? I. Reliability and validity. Educational and Psychological Measurement, 31(3), 657-674.
NEF (New Economics Foundation), 2012. UK only 74th, but Costa Rica tops “Happy Planet Index”. Available at: <http://www.neweco-nomics.org/category/tags/costa-rica> [Ac-cessed 01 November 2012].
Noord, G.J., 2001. Monografieën Mileiu 43: bouw en Sloop Afval. Technische Universiteit Delft, Vakgroep Stedebouw.
NRMCA (National Ready Mixed Concrete Association), 2008. Concrete CO2 Fact Sheet. Available at: <http://nrmca.org/GreenCon-crete/CONCRETE%20CO2%20FACT%20SHEET%20JUNE%202008.pdf> [Accessed 14 January 2014].
ODI (Oversees Development Institute), 2009. Research tools: Focus group discussions. Available at: <http://www.odi.org.uk/pub-lications/5695-focus-group-discussion> [Ac-cessed 23 November 2012].
Osmani, M., Glass, J., Price, A.D.F., 2008. Ar-chitects’ perspectives on construction waste reduction by design. Waste Management Jour-nal, 28(7), pp.1147–1158.
Poon, C.S., Yu, A.T.W., Wong, Z.W., Cheung, E., 2004. Management of construction waste in public housing projects in Hong Kong. Construction Management and Economics, 22(7), pp.675-689.
Ramírez-Cartin, M., 1995. Impacto fisico y fi-nanciero de la generacion de desechos solidos en la construccion de dos proyectos hoteleros. Lic. Dissertation, Universidad de Costa Rica.
113
C O N S T R U C T I O N S E C T O R I N C O S T A R I C A
SCIJ (Sistema costarricese de información jurídica), 2013. Ley para la gestión inte-gral de residuos. Available at: <http://www.pgr.go.cr/Scij/Busqueda/Normativa/Normas/nrm_repartidor.asp?param1=N-RTC&nValor1=1&nValor2=68300&n-Valor3=83024&strTipM=TC> [Accessed 22 December, 2013].
Teo, M.M.M., Loosemore, M., 2001. A theory of waste behavior in the construction indus-try. Construction Management and Economics, 19(7), pp.741-751.
Troyo, F. 2011. Sources of construction waste. Civil Engineering graduation project report. Universidad de Costa Rica.
UNDP (United Nations Development Pro-gramme), 2011. Human Development Report. Sustainability and Equity. A better Future for All. Available at: <http://hdr.undp.org/en/reports/global/hdr2011/ > [Accessed 01 No-vember 2012].
van Egmond, E.L.C., 1999. Technology map-ping for technology management. Ph.D. Eind-hoven University of Technology.
van Twillert, H. 2007, Costa Rican Construc-tion Sector Waste Management Assessment. M. Sc. Eindhoven University of Technology.
Venkatarama, B. V., Buildings. Department of Civil Engineering. Indian Institute of Science, Bangalore. Available at: <http://www.google. co.uk/search?hl=en&q=embodied+energy +in+mortar&meta=> [Accessed 7 September 2012].
Villalobos A.J., 1995. Estudio de Generación de Desechos en la Construcción de Viviendas de Mampostería. Lic. Dissertation, Universidad de Costa Rica.
Worrell, E., van Heijningen, R.J.J., de Castro, J.F.M., Hazewinkel, J.H.O., de Beer, J.G., Faaij, A.P.C., Vringer, K., 1994. New Gross Energy requirements figures for materials produc-tion. Energy, 19(6), pp.627-640.
Yuan, H. Chini, A., Lu, Y., Shen, L., 2012. A dynamic model for assessing the effects of management strategies on the reduction of construction and demolition waste. Waste Management Journal, 32(3), pp.521-531.
Yuan, H., Shen, L., Wang, J., 2011. Major obstacles to improving the performance of waste management in China’s construction industry. Facilities, 29(5/6), pp.224-242.

114
C H A P T E R 4
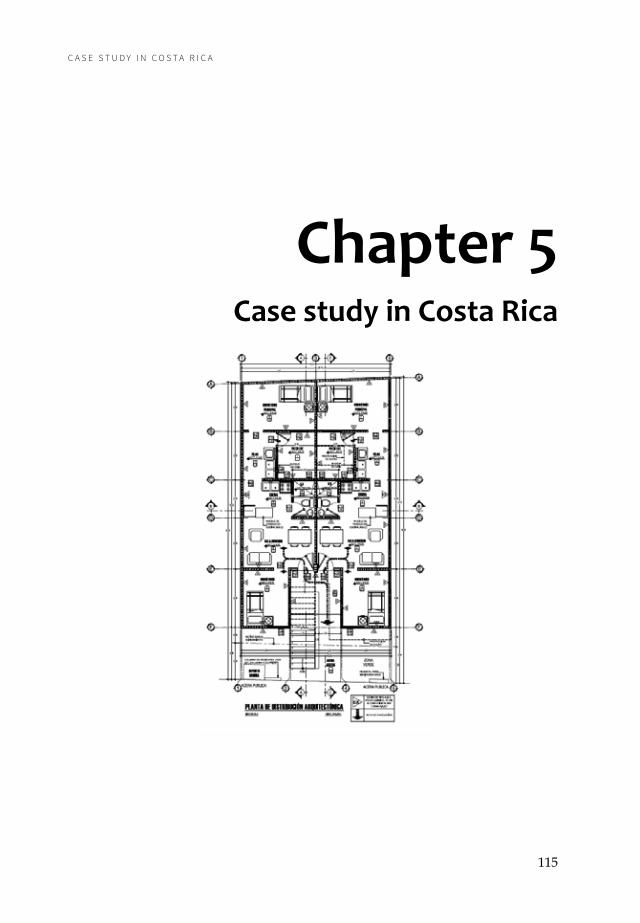
115
C A S E S T U D Y I N C O S T A R I C A
Chapter 5Case study in Costa Rica

116
C H A P T E R 5
“Waste reduction is the best and generally the most economical of the different waste management options. However, it requires an understanding of the cause and effect relationships” (Gavilan and Bernold, 1994)
117
C A S E S T U D Y I N C O S T A R I C A
5. Case study in Costa Rica9
5.1 IntroductionIn Chapter 3 the construction waste generation model is developed in order to un-veil the major factors affecting the performance and efficiency in realizing a building process. Chapter 4 reports the findings using that model which allows investigating the material flows. Material Flow Analysis (MFA) is the tool used with the objective of determining the movement of the flows from the origin of the construction of a building to waste disposal. The flows are described using: (1) materials, (2) energy; (3) residual products; (4) residual energy; and (5) product or building. The MFA pre-sents some limitations. Basically, the flows are insufficient to describe the processes that take place internally. This limitation is approached by considering the produc-tion process as a “black box” in which its internal structure is studied. In order to do so, the elements utilized for the analysis of the process are: (6) barriers and motiva-tors for environmental building practices; (7) design and management and (8) labor.
Chapter 4 also reports the limited information kept by respondents, in relation to construction waste quantities generated during the realization of the building. Re-spondents provide, in most of the cases, data that show discrepancies. In order to obtain more specific data to answer the research sub-question 3, a case study is iden-tified as the means to create a better insight on those discrepancies.
A systematic approach is developed selecting a semi-detached houses project as a case study. The objectives are:1. To determine the quantities of wood, stony materials and steel used and pro-
duced as waste during the realization of the foundation, structure and roof of the studied building.
2. To define Waste Generation Rates for each individual selected material and for the total of the project.
3. To determine the amount of residual energy associated with the waste materials.4. To unveil site material management practices and origins of construction waste
already reported in Chapter 4, utilizing a different tool than the survey.5. To apply a descriptive model for analyzing the flow of waste materials in the
construction site.
This chapter reports the following queries: (Q1): How much wood, cement, gravel and sand, blocks and steel are requested for the realization of a building? (Q2): How much wood, stony materials and steel are generated as waste during the realization of a building?
9 In process publication Waste Management Journal
118
C H A P T E R 5
(Q3): What is the Waste Generation Rate for steel, wood and stony materials in the project under study?(Q4): How much energy is associated with the residual materials (residual energy)?(Q5): Is construction waste produced due to a combination of events rather than an incident occurring in one single operation?
5.2 Literature reviewThe literature review and the panel experts’ discussion reported in Chapter 4 per-mit defining and creating tools for the analysis of: 1. amount of materials used, 2. residual products generated and 3. design and management practices during the realization of a construction project. The intention on using those tools is to provide transparency during the study. They have the main requirements of simplicity and low cost of implementation (Alvez and Formoso, 2000). A brief description of them is presented below:• The bill of quantities (‘BoQ’) provides the amounts of the materials for the
project (Response to Q1). • Weighing the residual products or waste: It consists of inspecting the quantities
of materials that turn into waste. Sources of waste are scrutinized in the dump-sters and crews are asked about the reasons for the production of the waste (Response to Q2, Q3, Q4 and Q5).
• Designs and management checklist (Response to Q5): It contains the attributes or list of things that an observer must do in order to check design and manage-ment issues during the construction or realization of the building.
• Free flow mapping (Response to Q5): a diagram that describes the flow of ma-terials in the construction site during the realization process.
The objective of the following sub-sections is to provide information found in litera-ture related to the elements assessed in the semi-detached houses project: materials, residual products, residual energy and design and management practices.
Materials (Response to Q1)The most important materials reported in literature used for the construction of the foundation, structure and roof in Costa Rica are: wood, metals such as steel, iron and zinc, sand, cement and stone for concrete (van Egmond, 1999; Bolaños, 2012).
Residual products (Response to Q2)The residual products and waste quantities are defined in Chapter 3 and 4. Liter-ature provides different approaches to determine quantities of construction waste and the limitations of the methods (Table 5.1).
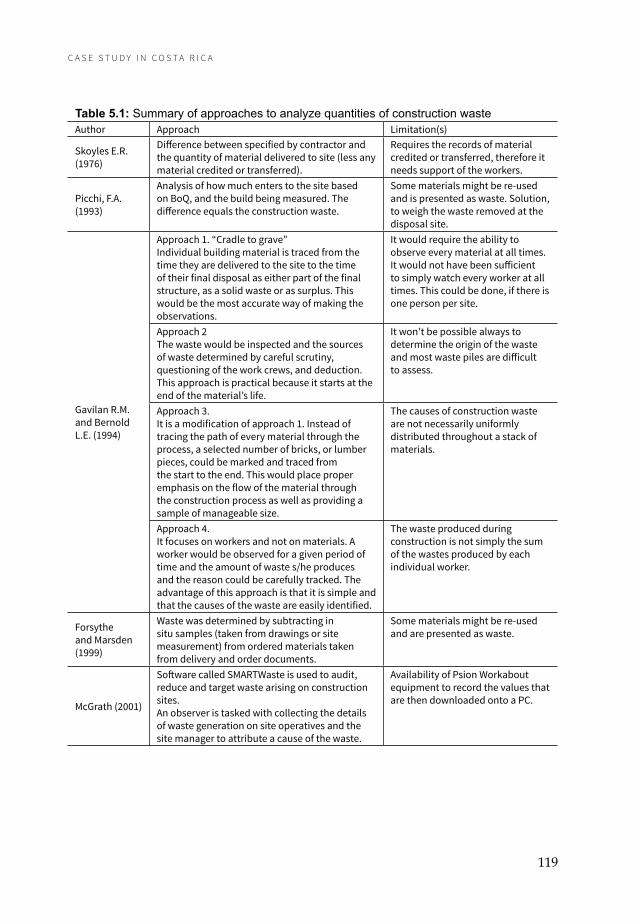
119
C A S E S T U D Y I N C O S T A R I C A
Table 5.1: Summary of approaches to analyze quantities of construction wasteAuthor Approach Limitation(s)
Skoyles E.R. (1976)
Difference between specified by contractor and the quantity of material delivered to site (less any material credited or transferred).
Requires the records of material credited or transferred, therefore it needs support of the workers.
Picchi, F.A. (1993)
Analysis of how much enters to the site based on BoQ, and the build being measured. The difference equals the construction waste.
Some materials might be re-used and is presented as waste. Solution, to weigh the waste removed at the disposal site.
Gavilan R.M. and Bernold L.E. (1994)
Approach 1. “Cradle to grave” Individual building material is traced from the time they are delivered to the site to the time of their final disposal as either part of the final structure, as a solid waste or as surplus. This would be the most accurate way of making the observations.
It would require the ability to observe every material at all times. It would not have been sufficient to simply watch every worker at all times. This could be done, if there is one person per site.
Approach 2The waste would be inspected and the sources of waste determined by careful scrutiny, questioning of the work crews, and deduction. This approach is practical because it starts at the end of the material’s life.
It won’t be possible always to determine the origin of the waste and most waste piles are difficult to assess.
Approach 3. It is a modification of approach 1. Instead of tracing the path of every material through the process, a selected number of bricks, or lumber pieces, could be marked and traced from the start to the end. This would place proper emphasis on the flow of the material through the construction process as well as providing a sample of manageable size.
The causes of construction waste are not necessarily uniformly distributed throughout a stack of materials.
Approach 4.It focuses on workers and not on materials. A worker would be observed for a given period of time and the amount of waste s/he produces and the reason could be carefully tracked. The advantage of this approach is that it is simple and that the causes of the waste are easily identified.
The waste produced during construction is not simply the sum of the wastes produced by each individual worker.
Forsythe and Marsden (1999)
Waste was determined by subtracting in situ samples (taken from drawings or site measurement) from ordered materials taken from delivery and order documents.
Some materials might be re-used and are presented as waste.
McGrath (2001)
Software called SMARTWaste is used to audit, reduce and target waste arising on construction sites. An observer is tasked with collecting the details of waste generation on site operatives and the site manager to attribute a cause of the waste.
Availability of Psion Workabout equipment to record the values that are then downloaded onto a PC.
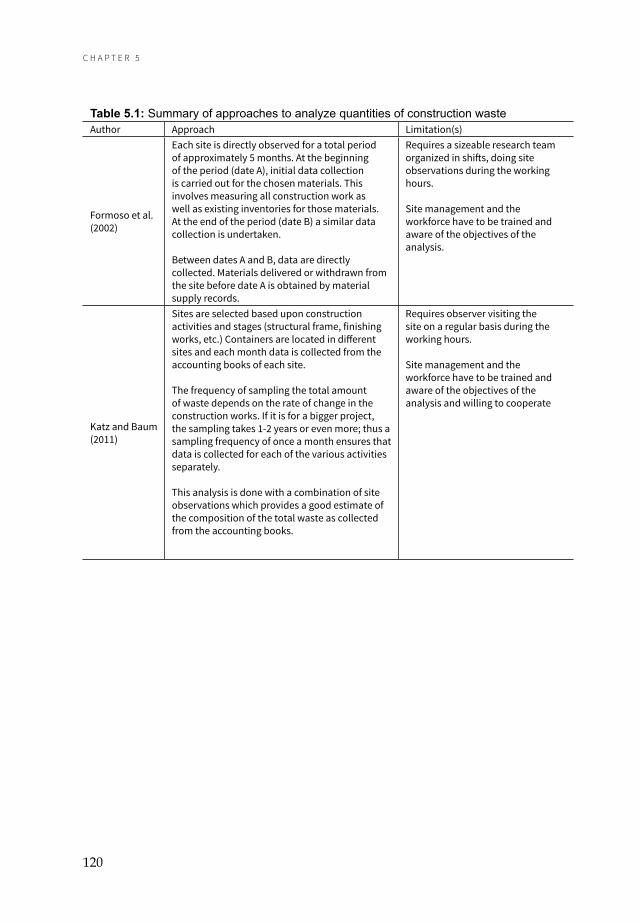
120
C H A P T E R 5
Table 5.1: Summary of approaches to analyze quantities of construction wasteAuthor Approach Limitation(s)
Formoso et al. (2002)
Each site is directly observed for a total period of approximately 5 months. At the beginning of the period (date A), initial data collection is carried out for the chosen materials. This involves measuring all construction work as well as existing inventories for those materials. At the end of the period (date B) a similar data collection is undertaken.
Between dates A and B, data are directly collected. Materials delivered or withdrawn from the site before date A is obtained by material supply records.
Requires a sizeable research team organized in shifts, doing site observations during the working hours.
Site management and the workforce have to be trained and aware of the objectives of the analysis.
Katz and Baum (2011)
Sites are selected based upon construction activities and stages (structural frame, finishing works, etc.) Containers are located in different sites and each month data is collected from the accounting books of each site.
The frequency of sampling the total amount of waste depends on the rate of change in the construction works. If it is for a bigger project, the sampling takes 1-2 years or even more; thus a sampling frequency of once a month ensures that data is collected for each of the various activities separately.
This analysis is done with a combination of site observations which provides a good estimate of the composition of the total waste as collected from the accounting books.
Requires observer visiting the site on a regular basis during the working hours.
Site management and the workforce have to be trained and aware of the objectives of the analysis and willing to cooperate
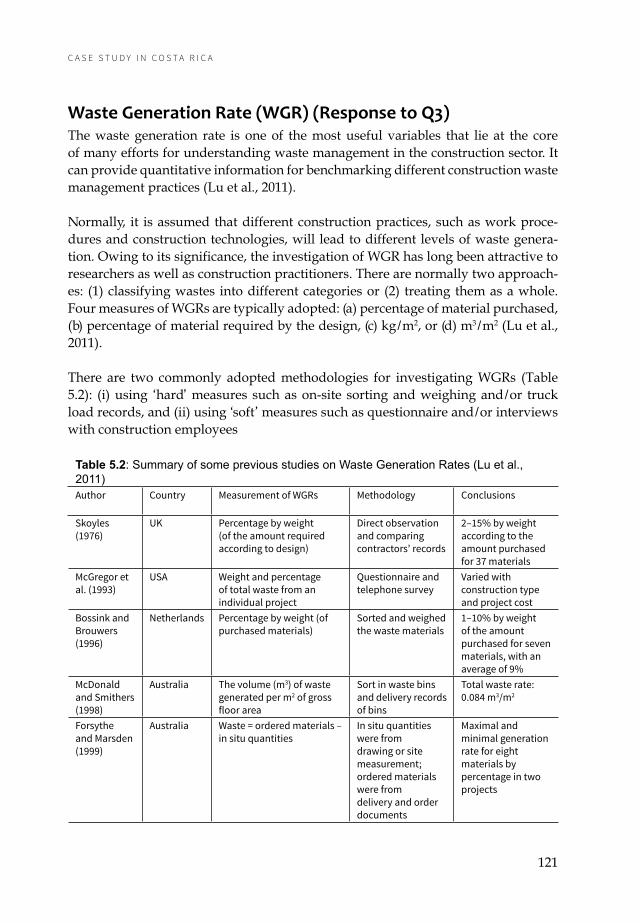
121
C A S E S T U D Y I N C O S T A R I C A
Waste Generation Rate (WGR) (Response to Q3)The waste generation rate is one of the most useful variables that lie at the core of many efforts for understanding waste management in the construction sector. It can provide quantitative information for benchmarking different construction waste management practices (Lu et al., 2011).
Normally, it is assumed that different construction practices, such as work proce-dures and construction technologies, will lead to different levels of waste genera-tion. Owing to its significance, the investigation of WGR has long been attractive to researchers as well as construction practitioners. There are normally two approach-es: (1) classifying wastes into different categories or (2) treating them as a whole. Four measures of WGRs are typically adopted: (a) percentage of material purchased, (b) percentage of material required by the design, (c) kg/m2, or (d) m3/m2 (Lu et al., 2011).
There are two commonly adopted methodologies for investigating WGRs (Table 5.2): (i) using ‘hard’ measures such as on-site sorting and weighing and/or truck load records, and (ii) using ‘soft’ measures such as questionnaire and/or interviews with construction employees
Table 5.2: Summary of some previous studies on Waste Generation Rates (Lu et al., 2011)Author Country Measurement of WGRs Methodology Conclusions
Skoyles (1976)
UK Percentage by weight (of the amount required according to design)
Direct observation and comparing contractors’ records
2–15% by weight according to the amount purchased for 37 materials
McGregor et al. (1993)
USA Weight and percentage of total waste from an individual project
Questionnaire and telephone survey
Varied with construction type and project cost
Bossink and Brouwers (1996)
Netherlands Percentage by weight (of purchased materials)
Sorted and weighed the waste materials
1–10% by weight of the amount purchased for seven materials, with an average of 9%
McDonald and Smithers (1998)
Australia The volume (m3) of waste generated per m2 of gross floor area
Sort in waste bins and delivery records of bins
Total waste rate: 0.084 m3/m2
Forsythe and Marsden (1999)
Australia Waste = ordered materials – in situ quantities
In situ quantities were from drawing or site measurement; ordered materials were from delivery and order documents
Maximal and minimal generation rate for eight materials by percentage in two projects
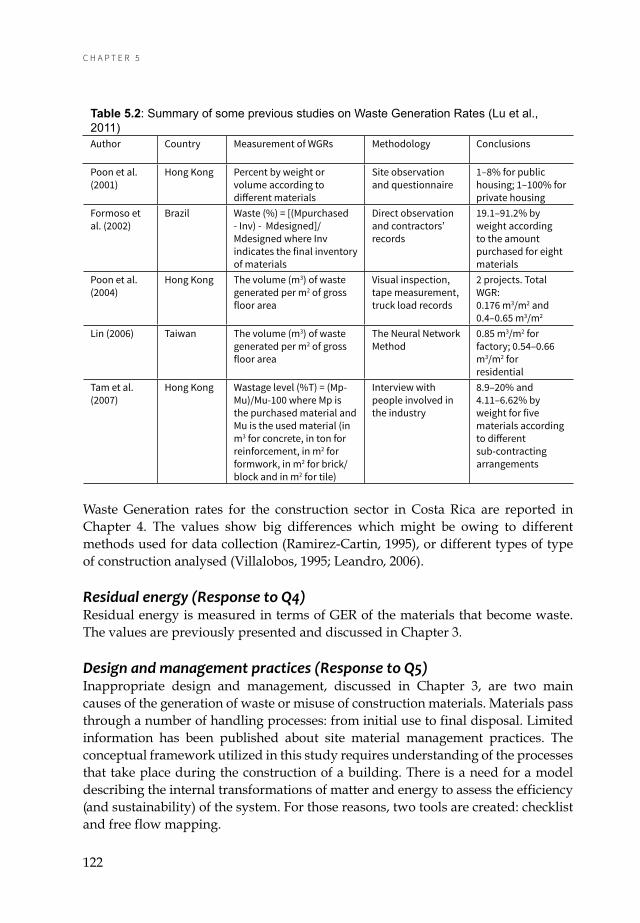
122
C H A P T E R 5
Table 5.2: Summary of some previous studies on Waste Generation Rates (Lu et al., 2011)Author Country Measurement of WGRs Methodology Conclusions
Poon et al. (2001)
Hong Kong Percent by weight or volume according to different materials
Site observation and questionnaire
1–8% for public housing; 1–100% for private housing
Formoso et al. (2002)
Brazil Waste (%) = [(Mpurchased - Inv) - Mdesigned]/Mdesigned where Inv indicates the final inventory of materials
Direct observation and contractors’ records
19.1–91.2% by weight according to the amount purchased for eight materials
Poon et al. (2004)
Hong Kong The volume (m3) of waste generated per m2 of gross floor area
Visual inspection, tape measurement, truck load records
2 projects. Total WGR:0.176 m3/m2 and 0.4–0.65 m3/m2
Lin (2006) Taiwan The volume (m3) of waste generated per m2 of gross floor area
The Neural Network Method
0.85 m3/m2 for factory; 0.54–0.66 m3/m2 for residential
Tam et al. (2007)
Hong Kong Wastage level (%T) = (Mp-Mu)/Mu-100 where Mp is the purchased material and Mu is the used material (in m3 for concrete, in ton for reinforcement, in m2 for formwork, in m2 for brick/block and in m2 for tile)
Interview with people involved in the industry
8.9–20% and 4.11–6.62% by weight for five materials according to different sub-contracting arrangements
Waste Generation rates for the construction sector in Costa Rica are reported in Chapter 4. The values show big differences which might be owing to different methods used for data collection (Ramirez-Cartin, 1995), or different types of type of construction analysed (Villalobos, 1995; Leandro, 2006).
Residual energy (Response to Q4)Residual energy is measured in terms of GER of the materials that become waste. The values are previously presented and discussed in Chapter 3.
Design and management practices (Response to Q5)Inappropriate design and management, discussed in Chapter 3, are two main causes of the generation of waste or misuse of construction materials. Materials pass through a number of handling processes: from initial use to final disposal. Limited information has been published about site material management practices. The conceptual framework utilized in this study requires understanding of the processes that take place during the construction of a building. There is a need for a model describing the internal transformations of matter and energy to assess the efficiency (and sustainability) of the system. For those reasons, two tools are created: checklist and free flow mapping.
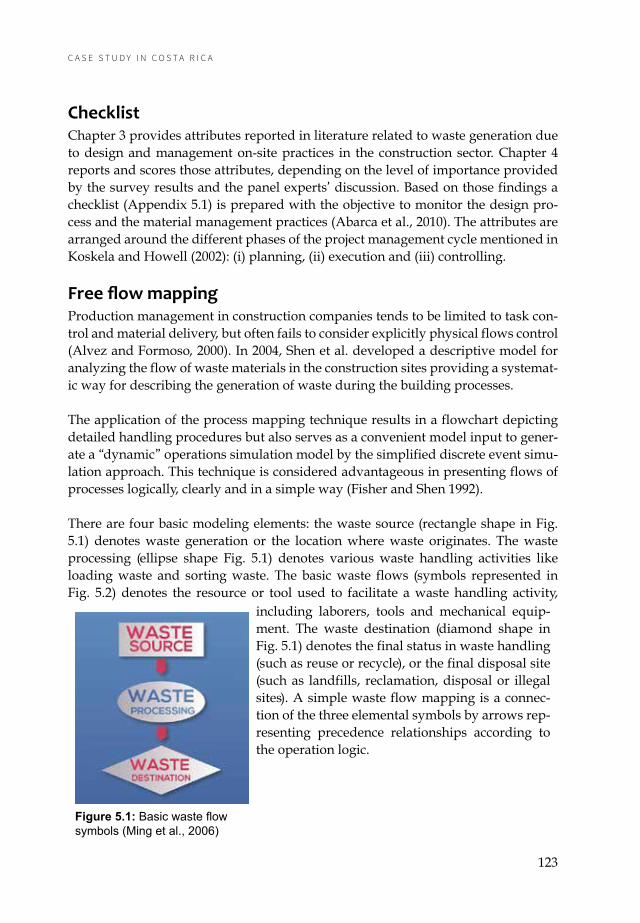
123
C A S E S T U D Y I N C O S T A R I C A
ChecklistChapter 3 provides attributes reported in literature related to waste generation due to design and management on-site practices in the construction sector. Chapter 4 reports and scores those attributes, depending on the level of importance provided by the survey results and the panel experts’ discussion. Based on those findings a checklist (Appendix 5.1) is prepared with the objective to monitor the design pro-cess and the material management practices (Abarca et al., 2010). The attributes are arranged around the different phases of the project management cycle mentioned in Koskela and Howell (2002): (i) planning, (ii) execution and (iii) controlling.
Free flow mapping Production management in construction companies tends to be limited to task con-trol and material delivery, but often fails to consider explicitly physical flows control (Alvez and Formoso, 2000). In 2004, Shen et al. developed a descriptive model for analyzing the flow of waste materials in the construction sites providing a systemat-ic way for describing the generation of waste during the building processes.
The application of the process mapping technique results in a flowchart depicting detailed handling procedures but also serves as a convenient model input to gener-ate a “dynamic” operations simulation model by the simplified discrete event simu-lation approach. This technique is considered advantageous in presenting flows of processes logically, clearly and in a simple way (Fisher and Shen 1992).
There are four basic modeling elements: the waste source (rectangle shape in Fig. 5.1) denotes waste generation or the location where waste originates. The waste processing (ellipse shape Fig. 5.1) denotes various waste handling activities like loading waste and sorting waste. The basic waste flows (symbols represented in Fig. 5.2) denotes the resource or tool used to facilitate a waste handling activity,
including laborers, tools and mechanical equip-ment. The waste destination (diamond shape in Fig. 5.1) denotes the final status in waste handling (such as reuse or recycle), or the final disposal site (such as landfills, reclamation, disposal or illegal sites). A simple waste flow mapping is a connec-tion of the three elemental symbols by arrows rep-resenting precedence relationships according to the operation logic.
Figure 5.1: Basic waste flow symbols (Ming et al., 2006)
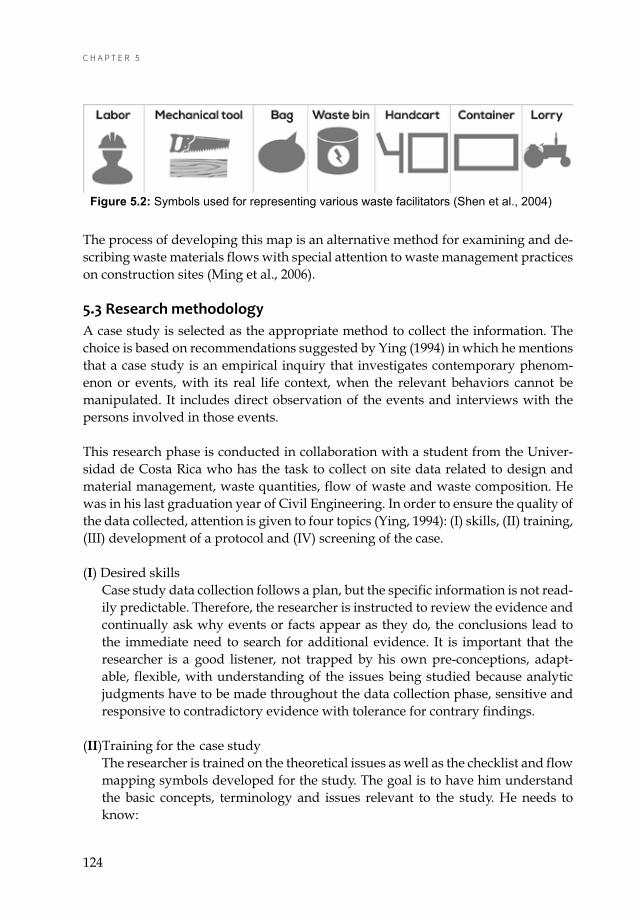
124
C H A P T E R 5
Figure 5.2: Symbols used for representing various waste facilitators (Shen et al., 2004)
The process of developing this map is an alternative method for examining and de-scribing waste materials flows with special attention to waste management practices on construction sites (Ming et al., 2006).
5.3 Research methodology A case study is selected as the appropriate method to collect the information. The choice is based on recommendations suggested by Ying (1994) in which he mentions that a case study is an empirical inquiry that investigates contemporary phenom-enon or events, with its real life context, when the relevant behaviors cannot be manipulated. It includes direct observation of the events and interviews with the persons involved in those events.
This research phase is conducted in collaboration with a student from the Univer-sidad de Costa Rica who has the task to collect on site data related to design and material management, waste quantities, flow of waste and waste composition. He was in his last graduation year of Civil Engineering. In order to ensure the quality of the data collected, attention is given to four topics (Ying, 1994): (I) skills, (II) training, (III) development of a protocol and (IV) screening of the case.
(I) Desired skillsCase study data collection follows a plan, but the specific information is not read-ily predictable. Therefore, the researcher is instructed to review the evidence and continually ask why events or facts appear as they do, the conclusions lead to the immediate need to search for additional evidence. It is important that the researcher is a good listener, not trapped by his own pre-conceptions, adapt-able, flexible, with understanding of the issues being studied because analytic judgments have to be made throughout the data collection phase, sensitive and responsive to contradictory evidence with tolerance for contrary findings.
(II)Training for the case studyThe researcher is trained on the theoretical issues as well as the checklist and flow mapping symbols developed for the study. The goal is to have him understand the basic concepts, terminology and issues relevant to the study. He needs to know:
125
C A S E S T U D Y I N C O S T A R I C A
• The objectives of the study• The evidence or data to be collected • Anticipated variations and how to react • The difference between supportive or contrary evidence for any given prop-
osition
(III) Development of a protocolThe protocol is defined in coordination with the researcher in charge of the data collection. It includes the tools as well as the procedures and general rules to be followed in using the protocol. It contains the following sections: background information about the project, the issues being investigated and field procedures (presentation of credentials, access to the case study site, general sources of in-formation). The interviews performed are more open-ended questions based on the need of information about design, material and waste management issues. It is set up a clear schedule of the data collection activities and a guide for the case study report (outline, format for the data, use and presentation of other docu-mentations, and bibliographical information).
(IV) Screening of the case study IIn order to answer the questions proposed, a residence construction project in San José is chosen over commercial or industrial. The construction is done with no waste management plan. The selection of this small project offers some dis-tinct advantages: 1. it allows the observer the opportunity to watch more activ-ities at one time, 2. it has smaller work sites, 3. it contains fewer crews working at one time, and 4. absence of heavy machinery and equipment. All these factors combined provide a reduced complexity for site observations (Gavilan and Ber-nold, 2004).
Prior to collecting the data, a set of operational criteria was defined for the case. It was as follows: Type of site: the construction project selected is a semi-detached houses with a total construction size of 190 m2 (Fig. 5.3) in the Great Metropolitan area where most con-struction takes place (CFIA, 2011).Cost: 85 000 euro.Characteristics: conventional column-beam slab frame system with hallow blocks as formwork.Level of disaggregation for data collection: foundation, structure and roofing pro-cesses.Materials: wood, steel and stony materials (raw materials for making concrete on site and concrete blocks of 15x20x40 cm with an average weight of 13,8 kg made in a factory).Duration project: 14 weeks.
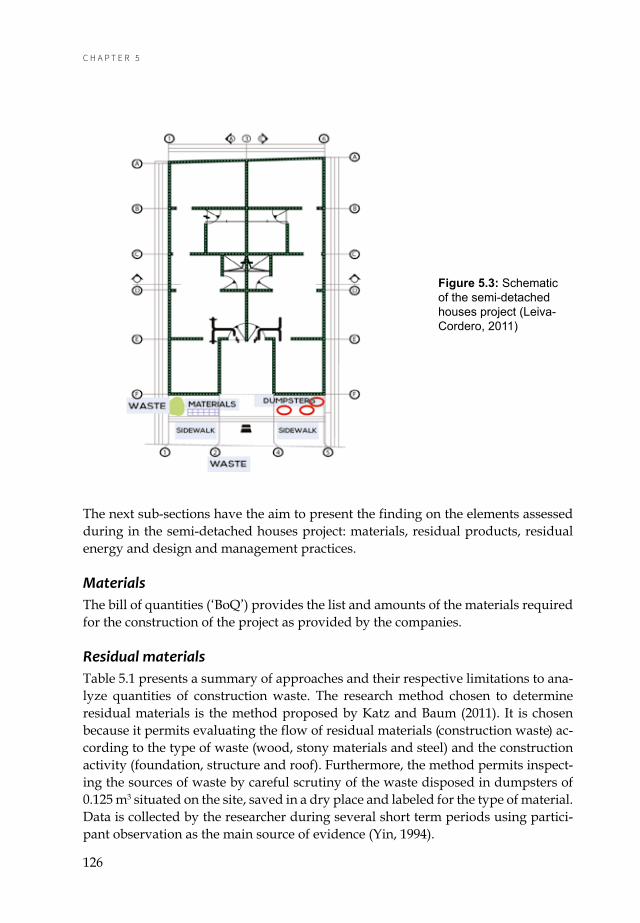
126
C H A P T E R 5
Figure 5.3: Schematic of the semi-detached houses project (Leiva-Cordero, 2011)
The next sub-sections have the aim to present the finding on the elements assessed during in the semi-detached houses project: materials, residual products, residual energy and design and management practices.
MaterialsThe bill of quantities (‘BoQ’) provides the list and amounts of the materials required for the construction of the project as provided by the companies.
Residual materialsTable 5.1 presents a summary of approaches and their respective limitations to ana-lyze quantities of construction waste. The research method chosen to determine residual materials is the method proposed by Katz and Baum (2011). It is chosen because it permits evaluating the flow of residual materials (construction waste) ac-cording to the type of waste (wood, stony materials and steel) and the construction activity (foundation, structure and roof). Furthermore, the method permits inspect-ing the sources of waste by careful scrutiny of the waste disposed in dumpsters of 0.125 m3 situated on the site, saved in a dry place and labeled for the type of material. Data is collected by the researcher during several short term periods using partici-pant observation as the main source of evidence (Yin, 1994).
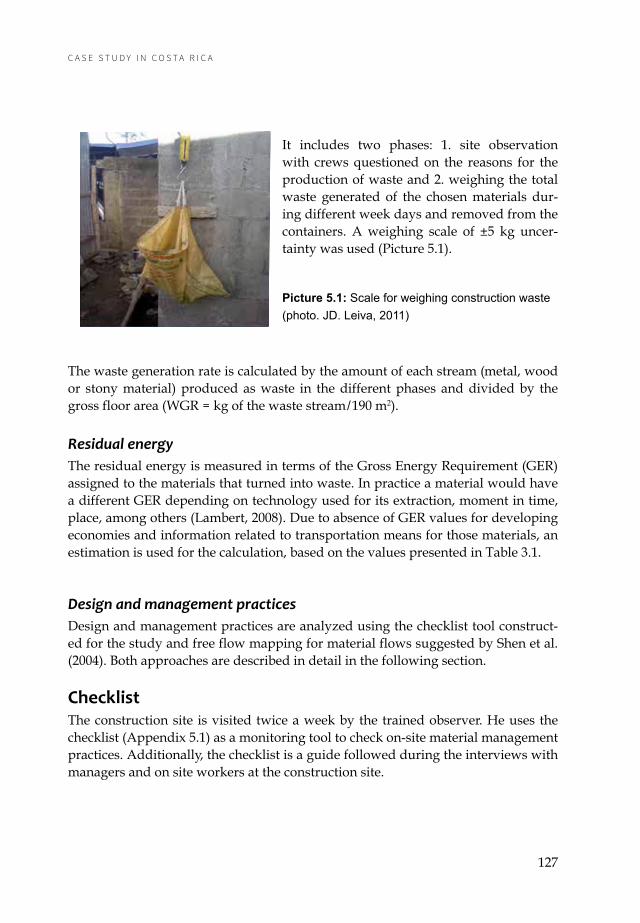
127
C A S E S T U D Y I N C O S T A R I C A
It includes two phases: 1. site observation with crews questioned on the reasons for the production of waste and 2. weighing the total waste generated of the chosen materials dur-ing different week days and removed from the containers. A weighing scale of ±5 kg uncer-tainty was used (Picture 5.1).
Picture 5.1: Scale for weighing construction waste (photo. JD. Leiva, 2011)
The waste generation rate is calculated by the amount of each stream (metal, wood or stony material) produced as waste in the different phases and divided by the gross floor area (WGR = kg of the waste stream/190 m2).
Residual energyThe residual energy is measured in terms of the Gross Energy Requirement (GER) assigned to the materials that turned into waste. In practice a material would have a different GER depending on technology used for its extraction, moment in time, place, among others (Lambert, 2008). Due to absence of GER values for developing economies and information related to transportation means for those materials, an estimation is used for the calculation, based on the values presented in Table 3.1.
Design and management practicesDesign and management practices are analyzed using the checklist tool construct-ed for the study and free flow mapping for material flows suggested by Shen et al. (2004). Both approaches are described in detail in the following section.
ChecklistThe construction site is visited twice a week by the trained observer. He uses the checklist (Appendix 5.1) as a monitoring tool to check on-site material management practices. Additionally, the checklist is a guide followed during the interviews with managers and on site workers at the construction site.
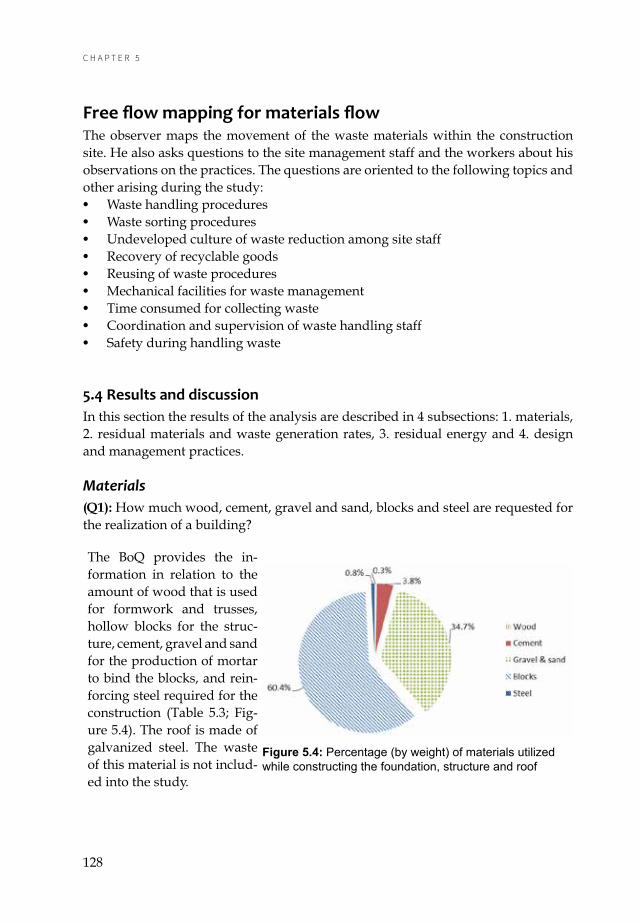
128
C H A P T E R 5
Free flow mapping for materials flowThe observer maps the movement of the waste materials within the construction site. He also asks questions to the site management staff and the workers about his observations on the practices. The questions are oriented to the following topics and other arising during the study:• Waste handling procedures• Waste sorting procedures• Undeveloped culture of waste reduction among site staff• Recovery of recyclable goods• Reusing of waste procedures• Mechanical facilities for waste management • Time consumed for collecting waste• Coordination and supervision of waste handling staff• Safety during handling waste
5.4 Results and discussionIn this section the results of the analysis are described in 4 subsections: 1. materials, 2. residual materials and waste generation rates, 3. residual energy and 4. design and management practices.
Materials (Q1): How much wood, cement, gravel and sand, blocks and steel are requested for the realization of a building?
The BoQ provides the in-formation in relation to the amount of wood that is used for formwork and trusses, hollow blocks for the struc-ture, cement, gravel and sand for the production of mortar to bind the blocks, and rein-forcing steel required for the construction (Table 5.3; Fig-ure 5.4). The roof is made of galvanized steel. The waste of this material is not includ-ed into the study.
Figure 5.4: Percentage (by weight) of materials utilized while constructing the foundation, structure and roof
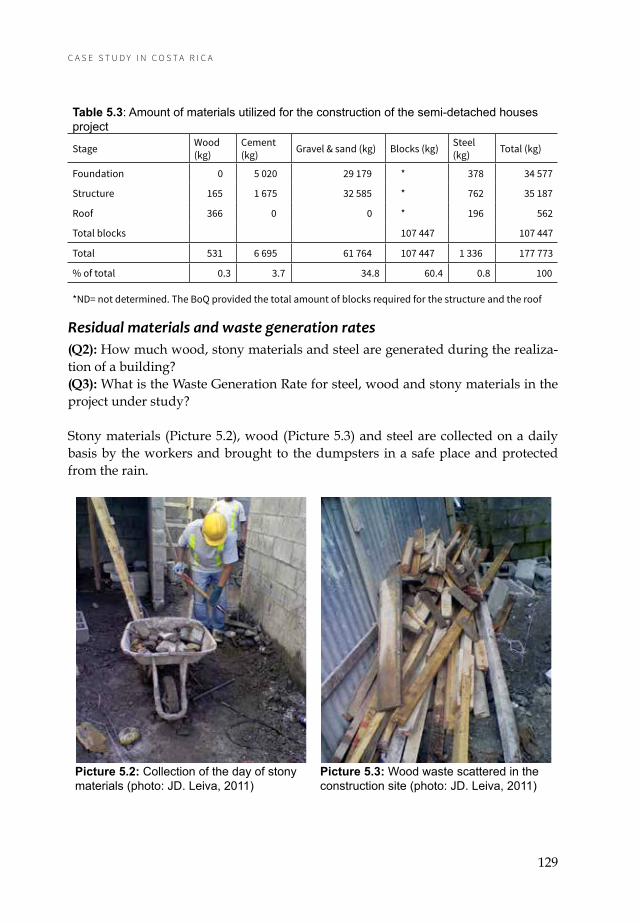
129
C A S E S T U D Y I N C O S T A R I C A
Table 5.3: Amount of materials utilized for the construction of the semi-detached houses project
Stage Wood(kg)
Cement (kg) Gravel & sand (kg) Blocks (kg) Steel
(kg) Total (kg)
Foundation 0 5 020 29 179 * 378 34 577
Structure 165 1 675 32 585 * 762 35 187
Roof 366 0 0 * 196 562
Total blocks 107 447 107 447
Total 531 6 695 61 764 107 447 1 336 177 773
% of total 0.3 3.7 34.8 60.4 0.8 100
*ND= not determined. The BoQ provided the total amount of blocks required for the structure and the roof
Residual materials and waste generation rates(Q2): How much wood, stony materials and steel are generated during the realiza-tion of a building? (Q3): What is the Waste Generation Rate for steel, wood and stony materials in the project under study?
Stony materials (Picture 5.2), wood (Picture 5.3) and steel are collected on a daily basis by the workers and brought to the dumpsters in a safe place and protected from the rain.
Picture 5.2: Collection of the day of stony materials (photo: JD. Leiva, 2011)
Picture 5.3: Wood waste scattered in the construction site (photo: JD. Leiva, 2011)
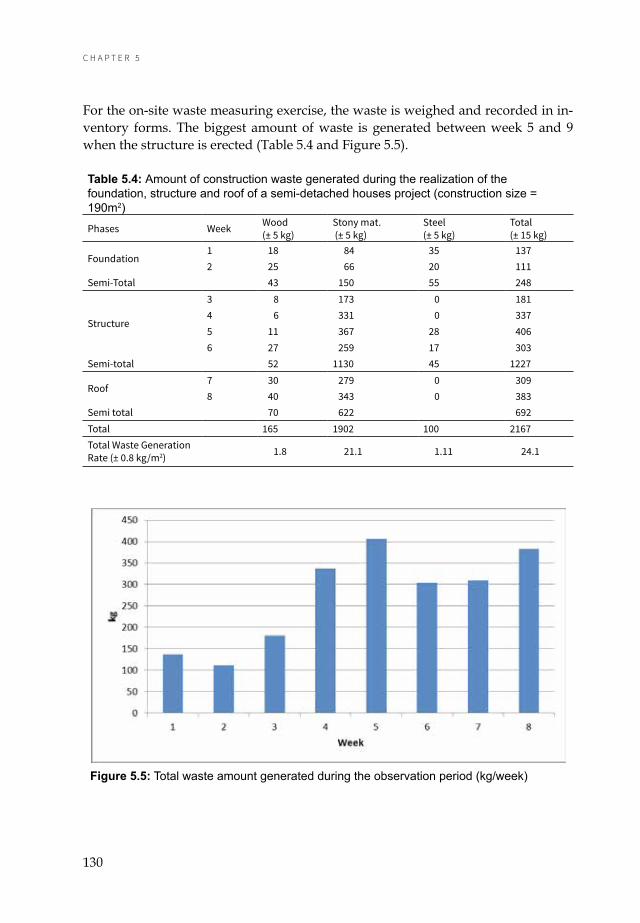
130
C H A P T E R 5
For the on-site waste measuring exercise, the waste is weighed and recorded in in-ventory forms. The biggest amount of waste is generated between week 5 and 9 when the structure is erected (Table 5.4 and Figure 5.5).
Table 5.4: Amount of construction waste generated during the realization of the foundation, structure and roof of a semi-detached houses project (construction size = 190m2)
Phases Week Wood(± 5 kg)
Stony mat. (± 5 kg)
Steel (± 5 kg)
Total (± 15 kg)
Foundation1 18 84 35 1372 25 66 20 111
Semi-Total 43 150 55 248
Structure
3 8 173 0 1814 6 331 0 3375 11 367 28 4066 27 259 17 303
Semi-total 52 1130 45 1227
Roof7 30 279 0 3098 40 343 0 383
Semi total 70 622 692Total 165 1902 100 2167Total Waste Generation Rate (± 0.8 kg/m2) 1.8 21.1 1.11 24.1
Figure 5.5: Total waste amount generated during the observation period (kg/week)
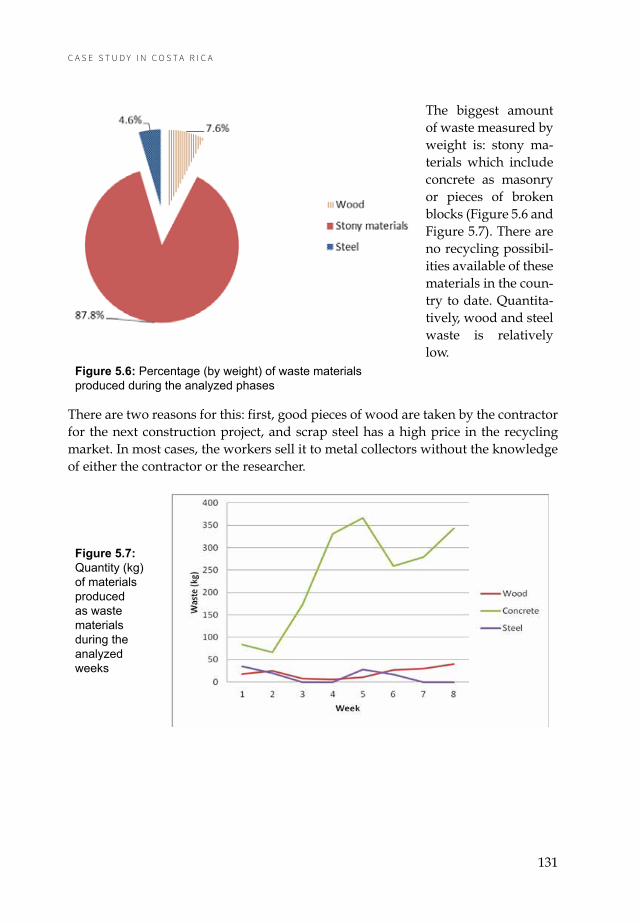
131
C A S E S T U D Y I N C O S T A R I C A
The biggest amount of waste measured by weight is: stony ma-terials which include concrete as masonry or pieces of broken blocks (Figure 5.6 and Figure 5.7). There are no recycling possibil-ities available of these materials in the coun-try to date. Quantita-tively, wood and steel waste is relatively low.
Figure 5.6: Percentage (by weight) of waste materials produced during the analyzed phases
There are two reasons for this: first, good pieces of wood are taken by the contractor for the next construction project, and scrap steel has a high price in the recycling market. In most cases, the workers sell it to metal collectors without the knowledge of either the contractor or the researcher.
Figure 5.7: Quantity (kg) of materials produced as waste materials during the analyzed weeks
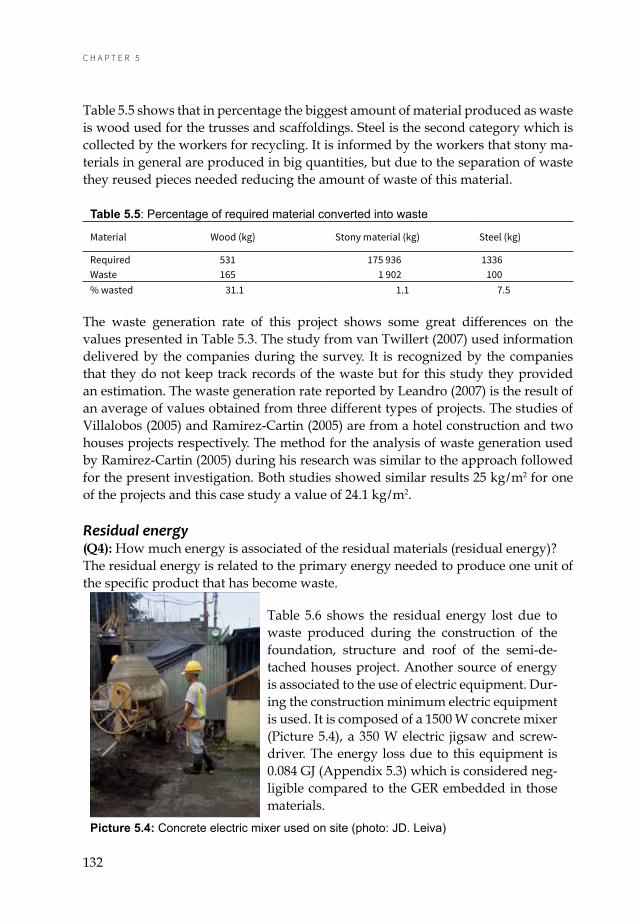
132
C H A P T E R 5
Table 5.5 shows that in percentage the biggest amount of material produced as waste is wood used for the trusses and scaffoldings. Steel is the second category which is collected by the workers for recycling. It is informed by the workers that stony ma-terials in general are produced in big quantities, but due to the separation of waste they reused pieces needed reducing the amount of waste of this material.
Table 5.5: Percentage of required material converted into waste
Material Wood (kg) Stony material (kg) Steel (kg)
Required 531 175 936 1336Waste 165 1 902 100% wasted 31.1 1.1 7.5
The waste generation rate of this project shows some great differences on the values presented in Table 5.3. The study from van Twillert (2007) used information delivered by the companies during the survey. It is recognized by the companies that they do not keep track records of the waste but for this study they provided an estimation. The waste generation rate reported by Leandro (2007) is the result of an average of values obtained from three different types of projects. The studies of Villalobos (2005) and Ramirez-Cartin (2005) are from a hotel construction and two houses projects respectively. The method for the analysis of waste generation used by Ramirez-Cartin (2005) during his research was similar to the approach followed for the present investigation. Both studies showed similar results 25 kg/m2 for one of the projects and this case study a value of 24.1 kg/m2.
Residual energy(Q4): How much energy is associated of the residual materials (residual energy)?The residual energy is related to the primary energy needed to produce one unit of the specific product that has become waste.
Table 5.6 shows the residual energy lost due to waste produced during the construction of the foundation, structure and roof of the semi-de-tached houses project. Another source of energy is associated to the use of electric equipment. Dur-ing the construction minimum electric equipment is used. It is composed of a 1500 W concrete mixer (Picture 5.4), a 350 W electric jigsaw and screw-driver. The energy loss due to this equipment is 0.084 GJ (Appendix 5.3) which is considered neg-ligible compared to the GER embedded in those materials.
Picture 5.4: Concrete electric mixer used on site (photo: JD. Leiva)
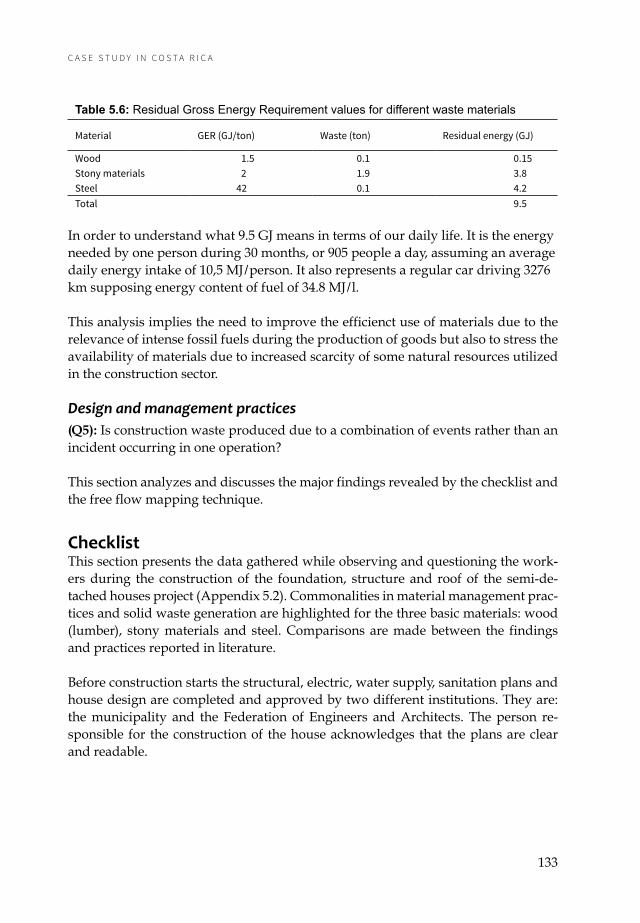
133
C A S E S T U D Y I N C O S T A R I C A
Table 5.6: Residual Gross Energy Requirement values for different waste materials
Material GER (GJ/ton) Waste (ton) Residual energy (GJ)
Wood 1.5 0.1 0.15Stony materials 2 1.9 3.8Steel 42 0.1 4.2Total 9.5
In order to understand what 9.5 GJ means in terms of our daily life. It is the energy needed by one person during 30 months, or 905 people a day, assuming an average daily energy intake of 10,5 MJ/person. It also represents a regular car driving 3276 km supposing energy content of fuel of 34.8 MJ/l.
This analysis implies the need to improve the efficienct use of materials due to the relevance of intense fossil fuels during the production of goods but also to stress the availability of materials due to increased scarcity of some natural resources utilized in the construction sector.
Design and management practices(Q5): Is construction waste produced due to a combination of events rather than an incident occurring in one operation?
This section analyzes and discusses the major findings revealed by the checklist and the free flow mapping technique.
ChecklistThis section presents the data gathered while observing and questioning the work-ers during the construction of the foundation, structure and roof of the semi-de-tached houses project (Appendix 5.2). Commonalities in material management prac-tices and solid waste generation are highlighted for the three basic materials: wood (lumber), stony materials and steel. Comparisons are made between the findings and practices reported in literature.
Before construction starts the structural, electric, water supply, sanitation plans and house design are completed and approved by two different institutions. They are: the municipality and the Federation of Engineers and Architects. The person re-sponsible for the construction of the house acknowledges that the plans are clear and readable.
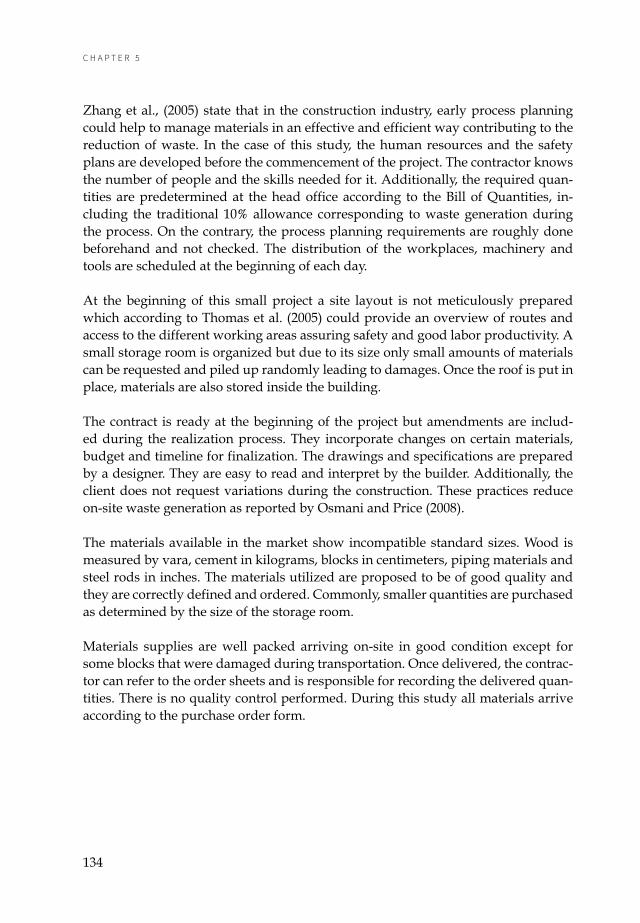
134
C H A P T E R 5
Zhang et al., (2005) state that in the construction industry, early process planning could help to manage materials in an effective and efficient way contributing to the reduction of waste. In the case of this study, the human resources and the safety plans are developed before the commencement of the project. The contractor knows the number of people and the skills needed for it. Additionally, the required quan-tities are predetermined at the head office according to the Bill of Quantities, in-cluding the traditional 10% allowance corresponding to waste generation during the process. On the contrary, the process planning requirements are roughly done beforehand and not checked. The distribution of the workplaces, machinery and tools are scheduled at the beginning of each day.
At the beginning of this small project a site layout is not meticulously prepared which according to Thomas et al. (2005) could provide an overview of routes and access to the different working areas assuring safety and good labor productivity. A small storage room is organized but due to its size only small amounts of materials can be requested and piled up randomly leading to damages. Once the roof is put in place, materials are also stored inside the building.
The contract is ready at the beginning of the project but amendments are includ-ed during the realization process. They incorporate changes on certain materials, budget and timeline for finalization. The drawings and specifications are prepared by a designer. They are easy to read and interpret by the builder. Additionally, the client does not request variations during the construction. These practices reduce on-site waste generation as reported by Osmani and Price (2008).
The materials available in the market show incompatible standard sizes. Wood is measured by vara, cement in kilograms, blocks in centimeters, piping materials and steel rods in inches. The materials utilized are proposed to be of good quality and they are correctly defined and ordered. Commonly, smaller quantities are purchased as determined by the size of the storage room.
Materials supplies are well packed arriving on-site in good condition except for some blocks that were damaged during transportation. Once delivered, the contrac-tor can refer to the order sheets and is responsible for recording the delivered quan-tities. There is no quality control performed. During this study all materials arrive according to the purchase order form.
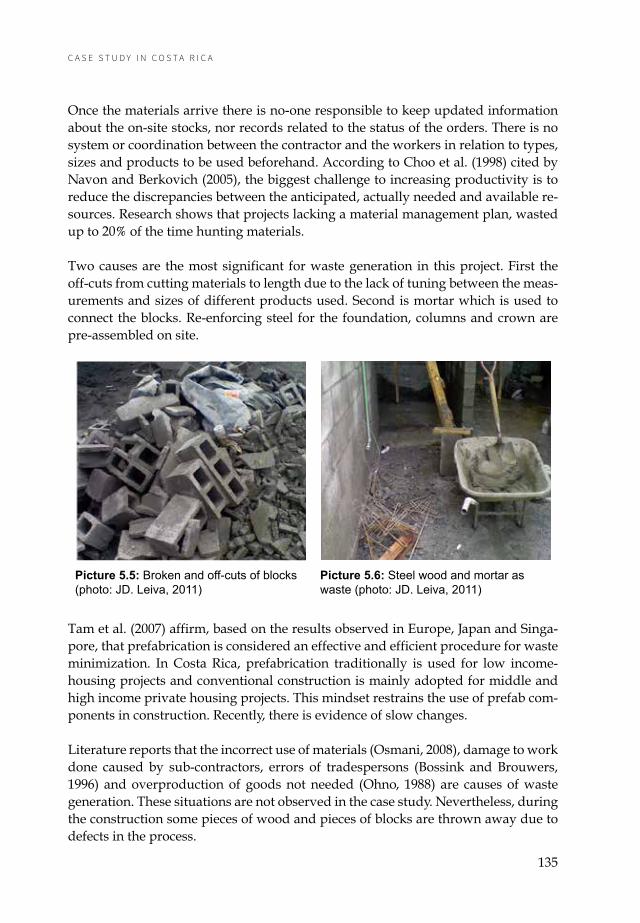
135
C A S E S T U D Y I N C O S T A R I C A
Once the materials arrive there is no-one responsible to keep updated information about the on-site stocks, nor records related to the status of the orders. There is no system or coordination between the contractor and the workers in relation to types, sizes and products to be used beforehand. According to Choo et al. (1998) cited by Navon and Berkovich (2005), the biggest challenge to increasing productivity is to reduce the discrepancies between the anticipated, actually needed and available re-sources. Research shows that projects lacking a material management plan, wasted up to 20% of the time hunting materials.
Two causes are the most significant for waste generation in this project. First the off-cuts from cutting materials to length due to the lack of tuning between the meas-urements and sizes of different products used. Second is mortar which is used to connect the blocks. Re-enforcing steel for the foundation, columns and crown are pre-assembled on site.
Picture 5.5: Broken and off-cuts of blocks (photo: JD. Leiva, 2011)
Picture 5.6: Steel wood and mortar as waste (photo: JD. Leiva, 2011)
Tam et al. (2007) affirm, based on the results observed in Europe, Japan and Singa-pore, that prefabrication is considered an effective and efficient procedure for waste minimization. In Costa Rica, prefabrication traditionally is used for low income-housing projects and conventional construction is mainly adopted for middle and high income private housing projects. This mindset restrains the use of prefab com-ponents in construction. Recently, there is evidence of slow changes.
Literature reports that the incorrect use of materials (Osmani, 2008), damage to work done caused by sub-contractors, errors of tradespersons (Bossink and Brouwers, 1996) and overproduction of goods not needed (Ohno, 1988) are causes of waste generation. These situations are not observed in the case study. Nevertheless, during the construction some pieces of wood and pieces of blocks are thrown away due to defects in the process.
136
C H A P T E R 5
Waste is perceived by contractor and laborers as an inevitable by-product of the construction process. The attitudes are driven by pragmatism and the pressure of time and cost. Teo and Loosemore (2001), discussing behavior in the construction industry in Australia, reported that the ability of the sector to contribute to waste reduction activities are dictated mainly by the managers and the willingness of the organization to commit resources to it. During this study, the workers indicate that they see the relevance and importance of waste reduction. They also perceive that contractors or managers are unconcerned about reducing waste. Additionally, the construction sites often are not designed to facilitate waste-reduction strategies. In general, the site has no plan, nor facilities, nor equipment, nor procedures for sort-ing re-usable or recycling materials. All materials are mixed, often disposed on the working place and collected at the end of the day or when the movement of employ-ees was no longer possible. For this study, the employees are trained to sort the ma-terials and place them in the containers provided. They also mention that few mate-rials are re-used on site and sometimes someone comes and looks into the waste and collects recyclable goods. Nobody knows what the fate of those materials is.
Teo and Loosemore (2001) indicated that attitudes can be changed through meas-ures such as educational programs with the objective to increase knowledge levels, incentives to operatives to engage in less wasteful practices and the development of more efficient and convenient ways of dealing with waste. In the Costa Rican construction sector, the employees have very low education; they lack knowledge about the consequences of waste, its final disposal site and the potential for reducing it. Construction companies do not want to invest in creating awareness and knowl-edge since the rotation of the workers is high and they perceive the investment to be wasteful.
The enterprise constructing this semi-detached houses project does not have a waste management plan. Shen et al. (2004) studying construction practices in Hong Kong found that construction waste passes through a number of handling processes from their generation to the final disposal affecting waste management effectiveness. They reported, based on McDonald and Smithers (1998), that a proper waste man-agement plan can contribute significantly to eliminate waste at source and can result in up to 50% cost savings for waste handling charges, 15% volume reduction of waste generation and 43% waste reduction that goes to disposal places.
Workers of the studied construction site report that the common practice for waste handling is done in three phases. First, waste is disposed in the surroundings where the employee has his/her working place. Second, it is collected using a wheelbarrow and transferred to a seeable distance defined point. Finally when the amount of waste is restricting the quality and safety for the work to be done, it is collected by a backhoe loader, transferred to a lorry and taken to a disposal site. During this study, wood, metal and stony materials are sorted and placed in labeled containers. Once
137
C A S E S T U D Y I N C O S T A R I C A
the waste is weighed, it is mixed with other residues including packaging materials (mainly plastic, paper and cardboard), transferred to the designated point, collected with the backhoe and transferred to an unknown disposal site.
Waste can occur also due to external factors such as natural disasters, theft and van-dalism. But these situations do not happen during the studied period. Accidents due to negligence are neither reported.
Free flow mapping The mapping presented in Figure 5.8 was constructed based on the researcher on-site interpretations and discussions with the site workers. The observations lead to the formulation list of strengths and weaknesses in the applications of waste man-agement on the construction site. They are:
Strengths• Use of simple mechanical facilities for waste transportation• Safe practices during collection• Few workers responsible for waste collection
Weaknesses• Lack of waste sorting-out processes• No consideration for recycling of waste• Partly consideration for reusing materials• Double-handling of waste• Time consumed for collecting waste from scattered locations• Poor coordination and supervision of waste-handling workers• Undeveloped culture of waste reduction among site workers
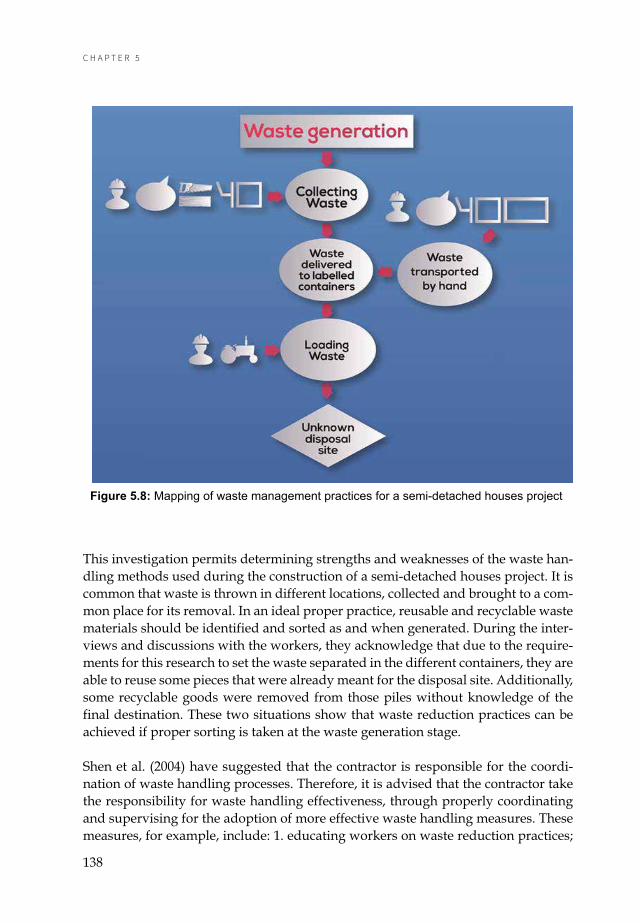
138
C H A P T E R 5
Figure 5.8: Mapping of waste management practices for a semi-detached houses project
This investigation permits determining strengths and weaknesses of the waste han-dling methods used during the construction of a semi-detached houses project. It is common that waste is thrown in different locations, collected and brought to a com-mon place for its removal. In an ideal proper practice, reusable and recyclable waste materials should be identified and sorted as and when generated. During the inter-views and discussions with the workers, they acknowledge that due to the require-ments for this research to set the waste separated in the different containers, they are able to reuse some pieces that were already meant for the disposal site. Additionally, some recyclable goods were removed from those piles without knowledge of the final destination. These two situations show that waste reduction practices can be achieved if proper sorting is taken at the waste generation stage.
Shen et al. (2004) have suggested that the contractor is responsible for the coordi-nation of waste handling processes. Therefore, it is advised that the contractor take the responsibility for waste handling effectiveness, through properly coordinating and supervising for the adoption of more effective waste handling measures. These measures, for example, include: 1. educating workers on waste reduction practices;
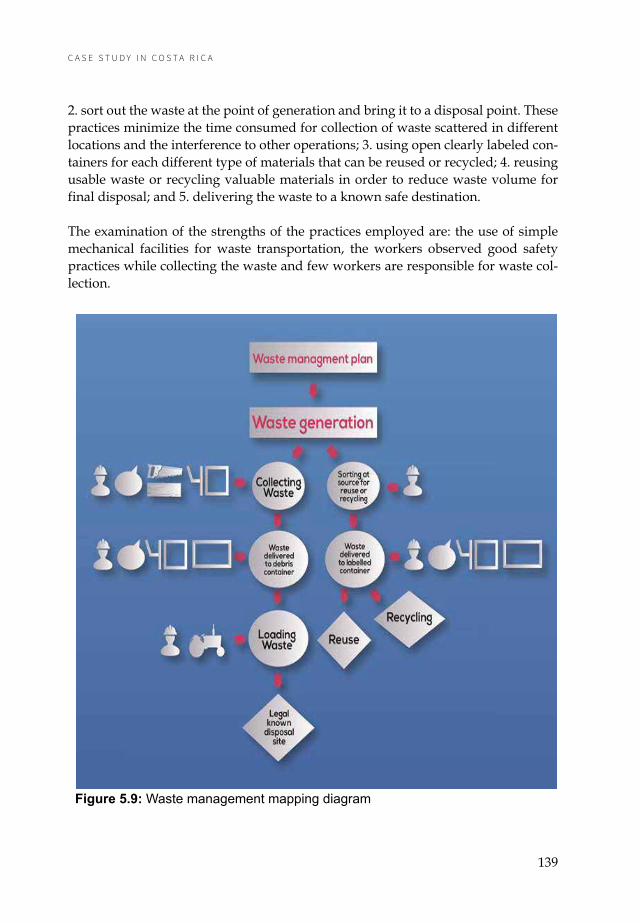
139
C A S E S T U D Y I N C O S T A R I C A
2. sort out the waste at the point of generation and bring it to a disposal point. These practices minimize the time consumed for collection of waste scattered in different locations and the interference to other operations; 3. using open clearly labeled con-tainers for each different type of materials that can be reused or recycled; 4. reusing usable waste or recycling valuable materials in order to reduce waste volume for final disposal; and 5. delivering the waste to a known safe destination.
The examination of the strengths of the practices employed are: the use of simple mechanical facilities for waste transportation, the workers observed good safety practices while collecting the waste and few workers are responsible for waste col-lection.
Figure 5.9: Waste management mapping diagram
140
C H A P T E R 5
Figure 5.9 shows a proposed waste collection diagram that could be used in the construction sites with the objective to minimize the amount of construction waste generated during the realization of a building. It starts with the outline of a construc-tion waste management strategy or plan for the construction manager. The waste generated is then collected, sorted and delivered to labeled containers. These ma-terials can be reused, or delivered for recycling purposes. The waste fraction that cannot be sorted is collected and delivered to a debris container, loaded to a bigger transportation facility and sent to known legal disposal.
5.5 ConclusionsThe tools developed for the analysis of the construction practices in the semi-de-tached houses project endorse different conclusions.
The approach chosen for analyzing the quantity of waste, in which the residual materials (construction waste) are evaluated according to the type of waste (wood, stony materials and steel) and the construction activity (foundation, structure and roof) by careful scrutiny of the waste that is disposed in dumpsters of 0.125 m3, show to be practical because it starts at the end of the material’s life. There is no doubt that what is being assessed is indeed waste with no further use remaining on the con-struction site. There is no danger of labeling a material waste something as “process scrap” only to find later that it has been used somewhere in the structure. Only the containers where the waste is disposed are inspected and assessed. This approach is simple and direct.
Waste generation rates allow creating awareness of material management practices and waste generation. Different construction material management practices such as work procedures and construction technologies will lead to different levels of waste generation. The identification of those rates can assist contractors with devel-oping effective material and waste management strategies.
The construction crew is poorly trained in environmental issues including waste reduction strategies. Best practices in the construction sector recognize that the con-tractor exerts considerable influence over the actions performed on a worksite. It is the contractor who can really make a contribution to reducing and intelligently managing construction wastes. Therefore, it is difficult for the on-site workers to take the issue seriously, especially when they perceive that the manager is uncon-cerned about reducing waste. If waste levels are to be reduced, it is essential that waste management be made a priority in relation to other project goals, and that managers promote a conducive environment by demonstrating commitment and providing the necessary resources. The company and project policies also need to be created and clearly communicated, so that operatives can understand the perfor-mance standards that they are expected to achieve.
141
C A S E S T U D Y I N C O S T A R I C A
A waste management plan could support waste minimization practices. Contractors claim that the development of a plan increases construction costs. Therefore, the identification of costs implications and potential benefits of such a plan is funda-mental for its adoption by construction companies. Several key elements are consid-ered fundamental for any successful construction waste management plan. These include an analysis of the project, a plan for the project, implementation and record keeping, cost tracking and control and post project evaluation.
The attributes utilized in the checklist (Appendix 5.1) are used to monitor the design process and the material management practices. It is not intended to be a compre-hensive guide to all attributes of material management. Many other topics related to material management are not addressed. These include information management, information technology, containment of material management, risk and uncertainty, supply chain management and integration, and others. The topics covered herein are limited to those for which data are collected from literature that could contribute to better on-site performance.
This case study shows the experiences and conditions on a typical building site in Costa Rica. It describes material management and generation of waste in general, and hence, can be readily adapted to reflect local practices in other construction sites in the country.
The analysis of the amount of construction waste generated and the checklist for de-sign and management practices provides useful information in relation to the con-struction process and material and waste management practices. On the contrary, the free-flow mapping technique did not allow determining construction processes but waste management practices. This technique is a useful guide to on-site workers on controlling procedures for improved construction waste management.
The systematic approach used by employing the checklist, the mapping technique, weighing the materials and residuals, permit concluding that construction waste management is highly complex, with many interrelated activities. Waste generation is due to a combination of events rather than an incident occurring in one operation. Such complex systems cannot be understood without considering the interrelation-ships underlying those events.
142
C H A P T E R 5
References
Abarca, L., Maas, G.J., Lambert, A.J.D., 2010. Black box opener, tools to assess material use in the Costa Rica construction sector. In: Pro-ceedings of the CIB World Congress: Building a better world. School of the Built Environment, University of Salford, UK, 10-13 May 2010.
Alves, T.C.L., Formoso, C.T., 2000. Guidelines for managing physical flows in construction sites. In: Proceedings of the 8th Conference of the International Group for Lean Construction, Brighton, UK.
Bolaños, F., 2012. Discussion on construction practices in Costa Rican. Federation of Engi-neers and Architects (CFIA). Personal com-munication.
Bossink, B.A.G., Brouwers, H.J.H., 1996. Con-struction waste: quantification and source evaluation. J. of Construction Engineering and Management, 122(1), pp.55-60.
CFIA (Colegio Federado de Ingenieros y Ar-quitectos), 2011. Indicadores CFIA de la Con-strucción Costa Rica. Available at: <http://www.cfia.or.cr/descargas_2013/estadisticas/Estadisticas_2011.pdf> [Accessed 03 April 2012].
Fisher, N., Shen, L.Y., 1992. Information man-agement within a contractor – A model for the flow of data. London: Thomas Telford Services Ltd.
Formoso, C.T., Soibelman, L., Cesare, C.D., Issato, E.L., 2002. Material Waste in Building Industry: Main Causes and Prevention. J. of Construction Engineering and Management, 128(4), pp.316-325.
Forsythe, P., Marsden, P.K., 1999. Modeling construction waste performance – an aris-ing procurement issue. In: S.O. Ogunlana, ed. Profitable Partnering in Construction Pro-curement, CIB TG23 (Culture in Construction) Joint Symposium. London: Spon, pp.679–688.
Gavilan, R.M., Bernold, L.E., 1994. Source evaluation of solid waste in building con-struction. J. of Construction Engineering and Management, 120(3), pp.536-552.
Katz, A., Baum, H., 2011. A novel methodol-ogy to estimate the evolution of construction waste in construction sites. Journal of Waste Management, 31(11), pp.353-358.
Koskela, L., Howell, G., 2002. The underlying theory of project management is obsolete. Project Managemet Institute. Available at: <http://usir.salford.ac.uk/9400/> [Accessed 29 May 2013].
Lambert, A.J.D., 2008. Energy, Production and Process Integration. Eindhoven: Faculteit Technologie Management, Technische Uni-versiteit.
Leandro, A., 2007. Administración y manejo de los desechos en proyectos de construcción Etapa II. Alternativas de manejo. Centro de Investigaciones en Vivienda y Construcción CIVCO. Instituto Tecnologico de Costa Rica.
Leiva-Cordero, J.D., 2011. Estudio de las causa de la generación de desechos (concreto, madera y acero) en la construcción de vivienda tradicion-al. Graduation Project, Universidad de Costa Rica.
143
C A S E S T U D Y I N C O S T A R I C A
Lin, Z.W., 2006. Model development for estimat-ing the quantity of a single building’s demolition waste. Master Thesis. National Central Uni-versity.
Lu, W., Yuan, H., Li, J.J.L., Mi, X., Ding, Z., 2011. An empirical investigation of construc-tion and demolition waste generation rates in Shenzhen city, South China. Journal Waste Management, 31(4), pp.680-687.
McDonald, B., Smithers, M., 1998. Imple-menting a waste management plan during the construction phase of a project: a case study. Construction Management and Econom-ics, 16(1), pp.71–78.
McGrath, C., 2001. Waste minimisation in practice. Resources, Conservation and Recy-cling, 32(July), pp.227-238.
McGregor, M., Washburn, H., Palermini, D., 1993. Characterization of construction site waste: Final Report. Presented to the METRO Solid Waste Department, Portland, Oregon.
Ming, L., Poon, C.S., Wong, L.C., 2006. Appli-cation framework for mapping and simula-tion of waste handling processes in construc-tion. Journal of Construction Engineering and Management, 132(11), pp.1212-1221.
Navon, R., Berkovich, O., 2005. Development and on-site evaluation of an automated mate-rials management and control model. Journal of Construction Engineering and Management, 131(12), pp.1328-1336.
Ohno, T., 1988. Toyota production system. Beyond large scale production. New York: Productivity Press. Available at: <http://books.google.nl/books?hl=nl&lr=&id=7_-67SshOy8C&oi=f-nd&pg=PR9&dq=Ohno,+T.,+1988.+Toy-
ota+production+system.&ots=YmXrs8x-dzZ&sig=fxsQMG4k2ZKigLr6USmhu_f5H-ko#v=onepage&q=Ohno%2C%20T.%2C%201988.%20Toyota%20production%20sys-tem.&f=false> [Accessed (12 May 2009].
Osmani, M., Glass, J., Price A.D.F., 2008. Ar-chitects’ perspectives on construction waste reduction by design. Journal of Waste Man-agement, 28(7), pp.1147–1158.
Picchi, F.A., 1993. Sistemas da qualidade: uso em empresas de construcao. Doctorate thesis, Uni-versity of Sao Paulo, Brasil.
Poon, C.S., Yu, T.W., Ng, L.H., 2001. A Guide for Managing and Minimizing Building and Demolition Waste. Hong Kong Polytechnic University, Hong Kong. ISBN 9623673116, 9789623673112.
Poon, C.S., Yu, A.T.W., Jaillon, L., 2004. Re-ducing building waste at construction sites in Hong Kong. Construction Management and Economics, 22 (5), pp.461–470.
Ramirez-Cartin, M., 1995. Impacto fisico y fi-nanciero de la generacion de desechos solidos en la construccion de dos proyectos hoteleros. Tesis de grado. Universidad de Costa Rica, San Jose, Costa Rica.
Skoyles, E.R., 1976. Materials wastage – a misuse of resources. Building Researchand Practice, 4(4), pp.232–243 .
Shen, L.Y., Tam, V.W.Y., Tam, C.M., Drew, D., 2004. Mapping approach for examining waste management on construction sites, J. Construction Engineering and Management, 130(4), pp.472-481.
144
C H A P T E R 5
Tam, V.W.Y., Tam, C.M, Zeng, S.X., Ng, W.C.Y., 2007. Towards adoption of prefabri-cation in construction. Building and Environ-ment, 42(10), pp.3642–3654.
Teo, M.M.M., Loosemore, M., 2001. A theory of waste behavior in the construction indus-try. Construction Management and Economics, 19(7), pp.741-751.
Thomas, H.R. Riley, D.R., Messner, J.I., 2005. Fundamental principles of site material man-agement, J. of Construction Engineering and Management, 131(7), pp.808-815.
van Egmond, E.L.C., 1999. Technology map-ping for technology management. Ph.D. Eind-hoven University of Technology.
van Twillert, H. 2007, Costa Rican Construc-tion Sector Waste Management Assessment. M. Sc. Eindhoven University of Technology.
Villalobos, A., 1995. Estudio de generación de desechos en la construcción de viviendas en mam-postería. Proyecto de Graduación para optar por el grado de Licenciatura en Ingeniería Civil, Escuela de Ingeniería Civil, Universi-dad de Costa Rica, San José, Costa Rica.
Yin, R., 1994. Case study research: Design and methods. 2nd ed. Thousand Oaks, CA: Sage Publishing.
Zhang, J., Eastham, D., Bernold, L., 2005. Waste-based management in residential con-struction. Journal Construction Engineering Management, 131(4), 423–430.
145
C O N C L U S I O N S A N D R E C O M M E N D A T I O N S
Chapter 6Conclusions and recommendations
146
C H A P T E R 6
There are no magical solutions or quick fixes in waste management. There are paths to follow bearing in mind: prevention, reduction, reuse, recycle and safe disposal of waste.
147
C O N C L U S I O N S A N D R E C O M M E N D A T I O N S
6. Conclusions and recommendations
6.1 Introduction Understanding the stakeholders and factors that influence municipal waste man-agement systems is an important task for public services planning. Planning deci-sions influence the performance of the system which in turn affects the environment, the availability of resources and climate change. Equally important is determining the factors that affect the efficient use of construction materials and its impact on the generation of construction waste.
Motivated for the motivation to investigate municipal waste and construction waste management in developing countries, the goal of this thesis is to determine how the performance of the system can be improved. In order to achieve this goal, two models are employed: The Integrated Sustainable Waste Management Model (ISWM) and the Construction Waste Generation Model. The ISWM model is useful for analyzing municipal waste management at a city level. It helps to determine the priority stakeholders and to uncover the interrelation of the factors that can affect the performance of the system. But municipal waste management practices also in-fluence the management of construction waste. A Construction Waste Generation model is created, incorporating principles of Industrial Metabolism, to explain construction waste generation during the realization of a building. Under the proposed general frameworks for modeling municipal waste and construction practices, the majority emphasis is put on exploring, extending and validating both models.
Furthermore, a case study is proposed with the aim of checking the perceived real-ity of construction companies’ responses on physical flows and on-site construction practices reported in Chapter 4. The chosen project represents a typical project in the Great Metropolitan area of Costa Rica where the majority of construction takes place. A systematic approach is used by utilizing diverse tools for data collection.
In this thesis the author successfully extends the ISWM model by highlighting the stakeholders that are influencing or are being influenced by the waste management system. Moreover by including a set of factors or parameters that affects its perfor-mance. The author also provides a comprehensive model for the description of the construction process which includes the interchange of physical flows (materials and energy) in addition to elements for its analysis. The case study delivers facts of their usefulness and limitations. In this chapter, the main findings are discussed with special reference to their application. The recommendations for further research arealso proposed.
148
C H A P T E R 6
6.2 ConclusionsIn Chapter 2, the Integrated Sustainable Waste Management model (Figure 2.1) is introduced. The figure illustrates the complexity of solid waste management sys-tems. It shows that they are highly influenced by a mixture of domains or areas of academic interest or specialization. The first domain is about the environment. This considers where and how hazardous and non-hazardous waste is collected, trans-ported, treated and disposed, environmental education and awareness, resource scarcity, value of waste, pollution, public health and etcetera. The second domain is about the sociocultural setting. It relates to who the stakeholders are, level of cooperation and communication between the service users and the service provid-ers, public concerns, behaviors and habits of the citizens. The third domain is the financial situation. It reflects on issues related to income by the service providers and fair payments by the service users and financial structures. The fourth domain is related to technical issues. It looks into the available infrastructure and equipment for efficient waste management, collection rates and performance of waste process-ing plants. The fifth domain is the institutional framework. It examines the internal structure of the waste service provider, their roles and responsibilities, the ability to perform the assigned tasks, the human resources capacity and etcetera. The sixth domain is the legal/political (governance) landscape. Solid waste management sys-tems are very much influenced by the existence of a waste legal framework, de-signed rules and regulations and enforcement procedures. Additionally, the systems are affected by the relationships between the central and local governments, the roles and interests of the politicians in environmental and waste issues and the par-ticipation of the citizens in decision making.
The ISWM model is used as a starting point to position the study on municipal solid waste management. It defines who the stakeholders are and grouping the factors found in literature along with data gathered by the author of this thesis since 1985, from thirty six sites, in twenty two countries, in three continents.
This research determines how the performance of the municipal waste management system can be improved. This goal is achieved by answering two sub-research ques-tions:Subresearch question 1: Who are the stakeholders?Subresearch question 2: Which are the factors that influence the performance of the system?
StakeholdersWaste management involves a large number of diverse stakeholders, with differ-ent fields of interest. They all play a role in shaping the system of a city. From the examination of the data it is concluded that the municipality or local government is
149
C O N C L U S I O N S A N D R E C O M M E N D A T I O N S
recognized to be the most important stakeholder. They are responsible for the man-agement of city waste. In the best case, the citizens are also considered coresponsible for the system. But in reality, the spectrum is wider. The central government and ministries play a role by enabling the legal framework and enforcement of the reg-ulations, the private contractors by the services they are providing, the households, civil organizations, agricultural, commercial, industrial and health sectors, large waste producers such as slaughter houses, agro-industries, all of them as service users. There is a less frequently mentioned group of stakeholders that also play a role. They may include educational centers, research institutions, recycling compa-nies, traditional and religious leaders, politicians, teachers, unions and alike. An-other very important group of people, in many low and middle income economy countries, providing an invisible service to society are the waste pickers or so called “recyclers”. They are an integral part of the waste management systems of the cities where they work. They generally collect waste from homes, streets, commercial ar-eas, industrial venues and disposal sites. They make their livelihood from the waste and contribute to the improvement of the economy and environment of the cities by the work they do.
Detailed understandings on who the stakeholders are and the responsibilities they have in the structure are important steps in order to establish an efficient and effec-tive system. Communication transfer between the different stakeholders is of high importance in order to get a well-functioning waste management system in urban or rural cities in developing countries.
Factors influencing the performance of municipal waste management systemsThe raw data permit finding relationships between parameters that influence the performance of the waste management system at city level. They are summarized in Figure 2.2 and Figure 2.3. Some of them have also been reported by one or various authors and compared during the analysis of the results in Chapter 2. Supplementa-ry parameters found during the course of this study and not found in the literature, have also been added to the figures and discussed in the following sections.
Generation and separationBoth the presence of waste pickers collecting recyclable goods and awareness campaigns appear to influence positively the separation of waste at a household level. In some cities such as Lima, Peru, waste pickers collect – door to door – 98% of the total recyclable materials collected while in Pune, India it corresponds to 100%. Public awareness affects solid waste management as a whole, and particularly the attitudes toward storage and separation of waste.
150
C H A P T E R 6
Collection, transfer and transportThe primary focus of local governments in developing countries is still in waste collection, transfer and transportation of waste. These activities represent an economic burden for the municipalities. Generally, they constitute more than 50% of the total budget of solid waste management; which makes them a key component in deter-mining the economics of the complete waste management system. Three additional parameters than the ones already reported in literature are found during this study. The analysis of the data suggests that the transportation facilities available, quality of roads and collection time (schedule) fitting the users’ needs have an impact on the performance of waste management systems.
TreatmentWaste treatment refers to the activities required to ensure that waste has the least impact on the environment. Treatment depends on suitable infrastructure and local knowledge available on waste management issues. Affordable infrastructure is the basic physical component needed for treatment such as composting. But expe-rience has shown that in most of developing countries, over 50% of the municipal solid waste could be composted but despite the relative simplicity, several projects initiated over the past decades have failed due to finance, high cost infrastructure, technology and lack of plant operators’ skills, among other factors.
RecyclingConcerning recycling, it is found that an efficient recyclable materials collection systems such as drop-off locations, improves recycling performance among citizens. Irregular collection services jeopardize efforts to increase recycling rates. The costs for collecting, sorting, and processing the recyclables can be high depending on the amounts recovered. Low and middle income economies have the opportunity to utilize low cost recycling technologies, which are suitable for the local context.
Technical aspectTechnical factors influencing the efficiency of waste management systems are re-lated to suitable infrastructure and equipment available. Deficient infrastructure to manage the increasing amounts and complexity of waste, poor roads and insuf-ficient equipment available are responsible for the poor services often provided by local governments.
151
C O N C L U S I O N S A N D R E C O M M E N D A T I O N S
Socio-cultural aspectThe community involvement influences the structure and the functioning of the sol-id waste management system. Waste management in developing countries in gen-eral is perceived as the sole duty of the local government without the public contri-bution. The operational efficiency of solid waste services is found to depend on the citizens willing to participate in solutions and the coordination and cooperation between service users and service providers.
Institutional aspectDuring this study, it was found that the support from the central government is fundamental for the performance of certain waste management systems. This situa-tion specially affects those cities where revenue collection and investment decisions are made at the central government while operation occurs at the local level. Other factors found are linked to the internal structure and management capacities of lo-cal governments. In general, municipalities have minimal skilled personal with the available knowledge on technologies and good practices. That impacts the perfor-mance of the system.
In low and middle-income countries, sometimes leaders are unaware about the city’s waste management situation, exclusively in areas where the most important attention is on solving more basic needs such as: employment, food, health, shelter, security, water, electricity. Only when these needs are met, does waste become a priority. The efficiency of municipal management is also been found to be a fac-tor influencing waste management systems. Citizens perceive the local government performed low quality services for the amount of budget they received and the ex-istent personnel. In general terms, efficiency in the municipalities is perceived as being very low.
As a conclusion, municipal solid waste management is a complex issue due to the variety of stakeholders and factors affecting it. The system can be improved by the participation of stakeholders in decision making related to the services. Moreover, often the municipalities search for equipment as a solution to the diversity of prob-lems they face. This study shows that an effective system is not only based in tech-nological solutions but also they are influenced by the different movements of the waste beginning at the generation point to final disposal. Additionally, the system is also affected by environmental, socio cultural, legal, institutional and economic aspects that should be present to enable the overall system to function.
152
C H A P T E R 6
It is also important to mention that the development of the municipal waste man-agement systems varies from country to country according, inter alia, on the eco-nomic situation of the nation. During the years in which the author of this thesis has visited developing countries, improvements in waste management systems in those cities have happened. Reasons for these are various. The support and knowl-edge provided by international developing agencies by various means, e.g. funding projects or study fellowships, being made available to municipalities, academic sec-tor, non-governmental organizations and alike. Additionally, citizens have become more aware of the importance of a clean environment urging local governments to improve the system. Furthermore, municipalities have realized that waste manage-ment is a governance issue. Citizens judge their local leaders by the cleaniness of the city.
Municipal waste systems affect construction waste management. Disposal sites vis-ited, in developing countries, show the high percentage of construction waste ar-riving to those places. It is mentioned in Chapter 1 that developing countries lack reliable and sufficient data to implement adequate systems. Little research is done on construction waste management disciplines in those countries. This thesis fills the gap and explains the factors that influence construction waste generation by answering the following sub-research question:
Subresearch question 3: Which are the factors underlying the efficient use of con-struction materials and its impact on the generation of construction waste during the realization of a building?
Factors influencing construction waste generationBased on the main findings reported in the previous section, it appears to be im-portant to explore construction practices and their influence in construction waste generation in developing countries. Chapter 3 discusses the conceptual framework of this thesis for modeling construction waste generation. Structured Analysis and Design Technique helps to extend a physical model that allows understanding and describing the construction process. The construction waste generation model (Fig-ure 3.1) is a physical model that comprises eight units representing the components of the physical flows needed for MFA and the elements that describe the process. The elements for the analysis of the construction process presented in the following sections are related to labor, barriers and motivators for environmental building practices and design and management of the construction process.
153
C O N C L U S I O N S A N D R E C O M M E N D A T I O N S
LaborThe construction activity is labor intensive in developing countries. The construction laborers are in general unskilled workers with low education levels. In the Costa Rica setting they are sharply divided between a small group of higher level educat-ed workers, mainly composed by skilled engineers and managers that are organized on a permanent basis, and a bigger group with low-education and low-motivated employees working on site, which are hired with temporary contracts and low sala-ries. In general, in developing countries the training of these workers takes place on site in an informal way. It is common to hire unskilled migrants from neighboring countries, which in many cases have an illegal status. It may be expected that most of the talented workmen without a degree are promoted from the building practice and they slowly move towards more managerial tasks.
Barriers and motivatorsDuring the realization phase, the Costa Rican construction companies are driven by the “Golden Triangle” (budget, schedule and quality). During this study, it is found that the local market conditions are not yet ready to motivate construction companies to adopt friendly environmental procedures through construction waste reduction practices.
The analysis of the literature provides barriers and motivators for the implementa-tion of waste reduction practices (Table 4.7 and Table 4.8). The barriers found in the Costa Rican context have already been reported in literature. On the contrary, new motivators are found during this study. The new motivators included are:
• Awareness of cost reduction due to reduction of material losses and savings in raw materials
• Diminished legal costs associated with environmental impacts, insurances, fines and compensations
• Additional profits as a result of reselling of sub-products• Interest in promoting the image of the company• Following what the competence has done• Improved environmental awareness of the company• Saving on energy: electricity, fossil fuels• Reduction on equipment failures• Information or assistance provided by suppliers • Clients demands for sustainable buildings• Strict enforcement of regulations
154
C H A P T E R 6
From the above results, a conclusion is that the construction sector, in developing countries, has challenges in the local market conditions. Analysis of the situation and determining ways to effectively operate are fundamental. Moreover, the govern-ment should provide strategies for creating the appropriate environment, removing barriers and increasing motivators for companies to improve practices. A strategy should be aligned with the country-specific financial, institutional, environmental, technical, socio-cultural, and legal situation.
Design and managementThe design and management unit is analyzed in two phases. The first phase pro-vides information on causes of construction waste generation. Twenty two influenc-ing attributes are found during the first phase. One of them -incompatible market standard sizes is not found in the revised literature and it is specific for the Costa Rican context. They all are grouped in the following topics: design, construction, material management, operation, residuals and others.
The analysis of the findings suggests the following hypothesis:Various sources have a different effect on construction waste generation.
The second phase permits testing the hypothesis on construction waste sources (Ta-ble 4.12). The attributes found are the following:
Design• Incompatible market standard sizes • Lack of attention paid to dimensional coordination of products• Design changes while construction is in progress• Lack of knowledge about standard sizes available in market• Designers’ unfamiliarity with alternative products• Complexity of detailing in drawings• Lack of information in drawings and selection of low-quality products • Construction process• Ordering errors (too much or too little)• Lack of possibility to order small quantities• Design changes while construction is in progress• Use of incorrect material thus requiring replacement• Purchases not complying with specifications
155
C O N C L U S I O N S A N D R E C O M M E N D A T I O N S
Material management• Damages while transporting• Inappropriate site storage• Unfriendly attitudes of project team and workers• Lack of environmental awareness of employees on site• Lack of technical direction for workers on site • Operation• Use of incorrect material thus requiring replacement• Damage to work done due to subsequent trade persons• Required quantity unclear due to improper planning• Delays in providing information to contractors regarding types and sizes of
products to be used• Errors by trades persons or laborers
Residuals• Waste from application processes• Packaging material• Pre-existing demolition.
Others• Lack of material control on site• Lack of waste management plan
The identification of these sources of waste generation and the answers provided by the respondents show that various sources have a different effect on construction site waste generation.
As a general conclusion it can be said that construction material waste generation is complex due to the large number of influencing factors. The complete figure de-picting the situation can be seen in Appendix 6.1. Understanding the causes of the inefficiencies in the use of materials could contribute to diminish the pressure the activity exerts on the environment.
The present study also set out a case study to check, in a real situation, the percep-tions reported by construction companies’ responses in relation to two units of the construction waste reduction model (Figure 4.1): 1. material flows and 2. design and management practices. A semi-detached houses project in Costa Rica is chosen to achieve the proposed goal. A systematic approach is used by utilizing diverse tools for data collection.
156
C H A P T E R 6
Findings on a semi-detached houses case studyChapter 3 and 4 show the theoretical and empirical advantages of the construction waste generation model. The validation of the model, in the Costa Rican context, shows the limited information responding firms kept in relation to construction waste quantities generated during the realization of the building. In order to fill the gap, additional data is collected to unveil on-site material management practic-es and origins of construction waste. Energy and materials used and produced as residuals are followed during the realization of the foundation, structure and roof.
A checklist is prepared based on the findings in literature and results from this research with the objective to determine construction process practices. A free flow mapping technique is applied to create a diagram that describes the flow of mate-rials in the construction site during the realization process. The Bill of Quantities (BoQ) and weighing the materials and residuals are used for gathering data related to material flows and on-site construction practices.
The application of the tools reveals that the Bill of Quantities delivers enough in-formation to determine materials going into the process. Weighing the residuals provides data about the process efficiency in relation to the use of materials and the generation of construction waste. The checklist facilitates the identification of on-site construction practices. Moreover, it guides the interviews with the construction manager and the on-site workers. The free flow mapping technique is applied to create a diagram that describes the flow of materials in the construction site during the realization process. Contrary to expectation, it determines the movement of the construction waste from the generation point to the collection for final disposal.
6.3 Discussion
Inadequacies in the researchThe research study considers the perceptions of different types of stakeholders on the solid waste management situation of their city. The information is gathered dur-ing workshops, seminars, trainings, meetings and personal communications. In or-der to corroborate the facts, site visits are performed to market places, public insti-tutions, solid waste treatment areas, households, disposal sites, material recycling facilities and alike. Additionally, collected information is reported and often shared, vis-à-vis, with stakeholders from the visited areas.
The construction waste generation model is tested in one developing country: Cos-ta Rica. The results obtained after the application of the model should be viewed with caution because the findings are country-based. This means that the design and management practices influencing construction waste management are specific for the type of construction systems employed in Costa Rica. The same applies for
157
C O N C L U S I O N S A N D R E C O M M E N D A T I O N S
the motivators and barriers to implementing construction waste reduction practices. The findings are related to the financial, institutional, environmental, technological, socio-cultural setting in the country.
In order to obtain on-site specific data on two units of the construction waste gen-eration model, a case study is chosen. The criteria used to select the case are based on: firstly, the area of the country where most housing construction is taking place which corresponds to San Jose, the capital city and secondly, to the average construc-tion area of most houses which is between 100 to 200 square meters. Furthermore, during the analysis of the case study, the on-site construction laborers are instructed to separate the waste in two fractions: wood, metal and stony materials. The objec-tive is to determine quantities of construction waste being disposed.
Future research The ISWM expanded model provides a list of factors influencing the elements and the aspects of waste management systems. Those factors are a product of informa-tion collected from literature since 1985 to present and the author’s personal collec-tion since 1985. The first recommendation for future research is to expand the list of factors reported in the Figure 2.2 and 2.3. New factors might be found in cities not studied during this research nor reported by others up to date. Comparisons between neither cities nor continents were done during the present study. The ra-tionale behind this decision was the use of national standard measurements, in the case of this thesis was GDP, and values at city level. In some cases the studied cities were from higher GDP countries but from a low income city (e.g. Bitlis in Turkey) or low GDP but in a high income municipality (e.g. Addis Ababa in Ethiopia). Future research should take into consideration the limitation of the present study.
The construction waste generation model has been tested within the Costa Rican context. Therefore, the second recommendation is to explore the fundamentals provided in other settings and find evidence of its usefulness in construction waste research.
The checklist is not intended to be a comprehensive guide to all attributes of ma-terial management. Many other topics related to material management are not ad-dressed. Consequently, a third recommendation is to include attributes from areas such as: information management, information technology, containment of material management, risk and uncertainty, supply chain management and integration, and others. The topics covered in this thesis are limited to those for which data are col-lected from literature that could contribute to better on-site performance.
158
C H A P T E R 6
6.4 Research contributionsMunicipal waste management is often analyzed utilizing models that do not con-template an integrated or holistic approach. The focus is mostly centered in few isolated problems within the system. Often in developing countries, the two major problems considered are collection and removal of waste with the solution based upon the need of infrastructure and equipment. This thesis employs the ISWM mod-el as a means for modeling a complex system, to systematize information found in literature and the results of the studies of the thirty six sites, in twenty two countries, in three continents. The use of statistics permits identifying possible interrelations between events present in the studied cities.
The first contribution of this thesis to the state-of-the-art research in solid waste management is the development of a template to be applied at a city level. It is tested and validated proving to be an appropriate tool for municipal waste manage-ment data collection (Appendix 2.4).
A second contribution to the waste management domain is the knowledgebased database created with a complex set of parameters that contain information from those thirty six sites found at: URL: http://dx.doi.org/10.4121/uuid:31d9e6b3-77e4-4a4c-835e-5c3b211edcfc.
The third contribution of this thesis to the state-of-the-art research in solid waste management is an extended ISWM model used to consolidate reported and new factors found, during the present research, influencing the performance of waste management systems (Figure 2.2 and Figure 2.3).
The fourth contribution of this thesis is the use of SADT techniques to bring Material Flow Analysis into construction waste management research. During the literature study, it was found that there is insufficient attention to construction waste generation studies. A similar situation applies to studies on barriers and motivators for construction waste reduction in developing economies. As a result, a model to study construction waste generation was developed based on Industrial Metabolism ideas utilizing Material Flow Analysis as a tool for investigating the flows of materi-als and energy. The model was constructed with the support of Structured Analysis and Design Technique (SADT) amply used in systems engineering but in this thesis used to describe flows of materials and energy.
The fifth contribution of this thesis to the state-of-the-art research in construction waste management is the construction waste generation model. It allows a descrip-tion of the realization of a building (Figure 3.1). The results provide new insights into the complexity of the realization of a building and factors that affect the process.
159
C O N C L U S I O N S A N D R E C O M M E N D A T I O N S
The sixth contribution of this thesis is the use of project management ideas within waste management practices. Project Management Body of Knowledge divides project management processes into planning, execution, controlling and closing processes. This division permitted grouping reported attributes found in literature related to construction waste generation practices. It is useful for creating the check-list that follows construction waste generation causes allowing making certain con-clusions in relation to on-site construction practices for the semi-detached houses project under study.
6.5 Societal relevance The ISWM model developed by WASTE and partners identifies stakeholders, ele-ments and aspects of waste management systems in many countries in the world. The extended model can be used by any professional, civil servant, or organization interested in planning, changing or implementing a waste management system in a city in the urban and rural setting. It provides a good “road map” on ways to look into the systems and the possible interventions with the objective to make real changes that improve waste management at local level.
Experience has shown that developing countries have often taken models consider-ing only economic factors and technical solutions. Rarely, the involvement of relevant stakeholders has been contemplated as part of the integrated waste manage-ment system. This thesis provided some understanding of the complexity of the system, the interconnections among activities in the elements and the aspects. It also states the importance of the participation of all the population whose behavior patterns and underlying attitudes influence the structure and the functioning of sol-id waste management systems. The knowledge created provides an understanding for the “policy makers” on the need to shift their perspectives on how to approach solid waste management with a holistic approach. With the use of this extended model, they can visualize with other stakeholders, where their priorities should be for the improvement of the solid waste management system.
The developed construction waste generation model permits any professional, in-dividual or organization to analyze the complexities in the causes of construction waste generation. Understanding the causes of the inefficiencies in the use of mate-rials could contribute to, diminished pressure exerted by the construction industry on the environment and an increase in revenue. There are two distinct procedures in minimizing the amount of construction waste. One is through source reduction techniques both on site and during the design and procurement phases of a building project. The second is to improve the management of the waste generated on site.
160
C H A P T E R 6
The tools developed and used to determine quantities of materials generated as waste along with the specific waste generation rate for the case under study show to be useful, simple and easy to perform. It has limitations that require constant observation and trained personnel. The limitations can be overcome by having an observer visiting the site on a regular basis during the working hours. Additionally, the site management and the workforce should be trained and made aware of the objectives of any analysis in order to be willing to cooperate.
The checklist provides a structured system to collect information in relation to de-sign and management procedures. It can be useful for guiding construction site manager to improve construction practices, materials management and the organ-ization of a system for construction waste management. The checklist can also be a guideline for construction businesses to improve their practices.
The freeflow mapping is convenient for tracing waste from generation to the col-lection for disposal. It can provide site workers with instructions on how to manage the on-site construction waste. It can be used as a simple, easy to understand instruc-tive procedure for on-site construction waste management. This technique is useful to guide on-site workers on controlling procedures for improved construction waste management.
6.6 Recommendations Municipal waste management system in developing countriesGovernments in developing countries have the challenge to develop integral sus-tainable waste management systems in order to improve public health, reduce en-vironmental impacts, increase recovery of recyclable materials and lessen climate change. At a national level it is essential to have a clear, transparent legal framework with enforcement procedures that support the development and implementation of waste management plans that consider all the waste streams and approaches to-wards prevention, reduction, reuse, recycling and safe disposal of materials.
Local governments have the responsibility to re-engineer their institutional struc-tures making them more efficient and flexible. They should allow the participation of the private sector in service delivery and they should let citizens influence deci-sion making processes. Financial support is needed for an appropriate well-func-tioning system. Therefore, financial instruments should be developed to motivate private sector participation. Citizens must participate by paying fair fees for the ser-vices received. Infrastructure and equipment for collection, transportation and safe disposal should be in accordance to the local conditions and not emulating what is used in developed countries.
161
C O N C L U S I O N S A N D R E C O M M E N D A T I O N S
Awareness, capacity development and community participation are drivers for an efficient waste management system. Consequently, communication strategies and education should be included in any solid waste management plan.
Construction waste managementTo develop a sustainable construction industry in developing countries, construc-tion waste management should be part of an integrated national waste management plan. It is essential that the government, together with the construction industry, develop guidelines and strategies for construction waste reduction. It should be con-sidered the development of construction waste management plans. They must be approved for example by governmental or construction regulators before the start of the building project.
Additionally, prefabrication has been reported to reduce waste on-site. In Costa Rica, the challenge lies with the private sector that relies on traditional building technologies involving in-situ concreting and timber for formwork and scaffolding. Prefabrication has mainly been developed for low income housing projects, though recently; some projects have constructed using precast elements. This thesis shows that some of the major causes of waste are related to design and material-off-cuts. Prefabrication techniques involve both early decisions in the design process and significant reduction of on-site activities. The challenge is the difficulty for construc-tion professionals to estimate the impact of prefabrication on cost savings including waste reduction. Efforts should be made to overcome some barriers by the construc-tion industry adopting the technology on a bigger scale. Those barriers are related to the conflict between the traditional design process, lack of incentives, culture of the house owners that think that prefab housing is for low income families, absence of standard components in the market, skilled personnel needed and early collabo-ration between designers and builders, among others.
The construction industry alternatively should take lessons from the findings of this research and start implementing solutions by recognizing first the causes of con-struction waste generation. The analysis of savings by implementing a construction waste management plan could provide a financial incentive for the improvement. Capacity development can help laborers appreciate best practices or construction waste minimization benefits.
Furthermore, financial mechanisms, endorsed by the government, should be de-termined for stimulating improvements in construction processes. It should also support the establishment of secondary markets for recyclable materials, setting specifications for the use of secondary materials, raising disposal site tipping fees, enforcing legislation against illegal disposal. Furthermore, governments together with the construction industry should strive for modularization, pre-fabrication and standardization of construction processes.
162
C H A P T E R 6
The academic institutions have the responsibility of creating professionals for the construction sector. Therefore, construction programs at higher education institu-tions should incorporate sustainable construction and sustainability concepts into their curricula. Research institutes can help to improve construction practices by generating reliable data for use by local authorities to identify priorities.

163
APPENDIXES
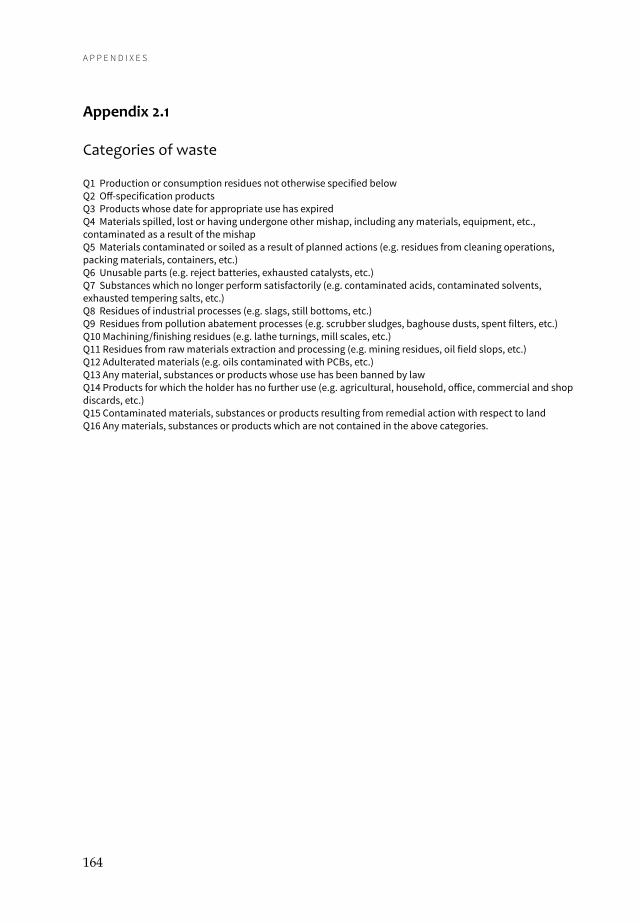
164
A P P E N D I X E S
Appendix 2.1
Categories of waste
Q1 Production or consumption residues not otherwise specified below Q2 Off-specification products Q3 Products whose date for appropriate use has expired Q4 Materials spilled, lost or having undergone other mishap, including any materials, equipment, etc., contaminated as a result of the mishap Q5 Materials contaminated or soiled as a result of planned actions (e.g. residues from cleaning operations, packing materials, containers, etc.) Q6 Unusable parts (e.g. reject batteries, exhausted catalysts, etc.) Q7 Substances which no longer perform satisfactorily (e.g. contaminated acids, contaminated solvents, exhausted tempering salts, etc.) Q8 Residues of industrial processes (e.g. slags, still bottoms, etc.) Q9 Residues from pollution abatement processes (e.g. scrubber sludges, baghouse dusts, spent filters, etc.) Q10 Machining/finishing residues (e.g. lathe turnings, mill scales, etc.) Q11 Residues from raw materials extraction and processing (e.g. mining residues, oil field slops, etc.) Q12 Adulterated materials (e.g. oils contaminated with PCBs, etc.) Q13 Any material, substances or products whose use has been banned by law Q14 Products for which the holder has no further use (e.g. agricultural, household, office, commercial and shop discards, etc.) Q15 Contaminated materials, substances or products resulting from remedial action with respect to land Q16 Any materials, substances or products which are not contained in the above categories.
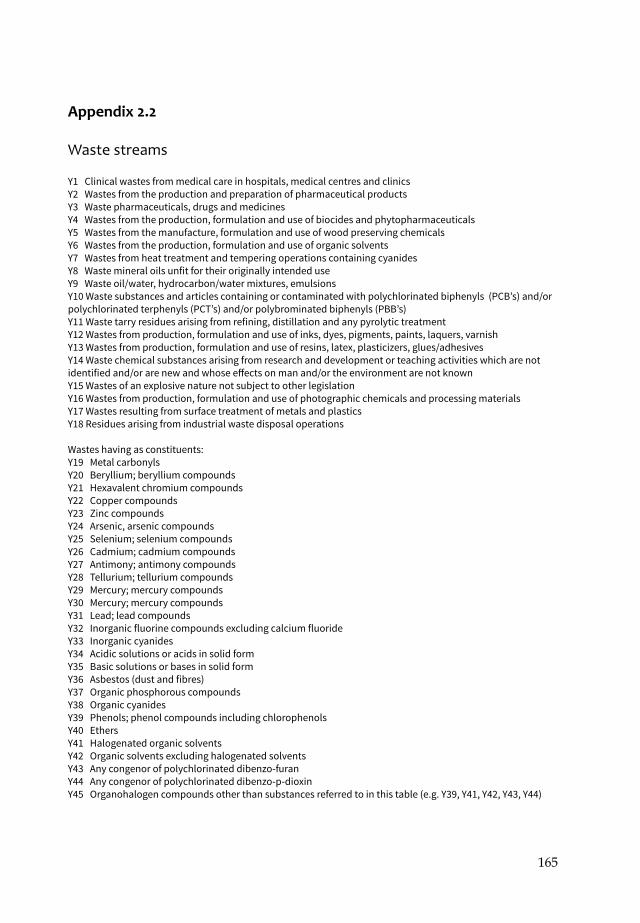
165
Appendix 2.2
Waste streams
Y1 Clinical wastes from medical care in hospitals, medical centres and clinicsY2 Wastes from the production and preparation of pharmaceutical productsY3 Waste pharmaceuticals, drugs and medicinesY4 Wastes from the production, formulation and use of biocides and phytopharmaceuticalsY5 Wastes from the manufacture, formulation and use of wood preserving chemicalsY6 Wastes from the production, formulation and use of organic solventsY7 Wastes from heat treatment and tempering operations containing cyanidesY8 Waste mineral oils unfit for their originally intended useY9 Waste oil/water, hydrocarbon/water mixtures, emulsionsY10 Waste substances and articles containing or contaminated with polychlorinated biphenyls (PCB’s) and/or polychlorinated terphenyls (PCT’s) and/or polybrominated biphenyls (PBB’s)Y11 Waste tarry residues arising from refining, distillation and any pyrolytic treatmentY12 Wastes from production, formulation and use of inks, dyes, pigments, paints, laquers, varnishY13 Wastes from production, formulation and use of resins, latex, plasticizers, glues/adhesivesY14 Waste chemical substances arising from research and development or teaching activities which are not identified and/or are new and whose effects on man and/or the environment are not knownY15 Wastes of an explosive nature not subject to other legislationY16 Wastes from production, formulation and use of photographic chemicals and processing materialsY17 Wastes resulting from surface treatment of metals and plasticsY18 Residues arising from industrial waste disposal operations
Wastes having as constituents:Y19 Metal carbonylsY20 Beryllium; beryllium compoundsY21 Hexavalent chromium compoundsY22 Copper compoundsY23 Zinc compoundsY24 Arsenic, arsenic compoundsY25 Selenium; selenium compoundsY26 Cadmium; cadmium compoundsY27 Antimony; antimony compoundsY28 Tellurium; tellurium compoundsY29 Mercury; mercury compoundsY30 Mercury; mercury compoundsY31 Lead; lead compoundsY32 Inorganic fluorine compounds excluding calcium fluorideY33 Inorganic cyanidesY34 Acidic solutions or acids in solid formY35 Basic solutions or bases in solid formY36 Asbestos (dust and fibres)Y37 Organic phosphorous compoundsY38 Organic cyanidesY39 Phenols; phenol compounds including chlorophenolsY40 EthersY41 Halogenated organic solventsY42 Organic solvents excluding halogenated solventsY43 Any congenor of polychlorinated dibenzo-furanY44 Any congenor of polychlorinated dibenzo-p-dioxinY45 Organohalogen compounds other than substances referred to in this table (e.g. Y39, Y41, Y42, Y43, Y44)
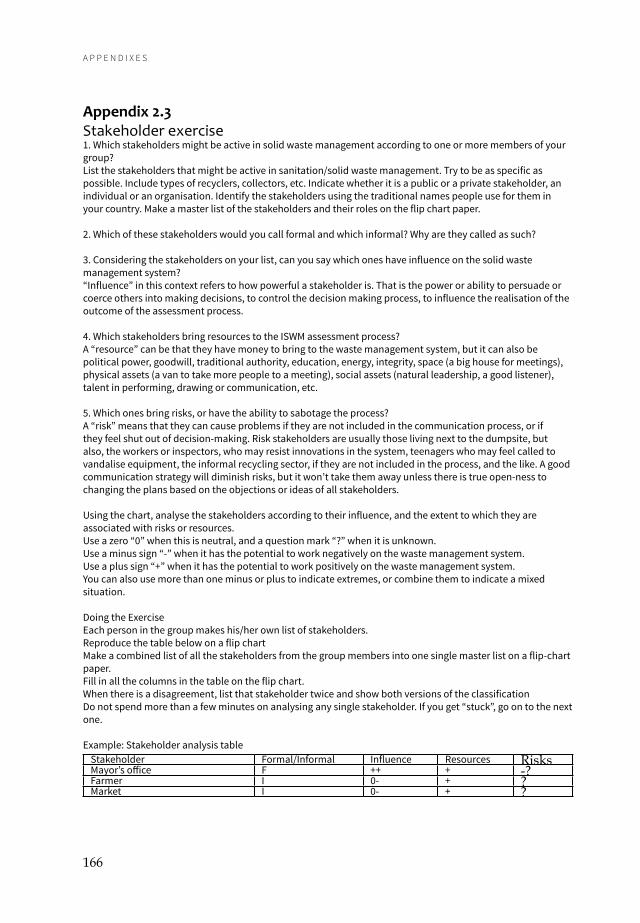
166
A P P E N D I X E S
Appendix 2.3 Stakeholder exercise1. Which stakeholders might be active in solid waste management according to one or more members of your group? List the stakeholders that might be active in sanitation/solid waste management. Try to be as specific as possible. Include types of recyclers, collectors, etc. Indicate whether it is a public or a private stakeholder, an individual or an organisation. Identify the stakeholders using the traditional names people use for them in your country. Make a master list of the stakeholders and their roles on the flip chart paper.
2. Which of these stakeholders would you call formal and which informal? Why are they called as such?
3. Considering the stakeholders on your list, can you say which ones have influence on the solid waste management system?“Influence” in this context refers to how powerful a stakeholder is. That is the power or ability to persuade or coerce others into making decisions, to control the decision making process, to influence the realisation of the outcome of the assessment process.
4. Which stakeholders bring resources to the ISWM assessment process? A “resource” can be that they have money to bring to the waste management system, but it can also be political power, goodwill, traditional authority, education, energy, integrity, space (a big house for meetings), physical assets (a van to take more people to a meeting), social assets (natural leadership, a good listener), talent in performing, drawing or communication, etc.
5. Which ones bring risks, or have the ability to sabotage the process?A “risk” means that they can cause problems if they are not included in the communication process, or if they feel shut out of decision-making. Risk stakeholders are usually those living next to the dumpsite, but also, the workers or inspectors, who may resist innovations in the system, teenagers who may feel called to vandalise equipment, the informal recycling sector, if they are not included in the process, and the like. A good communication strategy will diminish risks, but it won’t take them away unless there is true open-ness to changing the plans based on the objections or ideas of all stakeholders.
Using the chart, analyse the stakeholders according to their influence, and the extent to which they are associated with risks or resources. Use a zero “0” when this is neutral, and a question mark “?” when it is unknown. Use a minus sign “-” when it has the potential to work negatively on the waste management system. Use a plus sign “+” when it has the potential to work positively on the waste management system.You can also use more than one minus or plus to indicate extremes, or combine them to indicate a mixed situation.
Doing the ExerciseEach person in the group makes his/her own list of stakeholders.Reproduce the table below on a flip chartMake a combined list of all the stakeholders from the group members into one single master list on a flip-chart paper.Fill in all the columns in the table on the flip chart.When there is a disagreement, list that stakeholder twice and show both versions of the classificationDo not spend more than a few minutes on analysing any single stakeholder. If you get “stuck”, go on to the next one.
Example: Stakeholder analysis tableStakeholder Formal/Informal Influence Resources RisksMayor’s office F ++ + -?Farmer I 0- + ?Market I 0- + ?
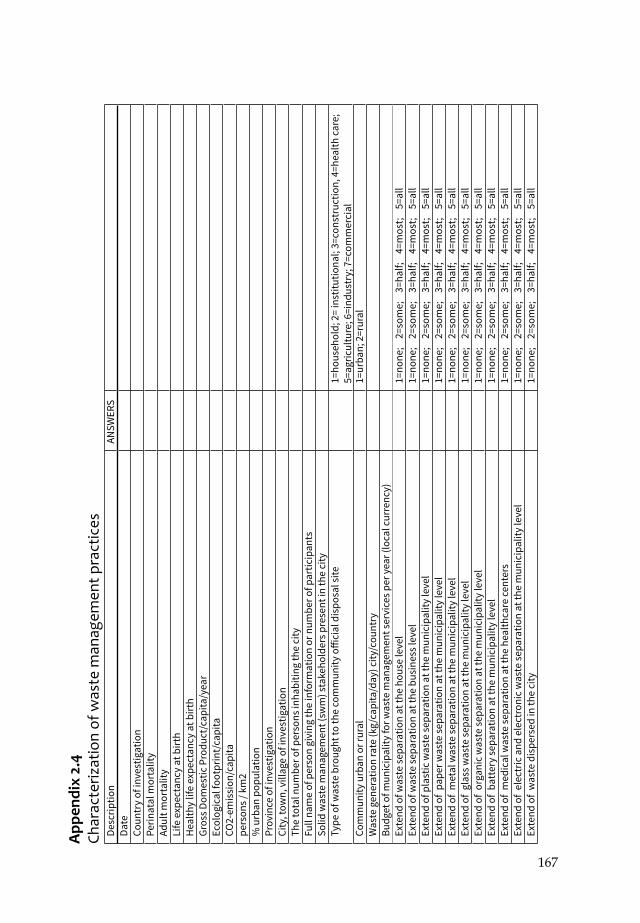
167
App
endi
x 2.
4 Ch
arac
teriz
atio
n of
was
te m
anag
emen
t pra
ctic
es
Desc
riptio
nAN
SWER
SDa
te
Coun
try
of in
vest
igat
ion
Perin
atal
mor
talit
yAd
ult m
orta
lity
Life
exp
ecta
ncy
at b
irth
Hea
lthy
life
expe
ctan
cy a
t birt
hGr
oss D
omes
tic P
rodu
ct/c
apita
/yea
rEc
olog
ical
foot
prin
t/ca
pita
CO2-
emis
sion
/cap
itape
rson
s / k
m2
% u
rban
pop
ulat
ion
Prov
ince
of i
nves
tigat
ion
City
, tow
n, v
illag
e of
inve
stig
atio
nTh
e to
tal n
umbe
r of p
erso
ns in
habi
ting
the
city
Full
nam
e of
per
son
givi
ng th
e in
form
atio
n or
num
ber o
f par
ticip
ants
Solid
was
te m
anag
emen
t (sw
m) s
take
hold
ers p
rese
nt in
the
city
Type
of w
aste
bro
ught
to th
e co
mm
unity
offi
cial
dis
posa
l site
1=
hous
ehol
d; 2
= in
stitu
tiona
l; 3=
cons
truc
tion,
4=h
ealth
car
e;
5=ag
ricul
ture
; 6=i
ndus
try;
7=c
omm
erci
alCo
mm
unity
urb
an o
r rur
al1=
urba
n; 2
=rur
alW
aste
gen
erat
ion
rate
(kg/
capi
ta/d
ay) c
ity/c
ount
ryBu
dget
of m
unic
ipal
ity fo
r was
te m
anag
emen
t ser
vice
s per
yea
r (lo
cal c
urre
ncy)
Exte
nd o
f was
te se
para
tion
at th
e ho
use
leve
l1=
none
; 2
=som
e;
3=ha
lf;
4=m
ost;
5=a
ll
Ex
tend
of w
aste
sepa
ratio
n at
the
busi
ness
leve
l1=
none
; 2
=som
e;
3=ha
lf;
4=m
ost;
5=a
ll
Ex
tend
of p
last
ic w
aste
sepa
ratio
n at
the
mun
icip
ality
leve
l1=
none
; 2
=som
e;
3=ha
lf;
4=m
ost;
5=a
ll
Ex
tend
of
pape
r was
te se
para
tion
at th
e m
unic
ipal
ity le
vel
1=no
ne;
2=s
ome;
3=
half;
4=
mos
t; 5
=all
Exte
nd o
f m
etal
was
te se
para
tion
at th
e m
unic
ipal
ity le
vel
1=no
ne;
2=s
ome;
3=
half;
4=
mos
t; 5
=all
Exte
nd o
f gl
ass w
aste
sepa
ratio
n at
the
mun
icip
ality
leve
l1=
none
; 2
=som
e;
3=ha
lf;
4=m
ost;
5=a
ll
Ex
tend
of
orga
nic
was
te se
para
tion
at th
e m
unic
ipal
ity le
vel
1=no
ne;
2=s
ome;
3=
half;
4=
mos
t; 5
=all
Exte
nd o
f ba
tter
y se
para
tion
at th
e m
unic
ipal
ity le
vel
1=no
ne;
2=s
ome;
3=
half;
4=
mos
t; 5
=all
Exte
nd o
f m
edic
al w
aste
sepa
ratio
n at
the
heal
thca
re ce
nter
s1=
none
; 2
=som
e;
3=ha
lf;
4=m
ost;
5=a
ll
Ex
tend
of
elec
tric
and
ele
ctro
nic
was
te se
para
tion
at th
e m
unic
ipal
ity le
vel
1=no
ne;
2=s
ome;
3=
half;
4=
mos
t; 5
=all
Exte
nd o
f w
aste
dis
pers
ed in
the
city
1=no
ne;
2=s
ome;
3=
half;
4=
mos
t; 5
=all
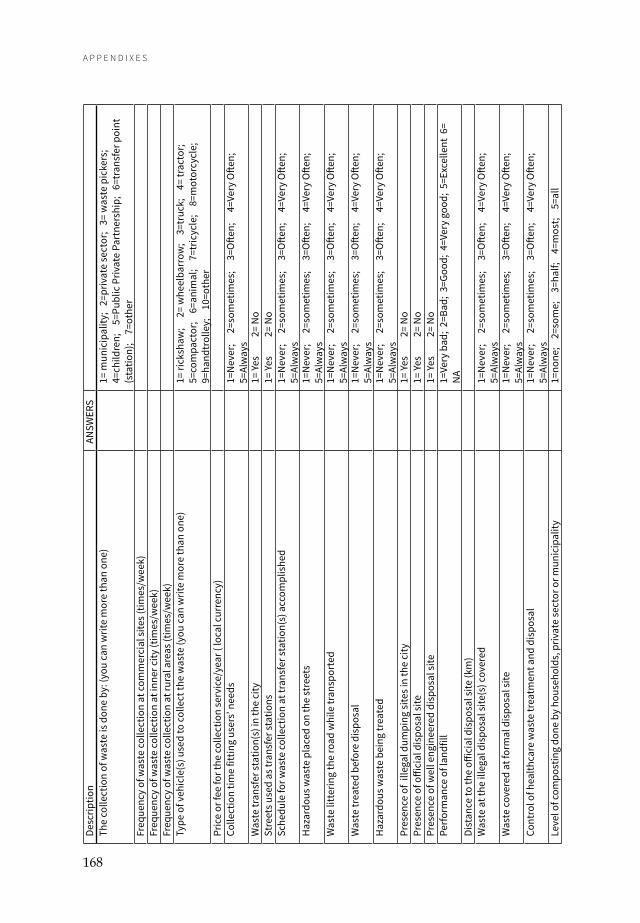
168
A P P E N D I X E S
Desc
riptio
nAN
SWER
STh
e co
llect
ion
of w
aste
is d
one
by: (
you
can
writ
e m
ore
than
one
)1=
mun
icip
ality
; 2
=priv
ate
sect
or;
3=
was
te p
icke
rs;
4=
child
ren;
5=
Publ
ic P
rivat
e Pa
rtne
rshi
p; 6
=tra
nsfe
r poi
nt
(sta
tion)
; 7
=oth
er
Freq
uenc
y of
was
te co
llect
ion
at co
mm
erci
al si
tes (
times
/wee
k)Fr
eque
ncy
of w
aste
colle
ctio
n at
inne
r city
(tim
es/w
eek)
Freq
uenc
y of
was
te co
llect
ion
at ru
ral a
reas
(tim
es/w
eek)
Type
of v
ehic
le(s
) use
d to
colle
ct th
e w
aste
(you
can
writ
e m
ore
than
one
)1=
rick
shaw
; 2
= w
heel
barr
ow;
3=t
ruck
; 4
= tr
acto
r;
5=
com
pact
or;
6=a
nim
al;
7=t
ricyc
le;
8=m
otor
cycl
e;
9=ha
ndtr
olle
y;
10=o
ther
Pric
e or
fee
for t
he co
llect
ion
serv
ice/
year
( lo
cal c
urre
ncy)
Co
llect
ion
time
fittin
g us
ers’
nee
ds1=
Nev
er;
2=s
omet
imes
; 3
=Ofte
n;
4=V
ery
Ofte
n;
5=
Alw
ays
W
aste
tran
sfer
stat
ion(
s) in
the
city
1= Ye
s
2=
No
Stre
ets u
sed
as tr
ansf
er st
atio
ns1=
Yes
2
= N
o
Sc
hedu
le fo
r was
te co
llect
ion
at tr
ansf
er st
atio
n(s)
acc
ompl
ishe
d1=
Nev
er;
2=s
omet
imes
; 3
=Ofte
n;
4=V
ery
Ofte
n;
5=
Alw
ays
H
azar
dous
was
te p
lace
d on
the
stre
ets
1=N
ever
; 2
=som
etim
es;
3=O
ften;
4
=Ver
y O
ften;
5=Al
way
s
Was
te li
tter
ing
the
road
whi
le tr
ansp
orte
d 1=
Nev
er;
2=s
omet
imes
; 3
=Ofte
n;
4=V
ery
Ofte
n;
5=
Alw
ays
W
aste
trea
ted
befo
re d
ispo
sal
1=N
ever
; 2
=som
etim
es;
3=O
ften;
4
=Ver
y O
ften;
5=Al
way
s
Haz
ardo
us w
aste
bei
ng tr
eate
d1=
Nev
er;
2=s
omet
imes
; 3
=Ofte
n;
4=V
ery
Ofte
n;
5=
Alw
ays
Pr
esen
ce o
f ill
egal
dum
ping
site
s in
the
city
1= Ye
s
2=
No
Pres
ence
of o
ffici
al d
ispo
sal s
ite1=
Yes
2
= N
o
Pr
esen
ce o
f wel
l eng
inee
red
disp
osal
site
1= Ye
s
2=
No
Perfo
rman
ce o
f lan
dfill
1=
Very
bad
; 2=
Bad;
3=G
ood;
4=V
ery
good
; 5=
Exce
llent
6=
NA
Dist
ance
to th
e off
icia
l dis
posa
l site
(km
)W
aste
at t
he il
lega
l dis
posa
l site
(s) c
over
ed1=
Nev
er;
2=s
omet
imes
; 3
=Ofte
n;
4=V
ery
Ofte
n;
5=
Alw
ays
W
aste
cove
red
at fo
rmal
dis
posa
l site
1=N
ever
; 2
=som
etim
es;
3=O
ften;
4
=Ver
y O
ften;
5=Al
way
s
Cont
rol o
f hea
lthca
re w
aste
trea
tmen
t and
dis
posa
l1=
Nev
er;
2=s
omet
imes
; 3
=Ofte
n;
4=V
ery
Ofte
n;
5=
Alw
ays
Le
vel o
f com
post
ing
done
by
hous
ehol
ds, p
rivat
e se
ctor
or m
unic
ipal
ity1=
none
; 2
=som
e;
3=ha
lf;
4=m
ost;
5=a
ll
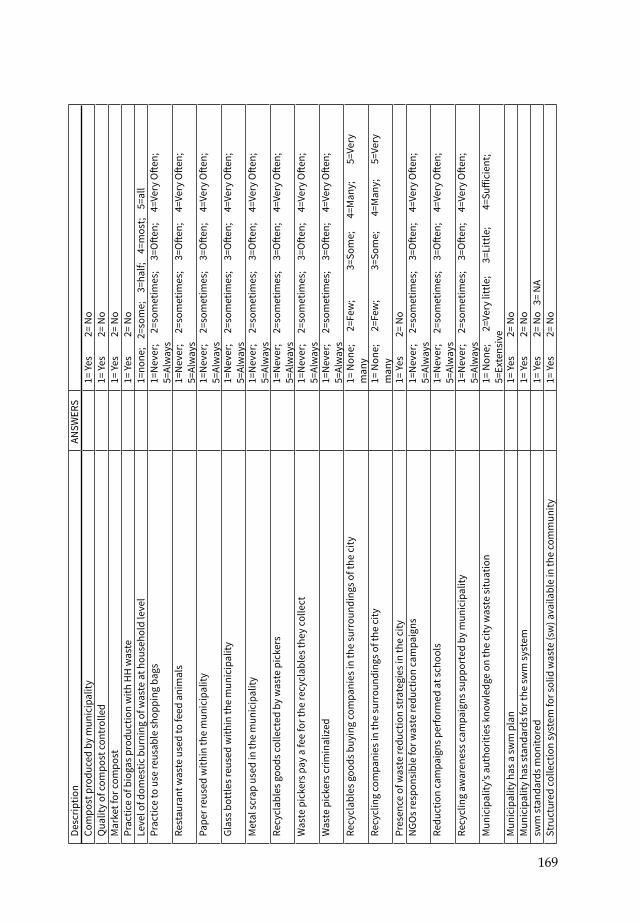
169
Desc
riptio
nAN
SWER
SCo
mpo
st p
rodu
ced
by m
unic
ipal
ity1=
Yes
2
= N
o
Q
ualit
y of
com
post
cont
rolle
d1=
Yes
2
= N
o
M
arke
t for
com
post
1= Ye
s
2=
No
Prac
tice
of b
ioga
s pro
duct
ion
with
HH
was
te1=
Yes
2
= N
o
Le
vel o
f dom
estic
bur
ning
of w
aste
at h
ouse
hold
leve
l 1=
none
; 2
=som
e;
3=ha
lf;
4=m
ost;
5=a
ll
Pr
actic
e to
use
reus
able
shop
ping
bag
s1=
Nev
er;
2=s
omet
imes
; 3
=Ofte
n;
4=V
ery
Ofte
n;
5=
Alw
ays
Re
stau
rant
was
te u
sed
to fe
ed a
nim
als
1=N
ever
; 2
=som
etim
es;
3=O
ften;
4
=Ver
y O
ften;
5=Al
way
s
Pape
r reu
sed
with
in th
e m
unic
ipal
ity1=
Nev
er;
2=s
omet
imes
; 3
=Ofte
n;
4=V
ery
Ofte
n;
5=
Alw
ays
Gl
ass b
ottle
s reu
sed
with
in th
e m
unic
ipal
ity1=
Nev
er;
2=s
omet
imes
; 3
=Ofte
n;
4=V
ery
Ofte
n;
5=
Alw
ays
M
etal
scra
p us
ed in
the
mun
icip
ality
1=N
ever
; 2
=som
etim
es;
3=O
ften;
4
=Ver
y O
ften;
5=Al
way
s
Recy
clab
les g
oods
colle
cted
by
was
te p
icke
rs1=
Nev
er;
2=s
omet
imes
; 3
=Ofte
n;
4=V
ery
Ofte
n;
5=
Alw
ays
W
aste
pic
kers
pay
a fe
e fo
r the
recy
clab
les t
hey
colle
ct1=
Nev
er;
2=s
omet
imes
; 3
=Ofte
n;
4=V
ery
Ofte
n;
5=
Alw
ays
W
aste
pic
kers
crim
inal
ized
1=N
ever
; 2
=som
etim
es;
3=O
ften;
4
=Ver
y O
ften;
5=Al
way
s
Recy
clab
les g
oods
buy
ing
com
pani
es in
the
surr
ound
ings
of t
he c
ity1=
Non
e;
2=F
ew;
3=
Som
e;
4=M
any;
5=Ve
ry
man
yRe
cycl
ing
com
pani
es in
the
surr
ound
ings
of t
he c
ity1=
Non
e;
2=F
ew;
3=
Som
e;
4=M
any;
5
=Ver
y m
any
Pres
ence
of w
aste
redu
ctio
n st
rate
gies
in th
e ci
ty1=
Yes
2
= N
o
N
GOs r
espo
nsib
le fo
r was
te re
duct
ion
cam
paig
ns1=
Nev
er;
2=s
omet
imes
; 3
=Ofte
n;
4=V
ery
Ofte
n;
5=
Alw
ays
Re
duct
ion
cam
paig
ns p
erfo
rmed
at s
choo
ls1=
Nev
er;
2=s
omet
imes
; 3
=Ofte
n;
4=V
ery
Ofte
n;
5=
Alw
ays
Re
cycl
ing
awar
enes
s cam
paig
ns su
ppor
ted
by m
unic
ipal
ity1=
Nev
er;
2=s
omet
imes
; 3
=Ofte
n;
4=V
ery
Ofte
n;
5=
Alw
ays
M
unic
ipal
ity’s
auth
oriti
es k
now
ledg
e on
the
city
was
te si
tuat
ion
1= N
one;
2
=Ver
y lit
tle;
3=
Litt
le;
4
=Suff
icie
nt;
5=
Exte
nsiv
e
Mun
icip
ality
has
a sw
m p
lan
1= Ye
s
2=
No
Mun
icip
ality
has
stan
dard
s for
the
swm
syst
em1=
Yes
2
= N
o
sw
m st
anda
rds m
onito
red
1= Ye
s
2=
No
3=
NA
Stru
ctur
ed co
llect
ion
syst
em fo
r sol
id w
aste
(sw
) ava
ilabl
e in
the
com
mun
ity1=
Yes
2
= N
o
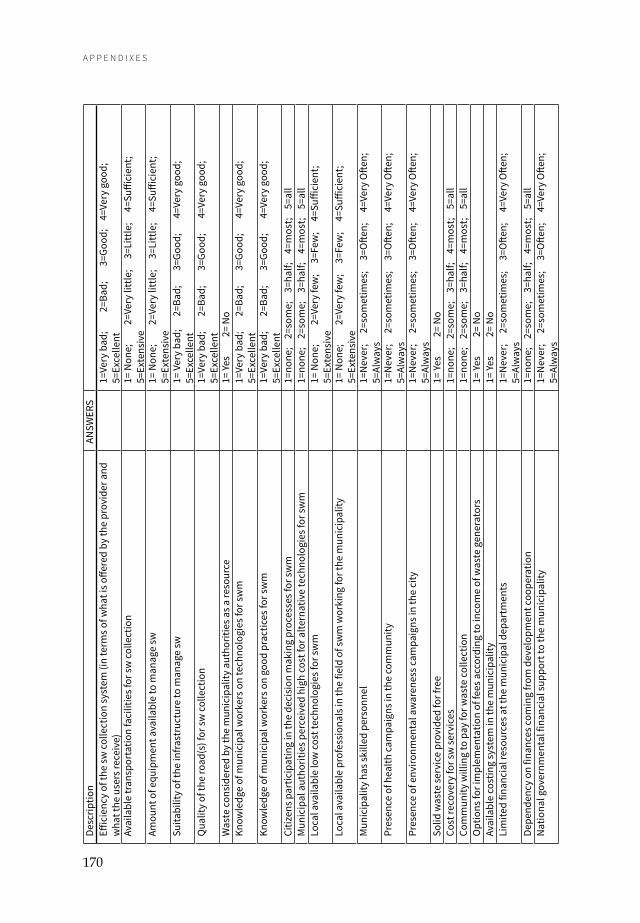
170
A P P E N D I X E S
Desc
riptio
nAN
SWER
SEff
icie
ncy
of th
e sw
colle
ctio
n sy
stem
(in
term
s of w
hat i
s offe
red
by th
e pr
ovid
er a
nd
wha
t the
use
rs re
ceiv
e)1=
Very
bad
;
2=B
ad;
3
=Goo
d;
4=Ve
ry g
ood;
5=Ex
celle
nt
Av
aila
ble
tran
spor
tatio
n fa
cilit
ies f
or sw
colle
ctio
n1=
Non
e;
2
=Ver
y lit
tle;
3=L
ittle
; 4
=Suff
icie
nt;
5=
Exte
nsiv
e
Amou
nt o
f equ
ipm
ent a
vaila
ble
to m
anag
e sw
1= N
one;
2=V
ery
little
; 3
=Litt
le;
4=S
uffic
ient
;
5=Ex
tens
ive
Su
itabi
lity
of th
e in
frast
ruct
ure
to m
anag
e sw
1= V
ery
bad;
2
=Bad
;
3=G
ood;
4
=Ver
y go
od;
5=
Exce
llent
Qua
lity
of th
e ro
ad(s
) for
sw co
llect
ion
1=Ve
ry b
ad;
2
=Bad
;
3=G
ood;
4
=Ver
y go
od;
5=
Exce
llent
Was
te co
nsid
ered
by
the
mun
icip
ality
aut
horit
ies a
s a re
sour
ce1=
Yes
2
= N
o
Kn
owle
dge
of m
unic
ipal
wor
kers
on
tech
nolo
gies
for s
wm
1=Ve
ry b
ad;
2
=Bad
;
3=G
ood;
4
=Ver
y go
od;
5=
Exce
llent
Know
ledg
e of
mun
icip
al w
orke
rs o
n go
od p
ract
ices
for s
wm
1=Ve
ry b
ad;
2
=Bad
;
3=G
ood;
4
=Ver
y go
od;
5=
Exce
llent
Citiz
ens p
artic
ipat
ing
in th
e de
cisi
on m
akin
g pr
oces
ses f
or sw
m1=
none
; 2
=som
e;
3=ha
lf;
4=m
ost;
5=a
ll
M
unic
ipal
aut
horit
ies p
erce
ived
hig
h co
st fo
r alte
rnat
ive
tech
nolo
gies
for s
wm
1=no
ne;
2=s
ome;
3=
half;
4=
mos
t; 5
=all
Loca
l ava
ilabl
e lo
w co
st te
chno
logi
es fo
r sw
m1=
Non
e;
2
=Ver
y fe
w;
3=F
ew;
4=S
uffic
ient
;
5=Ex
tens
ive
Lo
cal a
vaila
ble
prof
essi
onal
s in
the
field
of s
wm
wor
king
for t
he m
unic
ipal
ity1=
Non
e;
2
=Ver
y fe
w;
3=F
ew;
4=S
uffic
ient
;
5=Ex
tens
ive
M
unic
ipal
ity h
as sk
illed
per
sonn
el
1=N
ever
; 2
=som
etim
es;
3=O
ften;
4
=Ver
y O
ften;
5=Al
way
s
Pres
ence
of h
ealth
cam
paig
ns in
the
com
mun
ity1=
Nev
er;
2=s
omet
imes
; 3
=Ofte
n;
4=V
ery
Ofte
n;
5=
Alw
ays
Pr
esen
ce o
f env
ironm
enta
l aw
aren
ess c
ampa
igns
in th
e ci
ty1=
Nev
er;
2=s
omet
imes
; 3
=Ofte
n;
4=V
ery
Ofte
n;
5=
Alw
ays
So
lid w
aste
serv
ice
prov
ided
for f
ree
1= Ye
s
2=
No
Cost
reco
very
for s
w se
rvic
es1=
none
; 2
=som
e;
3=ha
lf;
4=m
ost;
5=a
ll
Co
mm
unity
will
ing
to p
ay fo
r was
te co
llect
ion
1=no
ne;
2=s
ome;
3=
half;
4=
mos
t; 5
=all
Opt
ions
for i
mpl
emen
tatio
n of
fees
acc
ordi
ng to
inco
me
of w
aste
gen
erat
ors
1= Ye
s
2=
No
Avai
labl
e co
stin
g sy
stem
in th
e m
unic
ipal
ity1=
Yes
2
= N
o
Li
mite
d fin
anci
al re
sour
ces a
t the
mun
icip
al d
epar
tmen
ts1=
Nev
er;
2=s
omet
imes
; 3
=Ofte
n;
4=V
ery
Ofte
n;
5=
Alw
ays
De
pend
ency
on
finan
ces c
omin
g fro
m d
evel
opm
ent c
oope
ratio
n1=
none
; 2
=som
e;
3=ha
lf;
4=m
ost;
5=a
ll
N
atio
nal g
over
nmen
tal f
inan
cial
supp
ort t
o th
e m
unic
ipal
ity
1=N
ever
; 2
=som
etim
es;
3=O
ften;
4
=Ver
y O
ften;
5=Al
way
s
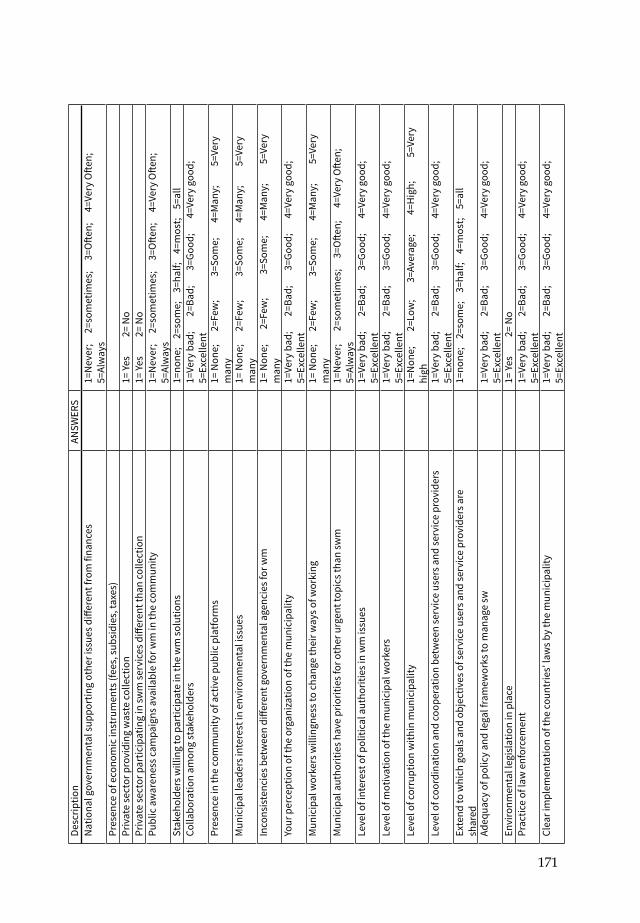
171
Desc
riptio
nAN
SWER
SN
atio
nal g
over
nmen
tal s
uppo
rtin
g ot
her i
ssue
s diff
eren
t fro
m fi
nanc
es1=
Nev
er;
2=s
omet
imes
; 3
=Ofte
n;
4=V
ery
Ofte
n;
5=
Alw
ays
Pr
esen
ce o
f eco
nom
ic in
stru
men
ts (f
ees,
subs
idie
s, ta
xes)
Priv
ate
sect
or p
rovi
ding
was
te co
llect
ion
1= Ye
s
2=
No
Priv
ate
sect
or p
artic
ipat
ing
in sw
m se
rvic
es d
iffer
ent t
han
colle
ctio
n1=
Yes
2
= N
o
Pu
blic
aw
aren
ess c
ampa
igns
ava
ilabl
e fo
r wm
in th
e co
mm
unity
1=N
ever
; 2
=som
etim
es;
3=O
ften;
4
=Ver
y O
ften;
5=Al
way
s
Stak
ehol
ders
will
ing
to p
artic
ipat
e in
the
wm
solu
tions
1=no
ne;
2=s
ome;
3=
half;
4=
mos
t; 5
=all
Colla
bora
tion
amon
g st
akeh
olde
rs1=
Very
bad
;
2=B
ad;
3
=Goo
d;
4=V
ery
good
;
5=Ex
celle
nt
Pr
esen
ce in
the
com
mun
ity o
f act
ive
publ
ic p
latfo
rms
1= N
one;
2
=Few
;
3
=Som
e;
4=M
any;
5=V
ery
man
yM
unic
ipal
lead
ers i
nter
est i
n en
viro
nmen
tal i
ssue
s1=
Non
e;
2=F
ew;
3=S
ome;
4
=Man
y;
5
=Ver
y m
any
Inco
nsis
tenc
ies b
etw
een
diffe
rent
gov
ernm
enta
l age
ncie
s for
wm
1= N
one;
2
=Few
;
3
=Som
e;
4=M
any;
5=V
ery
man
yYo
ur p
erce
ptio
n of
the
orga
niza
tion
of th
e m
unic
ipal
ity1=
Very
bad
;
2=B
ad;
3
=Goo
d;
4=V
ery
good
;
5=Ex
celle
nt
M
unic
ipal
wor
kers
will
ingn
ess t
o ch
ange
thei
r way
s of w
orki
ng1=
Non
e;
2=F
ew;
3=S
ome;
4=M
any;
5=V
ery
man
yM
unic
ipal
aut
horit
ies h
ave
prio
ritie
s for
oth
er u
rgen
t top
ics t
han
swm
1=N
ever
;
2=so
met
imes
; 3
=Ofte
n;
4=V
ery
Ofte
n;
5=Al
way
s
Leve
l of i
nter
est o
f pol
itica
l aut
horit
ies i
n w
m is
sues
1=Ve
ry b
ad;
2
=Bad
;
3=G
ood;
4
=Ver
y go
od;
5=
Exce
llent
Leve
l of m
otiv
atio
n of
the
mun
icip
al w
orke
rs1=
Very
bad
;
2=B
ad;
3
=Goo
d;
4=V
ery
good
;
5=Ex
celle
nt
Le
vel o
f cor
rupt
ion
with
in m
unic
ipal
ity1=
Non
e;
2=L
ow;
3
=Ave
rage
;
4=H
igh;
5=V
ery
high
Leve
l of c
oord
inat
ion
and
coop
erat
ion
betw
een
serv
ice
user
s and
serv
ice
prov
ider
s1=
Very
bad
;
2=B
ad;
3
=Goo
d;
4=V
ery
good
;
5=Ex
celle
nt
Ex
tend
to w
hich
goa
ls a
nd o
bjec
tives
of s
ervi
ce u
sers
and
serv
ice
prov
ider
s are
sh
ared
1=
none
; 2
=som
e;
3=ha
lf;
4=m
ost;
5=a
ll
Adeq
uacy
of p
olic
y an
d le
gal f
ram
ewor
ks to
man
age
sw1=
Very
bad
;
2=B
ad;
3
=Goo
d;
4=V
ery
good
;
5=Ex
celle
nt
En
viro
nmen
tal l
egis
latio
n in
pla
ce1=
Yes
2
= N
o
Pr
actic
e of
law
enf
orce
men
t1=
Very
bad
;
2=B
ad;
3
=Goo
d;
4=V
ery
good
;
5=Ex
celle
nt
Cl
ear i
mpl
emen
tatio
n of
the
coun
trie
s’ la
ws b
y th
e m
unic
ipal
ity1=
Very
bad
;
2=B
ad;
3
=Goo
d;
4=V
ery
good
;
5=Ex
celle
nt
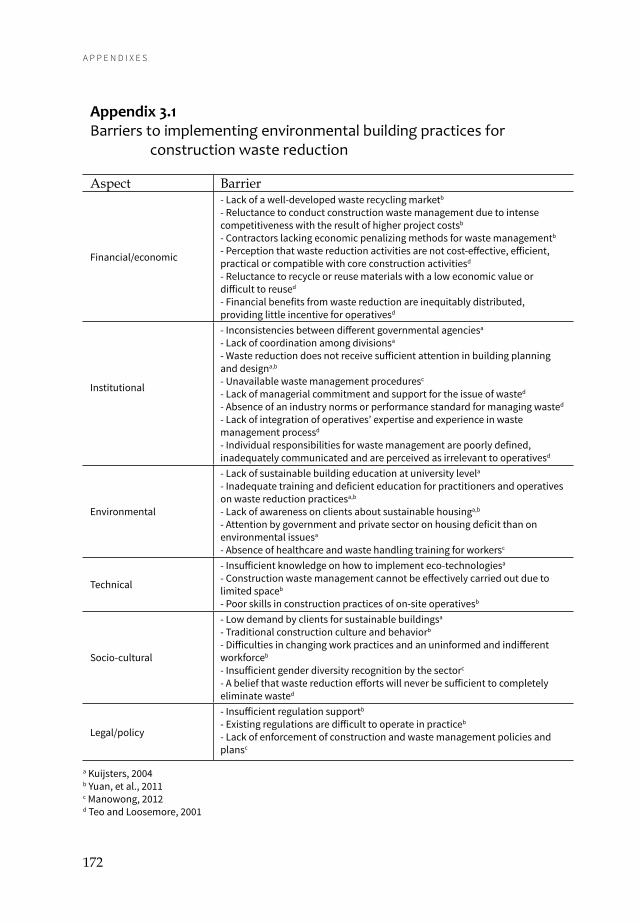
172
A P P E N D I X E S
Appendix 3.1 Barriers to implementing environmental building practices for
construction waste reduction
Aspect Barrier
Financial/economic
- Lack of a well-developed waste recycling marketb
- Reluctance to conduct construction waste management due to intense competitiveness with the result of higher project costsb
- Contractors lacking economic penalizing methods for waste managementb
- Perception that waste reduction activities are not cost-effective, efficient, practical or compatible with core construction activitiesd
- Reluctance to recycle or reuse materials with a low economic value or difficult to reused
- Financial benefits from waste reduction are inequitably distributed, providing little incentive for operativesd
Institutional
- Inconsistencies between different governmental agenciesa
- Lack of coordination among divisionsa
- Waste reduction does not receive sufficient attention in building planning and designa,b
- Unavailable waste management proceduresc
- Lack of managerial commitment and support for the issue of wasted
- Absence of an industry norms or performance standard for managing wasted
- Lack of integration of operatives’ expertise and experience in waste management processd
- Individual responsibilities for waste management are poorly defined, inadequately communicated and are perceived as irrelevant to operativesd
Environmental
- Lack of sustainable building education at university levela
- Inadequate training and deficient education for practitioners and operatives on waste reduction practicesa,b
- Lack of awareness on clients about sustainable housinga,b
- Attention by government and private sector on housing deficit than on environmental issuesa
- Absence of healthcare and waste handling training for workersc
Technical
- Insufficient knowledge on how to implement eco-technologiesa
- Construction waste management cannot be effectively carried out due to limited spaceb
- Poor skills in construction practices of on-site operativesb
Socio-cultural
- Low demand by clients for sustainable buildingsa
- Traditional construction culture and behaviorb - Difficulties in changing work practices and an uninformed and indifferent workforceb
- Insufficient gender diversity recognition by the sectorc
- A belief that waste reduction efforts will never be sufficient to completely eliminate wasted
Legal/policy
- Insufficient regulation supportb
- Existing regulations are difficult to operate in practiceb
- Lack of enforcement of construction and waste management policies and plansc
a Kuijsters, 2004b Yuan, et al., 2011c Manowong, 2012d Teo and Loosemore, 2001
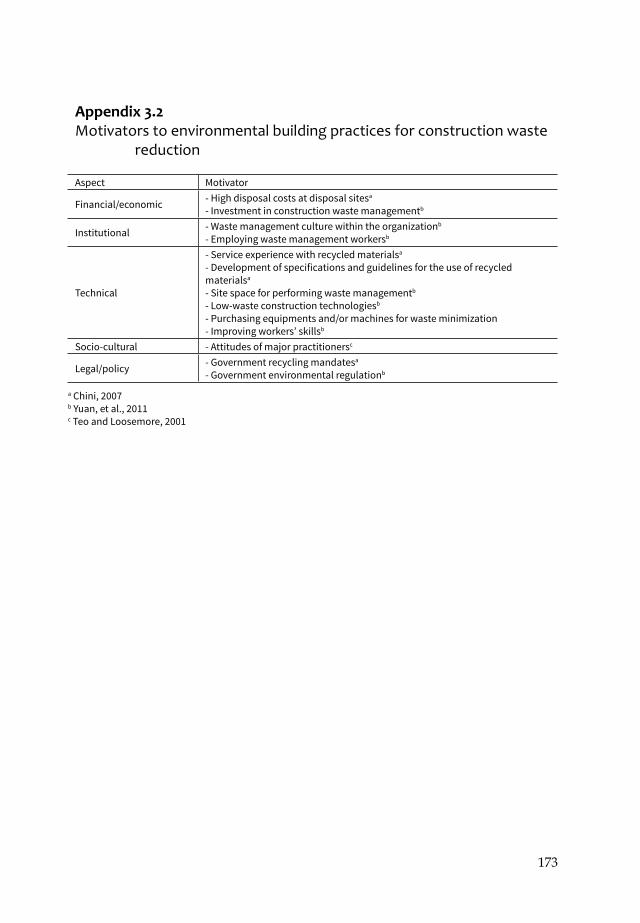
173
Appendix 3.2 Motivators to environmental building practices for construction waste
reduction
Aspect Motivator
Financial/economic - High disposal costs at disposal sitesa
- Investment in construction waste managementb
Institutional - Waste management culture within the organizationb
- Employing waste management workersb
Technical
- Service experience with recycled materialsa - Development of specifications and guidelines for the use of recycled materialsa
- Site space for performing waste managementb
- Low-waste construction technologiesb
- Purchasing equipments and/or machines for waste minimization- Improving workers’ skillsb
Socio-cultural - Attitudes of major practitionersc
Legal/policy - Government recycling mandatesa - Government environmental regulationb
a Chini, 2007b Yuan, et al., 2011c Teo and Loosemore, 2001
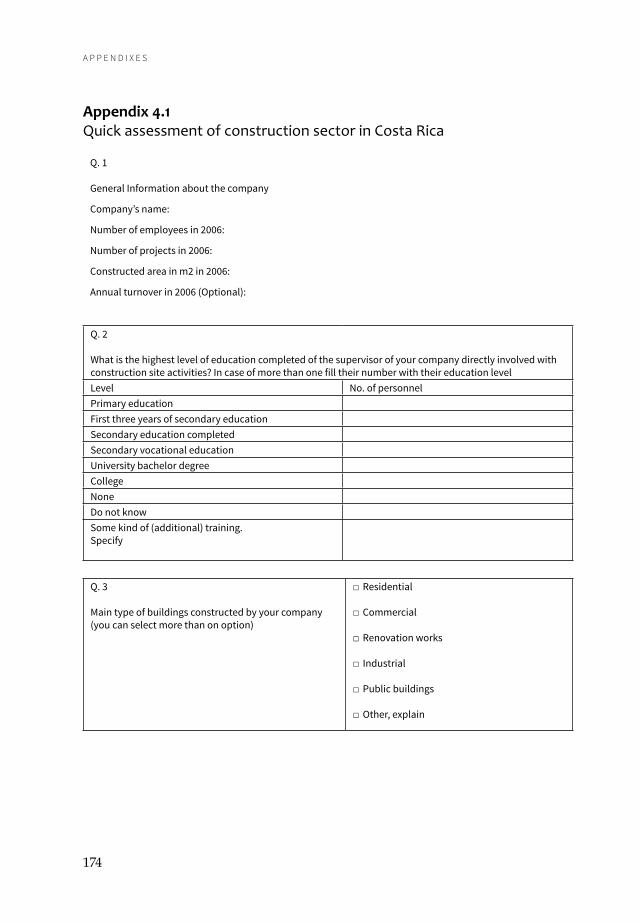
174
A P P E N D I X E S
Appendix 4.1 Quick assessment of construction sector in Costa Rica
Q. 1
General Information about the company
Company’s name:
Number of employees in 2006:
Number of projects in 2006:
Constructed area in m2 in 2006:
Annual turnover in 2006 (Optional):
Q. 2
What is the highest level of education completed of the supervisor of your company directly involved with construction site activities? In case of more than one fill their number with their education level Level No. of personnelPrimary educationFirst three years of secondary educationSecondary education completedSecondary vocational educationUniversity bachelor degree College NoneDo not knowSome kind of (additional) training.Specify
Q. 3
Main type of buildings constructed by your company (you can select more than on option)
□ Residential
□ Commercial
□ Renovation works
□ Industrial
□ Public buildings
□ Other, explain
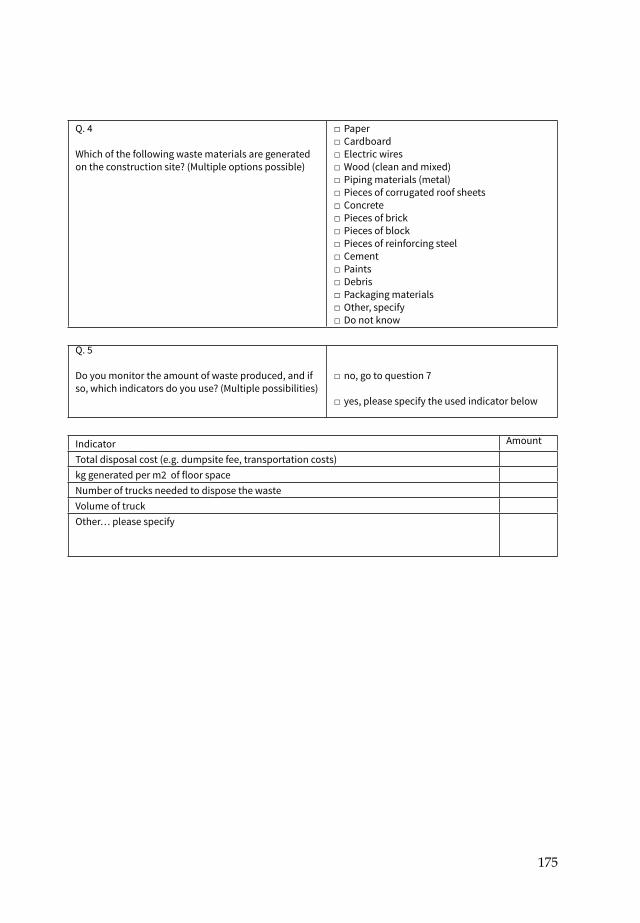
175
Q. 4
Which of the following waste materials are generated on the construction site? (Multiple options possible)
□ Paper □ Cardboard □ Electric wires □ Wood (clean and mixed)□ Piping materials (metal)□ Pieces of corrugated roof sheets □ Concrete □ Pieces of brick □ Pieces of block □ Pieces of reinforcing steel □ Cement □ Paints □ Debris□ Packaging materials □ Other, specify□ Do not know
Q. 5
Do you monitor the amount of waste produced, and if so, which indicators do you use? (Multiple possibilities)
□ no, go to question 7
□ yes, please specify the used indicator below
Indicator Amount
Total disposal cost (e.g. dumpsite fee, transportation costs)kg generated per m2 of floor space Number of trucks needed to dispose the wasteVolume of truckOther… please specify
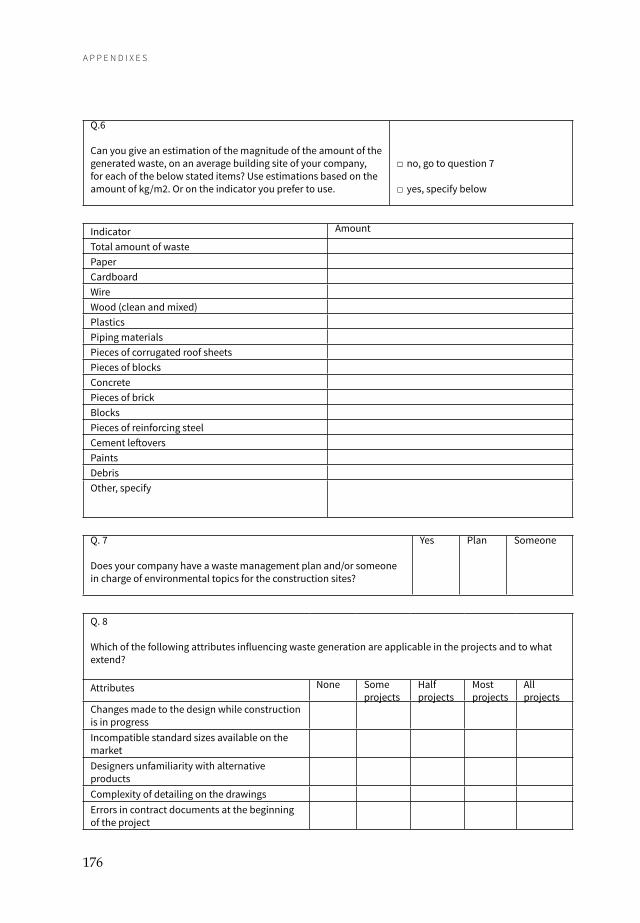
176
A P P E N D I X E S
Q.6
Can you give an estimation of the magnitude of the amount of the generated waste, on an average building site of your company, for each of the below stated items? Use estimations based on the amount of kg/m2. Or on the indicator you prefer to use.
□ no, go to question 7
□ yes, specify below
Indicator Amount
Total amount of wastePaperCardboardWireWood (clean and mixed)PlasticsPiping materialsPieces of corrugated roof sheetsPieces of blocksConcretePieces of brickBlocksPieces of reinforcing steelCement leftoversPaintsDebrisOther, specify
Q. 7
Does your company have a waste management plan and/or someone in charge of environmental topics for the construction sites?
Yes Plan Someone
Q. 8
Which of the following attributes influencing waste generation are applicable in the projects and to what extend?
Attributes None Some projects
Half projects
Most projects
All projects
Changes made to the design while construction is in progressIncompatible standard sizes available on the marketDesigners unfamiliarity with alternative productsComplexity of detailing on the drawings Errors in contract documents at the beginning of the project
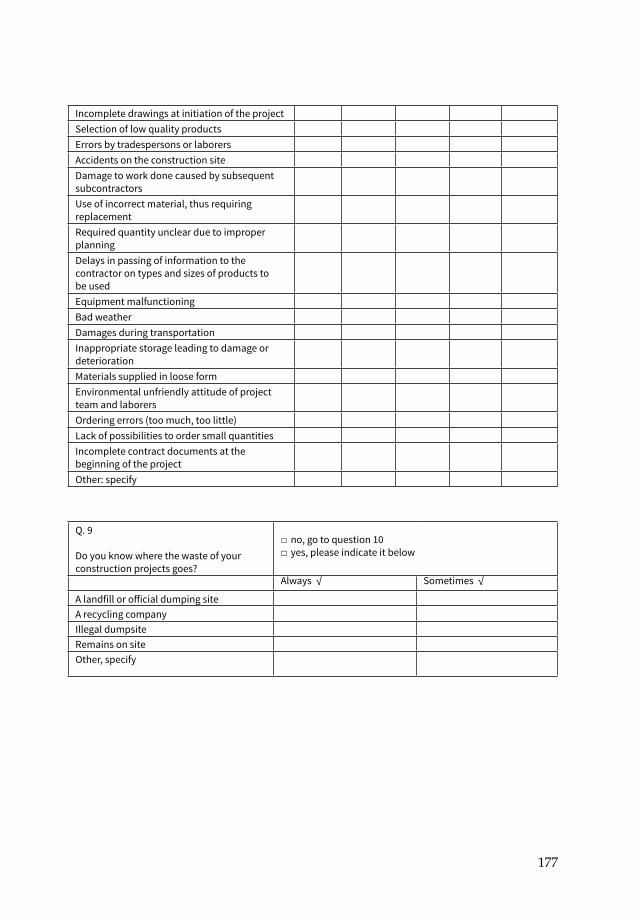
177
Incomplete drawings at initiation of the projectSelection of low quality productsErrors by tradespersons or laborersAccidents on the construction siteDamage to work done caused by subsequent subcontractorsUse of incorrect material, thus requiring replacementRequired quantity unclear due to improper planningDelays in passing of information to the contractor on types and sizes of products to be usedEquipment malfunctioningBad weatherDamages during transportationInappropriate storage leading to damage or deteriorationMaterials supplied in loose form Environmental unfriendly attitude of project team and laborersOrdering errors (too much, too little)Lack of possibilities to order small quantitiesIncomplete contract documents at the beginning of the projectOther: specify
Q. 9
Do you know where the waste of your construction projects goes?
□ no, go to question 10□ yes, please indicate it below
Always √ Sometimes √
A landfill or official dumping siteA recycling companyIllegal dumpsiteRemains on siteOther, specify
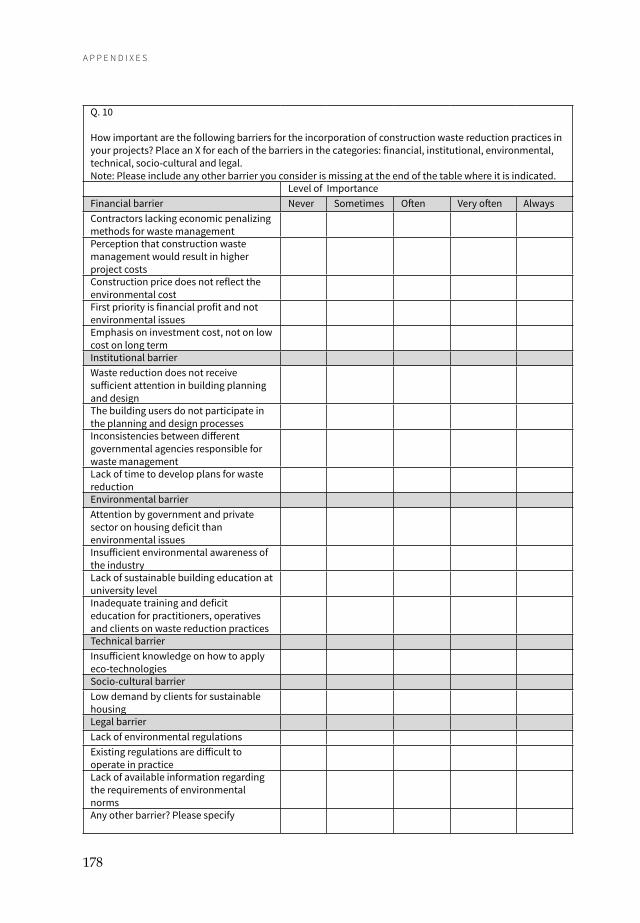
178
A P P E N D I X E S
Q. 10
How important are the following barriers for the incorporation of construction waste reduction practices in your projects? Place an X for each of the barriers in the categories: financial, institutional, environmental, technical, socio-cultural and legal. Note: Please include any other barrier you consider is missing at the end of the table where it is indicated.
Level of ImportanceFinancial barrier Never Sometimes Often Very often AlwaysContractors lacking economic penalizing methods for waste managementPerception that construction waste management would result in higher project costsConstruction price does not reflect the environmental costFirst priority is financial profit and not environmental issuesEmphasis on investment cost, not on low cost on long termInstitutional barrierWaste reduction does not receive sufficient attention in building planning and designThe building users do not participate in the planning and design processesInconsistencies between different governmental agencies responsible for waste managementLack of time to develop plans for waste reductionEnvironmental barrierAttention by government and private sector on housing deficit than environmental issuesInsufficient environmental awareness of the industryLack of sustainable building education at university levelInadequate training and deficit education for practitioners, operatives and clients on waste reduction practicesTechnical barrierInsufficient knowledge on how to apply eco-technologiesSocio-cultural barrierLow demand by clients for sustainable housingLegal barrierLack of environmental regulationsExisting regulations are difficult to operate in practiceLack of available information regarding the requirements of environmental normsAny other barrier? Please specify
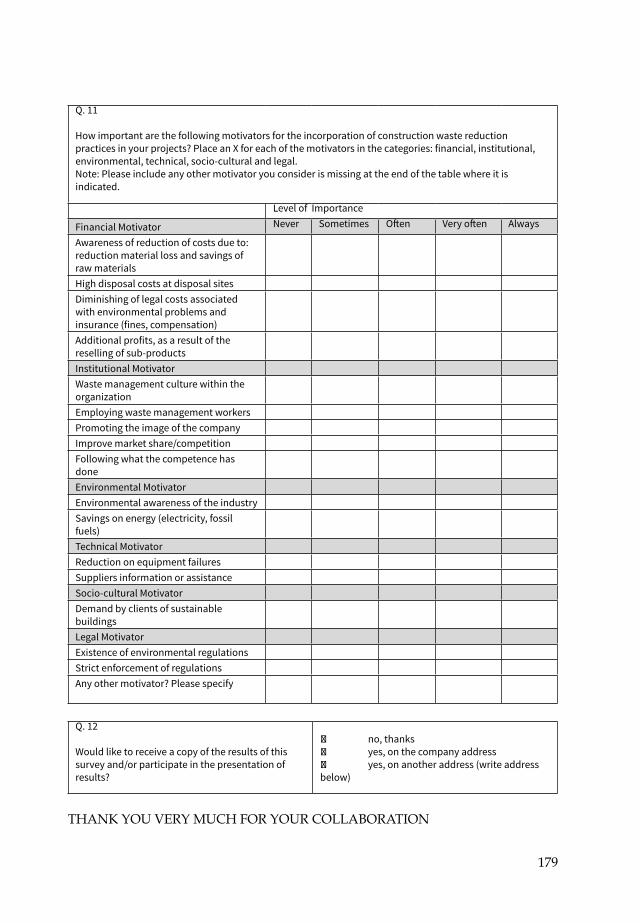
179
Q. 11
How important are the following motivators for the incorporation of construction waste reduction practices in your projects? Place an X for each of the motivators in the categories: financial, institutional, environmental, technical, socio-cultural and legal. Note: Please include any other motivator you consider is missing at the end of the table where it is indicated.
Level of Importance
Financial Motivator Never Sometimes Often Very often Always
Awareness of reduction of costs due to: reduction material loss and savings of raw materials High disposal costs at disposal sitesDiminishing of legal costs associated with environmental problems and insurance (fines, compensation)Additional profits, as a result of the reselling of sub-productsInstitutional MotivatorWaste management culture within the organizationEmploying waste management workersPromoting the image of the companyImprove market share/competitionFollowing what the competence has doneEnvironmental MotivatorEnvironmental awareness of the industrySavings on energy (electricity, fossil fuels)Technical MotivatorReduction on equipment failuresSuppliers information or assistanceSocio-cultural MotivatorDemand by clients of sustainable buildingsLegal MotivatorExistence of environmental regulations Strict enforcement of regulationsAny other motivator? Please specify
Q. 12
Would like to receive a copy of the results of this survey and/or participate in the presentation of results?
□ no, thanks□ yes, on the company address□ yes, on another address (write address below)
THANK YOU VERY MUCH FOR YOUR COLLABORATION
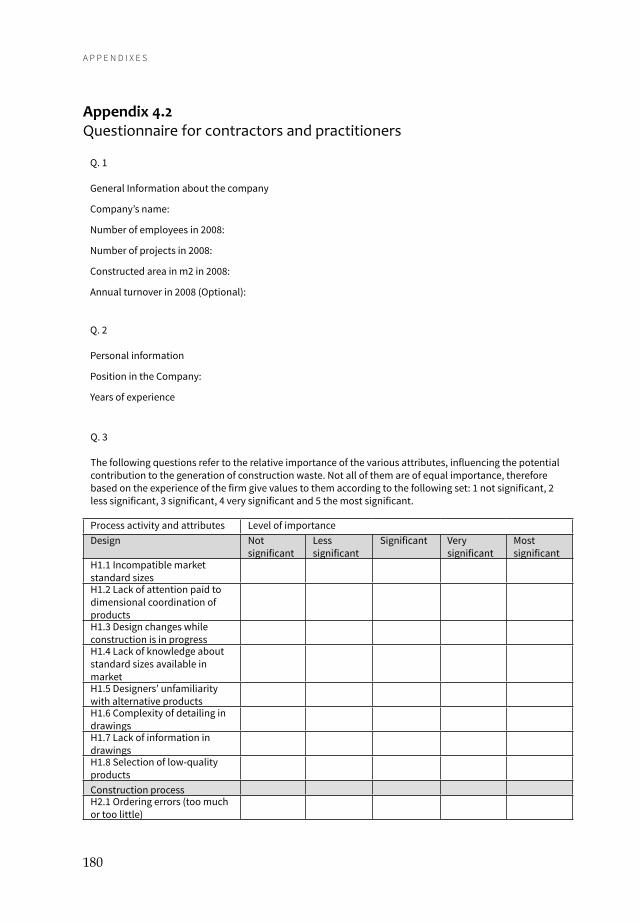
180
A P P E N D I X E S
Appendix 4.2Questionnaire for contractors and practitioners
Q. 1
General Information about the company
Company’s name:
Number of employees in 2008:
Number of projects in 2008:
Constructed area in m2 in 2008:
Annual turnover in 2008 (Optional):
Q. 2
Personal information
Position in the Company:
Years of experience
Q. 3
The following questions refer to the relative importance of the various attributes, influencing the potential contribution to the generation of construction waste. Not all of them are of equal importance, therefore based on the experience of the firm give values to them according to the following set: 1 not significant, 2 less significant, 3 significant, 4 very significant and 5 the most significant.
Process activity and attributes Level of importanceDesign Not
significantLess significant
Significant Very significant
Most significant
H1.1 Incompatible market standard sizesH1.2 Lack of attention paid to dimensional coordination of productsH1.3 Design changes while construction is in progressH1.4 Lack of knowledge about standard sizes available in marketH1.5 Designers’ unfamiliarity with alternative productsH1.6 Complexity of detailing in drawingsH1.7 Lack of information in drawingsH1.8 Selection of low-quality productsConstruction processH2.1 Ordering errors (too much or too little)
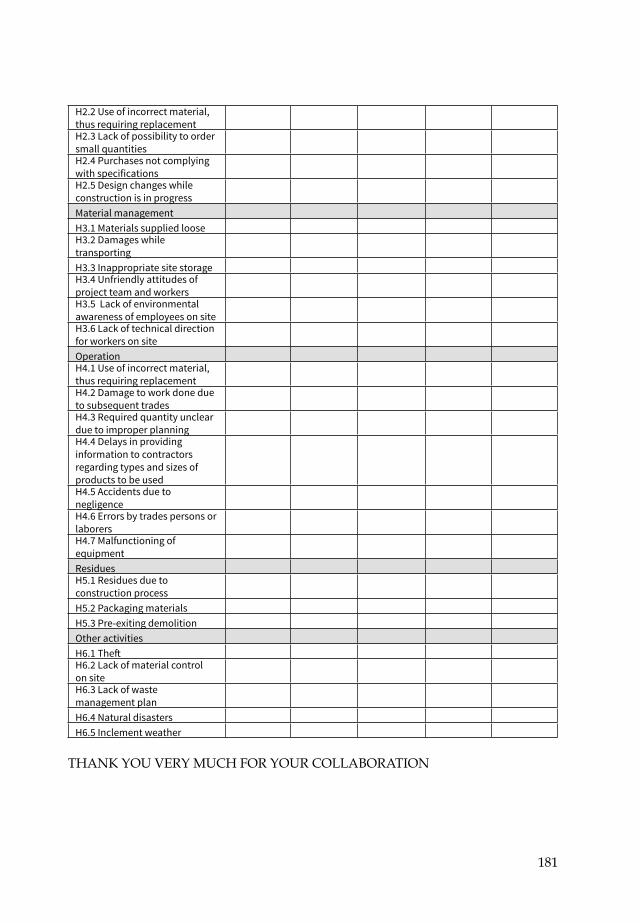
181
H2.2 Use of incorrect material, thus requiring replacementH2.3 Lack of possibility to order small quantitiesH2.4 Purchases not complying with specificationsH2.5 Design changes while construction is in progressMaterial managementH3.1 Materials supplied looseH3.2 Damages while transportingH3.3 Inappropriate site storageH3.4 Unfriendly attitudes of project team and workersH3.5 Lack of environmental awareness of employees on site H3.6 Lack of technical direction for workers on site OperationH4.1 Use of incorrect material, thus requiring replacement H4.2 Damage to work done due to subsequent tradesH4.3 Required quantity unclear due to improper planningH4.4 Delays in providing information to contractors regarding types and sizes of products to be usedH4.5 Accidents due to negligenceH4.6 Errors by trades persons or laborersH4.7 Malfunctioning of equipmentResiduesH5.1 Residues due to construction processH5.2 Packaging materialsH5.3 Pre-exiting demolitionOther activities H6.1 Theft H6.2 Lack of material control on siteH6.3 Lack of waste management planH6.4 Natural disastersH6.5 Inclement weather
THANK YOU VERY MUCH FOR YOUR COLLABORATION
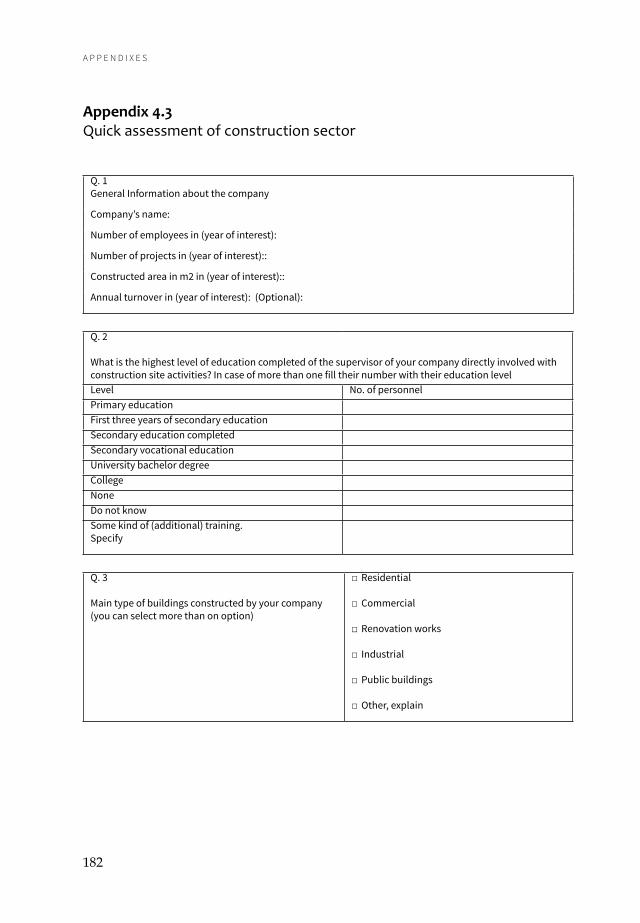
182
A P P E N D I X E S
Appendix 4.3 Quick assessment of construction sector
Q. 1General Information about the company
Company’s name:
Number of employees in (year of interest):
Number of projects in (year of interest)::
Constructed area in m2 in (year of interest)::
Annual turnover in (year of interest): (Optional):
Q. 2
What is the highest level of education completed of the supervisor of your company directly involved with construction site activities? In case of more than one fill their number with their education level Level No. of personnelPrimary educationFirst three years of secondary educationSecondary education completedSecondary vocational educationUniversity bachelor degree College NoneDo not knowSome kind of (additional) training.Specify
Q. 3
Main type of buildings constructed by your company (you can select more than on option)
□ Residential
□ Commercial
□ Renovation works
□ Industrial
□ Public buildings
□ Other, explain
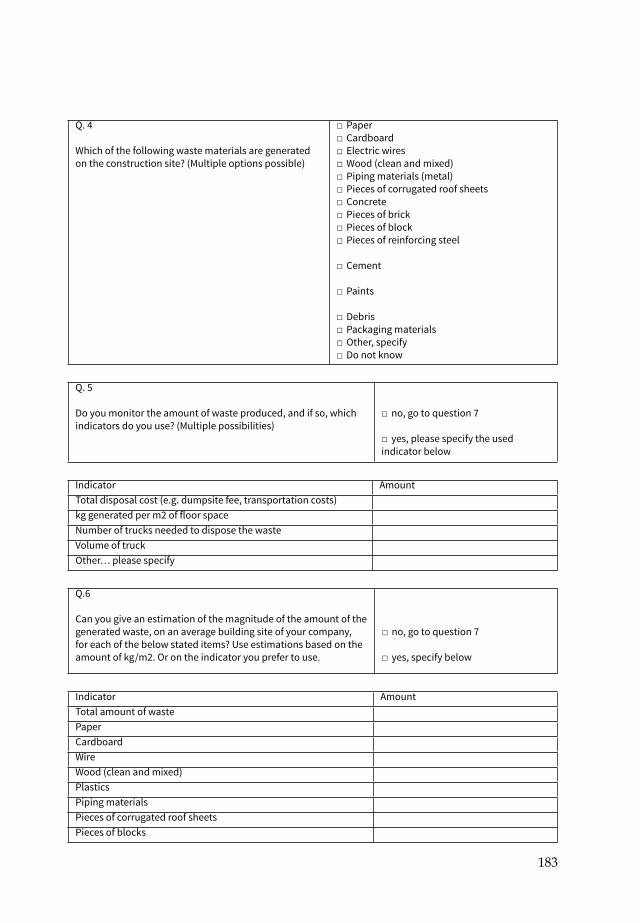
183
Q. 4
Which of the following waste materials are generated on the construction site? (Multiple options possible)
□ Paper □ Cardboard □ Electric wires □ Wood (clean and mixed)□ Piping materials (metal)□ Pieces of corrugated roof sheets □ Concrete □ Pieces of brick □ Pieces of block □ Pieces of reinforcing steel
□ Cement
□ Paints
□ Debris□ Packaging materials □ Other, specify□ Do not know
Q. 5
Do you monitor the amount of waste produced, and if so, which indicators do you use? (Multiple possibilities)
□ no, go to question 7
□ yes, please specify the used indicator below
Indicator AmountTotal disposal cost (e.g. dumpsite fee, transportation costs)kg generated per m2 of floor space Number of trucks needed to dispose the wasteVolume of truckOther… please specify
Q.6
Can you give an estimation of the magnitude of the amount of the generated waste, on an average building site of your company, for each of the below stated items? Use estimations based on the amount of kg/m2. Or on the indicator you prefer to use.
□ no, go to question 7
□ yes, specify below
Indicator AmountTotal amount of wastePaperCardboardWireWood (clean and mixed)PlasticsPiping materialsPieces of corrugated roof sheetsPieces of blocks
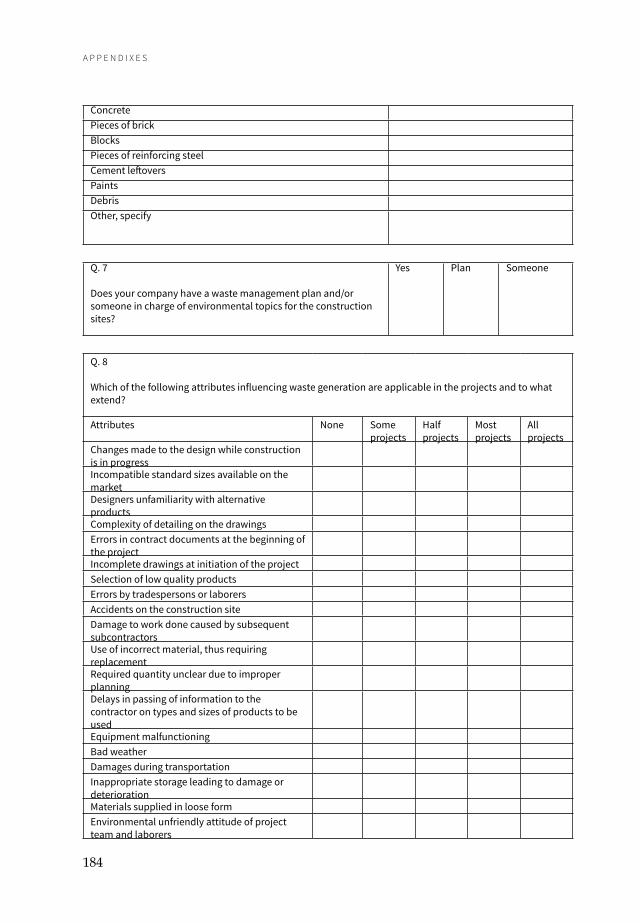
184
A P P E N D I X E S
ConcretePieces of brickBlocksPieces of reinforcing steelCement leftoversPaintsDebrisOther, specify
Q. 7
Does your company have a waste management plan and/or someone in charge of environmental topics for the construction sites?
Yes Plan Someone
Q. 8
Which of the following attributes influencing waste generation are applicable in the projects and to what extend?
Attributes None Some projects
Half projects
Most projects
All projects
Changes made to the design while construction is in progressIncompatible standard sizes available on the marketDesigners unfamiliarity with alternative productsComplexity of detailing on the drawings Errors in contract documents at the beginning of the projectIncomplete drawings at initiation of the projectSelection of low quality productsErrors by tradespersons or laborersAccidents on the construction siteDamage to work done caused by subsequent subcontractorsUse of incorrect material, thus requiring replacementRequired quantity unclear due to improper planningDelays in passing of information to the contractor on types and sizes of products to be usedEquipment malfunctioningBad weatherDamages during transportationInappropriate storage leading to damage or deteriorationMaterials supplied in loose form Environmental unfriendly attitude of project team and laborers
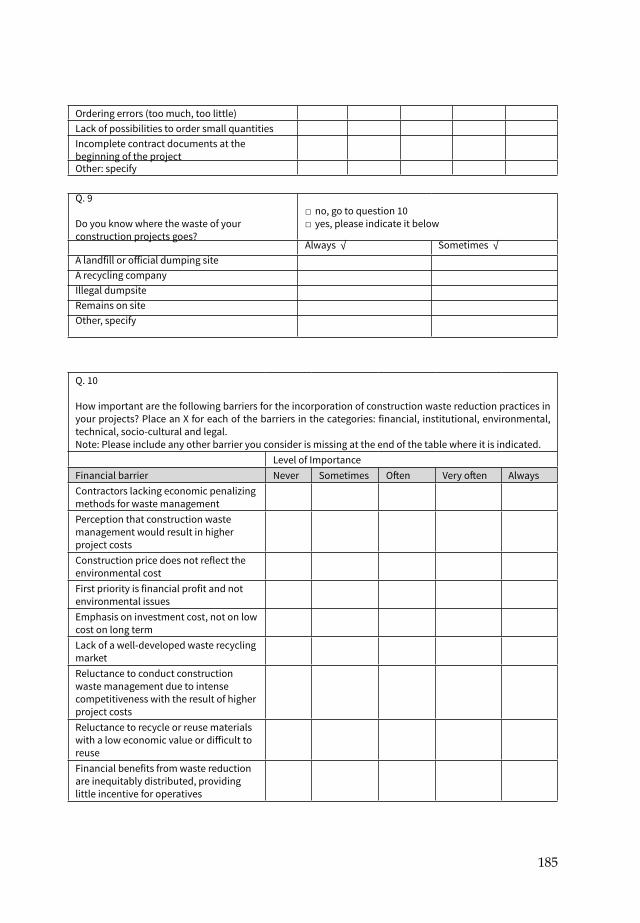
185
Ordering errors (too much, too little)Lack of possibilities to order small quantitiesIncomplete contract documents at the beginning of the projectOther: specify
Q. 9
Do you know where the waste of your construction projects goes?
□ no, go to question 10□ yes, please indicate it below
Always √ Sometimes √A landfill or official dumping siteA recycling companyIllegal dumpsiteRemains on siteOther, specify
Q. 10
How important are the following barriers for the incorporation of construction waste reduction practices in your projects? Place an X for each of the barriers in the categories: financial, institutional, environmental, technical, socio-cultural and legal. Note: Please include any other barrier you consider is missing at the end of the table where it is indicated.
Level of ImportanceFinancial barrier Never Sometimes Often Very often AlwaysContractors lacking economic penalizing methods for waste managementPerception that construction waste management would result in higher project costsConstruction price does not reflect the environmental costFirst priority is financial profit and not environmental issuesEmphasis on investment cost, not on low cost on long termLack of a well-developed waste recycling marketReluctance to conduct construction waste management due to intense competitiveness with the result of higher project costsReluctance to recycle or reuse materials with a low economic value or difficult to reuseFinancial benefits from waste reduction are inequitably distributed, providing little incentive for operatives
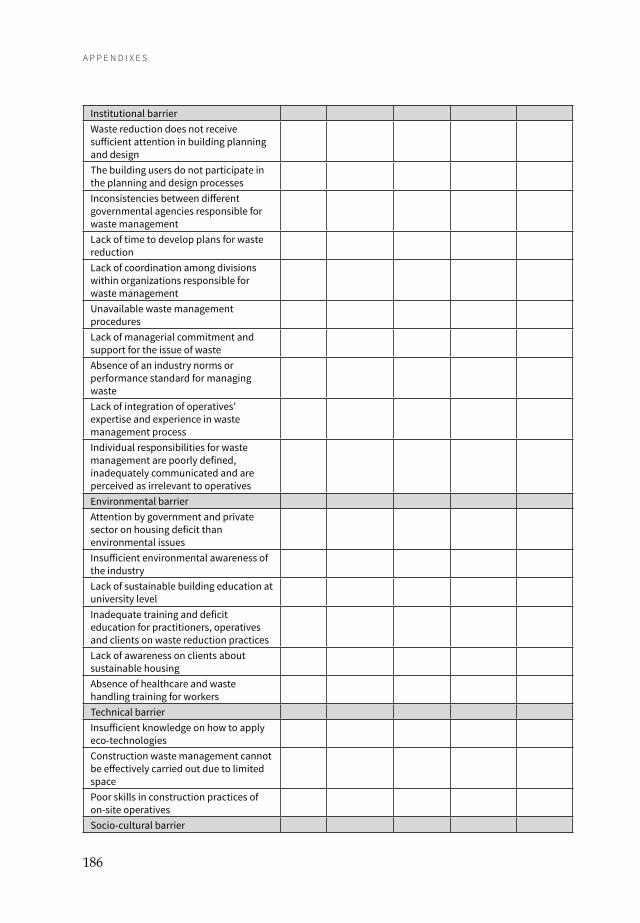
186
A P P E N D I X E S
Institutional barrierWaste reduction does not receive sufficient attention in building planning and designThe building users do not participate in the planning and design processesInconsistencies between different governmental agencies responsible for waste managementLack of time to develop plans for waste reductionLack of coordination among divisions within organizations responsible for waste managementUnavailable waste management proceduresLack of managerial commitment and support for the issue of wasteAbsence of an industry norms or performance standard for managing wasteLack of integration of operatives’ expertise and experience in waste management processIndividual responsibilities for waste management are poorly defined, inadequately communicated and are perceived as irrelevant to operativesEnvironmental barrierAttention by government and private sector on housing deficit than environmental issuesInsufficient environmental awareness of the industryLack of sustainable building education at university levelInadequate training and deficit education for practitioners, operatives and clients on waste reduction practicesLack of awareness on clients about sustainable housingAbsence of healthcare and waste handling training for workersTechnical barrierInsufficient knowledge on how to apply eco-technologiesConstruction waste management cannot be effectively carried out due to limited spacePoor skills in construction practices of on-site operativesSocio-cultural barrier
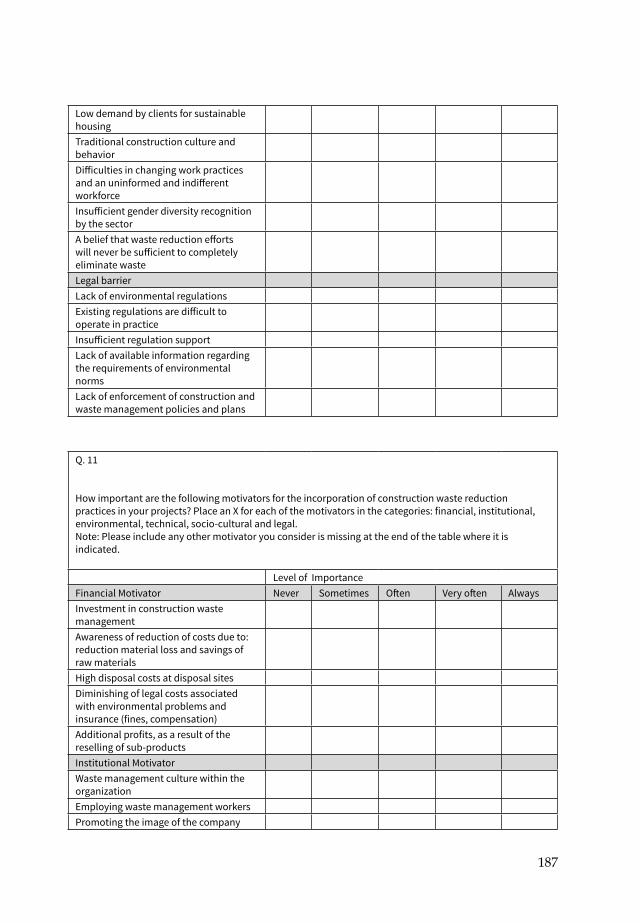
187
Low demand by clients for sustainable housingTraditional construction culture and behavior Difficulties in changing work practices and an uninformed and indifferent workforceInsufficient gender diversity recognition by the sectorA belief that waste reduction efforts will never be sufficient to completely eliminate wasteLegal barrierLack of environmental regulationsExisting regulations are difficult to operate in practiceInsufficient regulation supportLack of available information regarding the requirements of environmental normsLack of enforcement of construction and waste management policies and plans
Q. 11
How important are the following motivators for the incorporation of construction waste reduction practices in your projects? Place an X for each of the motivators in the categories: financial, institutional, environmental, technical, socio-cultural and legal. Note: Please include any other motivator you consider is missing at the end of the table where it is indicated.
Level of ImportanceFinancial Motivator Never Sometimes Often Very often AlwaysInvestment in construction waste managementAwareness of reduction of costs due to: reduction material loss and savings of raw materials High disposal costs at disposal sitesDiminishing of legal costs associated with environmental problems and insurance (fines, compensation)Additional profits, as a result of the reselling of sub-productsInstitutional MotivatorWaste management culture within the organizationEmploying waste management workersPromoting the image of the company
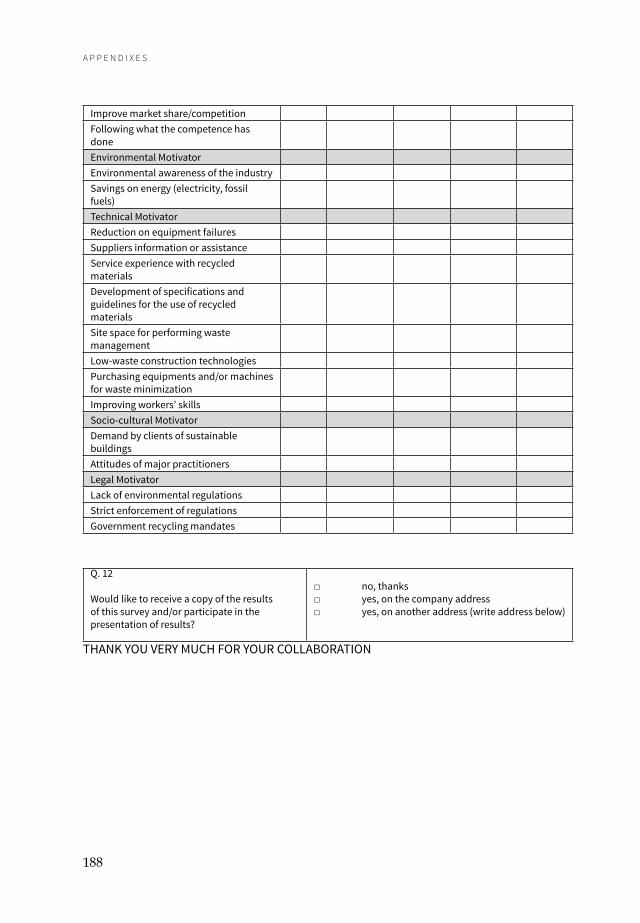
188
A P P E N D I X E S
Improve market share/competitionFollowing what the competence has doneEnvironmental MotivatorEnvironmental awareness of the industrySavings on energy (electricity, fossil fuels)Technical MotivatorReduction on equipment failuresSuppliers information or assistanceService experience with recycled materials Development of specifications and guidelines for the use of recycled materialsSite space for performing waste managementLow-waste construction technologiesPurchasing equipments and/or machines for waste minimizationImproving workers’ skillsSocio-cultural MotivatorDemand by clients of sustainable buildingsAttitudes of major practitionersLegal MotivatorLack of environmental regulations Strict enforcement of regulationsGovernment recycling mandates
Q. 12
Would like to receive a copy of the results of this survey and/or participate in the presentation of results?
□ no, thanks□ yes, on the company address□ yes, on another address (write address below)
THANK YOU VERY MUCH FOR YOUR COLLABORATION
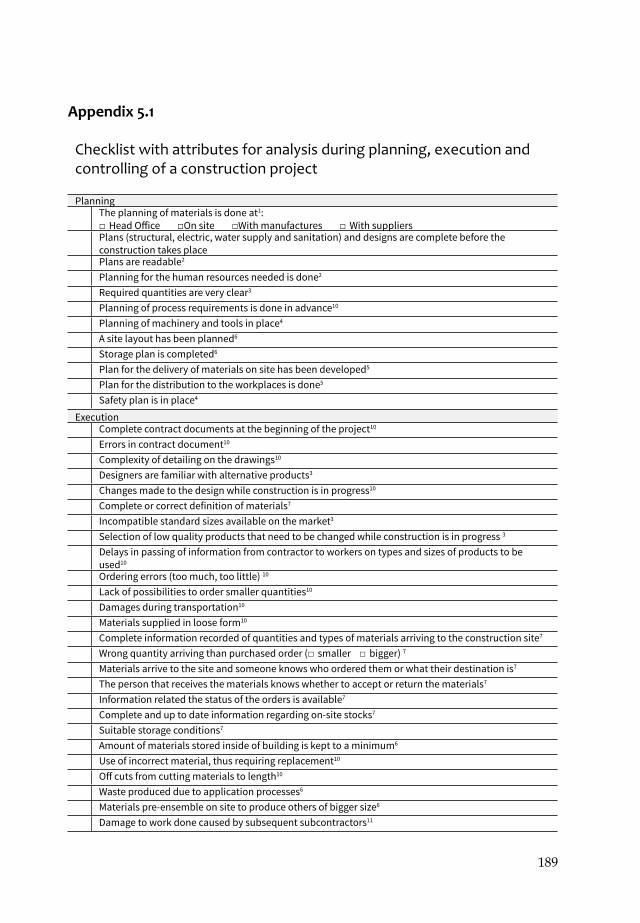
189
Appendix 5.1
Checklist with attributes for analysis during planning, execution and controlling of a construction project
PlanningThe planning of materials is done at1:□ Head Office □On site □With manufactures □ With suppliers Plans (structural, electric, water supply and sanitation) and designs are complete before the construction takes place Plans are readable2
Planning for the human resources needed is done2
Required quantities are very clear3
Planning of process requirements is done in advance10
Planning of machinery and tools in place4
A site layout has been planned6
Storage plan is completed6
Plan for the delivery of materials on site has been developed5
Plan for the distribution to the workplaces is done5
Safety plan is in place4
Execution Complete contract documents at the beginning of the project10
Errors in contract document10
Complexity of detailing on the drawings10
Designers are familiar with alternative products3
Changes made to the design while construction is in progress10
Complete or correct definition of materials7
Incompatible standard sizes available on the market3
Selection of low quality products that need to be changed while construction is in progress 3
Delays in passing of information from contractor to workers on types and sizes of products to be used10
Ordering errors (too much, too little) 10
Lack of possibilities to order smaller quantities10
Damages during transportation10
Materials supplied in loose form10
Complete information recorded of quantities and types of materials arriving to the construction site7
Wrong quantity arriving than purchased order (□ smaller □ bigger) 7
Materials arrive to the site and someone knows who ordered them or what their destination is7
The person that receives the materials knows whether to accept or return the materials7
Information related the status of the orders is available7
Complete and up to date information regarding on-site stocks7
Suitable storage conditions7
Amount of materials stored inside of building is kept to a minimum6
Use of incorrect material, thus requiring replacement10
Off cuts from cutting materials to length10
Waste produced due to application processes6
Materials pre-ensemble on site to produce others of bigger size6
Damage to work done caused by subsequent subcontractors11
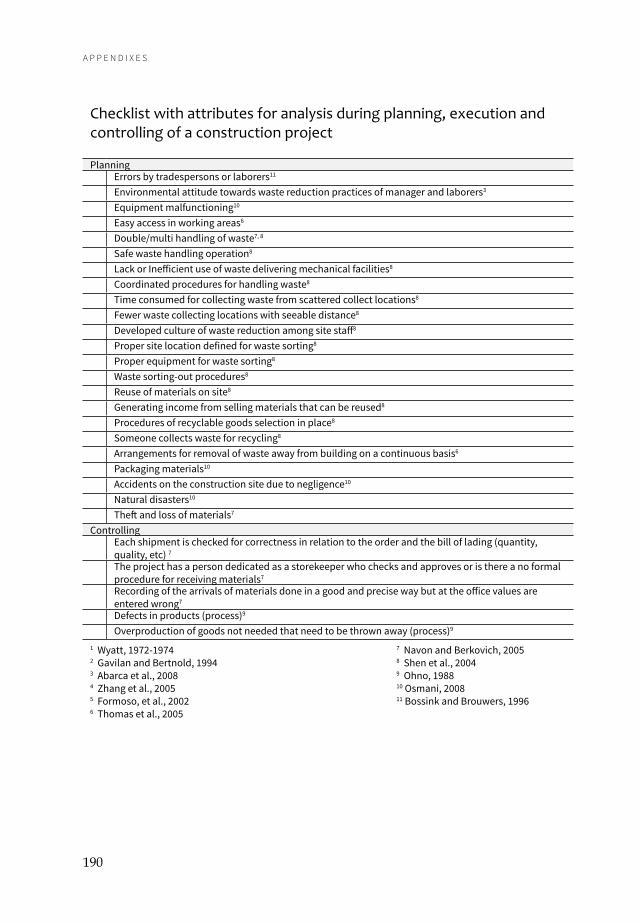
190
A P P E N D I X E S
Checklist with attributes for analysis during planning, execution and controlling of a construction project
PlanningErrors by tradespersons or laborers11
Environmental attitude towards waste reduction practices of manager and laborers3
Equipment malfunctioning10
Easy access in working areas6
Double/multi handling of waste7, 8
Safe waste handling operation8
Lack or Inefficient use of waste delivering mechanical facilities8
Coordinated procedures for handling waste8
Time consumed for collecting waste from scattered collect locations8
Fewer waste collecting locations with seeable distance8
Developed culture of waste reduction among site staff8
Proper site location defined for waste sorting8
Proper equipment for waste sorting8
Waste sorting-out procedures8
Reuse of materials on site8
Generating income from selling materials that can be reused8
Procedures of recyclable goods selection in place8
Someone collects waste for recycling8
Arrangements for removal of waste away from building on a continuous basis6
Packaging materials10
Accidents on the construction site due to negligence10
Natural disasters10
Theft and loss of materials7
Controlling Each shipment is checked for correctness in relation to the order and the bill of lading (quantity, quality, etc) 7
The project has a person dedicated as a storekeeper who checks and approves or is there a no formal procedure for receiving materials7
Recording of the arrivals of materials done in a good and precise way but at the office values are entered wrong7
Defects in products (process)9
Overproduction of goods not needed that need to be thrown away (process)9
1 Wyatt, 1972-19742 Gavilan and Bertnold, 19943 Abarca et al., 20084 Zhang et al., 20055 Formoso, et al., 20026 Thomas et al., 2005
7 Navon and Berkovich, 20058 Shen et al., 20049 Ohno, 198810 Osmani, 200811 Bossink and Brouwers, 1996
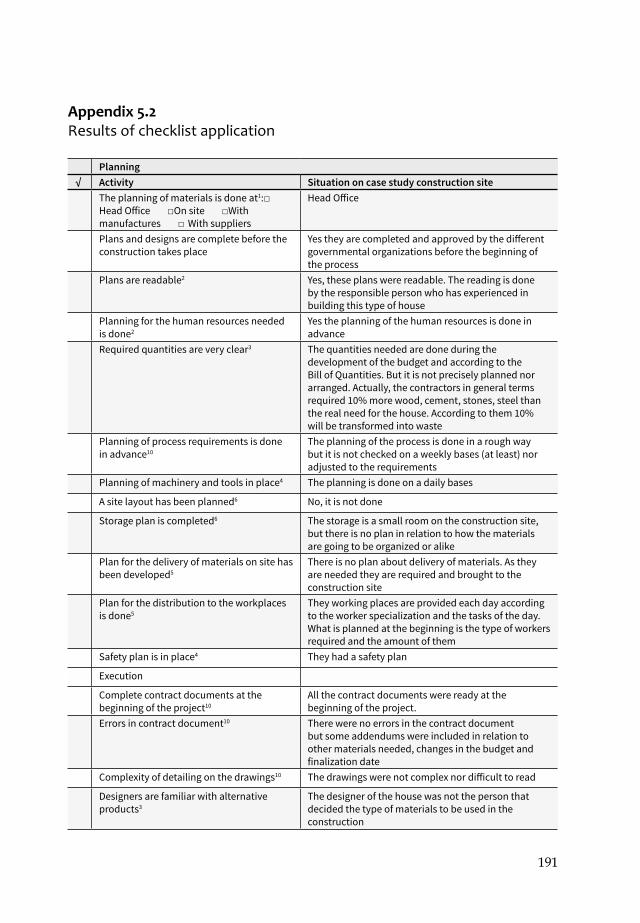
191
Appendix 5.2Results of checklist application
Planning√ Activity Situation on case study construction site
The planning of materials is done at1:□ Head Office □On site □With manufactures □ With suppliers
Head Office
Plans and designs are complete before the construction takes place
Yes they are completed and approved by the different governmental organizations before the beginning of the process
Plans are readable2 Yes, these plans were readable. The reading is done by the responsible person who has experienced in building this type of house
Planning for the human resources needed is done2
Yes the planning of the human resources is done in advance
Required quantities are very clear3 The quantities needed are done during the development of the budget and according to the Bill of Quantities. But it is not precisely planned nor arranged. Actually, the contractors in general terms required 10% more wood, cement, stones, steel than the real need for the house. According to them 10% will be transformed into waste
Planning of process requirements is done in advance10
The planning of the process is done in a rough way but it is not checked on a weekly bases (at least) nor adjusted to the requirements
Planning of machinery and tools in place4 The planning is done on a daily bases
A site layout has been planned6 No, it is not done
Storage plan is completed6 The storage is a small room on the construction site, but there is no plan in relation to how the materials are going to be organized or alike
Plan for the delivery of materials on site has been developed5
There is no plan about delivery of materials. As they are needed they are required and brought to the construction site
Plan for the distribution to the workplaces is done5
They working places are provided each day according to the worker specialization and the tasks of the day. What is planned at the beginning is the type of workers required and the amount of them
Safety plan is in place4 They had a safety plan
Execution
Complete contract documents at the beginning of the project10
All the contract documents were ready at the beginning of the project.
Errors in contract document10 There were no errors in the contract document but some addendums were included in relation to other materials needed, changes in the budget and finalization date
Complexity of detailing on the drawings10 The drawings were not complex nor difficult to read
Designers are familiar with alternative products3
The designer of the house was not the person that decided the type of materials to be used in the construction
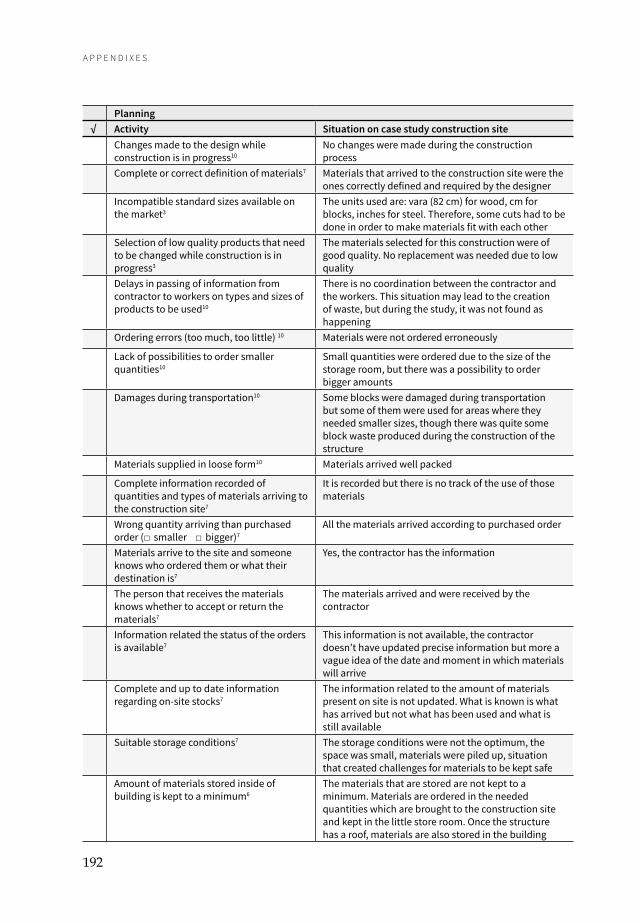
192
A P P E N D I X E S
Planning√ Activity Situation on case study construction site
Changes made to the design while construction is in progress10
No changes were made during the construction process
Complete or correct definition of materials7 Materials that arrived to the construction site were the ones correctly defined and required by the designer
Incompatible standard sizes available on the market3
The units used are: vara (82 cm) for wood, cm for blocks, inches for steel. Therefore, some cuts had to be done in order to make materials fit with each other
Selection of low quality products that need to be changed while construction is in progress3
The materials selected for this construction were of good quality. No replacement was needed due to low quality
Delays in passing of information from contractor to workers on types and sizes of products to be used10
There is no coordination between the contractor and the workers. This situation may lead to the creation of waste, but during the study, it was not found as happening
Ordering errors (too much, too little) 10 Materials were not ordered erroneously
Lack of possibilities to order smaller quantities10
Small quantities were ordered due to the size of the storage room, but there was a possibility to order bigger amounts
Damages during transportation10 Some blocks were damaged during transportation but some of them were used for areas where they needed smaller sizes, though there was quite some block waste produced during the construction of the structure
Materials supplied in loose form10 Materials arrived well packed
Complete information recorded of quantities and types of materials arriving to the construction site7
It is recorded but there is no track of the use of those materials
Wrong quantity arriving than purchased order (□ smaller □ bigger)7
All the materials arrived according to purchased order
Materials arrive to the site and someone knows who ordered them or what their destination is7
Yes, the contractor has the information
The person that receives the materials knows whether to accept or return the materials7
The materials arrived and were received by the contractor
Information related the status of the orders is available7
This information is not available, the contractor doesn’t have updated precise information but more a vague idea of the date and moment in which materials will arrive
Complete and up to date information regarding on-site stocks7
The information related to the amount of materials present on site is not updated. What is known is what has arrived but not what has been used and what is still available
Suitable storage conditions7 The storage conditions were not the optimum, the space was small, materials were piled up, situation that created challenges for materials to be kept safe
Amount of materials stored inside of building is kept to a minimum6
The materials that are stored are not kept to a minimum. Materials are ordered in the needed quantities which are brought to the construction site and kept in the little store room. Once the structure has a roof, materials are also stored in the building
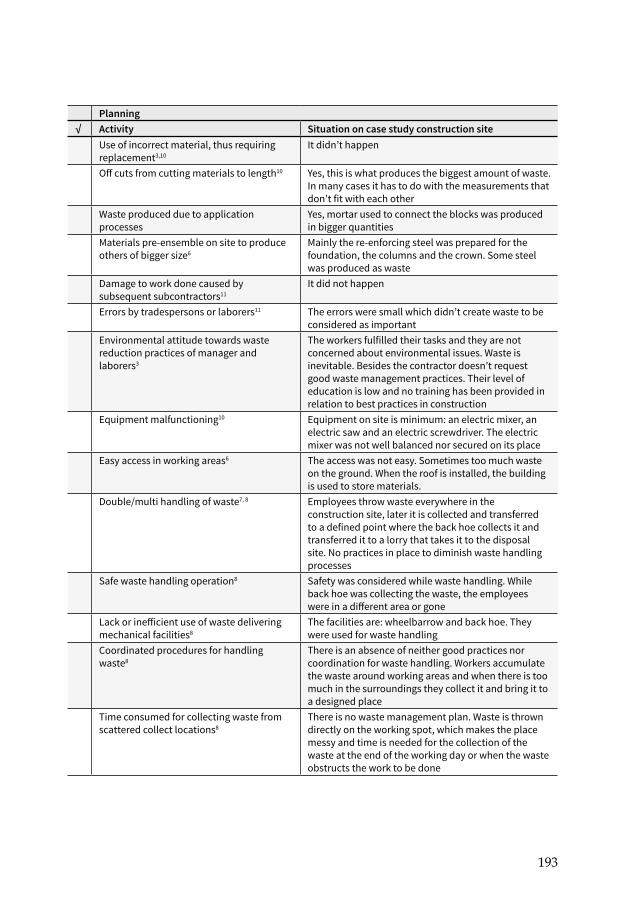
193
Planning√ Activity Situation on case study construction site
Use of incorrect material, thus requiring replacement3,10
It didn’t happen
Off cuts from cutting materials to length10 Yes, this is what produces the biggest amount of waste. In many cases it has to do with the measurements that don’t fit with each other
Waste produced due to application processes
Yes, mortar used to connect the blocks was produced in bigger quantities
Materials pre-ensemble on site to produce others of bigger size6
Mainly the re-enforcing steel was prepared for the foundation, the columns and the crown. Some steel was produced as waste
Damage to work done caused by subsequent subcontractors11
It did not happen
Errors by tradespersons or laborers11 The errors were small which didn’t create waste to be considered as important
Environmental attitude towards waste reduction practices of manager and laborers3
The workers fulfilled their tasks and they are not concerned about environmental issues. Waste is inevitable. Besides the contractor doesn’t request good waste management practices. Their level of education is low and no training has been provided in relation to best practices in construction
Equipment malfunctioning10 Equipment on site is minimum: an electric mixer, an electric saw and an electric screwdriver. The electric mixer was not well balanced nor secured on its place
Easy access in working areas6 The access was not easy. Sometimes too much waste on the ground. When the roof is installed, the building is used to store materials.
Double/multi handling of waste7, 8 Employees throw waste everywhere in the construction site, later it is collected and transferred to a defined point where the back hoe collects it and transferred it to a lorry that takes it to the disposal site. No practices in place to diminish waste handling processes
Safe waste handling operation8 Safety was considered while waste handling. While back hoe was collecting the waste, the employees were in a different area or gone
Lack or inefficient use of waste delivering mechanical facilities8
The facilities are: wheelbarrow and back hoe. They were used for waste handling
Coordinated procedures for handling waste8
There is an absence of neither good practices nor coordination for waste handling. Workers accumulate the waste around working areas and when there is too much in the surroundings they collect it and bring it to a designed place
Time consumed for collecting waste from scattered collect locations8
There is no waste management plan. Waste is thrown directly on the working spot, which makes the place messy and time is needed for the collection of the waste at the end of the working day or when the waste obstructs the work to be done
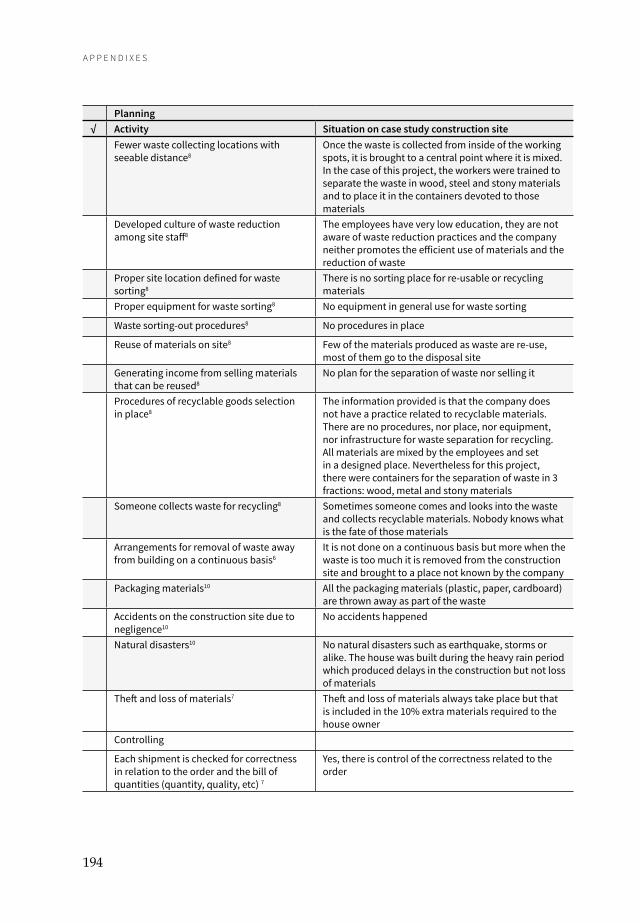
194
A P P E N D I X E S
Planning√ Activity Situation on case study construction site
Fewer waste collecting locations with seeable distance8
Once the waste is collected from inside of the working spots, it is brought to a central point where it is mixed. In the case of this project, the workers were trained to separate the waste in wood, steel and stony materials and to place it in the containers devoted to those materials
Developed culture of waste reduction among site staff8
The employees have very low education, they are not aware of waste reduction practices and the company neither promotes the efficient use of materials and the reduction of waste
Proper site location defined for waste sorting8
There is no sorting place for re-usable or recycling materials
Proper equipment for waste sorting8 No equipment in general use for waste sorting
Waste sorting-out procedures8 No procedures in place
Reuse of materials on site8 Few of the materials produced as waste are re-use, most of them go to the disposal site
Generating income from selling materials that can be reused8
No plan for the separation of waste nor selling it
Procedures of recyclable goods selection in place8
The information provided is that the company does not have a practice related to recyclable materials. There are no procedures, nor place, nor equipment, nor infrastructure for waste separation for recycling. All materials are mixed by the employees and set in a designed place. Nevertheless for this project, there were containers for the separation of waste in 3 fractions: wood, metal and stony materials
Someone collects waste for recycling8 Sometimes someone comes and looks into the waste and collects recyclable materials. Nobody knows what is the fate of those materials
Arrangements for removal of waste away from building on a continuous basis6
It is not done on a continuous basis but more when the waste is too much it is removed from the construction site and brought to a place not known by the company
Packaging materials10 All the packaging materials (plastic, paper, cardboard) are thrown away as part of the waste
Accidents on the construction site due to negligence10
No accidents happened
Natural disasters10 No natural disasters such as earthquake, storms or alike. The house was built during the heavy rain period which produced delays in the construction but not loss of materials
Theft and loss of materials7 Theft and loss of materials always take place but that is included in the 10% extra materials required to the house owner
Controlling
Each shipment is checked for correctness in relation to the order and the bill of quantities (quantity, quality, etc) 7
Yes, there is control of the correctness related to the order
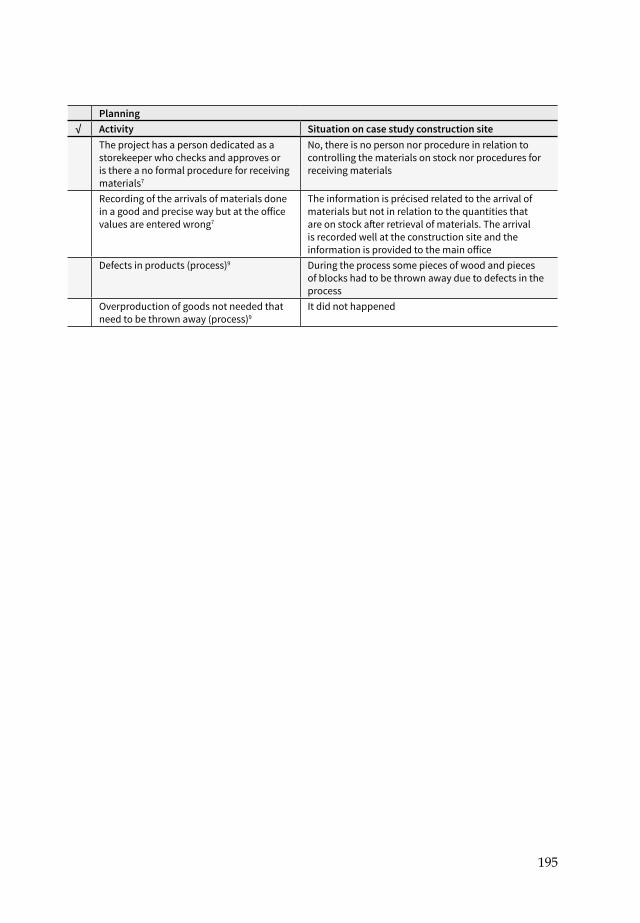
195
Planning√ Activity Situation on case study construction site
The project has a person dedicated as a storekeeper who checks and approves or is there a no formal procedure for receiving materials7
No, there is no person nor procedure in relation to controlling the materials on stock nor procedures for receiving materials
Recording of the arrivals of materials done in a good and precise way but at the office values are entered wrong7
The information is précised related to the arrival of materials but not in relation to the quantities that are on stock after retrieval of materials. The arrival is recorded well at the construction site and the information is provided to the main office
Defects in products (process)9 During the process some pieces of wood and pieces of blocks had to be thrown away due to defects in the process
Overproduction of goods not needed that need to be thrown away (process)9
It did not happened
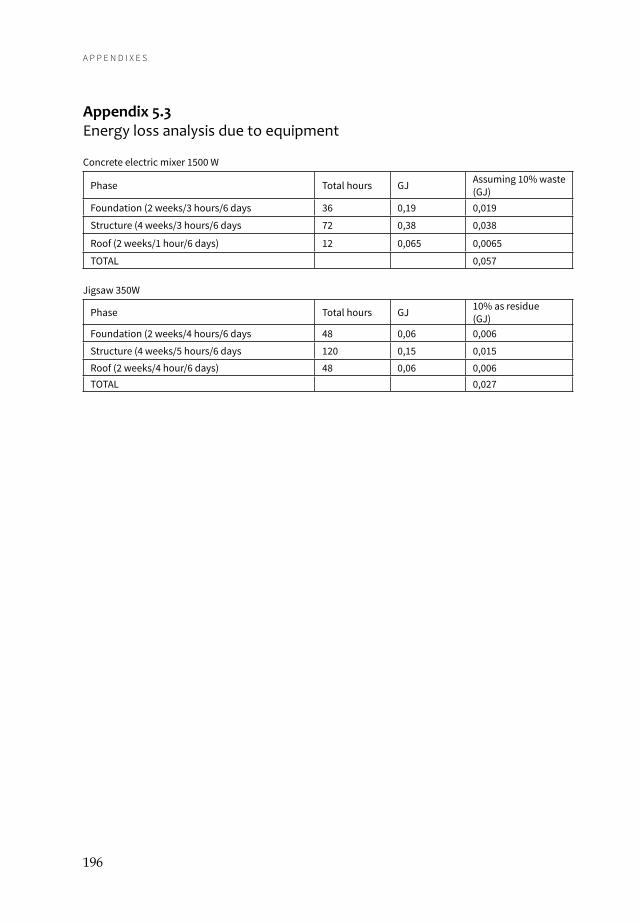
196
A P P E N D I X E S
Appendix 5.3Energy loss analysis due to equipment
Concrete electric mixer 1500 W
Phase Total hours GJ Assuming 10% waste (GJ)
Foundation (2 weeks/3 hours/6 days 36 0,19 0,019
Structure (4 weeks/3 hours/6 days 72 0,38 0,038
Roof (2 weeks/1 hour/6 days) 12 0,065 0,0065
TOTAL 0,057
Jigsaw 350W
Phase Total hours GJ 10% as residue(GJ)
Foundation (2 weeks/4 hours/6 days 48 0,06 0,006
Structure (4 weeks/5 hours/6 days 120 0,15 0,015
Roof (2 weeks/4 hour/6 days) 48 0,06 0,006TOTAL 0,027

Appendix 6.1Complete construction waste generationmodel
Design &Construction
Process“black box”
Barriers &motivators
Design &management
Materials
Energy
LaborResidual energy
Product
Residual products
Barriers & motivators
Financial/economic
Socio-cultural
Institutional
• Lack of a well-developed waste recycling market• Reluctance to conduct construction waste management due to intense competitiveness with the result of higher
project costs• Contractors lacking economic penalizing methods for waste management• Perception that waste reduction activities are not cost-effective, efficient, practical or compatible with core construc-
tion activities• Reluctance to recycle or reuse materials with a low economic value or difficult to reuse• Financial benefits from waste reduction are inequitably distributed, providing little incentive for operatives• Construction price does not reflect the environmental cost• First priority is financial profit and not environmental issues• Emphasis on investment cost, not on low cost on long term
• Inconsistencies between different governmental agencies• Lack of coordination among divisions• Waste reduction does not receive sufficient attention in building planning and design• Unavailable waste management procedures• Lack of managerial commitment and support for the issue of waste• Absence of an industry norms or performance standard for managing waste• Lack of integration of operatives’ expertise and experience in waste management process• Individual responsibilities for waste management are poorly defined, inadequately communicated and are perceived
as irrelevant to operatives• Lack of time to develop plans for waste reduction• The building users do not participate in the planning and design process
Institutional • Waste management culture within the organization• Employing waste management workers• Promoting the image of the company• Improve market share/competition• Following what the competence has done
Environmental• Lack of sustainable building education at university level• Inadequate training and deficient education for practitioners and operatives on waste reduction practices• Lack of awareness on clients about sustainable housing• Attention by government and private sector on housing deficit than on environmental issues• Absence of healthcare and waste handling training for workers• Insufficient environmental awareness by the industry
Environmental • Environmental awareness of the industry• Savings on energy (electricity, fossil fuels)
Technical• Insufficient knowledge on how to implement eco-technologies• Construction waste management cannot be effectively carried out due to limited space• Poor skills in construction practices of on-site operatives• Low demand by clients for sustainable buildings• Traditional construction culture and behavior• Difficulties in changing work practices and an uninformed and indifferent workforce• Insufficient gender diversity recognition by the sector• A belief that waste reduction efforts will never be sufficient to completely eliminate waste
Legal/policy• Insufficient regulation support• Existing regulations are difficult to operate in practice• Lack of enforcement of construction and waste management policies and plans• Lack of environmental regulations• Lack of available information regarding the requirements of environmental norms
Socio-cultural
Technical
• Attitudes of major practitioners• Demand by clients of sustainable buildings
Legal/policy • Government recycling mandates• Government environmental regulation• Government environmental enforcement
Aspect Barrier
Financial/economic
• High disposal costs at disposal sites• Investment in construction waste management• Awareness of reduction of costs due to: reduction material loss and savings of raw materials• Diminishing of legal costs associated with environmental problems and insurance (fines, compensation)• Additional profits, as a result of the reselling of sub-products
Aspect Motivator
• Service experience with recycled materials • Development of specifications and guidelines for the use of recycled materials• Site space for performing waste management• Low-waste construction technologies• Purchasing equipments and/or machines for waste minimization• Improving workers’ skills• Reduction on equipment failures• Suppliers (e.g. information or assistance)
Design • Incompatible market starndar sizes• Lack of attention paid to dimensional coordination of products• Design changes while construction is in progress• Lack of knowledge about standard sizes available in market• Designers’ unfamiliarity with alternative products• Complexity of detailing in drawings• Lack of information in drawings• Selection of low-quality products
Construction process
• Ordering errors (too much or too little) • Use of incorrect material, thus requiring replacement• Lack of possibility to order small quantities• Purchases not complying with specifications• Design changes while construction is in progress
Operation • Use of incorrect material, thus requiring replacement • Damage to work done due to subsequent trades• Required quantity unclear due to improper planning• Delays in providing information to contractors regarding types and sizes of products to be used• Accidents due to negligence• Errors by trades persons or labourers• Malfunctioning of equipment
Residues • Residues due to construction process• Packaging materials• Pre-exiting demolition
Other activities
• Theft • Lack of material control on site• Lack of waste management plan• Natural disasters• Inclement weather
Materialmanagement
• Materials supplied loose• Damages while transporting• Inappropriate site storage• Unfriendly attitudes of project team and workers• Lack of environmental awareness of employees on site • Lack of technical direction for workers on site
Design & management

198
199
Summary
A construction waste generation model for developing countries
Increasing population levels, booming economy, rapid urbanization and the rise in community living standards have greatly accelerated the municipal solid waste generation. In developing countries, solid waste management systems have failed, firstly, for the lack of real stakeholder involvement in decision making and planning processes. Secondly, for the lack of understanding of the factors that influences the waste management system.
The 20th century witnessed unparalleled increase in construction investments such as housing projects. Worldwide the construction and operation of the built environ-ment is estimated to account for high quantities of waste, giving as a result materials and energy losses that can impact the resource availability to future generations and environmental loadings. This situation has made the industry look for new solu-tions. One of these is the pursuit for ecology-friendly environments, encompassing waste reduction strategies which require a detailed understanding of construction waste generation causes.
Developing countries lack reliable and sufficient data for the development of solid waste management systems. Cities are characterized by poor information, inade-quate and inaccurate data and difficulties to obtain real figures on their waste sit-uation with the purpose of, determining the factors that influence the performance of the system. This doctoral dissertation therefore examines the following central research question: How can waste management systems for municipal solid waste and construction waste be improved?
This dissertation builds upon two models: the Integrated Sustainable Waste Manage-ment Model (ISWM) and Construction Waste Generation Model. The ISWM model helps to uncover important stakeholders and the interrelation of factors that can affect the performance of waste management systems. But municipal waste manage-ment practices also influence the management of construction waste. A Construc-tion Waste Generation model is created with the goal to find factors influencing con-struction waste generation during the realization of a building. Under the proposed general frameworks for modeling municipal waste and construction practices, most emphasis is put on exploring, extending and validating both models.
Literature provides a variety of factors influencing solid waste management sys-tems. In addition, the author of this thesis has collected data during visits made to thirty six sites, in some cases on more than one occasion, in twenty two developing countries in three continents from the period 1985-2011. Both sources of information
200
are considered to make available, enough evidence of influencing factors affecting solid waste management systems in developing countries. Chapter 2 introduces the model that facilitates the analysis of that information. Firstly, the empirical study takes as a starting point the analysis of the stakeholders present in the cities. Second-ly, the existing elements of municipal waste management systems are described in terms of waste generation and separation, collection, transfer and transport, treat-ment and final disposal including recycling activities. Thirdly, the enabling environ-ment is analyzed around technical, environmental, financial, socio-cultural, institu-tional and legal aspects. Chapter 2 contributes to the state-of-the-art research in solid waste management by an extended ISWM model allows a better understanding of who the stakeholders are and the influential factors affecting the performance of municipal solid waste management systems. Additionally, a knowledge-based data base is created with a complex set of parameters that contains information from those thirty six sites.
The findings suggest that municipal waste management systems affect construction waste management. Disposal sites visited by the author of this thesis, in developing countries, show a high percentage of construction waste arriving to those places. Chapter 3 develops a construction waste generation physical model, based on In-dustrial Metabolism ideas, allowing the analysis of the interchange of physical flows (materials and energy) with the environment. It uses Material Flow Analysis as an appropriate tool to follow materials from consumption to final disposal, delivering a complete and consistent set of information, including flows and stocks of particu-lar materials, flow of wastes and identification of its sources. But the Material Flow Analysis approach presents some limitations. One is that measuring just flows is insufficient to understand the processes that take place. In order to overcome the limitation, the physical model is extended, with the support of the Structured Anal-ysis and Design Technique (SADT) permitting to understand and describe the con-struction process. Chapter 3 therefore contributes to the state-of-the-art research in construction waste management by the development of the model that allows deter-mining new insights into the complexity of the realization of a building and factors that affect the process influencing construction waste generation. Furthermore, it extends the use of SADT techniques to bring Material Flow Analysis into construc-tion waste management research.
The construction waste generation model is composed of eight modeling units. The units for the assessment of the flows are: materials, energy; residual products; resid-ual energy and product or building. The elements for the analysis of the construction process are: barriers and motivators for environmental building practices; design and management and labor. The appropriateness of the model is tested in Costa Rica. This study provides an in-depth understanding of the impact of design and management practices that influence construction waste generation. Furthermore, it reports the barriers the sector is facing in order to be more efficient, but also which
201
motivators can be used to accelerate the process. The model also helps to determine materials and energy used for the procurement of buildings as well as waste gen-eration and residual energy loss due to inefficiencies in the process. The education of the working construction force in the Costa Rican setting is also explored. The construction waste generation causes, called in this thesis attributes, are aggregated under the following: design, construction process, material management, operation, residuals and others. During the data collection on construction waste generation causes, it is determined that various sources of waste generation have a different effect on the system. This study adds to an exiting knowledge on construction waste and it widens the understanding of construction waste sources and their degree of significance. The construction waste generation model has been applied in Costa Rica but can be used in other developing countries as a means to study construction waste generation.
A case study is executed with the goal to check, in a real situation, the perceptions provided by construction companies in relation to the units that correspond to flows of materials and design and management practices. A semi-detached houses project in Costa Rica is chosen to achieve the proposed goal. Chapter 4 reports on the find-ings by the use of some tools prepared for the analysis. It is found that the applica-tion of the tools provides enough information to determine materials going into the process and out as waste. Weighing the residuals makes available data about the process efficiency in relation to the use of materials and the generation of construc-tion waste. The checklist prepared, based on literature and Project Management ide-as, facilitates the identification of on-site construction practices. Moreover, it guides the interviews with the construction manager and the on-site workers. The Free flow mapping tool is convenient for tracing waste from the generation point to the fi-nal disposal. It proves to be a guide for on-site workers on controlling procedures for improved construction waste management. Overall, the main contributions of Chapter 5 are the tools developed for the analysis of construction on-site practices and the use of project management ideas into waste management practices.
Finally, chapter 6 discusses the findings and “practical” implications of the studies described in previous chapters of this dissertation. A general conclusion of this the-sis is that municipal solid waste and construction waste management is complex due to the large of number of influencing factors. Understanding the causes of the inefficiencies and the application of remedies can improve the performance.

202
203
Resumen
Un modelo de generación de residuos de la construcción para países en desarrollo
El aumento de población, economías en auge, la rápida urbanización y el aumento de los niveles de vida de la comunidad han acelerado, en gran medida la generación de residuos sólidos urbanos. En los países en desarrollo, los sistemas de gestión de residuos sólidos han fallado, en primer lugar, por la falta de participación de la población en los procesos de toma de decisiones y planeamiento. En segundo lugar, por la falta de comprensión de los factores que influyen en el sistema de gestión de residuos.
El siglo 20 fue testigo de un aumento sin precedentes en las inversiones en construc-ción incluyendo proyectos habitacionales. Se ha estimado que la construcción y su mantenimiento generan grandes cantidades de residuos, resultando en pérdidas de materiales y energía que afectan al ambiente y la disponibilidad de recursos para las generaciones futuras. Esta situación ha hecho que el sector de la construcción busque actividades ecológicamente más amistosas, que consideren estrategias de reducción de residuos, requiriendo por lo tanto, conocimientos detallados de las causas de generación de residuos durante el proceso de construcción.
Los países en desarrollo carecen de datos fiables y suficientes para el desarrollo de sistemas de gestión de residuos sólidos. Las ciudades se caracterizan por la falta de información, datos inexactos e insuficientes y dificultades para obtener cifras reales sobre la situación de los residuos con el fin de, determinar los factores que influyen en la eficiencia del sistema. Por tanto, esta investigación plantea como pregunta cen-tral: ¿Cómo se pueden mejorar los sistemas de gestión de residuos municipales y de la construcción?
Para contestar esta pregunta, la investigación realizada utiliza dos modelos. El pri-mero es “Gestión integrada de residuos sólidos” (GIRS) y el segundo “Generación de residuos de la construcción”. El modelo GIRS asiste en la determinación de las y los actores importantes en los sistemas de gestión de residuos, así como la interrelación de factores que afectan el buen desempeño de dichos sistemas. Pero las prácticas de gestión de residuos municipales también influyen en la gestión de los residuos de la construcción. El modelo de Generación de Residuos de la Construcción se elabora con el objetivo de descubrir los factores que influyen en la generación de residuos de la construcción durante la realización de un edificio. En este marco conceptual donde se modelan las prácticas de generación de residuos municipales y de la cons-trucción, el énfasis se centra en explorar, ampliar y validar los modelos utilizados.
204
La literatura proporciona una variedad de factores que influyen en los sistemas de gestión de residuos sólidos. Adicionalmente, la autora de esta tesis ha recogido da-tos de treinta y seis lugares, visitados en algunas ocasiones más de una vez, en vein-tidós países en desarrollo, de tres continentes durante el periodo 1985-2011. Ambas fuentes de información proporcionan suficiente evidencia sobre los factores que afectan a los sistemas de gestión de residuos sólidos en los países en desarrollo. En el Capítulo 2 se presenta el modelo que facilita el análisis de dicha información. En primer lugar, el estudio empírico toma como punto de partida el análisis de las y los actores presentes en las ciudades. En segundo lugar, los elementos existentes de los sistemas municipales de gestión de residuos se describen en términos de la genera-ción y separación de residuos, recolección, transferencia y transporte, tratamiento y disposición final, incluyendo las actividades de reciclaje. En tercer lugar, el entorno se analiza en términos de aspectos técnicos, ambientales, financieros, sociocultura-les, institucionales y legales. El Capítulo 2 contribuye al conocimiento suministran-do un modelo GIRS ampliado que permite una mejor comprensión de quiénes son las partes interesadas y los factores que influyen el desempeño de los sistemas de gestión de residuos sólidos municipales. Además, suministra una base de datos con un complejo conjunto de parámetros que contiene la información de esos treinta y seis sitios.
Producto de la investigación, se determina que los sistemas de gestión de residuos municipales afectan la gestión de residuos de la construcción. Sitios de disposición final de residuos visitados por la autora de esta tesis, muestran el alto porcentaje de residuos de la construcción que llegan a esos lugares. El Capítulo 3 desarrolla un modelo físico de generación de residuos de la construcción, basado en ideas de Metabolismo Industrial. Este modelo permite el análisis del intercambio de flujos físicos (materiales y energía) con el medio ambiente. Utiliza el Análisis de Flujo de Materiales (MFA) como herramienta adecuada para analizar los materiales desde el consumo hasta su disposición final. El uso de MFA suministra información mediante un conjunto completo y coherente de flujos y reservas de determinados materiales, flujo de desechos y la identificación de las fuentes de generación de residuos. Pero el enfoque de análisis de flujo de materiales presenta algunas limitaciones. Una de ellas es que medir solamente los flujos de materiales y energía no es suficiente para comprender los procesos que se llevan a cabo. Con el fin de superar la limitación, el modelo físico se expande, con el apoyo del Sistema de Análisis Estructurado y Diseño Técnico (SADT) que permite comprender y describir el proceso de la cons-trucción. El Capítulo 3, por lo tanto, contribuye al estado del arte en investigación de la gestión de residuos de la construcción, mediante el desarrollo del modelo que permite determinar nuevos conocimientos sobre la complejidad presente durante la realización de un edificio y los factores que influyen en la generación de residuos de la construcción. Además, amplía el uso de técnicas SADT al conectar investigaciones en MFA e investigación en gestión de desechos.
205
El modelo de generación de residuos de la construcción se compone de ocho unida-des. Las unidades para la evaluación de los flujos son: materiales, energía, productos residuales, energía residual y producto o edificio. Los elementos para el análisis del proceso de construcción son: barreras y motivadores para prácticas amigables con el ambiente, el diseño y la gestión del proceso y empleo. La validez del modelo se prueba en Costa Rica. Esta tesis proporciona una comprensión detallada del impacto de las prácticas de diseño y de gestión que influyen en la generación de residuos de la construcción. Además, se reportan las barreras que enfrenta el sector para ser más eficiente, pero también se presentan los motivadores que se pueden utilizar para acelerar el proceso. El modelo también ayuda a determinar los materiales y la energía utilizada para la construcción de edificios, así como la generación de resi-duos y la pérdida de energía debido a ineficiencias en el proceso. La educación de la fuerza de trabajo de la construcción se explora utilizando la situación presente en Costa Rica. Las causas de generación de residuos de la construcción se organizan alrededor de los siguientes temas: diseño, proceso de construcción, gestión de ma-teriales, operación, residuos y otros. Durante la recolección de datos, se determinó que las distintas fuentes de generación de residuos tienen un efecto diferente en el sistema. Este estudio provee nuevos conocimientos sobre las fuentes de desechos de construcción y su grado de importancia. El modelo de generación de residuos de la construcción se ha aplicado en Costa Rica, pero puede ser utilizado en otros países en desarrollo como un medio para estudiar la generación de residuos de la construcción.
Adicionalmente, se realizó un estudio de la construcción de un proyecto habitacio-nal. El objetivo fue comprobar, en una situación real, las percepciones suministradas por empresas de construcción que participaron durante la investigación. El caso de estudio permitió analizar dos unidades del modelo de generación de desechos de la construcción, correspondientes a los flujos de materiales y prácticas de diseño y de gestión. El Capítulo 4 reporta los resultados obtenidos. Algunas herramientas fue-ron preparadas para el análisis. Se determinó que la aplicación de las herramientas proporciona suficiente información para determinar los materiales que entran en el proceso y salen como residuos. Determinar la masa de los residuos permite obte-ner información sobre la eficiencia del proceso empleado. La lista de comprobación, construida con ideas de Gestión de Proyectos, facilita la identificación de las prác-ticas utilizadas en el sitio de la construcción. Adicionalmente, es una herramienta que sirve para orientar las entrevistas con el maestro de obras y los trabajadores del sitio. La herramienta de mapeo de flujo es conveniente para el rastreo de los residuos desde el punto de generación hasta la disposición final. Esa herramienta es útil para orientar a los trabajadores sobre cómo mejorar la gestión de residuos en el sitio de la construcción. En general, los aportes más importantes de este capítulo son las herra-mientas desarrolladas para el análisis las prácticas de la construcción y el uso de las ideas de gestión de proyectos en prácticas de gestión de residuos.
206
Finalmente, el capítulo 6 analiza los resultados y las consecuencias “prácticas” de los estudios descritos en los capítulos anteriores. Una conclusión general de esta tesis es que la gestión de los residuos municipales y los residuos de la construcción es compleja debido al gran número de factores que los influyen. La comprensión de las causas de las ineficiencias y la aplicación de correcciones pueden mejorar el rendimiento de los procesos.
207
Samenvatting
Een model voor beschrijven van het genereren van bouwafval voor ontwikkelingslanden
Toenemende bevolking, groeiende economie, snelle verstedelijking en de stijging van de levensstandaard van de maatschappij hebben in belangrijke mate bijgedragen aan het genereren van stedelijk vast afval. In ontwikkelingslanden zijn beheersyste-men voor vast afval mislukt, ten eerste door het gebrek aan echte betrokkenheid van de belanghebbenden bij de processen van besluitvorming en planning. Ten tweede door het gebrek aan inzicht in de factoren die het afvalbeheersysteem beïnvloeden.
De 20e eeuw was getuige van een ongekende stijging van investeringen in de bouw zoals woningbouwprojecten. Er wordt geschat dat wereldwijd de bouw en de ex-ploitatie daarvan grote hoeveelheden afval genereren, hetgeen resulteert in ver-liezen van materiaal en energie die een impact hebben op de beschikbaarheid van middelen voor de toekomstige generaties en op het milieu. Deze situatie heeft de bouwsector doen zoeken naar nieuwe oplossingen. Eén daarvan is het streven naar milieuvriendelijke activiteiten die strategieën omvatten om afval te verminderen en die derhalve een gedetailleerde kennis vereisen van de oorzaken van het ontstaan van bouwafval.
Het ontbreekt ontwikkelingslanden aan voldoende en betrouwbare gegevens voor de ontwikkeling van beheersystemen voor vast afval. Steden worden gekenmerkt door gebrek aan informatie, onjuiste en onvoldoende gegevens en moeilijkheden om echte cijfermateriaal te verkrijgen over hun afvalsituatie met het doel de factoren te kunnen bepalen die de kwaliteit van het systeem beïnvloeden. Dit proefschrift onderzoekt derhalve de volgende centrale onderzoeksvraag: Hoe kunnen beheersyste-men voor vast stedelijk afval en bouwafval verbeterd worden?
Dit proefschrift gaat uit van twee modellen: het Integrated Sustainable Waste Ma-nagement Model (ISWM), een model voor geïntegreerd, duurzaam afvalbeheer. Dit model helpt de belangrijke deelnemers en het samenspel van factoren te bepalen die de kwaliteit van de afvalbeheersystemen beïnvloeden. Maar de praktijken van gemeentelijk afvalbeheer beïnvloeden ook het beheer van bouwafval. Er is daarom een Construction Waste Generation Model ontworpen met het doel de factoren te ontdekken die het genereren van bouwafval beïnvloeden tijdens de uitvoering van de bouw. Binnen de algemene conceptuele kaders voor het modelleren van gemeen-telijk afval en van de bouwpraktijk, wordt de meeste nadruk gelegd op het verken-nen, uitbreiden en valideren van beide modellen.
208
De literatuur biedt een verscheidenheid aan factoren die de beheersystemen van vast afval beïnvloeden. Daarnaast heeft de auteur van dit proefschrift gegevens verzameld tijdens bezoeken aan zesendertig sites, in sommige gevallen meer dan eens, in tweeëntwintig ontwikkelingslanden in drie continenten, in de periode 1985 - 2011. Beide bronnen van informatie kunnen voldoende bewijs leveren van factoren die vast-afvalbeheersystemen in ontwikkelingslanden beïnvloeden. Hoofdstuk 2 in-troduceert het model dat de analyse van die informatie vergemakkelijkt. Ten eerste neemt de empirische studie de analyse van de belanghebbenden in de steden als uitgangspunt. Ten tweede worden de bestaande elementen van de gemeentelijke af-valbeheersystemen beschreven in termen van genereren en scheiden van afval, inza-meling, vervoer en transport, behandeling en definitieve verwijdering, met inbegrip van recycling-activiteiten. Ten derde wordt de omgeving geanalyseerd in termen van van technische, milieu, financiële, sociaal-culturele, institutionele en juridische aspecten. Hoofdstuk 2 draagt bij aan het onderzoek naar het beheer van vaste afval-stoffen door middel van een uitgebreid ISWM-model waardoor het mogelijk is beter te begrijpen wie de belanghebbenden zijn en wat de factoren zijn die de beheersys-temen voor stedelijk vast afval beïnvloeden. Bovendien is een op kennis gebaseerde databank gemaakt met een complex van parameters die informatie bevatten van die zesendertig sites.
De bevindingen suggereren dat gemeentelijke afvalbeheersystemen van invloed zijn op het beheer van bouwafval. De stortplaatsen in ontwikkelingslanden die bezocht werden door de auteur van dit proefschrift, laten zien dat een hoog percentage van bouwafval daar terecht komt. Hoofdstuk 3 ontwikkelt een fysiek model van het ge-nereren van bouwafval, gebaseerd op ideeën van Industrieel Metabolisme, hiermee kan de analyse gemaakt worden van de uitwisseling van fysieke stromen (materia-len en energie) met het milieu. Het model maakt gebruik van een Material Flow Ana-lysis (MFA), een analyse van de stroom van materialen, als een geschikt instrument om materialen te volgen van consumptie tot de uiteindelijke verwijdering. De MFA geeft een alomvattend en samenhangend informatiepakket betreffende stromen en voorraden van bepaalde materialen, afvalstromen en de identificatie van de bron-nen daarvan. Maar de MFA heeft een aantal beperkingen. Een daarvan is dat alleen de stromen meten onvoldoende is om de processen die plaatsvinden te begrijpen. Om deze beperking te omzeilen wordt het fysieke model uitgebreid met behulp van de Structured Analysis and Design Technique (SADT) waardoor het mogelijk wordt de bouwprocessen te begrijpen en beschrijven. Hoofdstuk 3 draagt derhalve bij aan de stand van het onderzoek van bouwafvalbeheer door de ontwikkeling van dit model dat het mogelijk maakt nieuwe inzichten te bepalen in de complexiteit van de realisatie van een gebouw en in de factoren die van invloed zijn op het genereren van bouwafval. Bovendien wordt het gebruik van SADT uitgebreid om Material Flow Analysis onder te brengen bij het onderzoek naar bouwafvalbeheer.
209
Het model van het genereren van bouwafval bestaat uit acht eenheden. Deze een-heden voor de evaluatie van de stromen zijn: materialen, energie, restproducten, restenergie en product of gebouw. Andere stimulansen en obstakels voor milieu-vriendelijke bouwpraktijk zitten in ontwerp en procesbeheer en arbeid. De geldig-heid van het model is getest in Costa Rica. Dit proefschrift verschaft een diepgaand inzicht in de effecten van het ontwerp en de beheersmaatregelen die het genereren van bouwafval beïnvloeden. Voorts worden de obstakels gemeld waarmee de sec-tor wordt geconfronteerd om efficiënter te kunnen werken, maar ook welke moge-lijkheden gebruikt kunnen worden om het proces te versnellen. Het model helpt ook om materialen en energie te bepalen die gebruikt worden voor de bouw van gebouwen en het genereren van afval het het verlies van restenergie als gevolg van inefficiënties in het proces. De opleiding van mensen die in de bouw werken in Costa Rica wordt ook onderzocht. De oorzaken van het genereren van bouwafval, in dit proefschrift attributen genoemd, worden in de volgende thema’s ondergebracht: ontwerp, bouwproces, materiaalbeheer, exploitatie, residuen e.a. Tijdens het verza-melen van gegevens over de oorzaken van het genereren van bouwafval, wordt vastgesteld dat verschillende bronnen van het genereren van afval verschillende effecten hebben op het systeem. Deze studie draagt bij aan bestaande kennis over bouwafval en verbreedt de kennis van de bronnen van bouwafval en de mate van hun belang. Het bouwafval-model is toegepast in Costa Rica maar kan ook gebruikt worden in andere ontwikkelingslanden als manier om het genereren van bouwafval te bestuderen.
Een case-study is uitgevoerd met het doel om in een reële situatie de inzichten te tes-ten die bouwbedrijven hebben geleverd in relatie tot de eenheden die overeenkomen met de stromen van materialen en ontwerp- en beheerspraktijken. Een project van semi-vrijstaande huizen is gekozen om het voorgestelde doel te bereiken. Hoofd-stuk 4 beschrijft de verkregen resultaten d.m.v. speciaal voor de analyse gemaakte instrumenten. Het is gebleken dat de toepassing van de instrumenten voldoende informatie biedt om de materialen vast te stellen die het proces binnenkomen en als afval verlaten. Het wegen van residuen levert gegevens over de efficiëntie van het proces in relatie tot het gebruik van materialen en het genereren van bouwafval. De checklist die gemaakt is op basis van literatuur en ideeën m.b.t. projectbeheer, vergemakkelijkt de identificatie van praktijken op de bouwplaats. Bovendien is de lijst een leidraad voor de gesprekken met de bouwmanagers en de bouwvakkers ter plekke. Het Free-flow-mapping-instrument is geschikt om afval te traceren vanaf het beginpunt tot de uiteindelijke verwijdering. Het is gebleken nuttig te zijn om de werkers ter plekke te begeleiden bij het verbeteren van het beheer van bouwafval. In het algemeen zijn de belangrijkste bijdragen van dit hoofdstuk de instrumenten die zijn ontwikkeld voor de analyse van de bouwpraktijken ter plekke en het gebruik van ideeën betreffende projectbeheer in de praktijk van afvalbeheer.
210
Hoofdstuk 6 tenslotte bespreekt de bevindingen en ‘praktische’ implicaties van de in vorige hoofdstukken van dit proefschrift beschreven studies. Een algemene con-clusie van dit proefschrift is dat het beheer van stedelijk vast afval en bouwafval complex is vanwege het grote aantal factoren dat daarop van invloed is. Inzicht in de oorzaken van inefficiënties en de toepassing van maatregelen kunnen de uitvoe-ring van het systeem verbeteren en de druk op het milieu door menselijke activitei-ten verminderen.
211
Curriculum Vitae
Lilliana Abarca-Guerrero was born on 24th of March 1957 in San José, Costa Rica. She studied chemistry in the University of Costa Rica. In 1988 she went to the Nether-lands to do her Master’s degree in Water Quality Management at the International Institute for Hydrology and Environmental Engineering. In 1990 she got the oppor-tunity to specialize in Municipal Solid Waste Management in Sweden.
Her professional life is around the academic sector. She enrolled the Costa Rica Insti-tute of Technology in 1983 as a lecturer and a researcher. Since then, she has worked mainly in environmental issues related to water quality and solid waste manage-ment. Additionally, in the university, she has been the director of the Cooperation and International Affairs office, Vice-Rector for Research and Extension, and Rector a.i.
In 2005, she moved again to the Netherlands to follow her PhD in the field of con-struction waste management. She joined the Construction Technology research group in 2006. After three years she moved to the Performance Engineering for Built Environments (PEBE) research group. During her studies, she was nominated as the best presentation in the 8th International Postgraduate Research Conference in the Built and Human Environment in Prague in 2008. Additionally, she has obtained different prizes. First place during 10th PhD Symposium Research School Integral Design of Structures in December 2008, third place in the 3rd CIB International Con-ference on Smart and Sustainable Built Environment in 2009 and one of her articles has been published in 2013, being at this moment the second most downloaded arti-cle from Science Direct in the last 90 days. During these years, she has also support-ed and supervised graduation projects of Master’s students.
Meanwhile doing her studies, she joined WASTE advisers on urban environment and development, a foundation working in solid waste and sanitation issues in low and middle-income economies. This job brought her to different countries in the world where she had the opportunity to collect data, information and to learn and share her knowledge and experiences with a great diversity of people. She works e.g. with partner organizations improving the environmental conditions of slums, or with municipalities developing solid waste management plans, or preparing guide-lines for diverse topics in waste management, or developing public private partner-ships for waste management and alike.
After the finalization of her PhD, she goes back to her country and her university to continue lecturing and researching the Costa Rican construction activity.