a conceptual framework to study the effectiveness of
TRANSCRIPT
INTRODUCTION
A project is a cluster of large number of organisations, stakeholders, data/information, technology and other
attributes. Each stakeholder/organisations have different objective and interest in viewing the project from their
perspective. This difference in opinion gives rise to interfacial conflicts. The poorly managed conflicts weaken the
project performance. Thus interface management holds a strategic importance in managing construction projects.
www.jcepm.org
https://doi.org/10.6106/JCEPM.2019.9.3.001
Vol. 9, No. 3 / September 2019
Online ISSN 2233-9582
KICEM Journal of Construction Engineering and Project Management
A Conceptual Framework to Study the Effectiveness of Interface Management in Construction Projects
K. KEERTHANAA1 and S. SHANMUGAPRIYA2
1Post Graduate Student, Department of Civil Engineering, Coimbatore Institute of Technology, Coimbatore -641014, India,
E-mail: [email protected] (*corresponding author)2Assistant Professor, Department of Civil Engineering, Coimbatore Institute of Technology, Coimbatore – 641014, India,
E-mail: [email protected]
A B S T R A C T
Received: Jan 10, 2018
Revised: Mar 14, 2018
Accepted: Jul 09, 2019
The management of mega construction projects which incorporate a large number of stakeholders,
technologies, data, work culture etc., is cumbersome. The experts in the construction arena advocate
that interface management serves as a precise tool in resolving these conflict points due to the
intricate nature of the construction projects. Interface management is a current trending
management practice in the construction industry which is also a beneficiary to mega/fast track
projects in enhancing the project performance. The main objective of this study is to validate a
model for assessing the relationships among interface management, IT applications, project
performance & project benefits. The mediating effect of interface management in relationship
between project performance & interfacial factors was also investigated. The research model was
validated using PLS-SEM (Partial Least Square-Structural Equation Modelling) approach. Data
were collected from clients, contractors, consultants in large scale projects through questionnaire
survey and smart-PLS software was used to analyse the conceptual model. The research model
comprises eleven hypothesis and the significance of these hypothesis were tested using T- statistics
values. The research implies that people/participants factor is greatly influenced by interface
management with the path coefficient of 0.608 and also enhancement of project’s schedule
performance due to the interface management is strongly appealing (Path coefficient = 0.711). The
results also reveal IT application is significantly associated with interface management practice
(Path coefficient =0.723) and also the effect of IT application on project performance (schedule,
cost, quality & safety) is successfully mediated through interface management practice. The
practical application of this validated model was done through case study. The case study aims at
measuring the impact of interface management on interfacial factors and role of interface
management in improving the project performance in the construction organisations.
Keywords: Interface management, IT application, Project performance, Project benefits, Partial least
square
Ⓒ Korea Institute of Construction Engineering and Management. This is an Open-Access article distributed under the terms of the Creative Commons
Attribution Non-Commercial License (http://creativecommons.org/licenses/by-nc/4.0) which permits unrestricted noncommercial use, distribution,
and reproduction in anymedium, provided the original work is properly cited.
2 ∙ K. KEERTHANAA and S. SHANMUGAPRIYA
The interface management is the management of common boundaries between people, systems, equipment, or
concepts [1]. The management of interfaces can be either internal or external. The management of communication,
co-ordination, and responsibility across a common boundary between two organisations, phases, or physical entities
which are interdependent is external interface management and internal interface management is managing the
problems that often occur among the people, departments, and disciplines rather than within the project team itself [2].
The complex nature of large scale projects makes it monotonous to carry out interface management manually. It
requires the support of advanced IT (Information Technology) applications to improve the efficiency of interface
management. The emerging IT applications in the construction industry serve to enhance the project performance.
The interface management can be enriched by the development of interface management tools with the aid of IT
applications.
While many studies have focused on the factors influencing interfacial issues and only a few published studies
focused on direct impact on interface management on performance of construction projects. Additionally, prior
studies on impact of interface management have not examined the relationship of IT application with interface
management in construction and their influence on project performance. The key focus of this research is three fold.
The first objective is to develop a framework which gives the quantitative measurement of effectiveness of a project
in terms of schedule, cost, quality and safety performance due to implementation of interface management. The
second objective is to evaluate the mediating role of interface management in relationship between IT application
and project performance. The third objective is to examine the impact of implementation of interface management
on interfacial issues influencing factors, namely people/participants, methods/process, resources, documentation,
project management & environment.
The analysis of interface management and IT application and their relationships with project performance are
based on the survey of construction firms with interface management. A data collection tool was developed to
examine the levels of interface management and IT adoption levels in construction firms.
DEVELOPMENT OF CONCEPTUAL FRAMEWORK AND RESEARCH HYPOTHESIS
A desirable research has been conducted on the adoption of interface management in the construction industry.
The prior literatures focused mainly on the factors influencing the interfacial issues, frameworks and methods for
implementation of interface management in an organisation. The prior studies indicated the advancement in
information and communication technologies should be accompanied with the management process [3].
WBS matrix concept breakdown a project into activity and product oriented structure to identify the interfaces .The
interfaces were classified as organisational, technical, geographical, and time interfaces. In the case study of mass
rapid transit system, WBS matrix was developed by generating work package sheets and work package reports for
each trades like power supply, track works, etc. using excel and the entire interface in each trade was identified to
improve the interface management [4].
Integration opportunity assessment tool (IOP Tool) was based on the drivers and hindrance factors for information
A Conceptual Framework to Study the Effectiveness of Interface Management in Construction Projects ∙ 3
integration. The benefit and hindrance drivers were classified as “Market/Legal”, “Organisational/process”,
“People/Roles/Training”. IOP tool consists of seven worksheets which helps to identify the level of information
integration in the project. With the help of these worksheets, the level of information integration in the case studies
was measured. If information integration was at low level, the hindrance mitigation plan was proposed [5].
Interface management was categorized as Time interface, Relational interface, Information interface and
Environmental interface. Factors influencing these interfaces such as “engineering design and schedule control”,
“communication”, “information sharing platform”, “profit”, “law & policy”, “IT ability to apply”, “natural climate”,
“contracting strategy” are identified. Using DEMATEL model, design, communication skills, IT ability to apply,
information sharing platform & profit were shown to be the most important factors for interface management [6].
A case study was done on the use of the interface management software n-pulse. n-pulse integrates schedule,
resources, inventory, BOQ, drawing data and provides proactive information about the schedule delays, cost
overruns. The roles of stakeholders like client, PMC, general contractors and subcontractors, consultants in the case
study were studied [7].
A model for assessing the relationships among IT application, KM practice adoption and project success was
framed. Mediating role of KM practice adoption in relationship between IT application and project performance is
studied and also the effect of project type on project success and knowledge management is also studied. This
model served as a basic framework for the development of preliminary framework for this research [8].
From the extensive literature reviews it was found that no conceptual model was proposed to measure the
influence of interface management on project performance indicators such as cost, schedule, quality and safety and
also interrelationships among IT application, interface management, project performance and project benefits was
not studied. This study aims at fulfilling these knowledge gaps.
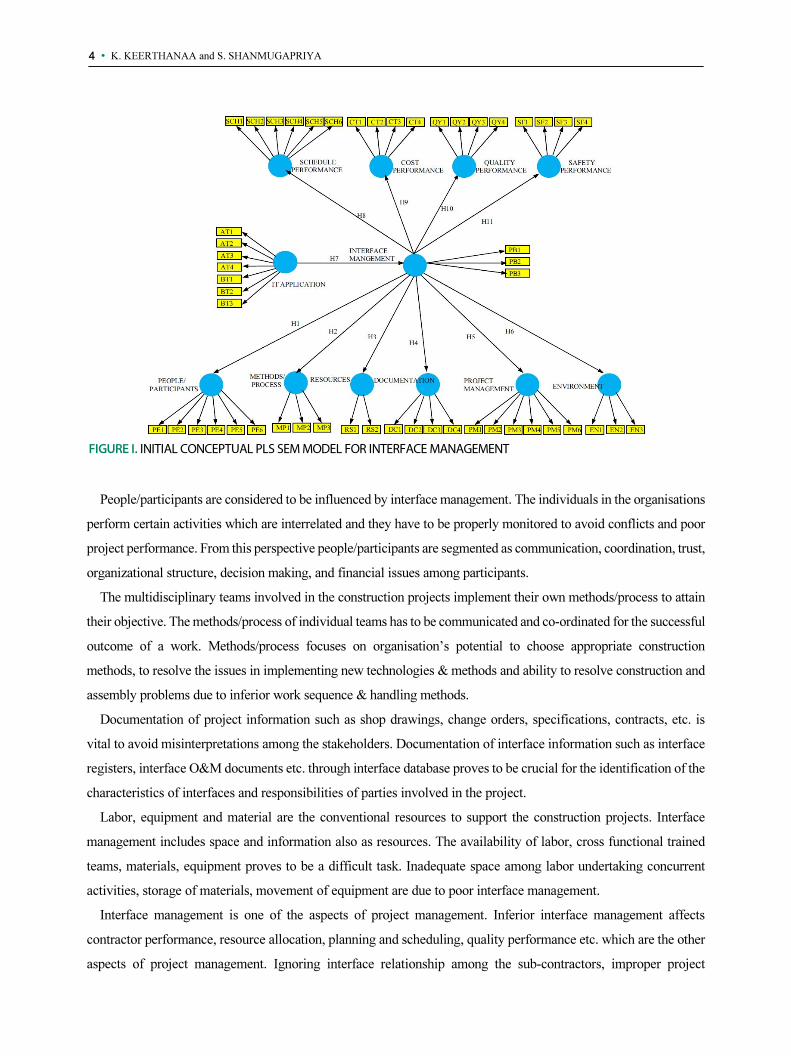
The initial conceptual framework is developed with the aid of literatures on interface management. The initial
PLS model comprises 51 attributes for 12 constructs as shown in Figure I The following are the hypothesis set up in
PLS path model.
Interfacial Factors
Based on the relevant literatures, following hypotheses are postulated.
H1.Interface management positively influences people/participants in the project
H2.Interface management positively influences the methods /process involved in the project
H3.Interface management has positively influences resources assigned to the project
H4.Interface management has a positive influence on documentation
H5.Interface management has a positive impact on project management
H6.Interface management has a positive effect on environment
4 ∙ K. KEERTHANAA and S. SHANMUGAPRIYA
FIGURE I. INITIAL CONCEPTUAL PLS SEM MODEL FOR INTERFACE MANAGEMENT
People/participants are considered to be influenced by interface management. The individuals in the organisations
perform certain activities which are interrelated and they have to be properly monitored to avoid conflicts and poor
project performance. From this perspective people/participants are segmented as communication, coordination, trust,
organizational structure, decision making, and financial issues among participants.
The multidisciplinary teams involved in the construction projects implement their own methods/process to attain
their objective. The methods/process of individual teams has to be communicated and co-ordinated for the successful
outcome of a work. Methods/process focuses on organisation’s potential to choose appropriate construction
methods, to resolve the issues in implementing new technologies & methods and ability to resolve construction and
assembly problems due to inferior work sequence & handling methods.
Documentation of project information such as shop drawings, change orders, specifications, contracts, etc. is
vital to avoid misinterpretations among the stakeholders. Documentation of interface information such as interface
registers, interface O&M documents etc. through interface database proves to be crucial for the identification of the
characteristics of interfaces and responsibilities of parties involved in the project.
Labor, equipment and material are the conventional resources to support the construction projects. Interface
management includes space and information also as resources. The availability of labor, cross functional trained
teams, materials, equipment proves to be a difficult task. Inadequate space among labor undertaking concurrent
activities, storage of materials, movement of equipment are due to poor interface management.
Interface management is one of the aspects of project management. Inferior interface management affects
contractor performance, resource allocation, planning and scheduling, quality performance etc. which are the other
aspects of project management. Ignoring interface relationship among the sub-contractors, improper project
A Conceptual Framework to Study the Effectiveness of Interface Management in Construction Projects ∙ 5
decomposition, organisation structure, schedule shortening in fast track projects, lack of timely project update are
major project management issues due to lack of interface management.
Environment here refers to of construction project. It includes geological, climate and weather conditions,
building codes, local laws and regulations, cultural diversity of participants and also integrated work environment.
IT Application
In summary the literatures support the adoption of IT to enhance interface management. This study further
extends the previous research by analysing the impact of IT tools on interface management. The following research
hypotheses are set up based on the relevant literatures:
H7.IT application positively influences the project’s level of interface management.
DEMATEL (Decision Making Trial and Evaluation Laboratory) model which shows IT ability to apply is the
most important factor in interface management of the project [6].
Project Performance
In prior studies the relationship between adoption of systematic Interface management and project performance
is investigated and concluded that interface management will positively affect project performance [9, 10].
Interface management process allows early identification of critical interfaces through a structured process which
leading to early definitions of cost & schedule issues [11, 12]. Interface management optimizes the design in terms
of quality to meet the customer needs [11]. The following hypotheses were proposed based on previous research
and the project performance is measured in term of schedule, cost, quality, safety.
H8.Interface management has a positive impact on project’s schedule performance
H9.Interface management has a positive impact on project’s cost performance
H10.Interface management has a positive impact on project’s quality performance
H11.Interface management has a positive impact on project’s safety performance
The above hypotheses and conceptual framework were developed with the help of relevant literatures. The
Figure I represents the variables and theoretical framework that links the constructs. This framework validates the
association among IT application, interface management, project performance in term of schedule, cost, quality,
safety.
RESEARCH METHODOLOGY
The research was carried out in 3 phases. In the first phase with the help of relevant literatures, factors for
interfacial issues were identified and grouped under relevant constructs. The conceptual model for the study was

6 ∙ K. KEERTHANAA and S. SHANMUGAPRIYA
framed with constructs and interfacial attributes.
The second phase comprises the development of the questionnaire with the aid of identified factors and model.
Initially for pilot study the questionnaire was distributed to 10 experts in the construction industry. The response
from the pilot study validated the effectiveness of the questionnaire. Subsequently necessary update was made in
the questionnaire. The construction organisations where a large number of stakeholders, tools, phases involved
were spotted, so that it may be ideal to identify the companies with interface management. The questionnaire was
then distributed to the targeted organisations.
In the third phase, the data collected from the industry wide survey were filtered for analysis and the data was
analysed using PLS-SEM (Partial Least Square- Structural Equation Modelling) technique. The flowchart of
reserch methodology is presented in Figure II.
FIGURE II. FLOW CHART OF RESEARCH METHODOLOGY
Demographic Information
The industry wide survey was conducted among top 50 organisations. The questionnaire was distributed to 200
managers in leading multinational companies, who seemed to be more relevant to our research. At the end 101
questionnaires were completely filled. The data were collected through direct interviews and also through online –
basis. A data collection tool was developed for this purpose. Thus the final response rate is 51%.
Among the respondents the positions hold by them were, 62% of Engineers (quality, safety, procurement,
structural, etc.), 23% of Project Managers, 8% of Construction manager, 3% of Architects, 3% of Contract
A Conceptual Framework to Study the Effectiveness of Interface Management in Construction Projects ∙ 7
administrators and 1% of Interface co-ordinators. 67% of respondents holds bachelor degree, 22% having Masters
degree, 7% having graduate diploma and 4% having a doctorate degree.
The type of organisations the questionnaire distributed were, 77% of Construction contractors/subcontractors, 9
% of Project management consultants, 7% of Owner/Clients, 6% of Structural consultants, 1% of Architectural
consultants. In the pool of organisation responded, 45% of organisations are involved with more than 100 projects,
23% between 51 to 75 projects, 21% less than 50 projects, 11 % between 76 to 100 projects. Some of the
organisations are aware of interface management tools. A few interface management tools suggested by the
respondents which are used in their organisations are Aconex, CIMS, R construct, Rhythm.
Data Analysis using PLS-SEM Approach
Structural Equation Modeling is a multivariate analysis technique used to examine the interrelationship between
multiple variables simultaneously. SEM is the combination of factor analysis and multiple regression analysis to
study the relationship between measured variables and latent constructs. SEM is extremely beneficial in
investigating the relationship among the significant variables and to solve complex construction problems [13].
SEM serves as appealing tool in the field of construction engineering and management [14]. The SEM analysis can
be either covariance based structural analysis or component based structural analysis using Partial Least Square
(PLS-SEM). In this research PLS-SEM technique is used for analysis.
The two main components included in the PLS-SEM are: measurement model or outer model and structural
model or inner model. The measurement model gives the relationship between latent construct and its indicators
and the potential casual dependencies between the endogenous and exogenous constructs is given by structural
model. The structural model gives the direct effects (path coefficients) connecting the endogenous and exogenous
constructs.
Assessment of Measurement Model
The indicator reliability, convergent validity, discriminant validity are the criteria used for assessing whether the
measurement model has acceptable measurement properties [15].The initial model with 51 observed variables is
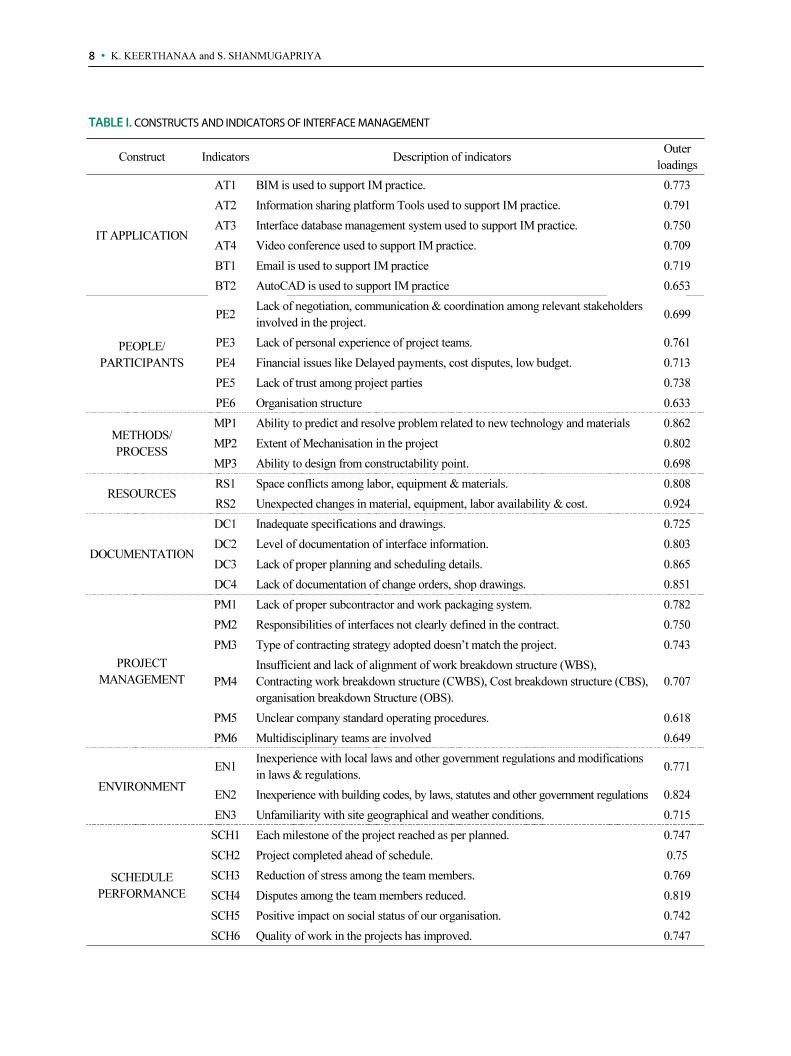
tested using PLS. The indicator reliability is evaluated by examining the outer loadings of the items. Table I shows
the final loadings of indicators with value greater than 0.6.
The convergent validity is estimated to measure the extent to which a latent variable shares its indicator variance.
It involves measuring the cronbach’s alpha, composite reliability and average variance extracted (AVE).
Cronbach’s alpha is a measure of internal consistency and reliability. The internal consistency is found to be good
when alpha ranges from 0.7 to 0.9 [16]. The composite reliability is same as cronbach’s alpha except that it takes
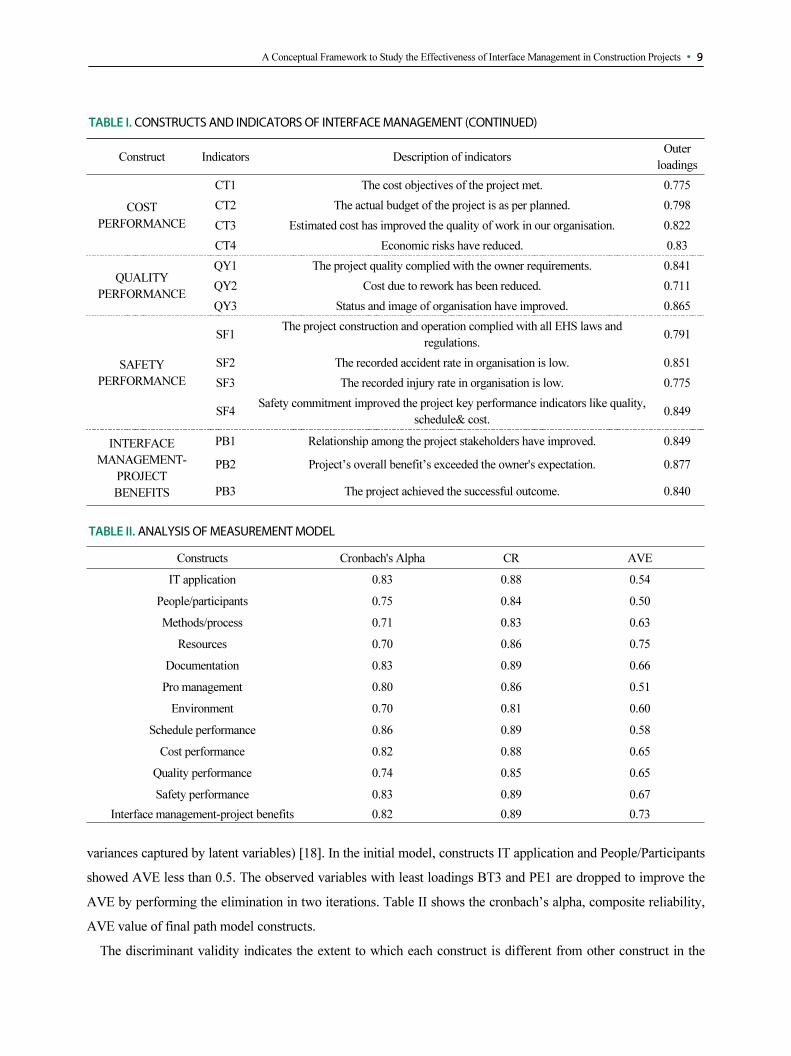
into account that indicators have different loadings. The cutoff value of composite reliability is 0.6 [17]. Table II
shows that all indicators possess Cronbach’s alpha greater than 0.7 and composite reliability greater than 0.6. AVE
is the criterion for convergent validity and its cut off value is suggested to be greater than 0.5 (i.e., at least 50% of
8 ∙ K. KEERTHANAA and S. SHANMUGAPRIYA
TABLE I. CONSTRUCTS AND INDICATORS OF INTERFACE MANAGEMENT
Construct Indicators Description of indicatorsOuter
loadings
IT APPLICATION
AT1 BIM is used to support IM practice. 0.773
AT2 Information sharing platform Tools used to support IM practice. 0.791
AT3 Interface database management system used to support IM practice. 0.750
AT4 Video conference used to support IM practice. 0.709
BT1 Email is used to support IM practice 0.719
BT2 AutoCAD is used to support IM practice 0.653
PEOPLE/
PARTICIPANTS
PE2Lack of negotiation, communication & coordination among relevant stakeholders
involved in the project.0.699
PE3 Lack of personal experience of project teams. 0.761
PE4 Financial issues like Delayed payments, cost disputes, low budget. 0.713
PE5 Lack of trust among project parties 0.738
PE6 Organisation structure 0.633
METHODS/
PROCESS
MP1 Ability to predict and resolve problem related to new technology and materials 0.862
MP2 Extent of Mechanisation in the project 0.802
MP3 Ability to design from constructability point. 0.698
RESOURCESRS1 Space conflicts among labor, equipment & materials. 0.808
RS2 Unexpected changes in material, equipment, labor availability & cost. 0.924
DOCUMENTATION
DC1 Inadequate specifications and drawings. 0.725
DC2 Level of documentation of interface information. 0.803
DC3 Lack of proper planning and scheduling details. 0.865
DC4 Lack of documentation of change orders, shop drawings. 0.851
PROJECT
MANAGEMENT
PM1 Lack of proper subcontractor and work packaging system. 0.782
PM2 Responsibilities of interfaces not clearly defined in the contract. 0.750
PM3 Type of contracting strategy adopted doesn’t match the project. 0.743
PM4
Insufficient and lack of alignment of work breakdown structure (WBS),
Contracting work breakdown structure (CWBS), Cost breakdown structure (CBS),
organisation breakdown Structure (OBS).
0.707
PM5 Unclear company standard operating procedures. 0.618
PM6 Multidisciplinary teams are involved 0.649
ENVIRONMENT
EN1Inexperience with local laws and other government regulations and modifications
in laws & regulations.0.771
EN2 Inexperience with building codes, by laws, statutes and other government regulations 0.824
EN3 Unfamiliarity with site geographical and weather conditions. 0.715
SCHEDULE
PERFORMANCE
SCH1 Each milestone of the project reached as per planned. 0.747
SCH2 Project completed ahead of schedule. 0.75
SCH3 Reduction of stress among the team members. 0.769
SCH4 Disputes among the team members reduced. 0.819
SCH5 Positive impact on social status of our organisation. 0.742
SCH6 Quality of work in the projects has improved. 0.747
A Conceptual Framework to Study the Effectiveness of Interface Management in Construction Projects ∙ 9
variances captured by latent variables) [18]. In the initial model, constructs IT application and People/Participants
showed AVE less than 0.5. The observed variables with least loadings BT3 and PE1 are dropped to improve the
AVE by performing the elimination in two iterations. Table II shows the cronbach’s alpha, composite reliability,
AVE value of final path model constructs.
The discriminant validity indicates the extent to which each construct is different from other construct in the
TABLE I. CONSTRUCTS AND INDICATORS OF INTERFACE MANAGEMENT (CONTINUED)
Construct Indicators Description of indicatorsOuter
loadings
COST
PERFORMANCE
CT1 The cost objectives of the project met. 0.775
CT2 The actual budget of the project is as per planned. 0.798
CT3 Estimated cost has improved the quality of work in our organisation. 0.822
CT4 Economic risks have reduced. 0.83
QUALITY
PERFORMANCE
QY1 The project quality complied with the owner requirements. 0.841
QY2 Cost due to rework has been reduced. 0.711
QY3 Status and image of organisation have improved. 0.865
SAFETY
PERFORMANCE
SF1The project construction and operation complied with all EHS laws and
regulations.0.791
SF2 The recorded accident rate in organisation is low. 0.851
SF3 The recorded injury rate in organisation is low. 0.775
SF4Safety commitment improved the project key performance indicators like quality,
schedule& cost.0.849
INTERFACE
MANAGEMENT-
PROJECT
BENEFITS
PB1 Relationship among the project stakeholders have improved. 0.849
PB2 Project’s overall benefit’s exceeded the owner's expectation. 0.877
PB3 The project achieved the successful outcome. 0.840
TABLE II. ANALYSIS OF MEASUREMENT MODEL
Constructs Cronbach's Alpha CR AVE
IT application 0.83 0.88 0.54
People/participants 0.75 0.84 0.50
Methods/process 0.71 0.83 0.63
Resources 0.70 0.86 0.75
Documentation 0.83 0.89 0.66
Pro management 0.80 0.86 0.51
Environment 0.70 0.81 0.60
Schedule performance 0.86 0.89 0.58
Cost performance 0.82 0.88 0.65
Quality performance 0.74 0.85 0.65
Safety performance 0.83 0.89 0.67
Interface management-project benefits 0.82 0.89 0.73
10 ∙ K. KEERTHANAA and S. SHANMUGAPRIYA
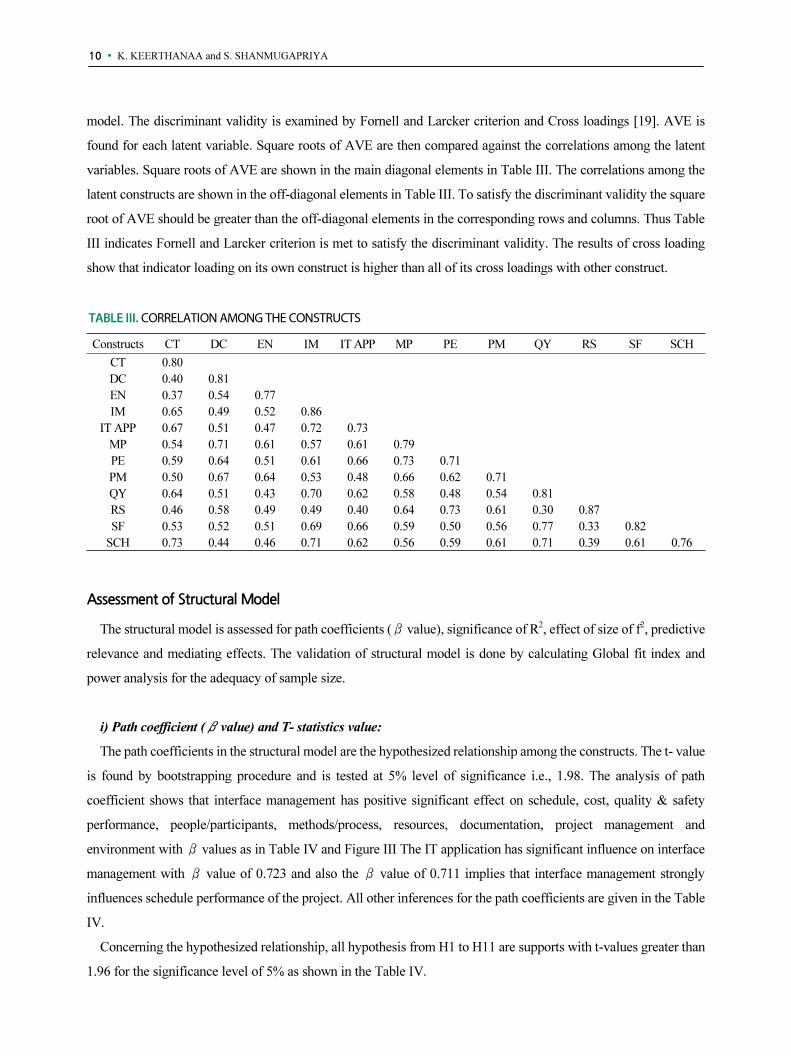
model. The discriminant validity is examined by Fornell and Larcker criterion and Cross loadings [19]. AVE is
found for each latent variable. Square roots of AVE are then compared against the correlations among the latent
variables. Square roots of AVE are shown in the main diagonal elements in Table III. The correlations among the
latent constructs are shown in the off-diagonal elements in Table III. To satisfy the discriminant validity the square
root of AVE should be greater than the off-diagonal elements in the corresponding rows and columns. Thus Table
III indicates Fornell and Larcker criterion is met to satisfy the discriminant validity. The results of cross loading
show that indicator loading on its own construct is higher than all of its cross loadings with other construct.
TABLE III. CORRELATION AMONG THE CONSTRUCTS
Constructs CT DC EN IM IT APP MP PE PM QY RS SF SCH
CT 0.80
DC 0.40 0.81
EN 0.37 0.54 0.77
IM 0.65 0.49 0.52 0.86
IT APP 0.67 0.51 0.47 0.72 0.73
MP 0.54 0.71 0.61 0.57 0.61 0.79
PE 0.59 0.64 0.51 0.61 0.66 0.73 0.71
PM 0.50 0.67 0.64 0.53 0.48 0.66 0.62 0.71
QY 0.64 0.51 0.43 0.70 0.62 0.58 0.48 0.54 0.81
RS 0.46 0.58 0.49 0.49 0.40 0.64 0.73 0.61 0.30 0.87
SF 0.53 0.52 0.51 0.69 0.66 0.59 0.50 0.56 0.77 0.33 0.82
SCH 0.73 0.44 0.46 0.71 0.62 0.56 0.59 0.61 0.71 0.39 0.61 0.76
Assessment of Structural Model
The structural model is assessed for path coefficients (β value), significance of R2, effect of size of f2, predictive
relevance and mediating effects. The validation of structural model is done by calculating Global fit index and
power analysis for the adequacy of sample size.
i) Path coefficient (β value) and T- statistics value:
The path coefficients in the structural model are the hypothesized relationship among the constructs. The t- value
is found by bootstrapping procedure and is tested at 5% level of significance i.e., 1.98. The analysis of path
coefficient shows that interface management has positive significant effect on schedule, cost, quality & safety
performance, people/participants, methods/process, resources, documentation, project management and
environment with β values as in Table IV and Figure III The IT application has significant influence on interface
management with β value of 0.723 and also the β value of 0.711 implies that interface management strongly
influences schedule performance of the project. All other inferences for the path coefficients are given in the Table
IV.
Concerning the hypothesized relationship, all hypothesis from H1 to H11 are supports with t-values greater than
1.96 for the significance level of 5% as shown in the Table IV.

A Conceptual Framework to Study the Effectiveness of Interface Management in Construction Projects ∙ 11
TABLE IV. PATH COEFFICIENTS AND T STATISTICS
Code Hypothesis Path Coefficients T values Inference
H1 Interface Management - People/Participants 0.61 10.13 Significant
H2 Interface Management - Methods/Process 0.57 10.56 Significant
H3 Interface Management - Resources 0.49 5.86 Significant
H4 Interface Management - Documentation 0.49 5.26 Significant
H5 Interface Management - Project Management 0.53 8.05 Significant
H6 Interface Management - Environment 0.52 6.59 Significant
H7 IT Application - Interface Management 0.72 9.66 Significant
H8 Interface Management - Schedule Performance 0.71 8.06 Significant
H9 Interface Management - Cost Performance 0.65 7.05 Significant
H10 Interface Management - Quality Performance 0.70 7.51 Significant
H11 Interface Management - Safety Performance 0.69 7.59 Significant
FIGURE III. FINAL PLS SEM MODEL FOR INTERFACE MANAGEMENT
ii) Measuring the value of R2
The explained variance is assessed using R2 of the endogenous latent variable. The R2 indicates the change in the
endogenous construct, when there is a change in the predictor construct. R2 of endogenous construct can be
assessed as substantial when the value is 0.26, moderate when the value is 0.13 and weak at the value of 0.02 [20].
The R2 value of each endogenous construct is shown in Figure IV.
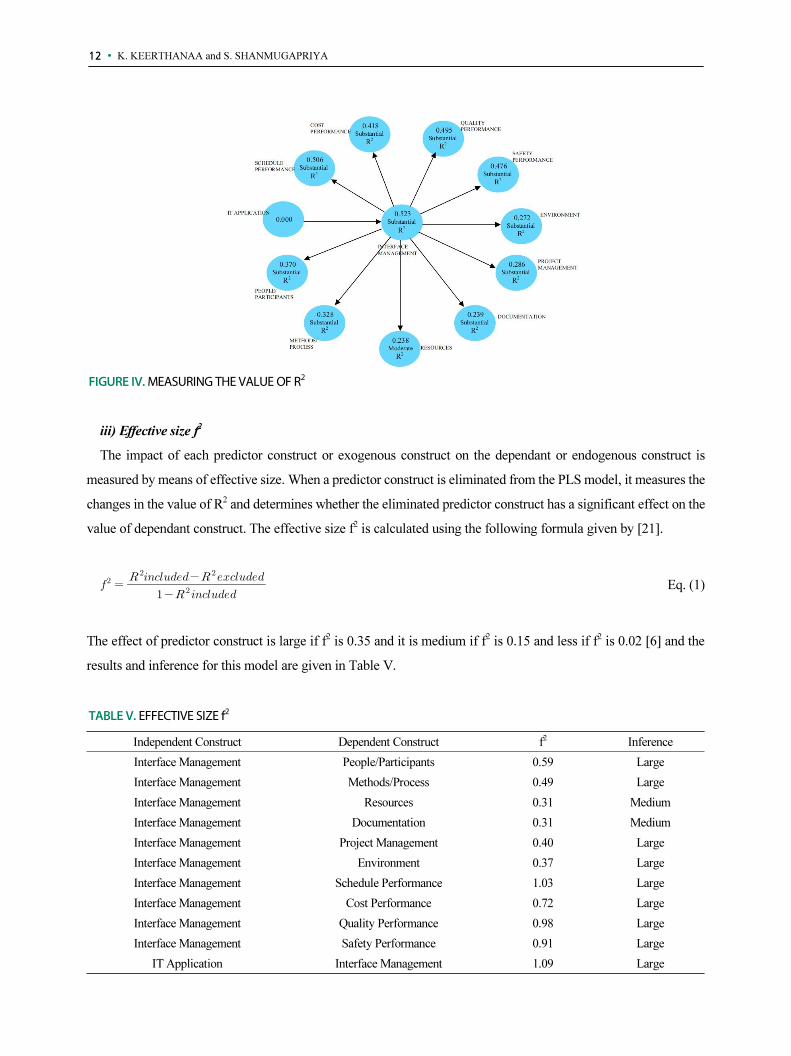
12 ∙ K. KEERTHANAA and S. SHANMUGAPRIYA
FIGURE IV. MEASURING THE VALUE OF R2
iii) Effective size f2
The impact of each predictor construct or exogenous construct on the dependant or endogenous construct is
measured by means of effective size. When a predictor construct is eliminated from the PLS model, it measures the
changes in the value of R2 and determines whether the eliminated predictor construct has a significant effect on the
value of dependant construct. The effective size f2 is calculated using the following formula given by [21].
Eq. (1)
The effect of predictor construct is large if f2 is 0.35 and it is medium if f2 is 0.15 and less if f2 is 0.02 [6] and the
results and inference for this model are given in Table V.
TABLE V. EFFECTIVE SIZE f2
Independent Construct Dependent Construct f2 Inference
Interface Management People/Participants 0.59 Large
Interface Management Methods/Process 0.49 Large
Interface Management Resources 0.31 Medium
Interface Management Documentation 0.31 Medium
Interface Management Project Management 0.40 Large
Interface Management Environment 0.37 Large
Interface Management Schedule Performance 1.03 Large
Interface Management Cost Performance 0.72 Large
Interface Management Quality Performance 0.98 Large
Interface Management Safety Performance 0.91 Large
IT Application Interface Management 1.09 Large
A Conceptual Framework to Study the Effectiveness of Interface Management in Construction Projects ∙ 13
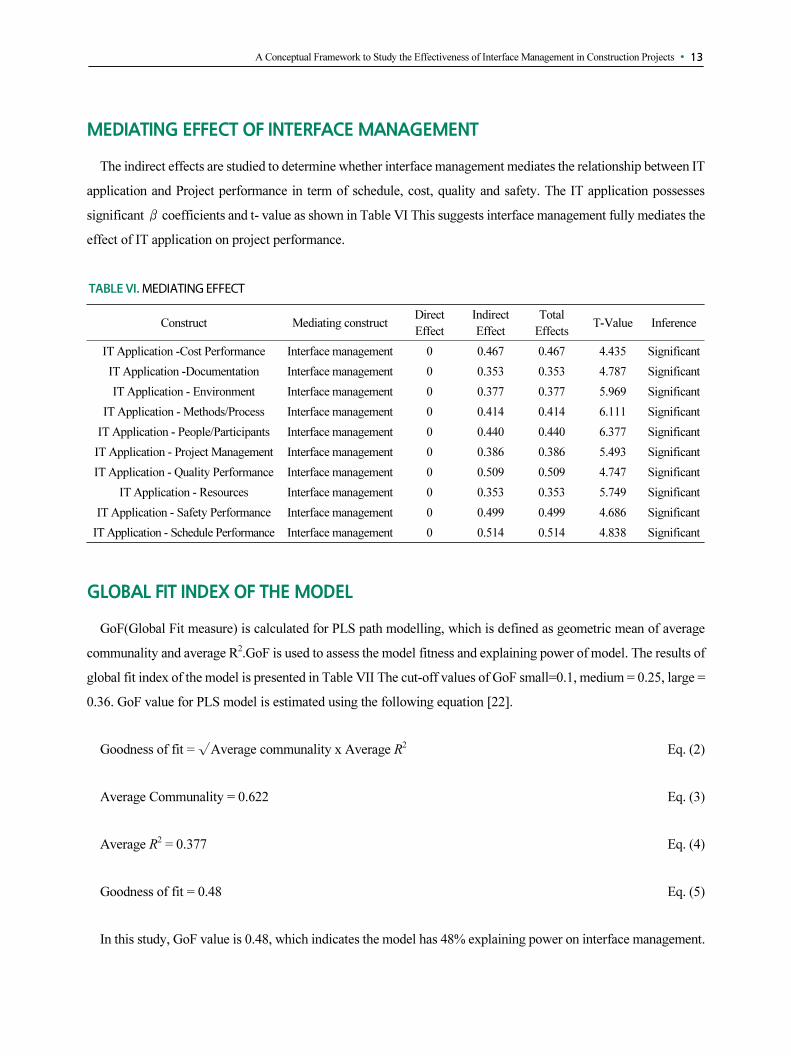
MEDIATING EFFECT OF INTERFACE MANAGEMENT
The indirect effects are studied to determine whether interface management mediates the relationship between IT
application and Project performance in term of schedule, cost, quality and safety. The IT application possesses
significant β coefficients and t- value as shown in Table VI This suggests interface management fully mediates the
effect of IT application on project performance.
TABLE VI. MEDIATING EFFECT
Construct Mediating constructDirect
Effect
Indirect
Effect
Total
EffectsT-Value Inference
IT Application -Cost Performance Interface management 0 0.467 0.467 4.435 Significant
IT Application -Documentation Interface management 0 0.353 0.353 4.787 Significant
IT Application - Environment Interface management 0 0.377 0.377 5.969 Significant
IT Application - Methods/Process Interface management 0 0.414 0.414 6.111 Significant
IT Application - People/Participants Interface management 0 0.440 0.440 6.377 Significant
IT Application - Project Management Interface management 0 0.386 0.386 5.493 Significant
IT Application - Quality Performance Interface management 0 0.509 0.509 4.747 Significant
IT Application - Resources Interface management 0 0.353 0.353 5.749 Significant
IT Application - Safety Performance Interface management 0 0.499 0.499 4.686 Significant
IT Application - Schedule Performance Interface management 0 0.514 0.514 4.838 Significant
GLOBAL FIT INDEX OF THE MODEL
GoF(Global Fit measure) is calculated for PLS path modelling, which is defined as geometric mean of average
communality and average R2.GoF is used to assess the model fitness and explaining power of model. The results of
global fit index of the model is presented in Table VII The cut-off values of GoF small=0.1, medium = 0.25, large =
0.36. GoF value for PLS model is estimated using the following equation [22].
Goodness of fit = √Average communality x Average R2 Eq. (2)
Average Communality = 0.622 Eq. (3)
Average R2 = 0.377 Eq. (4)
Goodness of fit = 0.48 Eq. (5)
In this study, GoF value is 0.48, which indicates the model has 48% explaining power on interface management.

14 ∙ K. KEERTHANAA and S. SHANMUGAPRIYA
TABLE VII. GLOBAL FIT INDEX FOR THE MODEL
Constructs R2 Communality
Cost performance 0.418 0.651
Documentation 0.239 0.660
Environment 0.272 0.595
Interface management 0.523 0.732
IT Application 0 0.539
Methods/Process 0.328 0.625
People/Participants 0.370 0.504
Project management 0.286 0.505
Quality performance 0.495 0.654
Resources 0.238 0.754
Safety performance 0.476 0.667
Schedule performance 0.506 0.582
Average 0.377 0.622
POWER ANALYSIS
The stability of model’s parameter with the sample size is tested using power analysis [21]. The parameters
required for power analysis are significance level (α) of the test, sample size (N) of the study and effect size (ES) of
the population. The power of the model is calculated using G power 3.1 software, The input parameter for this
model are significance level =5%, sample size N (101), and the effective size ES is calculated using the following
equation [23].
Effective size =
=
= 0.61 Eq. (6)
Figure V indicates the power of the overall model increases as the number of sample size increases. With the
FIGURE V. POWER ANALYSIS

A Conceptual Framework to Study the Effectiveness of Interface Management in Construction Projects ∙ 15
sample size of 40, the power of 100% is achieved.The sample taken up for this research is 101. Therefore the
sample size used for this study is adequate for achieving substantial power.
CASE STUDY
The validated model was applied in the construction firms through case studies. The results of the analysis were
used to develop the template. The case study comprises two templates. The first template was to evaluate the impact
on interface management factors in the particular organisation. The second template measures the improvement in
project performance due to interface management.
Construction firms with interface management were identified and two organisations were selected for the case
study namely company A and B. A questionnaire was framed and then distributed to the firms A and B.
Questionnaire comprises three parts with the first part framed to gather information about the organisation and
personal information of the respondent.
The second part consists of 22 statements to evaluate the impact on interfacial management factors in the firms
A & B under six constructs namely people/participants, methods/process, documentation, project management, and
environment. The third part is designed to measure the improvement in project performance due to interface
management with 20 statements under 4 constructs i.e., schedule performance, cost performance, quality performance
and safety performance.
Each statement was framed to obtain the organisations status on the various attributes in the context of interface
management. The respondents were asked to rate their organisation’s level in percentage from 0 to 100(Strongly
Agree-80-100%,Agree-60-79%, Neutral-40-59%, Disagree-20 -39%, Strongly Disagree-0-19%) for each
statement in the questionnaire from the perspective of interface management in their organisation.
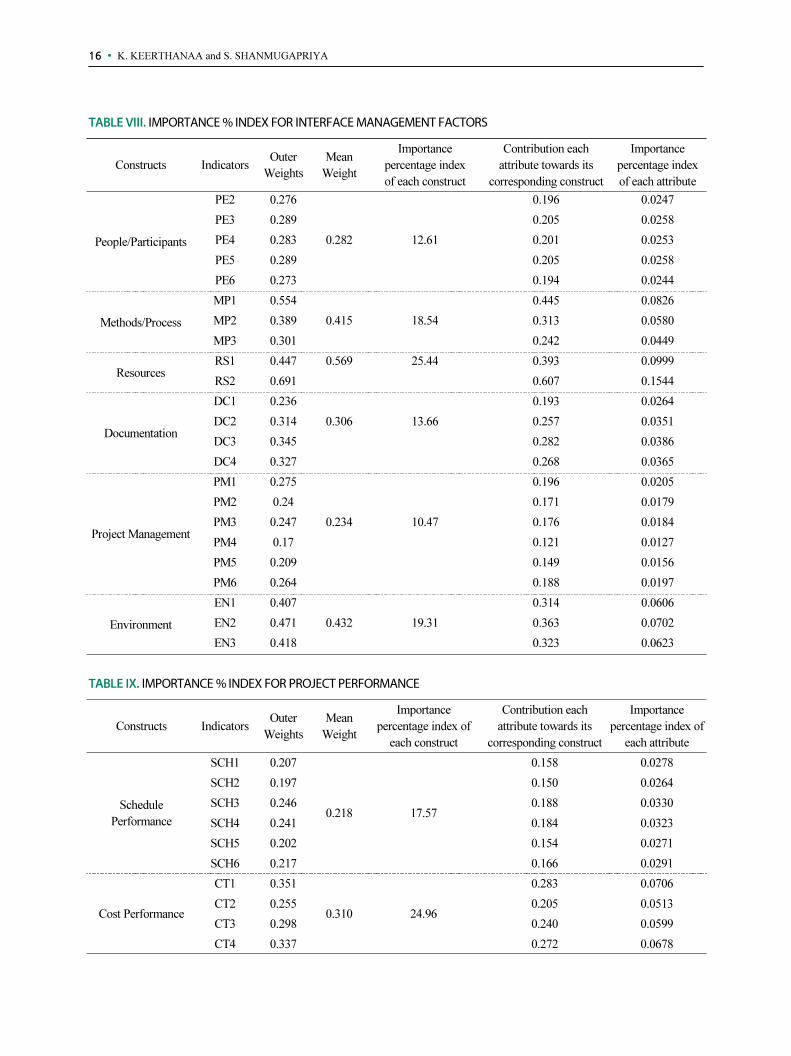
Development of Template
The first template is developed to measure the impact on interfacial management factors as shown in Table VIII.
From the results given by the PLS-SEM, the outer weights of all attributes of constructs namely people/participants,
methods/process, documentation, project management, and environment were used.
The importance percentage index of each construct and also importance percentage of each attributes to its
corresponding constructs are calculated. The respondents give the impact of interface management factors in their
organisation in terms of percentage. This percentage is multiplied with importance percentage index of each
attributes to measure the contribution each attribute towards interface management.
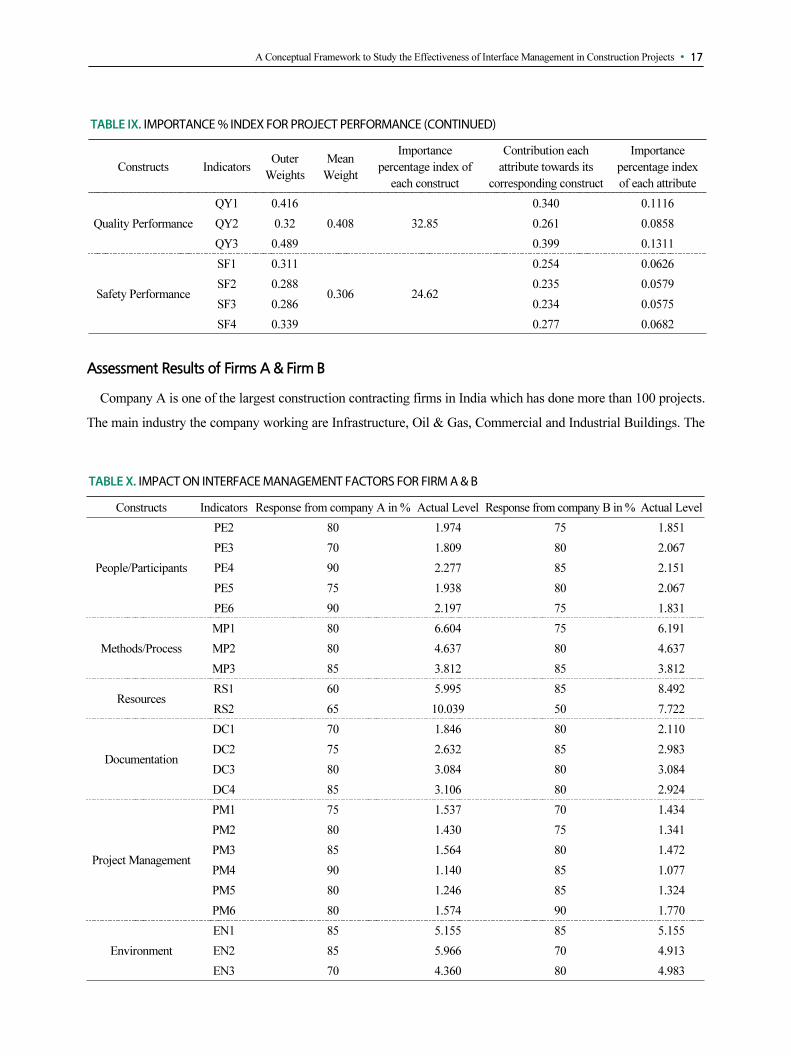
The second template is used to measure the improvement in project performance of the firms due to interface
management as indicated in Table IX. The outer weights of project performance indicators, namely schedule
performance, cost performance, quality performance and safety performance are measured and the calculations are
done similar to first template.
16 ∙ K. KEERTHANAA and S. SHANMUGAPRIYA
TABLE VIII. IMPORTANCE % INDEX FOR INTERFACE MANAGEMENT FACTORS
Constructs IndicatorsOuter
Weights
Mean
Weight
Importance
percentage index
of each construct
Contribution each
attribute towards its
corresponding construct
Importance
percentage index
of each attribute
People/Participants
PE2 0.276 0.196 0.0247
PE3 0.289 0.205 0.0258
PE4 0.283 0.282 12.61 0.201 0.0253
PE5 0.289 0.205 0.0258
PE6 0.273 0.194 0.0244
Methods/Process
MP1 0.554 0.445 0.0826
MP2 0.389 0.415 18.54 0.313 0.0580
MP3 0.301 0.242 0.0449
ResourcesRS1 0.447 0.569 25.44 0.393 0.0999
RS2 0.691 0.607 0.1544
Documentation
DC1 0.236 0.193 0.0264
DC2 0.314 0.306 13.66 0.257 0.0351
DC3 0.345 0.282 0.0386
DC4 0.327 0.268 0.0365
Project Management
PM1 0.275 0.196 0.0205
PM2 0.24 0.171 0.0179
PM3 0.247 0.234 10.47 0.176 0.0184
PM4 0.17 0.121 0.0127
PM5 0.209 0.149 0.0156
PM6 0.264 0.188 0.0197
Environment
EN1 0.407 0.314 0.0606
EN2 0.471 0.432 19.31 0.363 0.0702
EN3 0.418 0.323 0.0623
TABLE IX. IMPORTANCE % INDEX FOR PROJECT PERFORMANCE
Constructs IndicatorsOuter
Weights
Mean
Weight
Importance
percentage index of
each construct
Contribution each
attribute towards its
corresponding construct
Importance
percentage index of
each attribute
Schedule
Performance
SCH1 0.207
0.218 17.57
0.158 0.0278
SCH2 0.197 0.150 0.0264
SCH3 0.246 0.188 0.0330
SCH4 0.241 0.184 0.0323
SCH5 0.202 0.154 0.0271
SCH6 0.217 0.166 0.0291
Cost Performance
CT1 0.351
0.310 24.96
0.283 0.0706
CT2 0.255 0.205 0.0513
CT3 0.298 0.240 0.0599
CT4 0.337 0.272 0.0678
A Conceptual Framework to Study the Effectiveness of Interface Management in Construction Projects ∙ 17
Assessment Results of Firms A & Firm B
Company A is one of the largest construction contracting firms in India which has done more than 100 projects.
The main industry the company working are Infrastructure, Oil & Gas, Commercial and Industrial Buildings. The
TABLE IX. IMPORTANCE % INDEX FOR PROJECT PERFORMANCE (CONTINUED)
Constructs IndicatorsOuter
Weights
Mean
Weight
Importance
percentage index of
each construct
Contribution each
attribute towards its
corresponding construct
Importance
percentage index
of each attribute
Quality Performance
QY1 0.416
0.408 32.85
0.340 0.1116
QY2 0.32 0.261 0.0858
QY3 0.489 0.399 0.1311
Safety Performance
SF1 0.311
0.306 24.62
0.254 0.0626
SF2 0.288 0.235 0.0579
SF3 0.286 0.234 0.0575
SF4 0.339 0.277 0.0682
TABLE X. IMPACT ON INTERFACE MANAGEMENT FACTORS FOR FIRM A & B
Constructs Indicators Response from company A in % Actual Level Response from company B in % Actual Level
People/Participants
PE2 80 1.974 75 1.851
PE3 70 1.809 80 2.067
PE4 90 2.277 85 2.151
PE5 75 1.938 80 2.067
PE6 90 2.197 75 1.831
Methods/Process
MP1 80 6.604 75 6.191
MP2 80 4.637 80 4.637
MP3 85 3.812 85 3.812
ResourcesRS1 60 5.995 85 8.492
RS2 65 10.039 50 7.722
Documentation
DC1 70 1.846 80 2.110
DC2 75 2.632 85 2.983
DC3 80 3.084 80 3.084
DC4 85 3.106 80 2.924
Project Management
PM1 75 1.537 70 1.434
PM2 80 1.430 75 1.341
PM3 85 1.564 80 1.472
PM4 90 1.140 85 1.077
PM5 80 1.246 85 1.324
PM6 80 1.574 90 1.770
Environment
EN1 85 5.155 85 5.155
EN2 85 5.966 70 4.913
EN3 70 4.360 80 4.983
18 ∙ K. KEERTHANAA and S. SHANMUGAPRIYA
company uses ERP to manage interface. Company B is also a large contracting firm with its headquarters in UAE.
The company has done more than 50 Oil & Gas and Industrial projects. Aconex is the interface management tool
used in the company B to handle the interfaces.
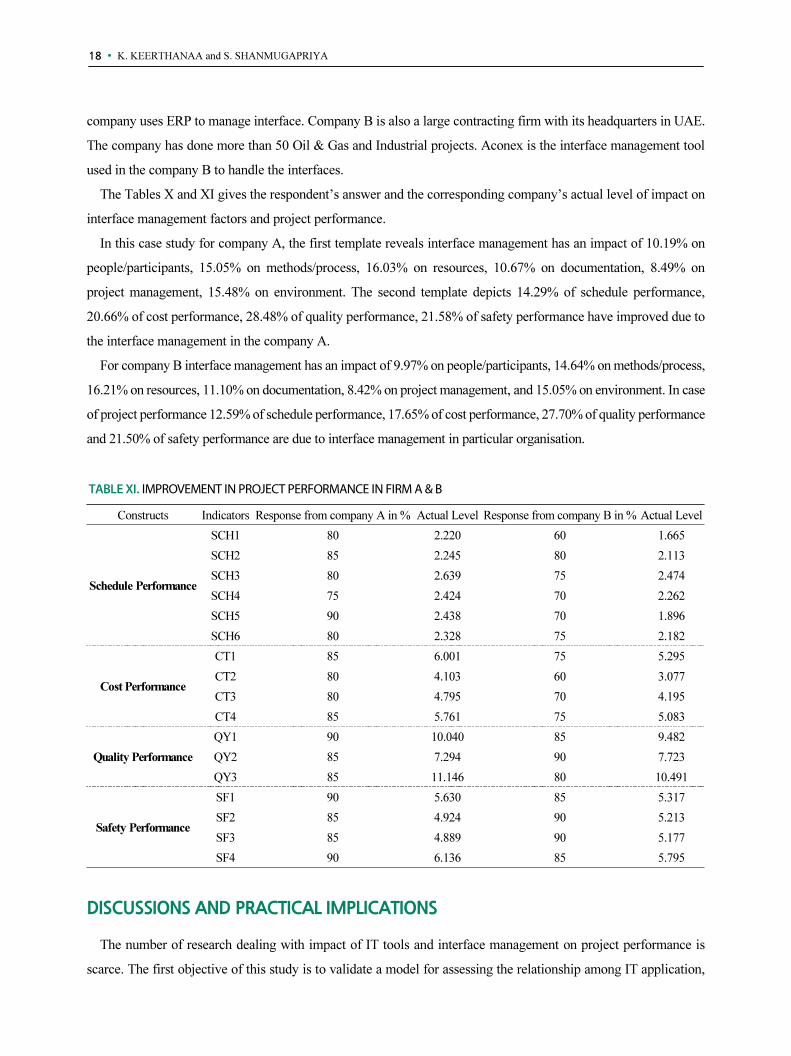
The Tables X and XI gives the respondent’s answer and the corresponding company’s actual level of impact on
interface management factors and project performance.
In this case study for company A, the first template reveals interface management has an impact of 10.19% on
people/participants, 15.05% on methods/process, 16.03% on resources, 10.67% on documentation, 8.49% on
project management, 15.48% on environment. The second template depicts 14.29% of schedule performance,
20.66% of cost performance, 28.48% of quality performance, 21.58% of safety performance have improved due to
the interface management in the company A.
For company B interface management has an impact of 9.97% on people/participants, 14.64% on methods/process,
16.21% on resources, 11.10% on documentation, 8.42% on project management, and 15.05% on environment. In case
of project performance 12.59% of schedule performance, 17.65% of cost performance, 27.70% of quality performance
and 21.50% of safety performance are due to interface management in particular organisation.
DISCUSSIONS AND PRACTICAL IMPLICATIONS
The number of research dealing with impact of IT tools and interface management on project performance is
scarce. The first objective of this study is to validate a model for assessing the relationship among IT application,
TABLE XI. IMPROVEMENT IN PROJECT PERFORMANCE IN FIRM A & B
Constructs Indicators Response from company A in % Actual Level Response from company B in % Actual Level
Schedule Performance
SCH1 80 2.220 60 1.665
SCH2 85 2.245 80 2.113
SCH3 80 2.639 75 2.474
SCH4 75 2.424 70 2.262
SCH5 90 2.438 70 1.896
SCH6 80 2.328 75 2.182
Cost Performance
CT1 85 6.001 75 5.295
CT2 80 4.103 60 3.077
CT3 80 4.795 70 4.195
CT4 85 5.761 75 5.083
Quality Performance
QY1 90 10.040 85 9.482
QY2 85 7.294 90 7.723
QY3 85 11.146 80 10.491
Safety Performance
SF1 90 5.630 85 5.317
SF2 85 4.924 90 5.213
SF3 85 4.889 90 5.177
SF4 90 6.136 85 5.795
A Conceptual Framework to Study the Effectiveness of Interface Management in Construction Projects ∙ 19
interface management and project performance. The PLS-SEM approach is used to validate the model. The
findings suggest the IT tools are widely used to support the Interface management, which can be inferred from the
hypothesis H7.The path coefficient of 0.723 indicates the influence of IT tools on interface management. The
model suggests that IT tools like BIM, Information sharing platforms, Interface database management system,
Video conference, E-mail, Auto-CAD are the effective tools that can be used to support the interface management
system. The construction managers should be aware of these IT tools to enhance the Interface management. Though
the previous studies shows that application of IT improves the interface management, no attempt is taken to develop
a model for assessing the relationships among IT application and Interface management [6]. This study attempted to
fill this knowledge gap in the literatures.
The hypothesized relationships H8-H11 are all positively significant which implies Interface management has a
significant effect on project performance in term of schedule, cost, quality & safety. Interface management
improves the communication chain among the stakeholders which helps in early detection of misinterpretations,
disputes which indirectly reduces schedule, cost, quality and safety issues. The findings show interface
management has more impact on schedule performance with a path coefficient of 0.711 in improving the project
performance. The interface management improves the schedule performance by reducing the disputes, stress
among the team and ensuring the timely completion of the project. The cost performance is enhanced by managing
financial risks and meeting the cost objectives of the project with the aid of interface management. The Interface
management helps in the reducing reworks by prior identification of flaws thus ensuring the quality performance.
The accidents and injury rate are reduced, which contributes to the safety performance of the project. The results of
this research show that project performance can be strengthened by identifying the interface points and effective
interface management. These results are also in line with the previous studies which show that interface
management practice act as an enabler for project performance [9, 10, 11, 12].
The second objective is to evaluate the mediating role of interface management in relationship between IT
application and project performance. Prior research indicates that IT plays an important role in interface
management [6]. The interface management is found to be associated with the project outcomes. However the
previous studies have not provided any insights into the mediating role of interface management in relationship
between IT application and project performance. By examining the indirect effects of IT application on project
performance in terms of schedule, cost, quality, safety, the research confirms that use of IT tools influence the
project performance via interface management.
The third objective is to examine the impact of interface management practice in solving the interfacial issues.
The hypotheses H1-H6 are positively significant which portrays proper interface management will have a positive
impact on people/participants, methods/process, documentation, project management and environment. The path
coefficients of these factors suggest interface management has greater impact (0.608) on people/participants, which
suggests interface management improves co-ordination, communication and trust among the project participants
which is in line with the previous studies [24]. The findings suggested proper sharing of interface information will
20 ∙ K. KEERTHANAA and S. SHANMUGAPRIYA
help to implement new technologies without any construction and assembly problems. The resource utilisation can
be optimised by interface practice by spotting the resource conflict points in advance. The interface management
practice uses interface management tools which make it easy for the construction practitioners to document the
interface information, change orders, etc. The findings report enhancement of interface management will have a
positive eye on project management practices. The Mega projects have cultural diversities due to the involvement
of multidisciplinary teams. These interface points can be effectively managed or improved by proper interface
management practice.
The case study reveals interface management has the greatest impact on resources in both organisations i.e.,
16.03% & 16.21% respectively. In case of company A project performance has improved by 85.01% and for
company B, 79.44% of project performance have enhanced due to interface management.
CONCLUSIONS
In summary, this research provided empirical evidence for gaining the project benefits with higher levels of
interface management practice and IT application adoption. The research findings provide that ensuring the
awareness of interface management, helps the project managers to identify the focus arena in a particular project to
enhance the project performance. The result of this study aids the construction organisations to predict their level of
interface management in their organisations and also to identify the factors to be focused to improve the interface
management in the organisation. The interface management can be enriched by the usage of IT application which
ultimately improves the project performance.
The major research limitation of this research is small sample size, although it is enough to carry out the analyses
using PLS-SEM approach. Further parts of model can be investigated in detail by introducing further casual
relationships among the constructs. The templates can be further developed to do study the impact of IT application
on interface management in construction firms.
REFERENCES
[1] Nooteboom, U, “Interface Management improves on time, on-budget delivery of mega projects”, JPT Online,
Society of Petroleum Engineers, 2004.
[2] Wideman, R.M, “Wideman comparative glossary of project management terms”, Vol 3, no: 1 ,2002.
[3] Froese, T.M.,” The impact of emerging information technology on project management for construction”,
Automation in Construction, Vol. 19, no. 5, pp. 531-538,2010.
[4] David & Myriam,“Use of WBS matrix to Improve Interface management in Projects”, ASCE-Journal of
Construction Engineering and Management, Vol. 132, no. 1, pp. 67-79, Jan 2006.
[5] Youngcheol Kang.,William J. O’Brien.,and James T. O’Connor, “IOP Tool: Assessing the Benefits and
Hindrances of Informat. on Integration Implementation Opportunities”, ASCE –Journal of Management in
Engineering, Vol. 28, no. 2, pp. 160-169, 2012.
A Conceptual Framework to Study the Effectiveness of Interface Management in Construction Projects ∙ 21
[6] Xuelian.," Influencing Factors for project Interface management", ASCE-ICCREM, pp. 448-456, 2013.
[7] Kalyan&Mundoli (2015)," Technology Enablers For Construction Information Supply Chain Management",
Proceedings of Indian Lean Construction Conference.
[8] Li-Ren Yang. , Jieh-Haur Chen., Hsiao-Wen Wang,“Assessing impacts of information technology on project
success through knowledge management practice”, Elsevier-Automation in Construction, vol. 22, pp.
182-191, 2012.
[9] Shokri, "Current State of Interface Management in Mega Construction Projects", ASCE- Construction
Research Congress, pp. 2266-2275, 2014.
[10] Shokri, S., Ahn, S., Lee, S., Haas, C. T., Haas, R. C G, “Current Status of Interface Management in
Construction: Drivers and Effects of Systematic Interface Management”, ASCE –Journal of Management in
Engineering, vol. 142, no. 2, 2015.
[11] Qian Chen., Georg Reichard and Yvan Beliveau. “Interface management –A Facilitator of Lean
Construction and Agile Project Management”-Proceedings IGLC-15, 2007.
[12] Corey Daniels, Clifton B. Farnsworth, and Justin Weidman, “Interface management on Mega Projects: A
Case study”, 50th ASC Annual International Conference Proceedings. 2014.
[13] Yang J.B and S.F. Ou, “Using structural equation modelling to analyze relationships among key causes of
delay in construction”, Canadian Journal of Civil Engineering, pp.321-332,2008.
[14] Molenaar, K., Washington, S. & Diekmann, J., “Structural equation model of contract dispute potential”,
Journal of construction engineering and management, Vol.126, No. 4, pp. 268-277,2000.
[15] Barclay, D., Higgins, C. , Thompson, R. “The Partial Least Squares (PLS) approach to causal modeling:
personal computer adoption and use as an illustration”, Technology Studies, pp. 285–309,1995.
[16] Cronbach, L.J. Coefficient alpha and the internal structure of tests”, Psychometrika, pp. 297-334,1951.
[17] Werts, C.E., Linn, R.L., and Joereskog, K.G., “Intraclass reliability estimates: testing structural assumptions”,
Educational and Psychological Measurement,pp.25-33,1974.
[18] Fornell, C., & Larcker, D. F, “Structural equation models with unobservable variables and measurement error:
Algebra and statistics”. Journal of Marketing Research, Vol.18, No.3, pp. 328-388, DOI:
10.2307/3150980,1981.
[19] Abiniu, A. A and Odeyinka, H. A, “Construction delays and their causative factors in Nigeria”, Journal of
Construction Engineering and Management”, pp. 667-677,2006.
[20] Cohen, J.,Statistical power analysis for the behavioural sciences”, Lawrence Erlbaum Associates Hillsdale,
NewJersey,1988.
[21] Chin, W. W. “ The partial least squares approach to structural equation modelling”, Modern Methods for
Business Research Erlbaum, Mahwah, NJ, pp. 295–336,1998.
[22] Akter, S., Ambra, J. D., & Ray, P. “Trustworthiness in mHealth Information Services: An Assessment of a
Hierarchical Model with Mediating and Moderating Effects Using Partial Least Squares (PLS)”, Journal Of
The American Society For Information Science And Technology, Vol. 62, no. 1, pp. 100–116, 2011.
[23] Cohen, J.,Cohen, P.,West, S. G., & Aiken, L. S. “Applied Multiple Regression/Correlation Analysis for the
Behavioral Sciences”, Lawrence Erlbaum Associates, Publishers, Mahwah, New Jersey, London, 2003.
[24] Qian Chen., Georg Reichard and Yvan Beliveau. “Multiperspective approach to Exploring Comprehensive
Cause Factors for Interface Issues”, ASCE -Journal of Construction Engineering and Management, Vol. 134,
no. 6, pp. 432-441, June 2008.