a concealed information test with multimodal measurement
TRANSCRIPT

International Journal of Psychophysiology 75 (2010) 258–267
Contents lists available at ScienceDirect
International Journal of Psychophysiology
j ourna l homepage: www.e lsev ie r.com/ locate / i jpsycho
A Concealed Information Test with multimodal measurement
Wolfgang Ambach a,⁎, Stephanie Bursch a, Rudolf Stark b, Dieter Vaitl a,b
a Institute for Frontier Areas of Psychology and Mental Health, Freiburg, Germanyb Bender Institute of Neuroimaging, University of Giessen, Germany
⁎ Corresponding author. Institut für Grenzgebiete dgiene, Wilhelmstr. 3A, D-79098 Freiburg, Germany. Tel.:761 20721 99.
E-mail address: [email protected] (W. Ambach).
0167-8760/$ – see front matter © 2009 Elsevier B.V. Adoi:10.1016/j.ijpsycho.2009.12.007
a b s t r a c t
a r t i c l e i n f oArticle history:Received 4 November 2009Received in revised form 2 December 2009Accepted 8 December 2009Available online 21 December 2009
Keywords:Concealed Information TestDeceptionVerbal stimuliPictorial stimuliOrienting reflexPerception
A Concealed Information Test (CIT) investigates differential physiological responses to deed-related (probe)vs. irrelevant items. The present study focused on the detection of concealed information using simultaneousrecordings of autonomic and brain electrical measures. As a secondary issue, verbal and pictorialpresentations were compared with respect to their influence on the recorded measures.Thirty-one participants underwent a mock-crime scenario with a combined verbal and pictorial presentationof nine items. The subsequent CIT, designed with respect to event-related potential (ERP) measurement,used a 3–3.5 s interstimulus interval. The item presentation modality, i.e. pictures or written words, wasvaried between subjects; no response was required from the participants. In addition to electroencephalo-gram (EEG), electrodermal activity (EDA), electrocardiogram (ECG), respiratory activity, and fingerplethysmogram were recorded.A significant probe-vs.-irrelevant effect was found for each of the measures. Compared to sole ERPmeasurement, the combination of ERP and EDA yielded incremental information for detecting concealedinformation. Although, EDA per se did not reach the predictive value known from studies primarily designedfor peripheral physiological measurement.Presentation modality neither influenced the detection accuracy for autonomic measures nor EEG measures;this underpins the equivalence of verbal and pictorial item presentation in a CIT, regardless of thephysiological measures recorded.Future studies should further clarify whether the incremental validity observed in the present study reflectsa differential sensitivity of ERP and EDA to different sub-processes in a CIT.
er Psychologie und Psychohy-+49 761 20721 25; fax: +49
ll rights reserved.
© 2009 Elsevier B.V. All rights reserved.
1. Introduction
In the last two decades, the psychophysiological detection ofconcealed information classically investigated using peripheralphysiological measures has been extended by the measurement ofbrain potentials and functional magnetic resonance imaging. Withrespect to the different dependent measures recorded, the presentwork focused on the simultaneous measurement of autonomic andbrain electrical responses in a Concealed Information Test (CIT) andquestioned for incremental information obtained from multimodalmeasures. As a secondary issue, verbal and pictorial presentationswere compared with respect to their influence on the detection ofconcealed information.
1.1. The Concealed Information Test
The Concealed Information Test (CIT), originally called GuiltyKnowledge Test (Lykken, 1959), aims at differentiating ‘guilty’ subjectsdeceptively denying their deed-related knowledge from ‘innocent’subjects truthfully denying knowledge. In order to detect concealedinformation, it compares a subject's physiological responses towards anumber of presented items, typically combined with yes-or-no ques-tions (for a review, see Elaad, 1998; Ben-Shakhar and Elaad, 2003). Eachdeed-related, ‘probe’ item is combined with several (typically four orfive) unknown, ‘irrelevant’ items of the same category (e.g. keys, tools),resulting in a set of items for each category. The items are presentedsetwise with the probe item never being presented first; also, the firstitem of each set is discarded from evaluation. It is assumed that onlya person with specific knowledge will distinguish between probe andirrelevant items. This distinction will be reflected in physiologicalmeasures even when the subject is trying to conceal his or her crucialknowledge. Subjects possessing the critical knowledgewill tend to showthe largest response within a set to the probe item. In contrast, for aperson without specific knowledge, a random pattern of responsemeasures is expected to occur without a preference for either the probeor the irrelevant items. If a CIT comprises six or seven sets of questions,

259W. Ambach et al. / International Journal of Psychophysiology 75 (2010) 258–267
the presence or absence of concealed knowledge can be assessed withconsiderable accuracy, i.e. relatively high correct-classification rates forguilty and innocent subjects (for meta-analyses on the accuracy of theCIT, see MacLaren, 2001 and Ben-Shakhar and Elaad, 2003). Deceptiveanswering is thereby not a necessary condition for the detection ofconcealed information, yet it has been shown to enhance the differentialphysiological response to probe compared to irrelevant items (Furedyand Ben-Shakhar, 1991).
1.2. Physiological measures in the detection of concealed information
Classically, the CIT is based on differential responses in peripheralphysiological measures, which mainly reflect functions of theautonomic nervous system. Besides skin conductance, which yieldsthe greatest effect sizes between probe and irrelevant items, phasicheart rate (pHR), respiration line length (RLL), and finger pulse wave-form length (FPWL) are known to be valid indicators of concealedinformation (Bradley and Janisse, 1981; Bradley and Rettinger, 1992;Elaad and Ben-Shakhar, 2006).
In the last two decades, a new approach based on EEG mea-surement has emerged in research on the detection of concealedinformation (for reviews, see Rosenfeld, 2002; Rosenfeld, 2005). Theendogenous components of ERPs, such as the P300, are generallyconsidered as correlates of higher-order cognitive processes, e.g.attention, stimulus evaluation, or context updating (Polich, 1986;Duncan-Johnson and Donchin, 1982; Donchin and Coles, 1988). TheP300 is typically elicited by the presentation of meaningful, rarestimuli randomly interspersed in a sequence of frequent non-meaning-ful stimuli (Duncan-Johnson and Donchin, 1977). In a CIT, the P300 issuperimposed over the brain waves between 300 and 800 ms afterstimulus presentation as a positive potential with its maximum at Pz,which is sensitive to concealed knowledge vs. irrelevant material(Rosenfeld et al., 1987; Farwell and Donchin, 1991). For statistics on anindividual level, the method was refined in order to specify confidenceintervals for the individual peak measure (Rosenfeld et al., 1991; Allenand Iacono, 1997; Abootalebi et al., 2006). The number of presentedstimuli was increased for EEG studies to improve the signal-to-noiseratio; interstimulus intervals (ISIs) were shortened (e.g. 864 stimuli persubject; ISI 1.85 s; Farwell and Donchin, 1991); verbal answers wereabandoned in order to reduce motor artifacts. Target stimuli as anadditional class of stimuli requiring a unique response from the subjectwere used in the majority of these studies; they focused the subject'sattention to the display; also, brain electrical responses to these targetstimuli served as a reference for analytic procedures (Farwell andDonchin, 1991). Besides the broad use of this three-class paradigm, acomparable detection accuracy was found using a two-class paradigmwithout target stimuli (correct detection rates for autobiographicalknowledge were 90% and 82%, respectively; Rosenfeld et al., 2006).
1.3. The combination of autonomic and central nervous measures
The measurement of the P300 amplitude, which mirrors cognitiveprocessing rather than merely the orienting response (Rösler et al.,1987), and the measurement of peripheral responses, which mainlyreflect autonomic functions and basal reflexes, might complement eachother rather effectively. However, combining EEG and peripheral mea-surement within the same experiment generally entails some difficul-ties: EEG evaluation on a single-trial basis is not very promising due to arather low signal-to-noise ratio. Therefore, in most ERP studies, a largenumber of stimuli are presented with short ISIs in order to obtain anadequate number of valid ERPsper condition. In contrast, EDAresponsesshow a markedly slower characteristic, which is opposed to the use ofshort ISIs. First, the overlap of EDA responses elicited with short ISIsmakes it difficult to quantify each single response (Barry et al., 1993).Second, response amplitudes become critically smaller with increasingpresentation frequency (Barry et al., 1993). Third, EDA responses are
known to habituate when a large number of stimuli are presented.Whereas the problem of overlapping responses can be solved bydecomposing skin conductance (Lim et al., 1997; Alexander et al., 2005;Ambach et al., 2008b), the two further problems inevitably limit thenumber of presented stimuli and the presentation frequency.
Typically, pHR measured in CIT studies shows a bi- or multiphasiccourse and a differential response between item types over a period of15 s after stimulus presentation (Gamer et al., 2006; Ambach et al.,2008a). RLL is usually scored over 15 or 10 s (Timm, 1982a,b; Gameret al., 2006); for FPWL, a typical scoring window is 15 s (Hirota et al.,2003; Elaad and Ben-Shakhar, 2006). For these measures, shorterscoring intervals e.g. 3–4 s after stimulus onset have to be used. Butnevertheless, overlapping influences of preceding trials are likely toincrease error variance; additionally, omitting relevant parts of thescoring interval and eliciting responses with an untypically highfrequency are likely to reduce effect sizes. In sum, the incrementalvalidity of autonomic measures in a CIT with short ISIs, primarilydesigned for ERP measurement, is unproven so far.
Simultaneous EDA and EEG measurement has been studied in thefield of orienting theory (Elton et al., 1983; Lyytinen and Näätänen,1987; Bahramali et al., 1997; Lim, 1999); methodological refinementswere introduced particularly in experimentswith short ISIs (Barry et al.,1993; Lazzaro et al., 1999; Williams et al., 2003). Only a few recentstudies have combined ERP and peripheral physiological measurementin the detection of concealed information (Gamer and Berti, 2010;Matsuda et al., 2009; conference abstract by Meijer et al., 2006). Theyhad different focuses but they all found incremental validity fromcombined measurement. With the exception of Meijer and colleagues,they used long ISIs, which favor peripheral measurement rather thanERPs. Interestingly, these studies shed light on the different CIT sub-processes reflected by central nervous and peripheral measures. Gamerand Berti (2010) did not find the typical probe-vs.-irrelevant differencefor P300; they discussed their relatively long ISIs as a possible reasonand suggested that further studies should investigate a combinedmeasurementwith theuse of shorter ISIs. Toour knowledge, thepresentstudy is the first to investigate multimodal measurement in a CITdesigned for ERP measurement.
1.4. Verbal and pictorial stimuli
Presentation modalities vary between studies of deception detec-tion.While the combination of a scenario-like encoding procedure (e.g.a mock crime) with real objects and a text-based interrogation is quitecommon in a CIT (e.g. Jokinen et al., 2006), fewer authors used picturesof objects as stimuli (e.g. Lefebvre et al., 2001; Verschuere et al., 2004);most ERP studies in this field used written words (e.g. Rosenfeld et al.,2006). Several studies investigated the effect of verbal vs. pictorialstimuli on the accuracy of the autonomic-basedCIT.While someauthorsfound a better detectability of concealed information with verbal thanpictorial stimuli using EDA (Ben-Shakhar and Gati, 1987; Gati and Ben-Shakhar, 1990), later studies did not confirm a difference betweenmodalities for EDA (Ben-Shakhar et al., 1996), pHR (Rill et al., 2003), orreaction times (Seymour and Kerlin, 2008). It may be questionedwhether these two stimulus types are differently effective in CIT basedon ERP measurement. The recent studies with combined ERP andperipheralmeasurement used either visual objects in a card test (Gamerand Berti, 2010) or spoken numbers (Matsuda et al., 2009), whichhampers a direct comparison. In the present study, we were interestedin a possible influence of pictures vs.writtenwords as stimuli in amock-crime study using a CIT with combined measurement.
1.5. Aim of the present study
The present study was designed to investigate the incrementalvalue of peripheral physiological measures in addition to P300 mea-surement in a CIT. The number of presented items and the ISI were
260 W. Ambach et al. / International Journal of Psychophysiology 75 (2010) 258–267
primarily chosen with respect to the elicited EEG responses, includingtheir scoring and analysis. A two-class paradigm, including only probeand irrelevant items allowed to abandon the demand of verbal ormotor answers.
As a secondary question, the aim was to compare the effects ofverbal and pictorial stimuli both presented visually, on the multi-modal measures recorded in a CIT. A variant of the mock-crimescenario accomplished the parallel encoding of specific knowledge aswritten words and as viewed real objects.
Our expectations were:
1. The P300 component of event-related potentials as well aselectrodermal activity (EDA), phasic heart rate (pHR), respirationline length (RLL), and finger pulse waveform length (FPWL) shoulddifferentiate between probe and irrelevant items in both presen-tation modalities.
2. The combination of the P300 and the autonomic measures wasexpected to yield incremental information and enhance CITaccuracy over sole P300 measurement. However, due to thestudy design directed to ERP measurement, the effect sizes forthe autonomic measures were expected to stay below thoseobtained from their sole measurement. We questioned which ofthe two opposing effects would prevail.
3. We questionedwhether verbal or pictorial stimulusmaterialwouldlead to a better detection of concealed information considering eachof the measures.
2. Materials and methods
2.1. Subjects
Thirty-one healthy students of various faculties (11 m, 20 f; meanage 25.0±4.6 years; 29 right-handed) voluntarily participated in thestudy. They were paid 17 Euros, with an additional incentive of 3Euros. Informed consent was obtained from all subjects.
2.2. Mock-crime scenario
In a shielded room, subjects had to handle nine objects accordingto a task list. For each participant, one particular object had beenrandomly drawn from each of the nine object categories. The writteninstruction did not suggest an association with criminal actions. Inorder to present all objects also as written words, each object wasmentioned four times within the text of the instruction list; thepertaining term was emphasized by bold type. Subjects took oneobject after the other into their hands, looked at it in detail, anddeposited it on top of a storage rack. Then they packed all nine objectsattentively into a suitcase placed in the same room. Object categorieseach comprising four objects were household items, key pendants,boxes, office material, cosmetics, wooden toy fruits, drink packages,sweets, and pieces of clothing. Finally, subjects came across a small
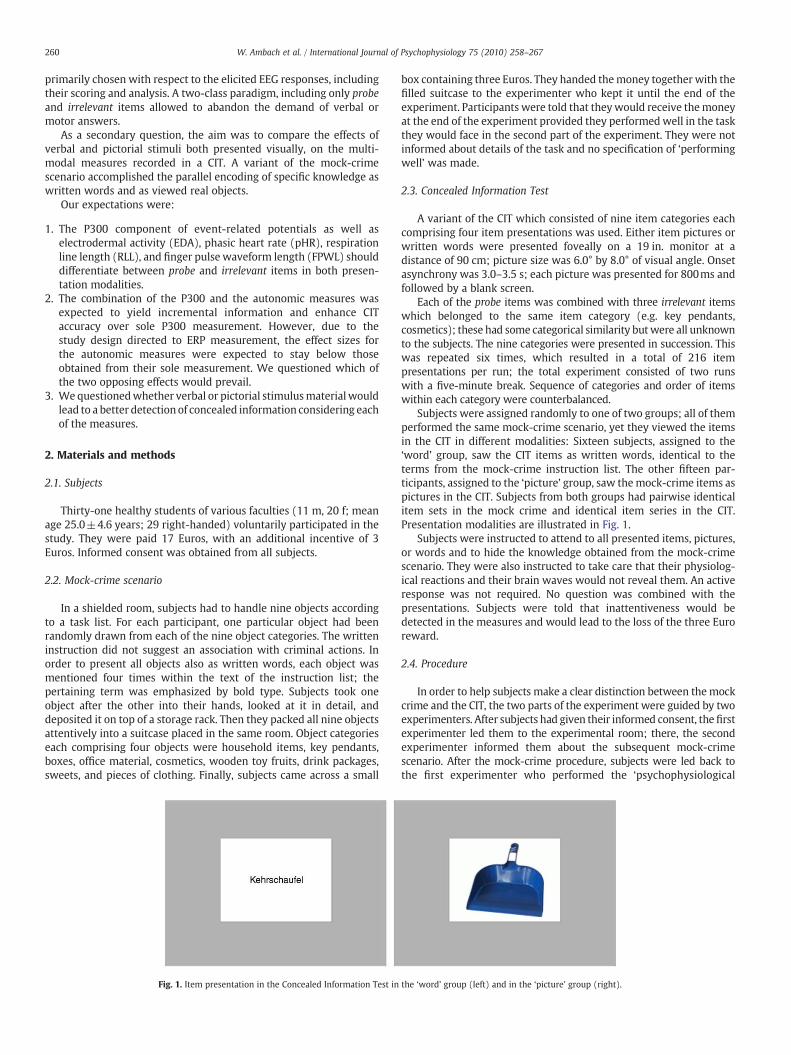
Fig. 1. Item presentation in the Concealed Information Test in
box containing three Euros. They handed themoney together with thefilled suitcase to the experimenter who kept it until the end of theexperiment. Participants were told that theywould receive themoneyat the end of the experiment provided they performedwell in the taskthey would face in the second part of the experiment. They were notinformed about details of the task and no specification of ‘performingwell’ was made.
2.3. Concealed Information Test
A variant of the CIT which consisted of nine item categories eachcomprising four item presentations was used. Either item pictures orwritten words were presented foveally on a 19 in. monitor at adistance of 90 cm; picture size was 6.0° by 8.0° of visual angle. Onsetasynchrony was 3.0–3.5 s; each picture was presented for 800ms andfollowed by a blank screen.
Each of the probe items was combined with three irrelevant itemswhich belonged to the same item category (e.g. key pendants,cosmetics); these had some categorical similarity butwere all unknownto the subjects. The nine categories were presented in succession. Thiswas repeated six times, which resulted in a total of 216 itempresentations per run; the total experiment consisted of two runswith a five-minute break. Sequence of categories and order of itemswithin each category were counterbalanced.
Subjects were assigned randomly to one of two groups; all of themperformed the same mock-crime scenario, yet they viewed the itemsin the CIT in different modalities: Sixteen subjects, assigned to the‘word’ group, saw the CIT items as written words, identical to theterms from the mock-crime instruction list. The other fifteen par-ticipants, assigned to the ‘picture’ group, saw themock-crime items aspictures in the CIT. Subjects from both groups had pairwise identicalitem sets in the mock crime and identical item series in the CIT.Presentation modalities are illustrated in Fig. 1.
Subjects were instructed to attend to all presented items, pictures,or words and to hide the knowledge obtained from the mock-crimescenario. They were also instructed to take care that their physiolog-ical reactions and their brain waves would not reveal them. An activeresponse was not required. No question was combined with thepresentations. Subjects were told that inattentiveness would bedetected in the measures and would lead to the loss of the three Euroreward.
2.4. Procedure
In order to help subjects make a clear distinction between themockcrime and the CIT, the two parts of the experiment were guided by twoexperimenters. After subjects had given their informed consent, the firstexperimenter led them to the experimental room; there, the secondexperimenter informed them about the subsequent mock-crimescenario. After the mock-crime procedure, subjects were led back tothe first experimenter who performed the ‘psychophysiological
the ‘word’ group (left) and in the ‘picture’ group (right).
1 The shorter time window for RLL, pHR, and FPWL was chosen in order to avoidoverlaps — although effect sizes are expected to decline when shortening the scoringwindow.
2 See footnote 1.3 See footnote 1.
261W. Ambach et al. / International Journal of Psychophysiology 75 (2010) 258–267
investigation’. EEG and EOG electrodes were attached and the leads fortheperipheralmeasureswerehookedup. TheCITwas then initiated; thetwomain runswere preceded by a short training run consisting of threesets each comprising four neutral items (without relevance). Aftercompleting both main runs of the CIT and being disconnected from theleads, subjects performed amemory test. In this test, all four pictures ofeach category, one item category after the other, were simultaneouslypresented on the screen and subjects were asked to identify the probeitem within each of the nine categories.
2.5. Physiological measurement
The physiological recordings took place in a dimly lit, electricallyand acoustically shielded experimental chamber (Industrial AcousticsGmbH, Niederkrüchten, Germany). Subjects sat in an upright positionso that they could comfortably see the monitor. Temperature in thecabin was set at 21 °C at the beginning of the first run, with anincrease of maximum 2 °C throughout the course of the experiment.
EEG data were recorded from nineteen electrodes according to thestandard 10–20 positions (Jasper, 1958), against linked mastoids asreference. Impedances were kept below 5 kΩ; Ag–AgCl electrodeswere attached to the skin with the use of Easy Caps and abrasive gel(both by Falk Minow, München, Germany). Vertical and horizontaloculogram was recorded. A Synamps amplifier (NeuroScan, Inc.) wasused; EEG was band-pass filtered at 0.15–70 Hz, A/D-converted,sampled at 500 Hz and saved to disc using the software Acquire(Version 4.3.1; Neurosoft, Inc.).
Skin conductance (EDA), respiratory activity, electrocardiogram(ECG), and finger plethysmogram were registered. Physiologicalmeasures were A/D-converted and logged by the Physiological DataSystem I 410-BCS manufactured by J&J engineering (Poulsbo, Washing-ton). The A/D-converting resolution was 14 bit, allowing skinconductance to be measured with a resolution of 0.01 µS. All datawere sampled with 510 Hz. Triggers indicating stimulus onsets wereregistered with the same sampling frequency.
For skin conductance recordings, standard Ag/AgCl electrodes(Hellige; diameter 0.8 cm), isotonic signa electrode creme (ParkerLaboratories Inc.) and a constant voltage of 0.5 V were used. Theelectrodes were fixed at thenar and hypothenar sites of thenondominant hand.
For registration of thoracic and abdominal respiratory activity, twoPS-2 biofeedback respiration sensor belts (KarmaMatters, Berkeley,California) with a built-in length-dependent electrical resistancewereused. They were fixed at the upper thorax and the abdomen.
ECG was measured with Hellige electrodes (diameter 1.3 cm)according to Einthoven II.
Finger pulse signal was transmitted by an infrared system in a cuffaround the middle finger of the nondominant hand.
2.6. Data processing
EEG data from one subject were lost due to a technical failure.Ocular artifacts were eliminated using a rejection criterion of 80 µV inthe HEOG and/or VEOG. Artifact-free segments of 1.7 s lengthbeginning 100 ms before stimulus onset were the data base for thestatistical analyses. Data were filtered with a low cutoff of 0.3 Hz(12 dB/oct.) and a high cutoff of 6 Hz (12 dB/oct.).
EDA data from three subjects were discarded from analysisbecause of complete non-responding. Skin conductance reactionswere assessed via a computerized method based on the decomposi-tion of overlapping reactions as proposed by Lim et al. (1997). Thismethod was chosen because subsequent physiological reactions wereexpected to overlap considerably due to the short ISIs. Lim (1999)showed in an experiment with short ISIs that conventional trough-to-peak evaluation is inadequate with short ISIs, because the first of twosubsequent reactions causes a diminishing bias in the estimation of
the second one. The size of this bias is determined by the size of thefirst reaction and by the time interval between both reactions.Decomposition aims at overcoming this problem of overlapping EDAreactions. The decomposing algorithm employed in the present studyhas initially been used by Ambach et al. (2008b). In a curve-fittingprocedure guided by minimizing error squares, model coefficients arefirst optimized for each subject. Then, in a second step, all trials areevaluated by decomposing EDA using each subject's individual modelcoefficients. The use of individually constant templates for thecalculation of EDA responses reflects the assumption of individualresponse characteristics of the electrodermal system. Third, magni-tudes of all EDA responses elicitedwithin a timewindow of 0.5 to 3.0 safter item presentation are additively combined. As the decomposedresponses are not calculated as trough-to-peak amplitudes but ratheras relative activity, the unit of thesemeasures is arbitrary and dependson each subject's individual template. (Transformation into µS is notrequired because of subsequent within-subject standardization.)
Respiratory data of two subjects had to be discarded fromevaluationbecause of sensor artifacts. After low-pass filtering, the total RLL wasautomatically computed over a time interval of 3.5 s after trial onset;data from the thoracic and the abdominal channel were averaged.The RLL measure integrates information about frequency and depthof respiration. The method was derived from Timm (1982a,b); in thepresent study, a shorter time window was chosen due to short ISIs.1
ECG data obtained from two subjects had to be excluded fromanalysis because of frequent extrasystoles. After notch filtering at 50 Hz,R-wave peaks were automatically detected and visually controlled. TheR–R intervals were transformed into heart rate (HR) and real-timescaled (Velden and Wölk, 1987). The HR during the last second beforetrial onset served as pre-stimulus baseline. The pHR was calculated bysubtracting this baseline value from each second-per-second post-stimulus value. For extracting the trial-wise information of the phasicHR, the mean change in HR within 4 s after trial onset, compared withthe pre-stimulus baseline, was calculated (Bradley and Janisse, 1981).2
Finger pulse waveform data from three subjects were excludedbecause of insufficient signal transmission of the sensor. The fingerpulse waveform length (FPWL) within the first 3.5 s after trial onsetwas calculated and subjected to further analyses. The FPWL comprisesinformation about both HR and pulse amplitude.3
A within-subject standardization of measured values has beenproposed by Lykken and Venables (1971). According to Ben-Shakhar(1985), Gronau et al. (2005), and Gamer et al. (2006), thephysiological and behavioral measures are z-transformed for eachsubject, each run, and each data channel. All probe and irrelevant trialsof one run of the experiment (not including the first trials of eachstimulus category) were used to calculate individual means andstandard deviations (Ambach et al., 2008a). The z-transformed valueswere used in subsequent statistical analyses.
2.7. Statistical analysis
For the analysis of EEG signals on an individual basis, the boot-strapped amplitude difference (BAD) method was applied on theartifact-free probe and irrelevant EEG segments (Rosenfeld et al., 2004;Abootalebi et al., 2006). This non-parametrical method calculates theconfidence intervals for the probe and irrelevant P300 for each subjectand each EEG channel and allows to assess the statistical significance ofthe individual probe-vs.-irrelevant difference. Correct classification of asubject as knowledgeable was based on a significance criterion ofp<0.1. While the results from all EEG channels were visualized, the

Table 1Means and standard errors of means (SEM) of raw scores for each data channel. Probe vs. irrelevant items are contrasted separately for both groups and over groups.
‘word’ group ‘picture’ group Over groups
Probe items Irrelevant items Probe items Irrelevant items Probe items Irrelevant items
Mean (SEM) Mean (SEM) Mean (SEM) Mean (SEM) Mean (SEM) Mean (SEM)
P300 [µV] 11.57 0.53 10.22 0.59 11.73 0.61 10.06 0.42 11.65 0.40 10.14 0.37EDA [nS] 156.32 38.26 146.12 37.57 114.32 30.32 97.50 26.70 135.32 24.10 121.81 23.03RLL [arb. units] 1021.2 128.04 1047.6 134.2 1236.2 153.0 1259.6 159.3 1128.7 98.7 1153.6 104.2pHR [1/min] −0.32 0.149 0.13 0.077 −0.34 0.217 0.15 0.10 −0.33 0.14 0.14 0.06FPWL [arb. units] 36,592 10,167 37,055 10,186 34,426 4503 33,996 4494 35,509 5311 35,526 5193
262 W. Ambach et al. / International Journal of Psychophysiology 75 (2010) 258–267
statistical analysis was limited to channel Pz, where P300 is typicallylargest. P300 amplitude was determined as a peak-to-peak measure(Soskins et al., 2001): in detail, it was defined as the difference betweenthe maximally positive segment average of 100 ms within a windowfrom 400 to 1000 ms post-stimulus and themaximumnegative 100-mssegment in the window bounded by P300 latency and 1600-ms post-stimulus (Soskins et al., 2001).
In addition to the bootstrap method and in order to integrate theP300 into the multimodal evaluation, P300 amplitudes were deter-mined for each subject's mean ERPs, according to the above scoringmethod, separately for probe and irrelevant trials. These P300 amplitudevalues were subjected to the statistical procedure described below.
All further statistical analyses were performed with SPSS, Version12.0 (SPSS Inc., Chicago). For each physiological and behavioralmeasure,a 2×2×2 ANOVA was first calculated with the within-subject factorsProbe (probe vs. irrelevant trials) and Run (first vs. second run) and thebetween-subjects factor Group (‘word’ vs. ‘picture’ group); the factorGroup was later dropped from the analyses. Because a mean differencebetween the two instructional groups was not of interest, ANOVAs forthe peripheral measures were calculated on the basis of z-values from awithin-run standardization; consequently, no main effects for thefactors Group and Run are reported. Significance level for the assess-ment of main and interaction effects was set to 0.05. Follow-up t-testsfor matched samples (one-tailed, significance level 0.05) were carriedoutwhen interactionswere found. Cohen's dwas calculated as estimateof effect size (Cohen, 1988; Rosnow and Rosenthal, 1996).
For an integration of the multimodal measures, the incrementalvalidity of each measure and the validity of an optimized combinationof the central nervous with the peripheral physiological measureswere additionally evaluated using a binary logistic regression model.This procedure adopted from applied psychophysiology aimed atidentifying the contribution of the various measures included aspredictors in the model to classify subjects as ‘guilty’ or ‘innocent’.Since all subjects had deed-related knowledge, hypothetical distribu-
Fig. 2. Effect sizes for the differential responses to probe vs. irrelevant items: for the ‘word’ a(EDA), phasic heart rate (pHR), respiration line length (RLL), and finger pulse waveform le
tions of responses to probe and irrelevant stimuli for an equal numberof ‘innocent’ participants were calculated (Carmel et al., 2003; Allenand Iacono, 1997; Meijer et al., 2007). For this purpose, the numericresults obtained from probe trials were replaced by numeric resultsdrawn randomly (with replacement) from the results obtained fromthe same subject's irrelevant trials. First, a stepwise inclusion ofparameters was performed following a Wald statistic with probabil-ities for inclusion and exclusion set to 0.05 and 0.10, respectively.Second, in order to estimate the predictive value of each measure perse, they were included singularly in an analogous regression analysis.Shrinkage correction of the regressionmodelwas performed using thehold-one-out method (Copas and Corbett, 2002; Gamer et al., 2006);each subject was once held out of the calculation, resulting in 32different logistic regressionmodels for the ‘word’ group and 30 for the‘picture’ group. The calculation of sensitivity and specificity was thenbased on the data from the held-out subjects. According to the equalnumbers of guilty and hypothetical innocent subjects, subjects werefirst classified as guilty or innocent using a p<0.5 criterion. The ROCcurve reflects the ‘guilty’-vs.-‘innocent’ differentiation capability of thesingle measures and their optimal combination for all possible cutoff-points; the area under the ROC curve, varying between 0 and 1 with achance level of 0.5, serves as an overall index of detection accuracy(Bamber, 1975; Ben-Shakhar and Elaad, 2003; Gronau et al., 2005).
3. Results
In the final memory test, 99.3% of probe items were identifiedcorrectly (99.3% in the ‘word’ and 99.3% in the ‘picture’ group);categories with false identification were discarded from evaluation.
Table 1 summarizes means and standard errors of means of rawscores for eachdata channel, collapsedoverboth runs of theexperiment.
Fig. 2 illustrates the differential response to probe vs. irrelevantitems for the ‘word’ and the ‘picture’ condition. Estimated effect sizesare depicted for each of the physiological measures.
nd the ‘picture’ group, Cohen's d is depicted for P300 amplitude, electrodermal activityngth (FPWL).

263W. Ambach et al. / International Journal of Psychophysiology 75 (2010) 258–267
3.1. Event-related potentials
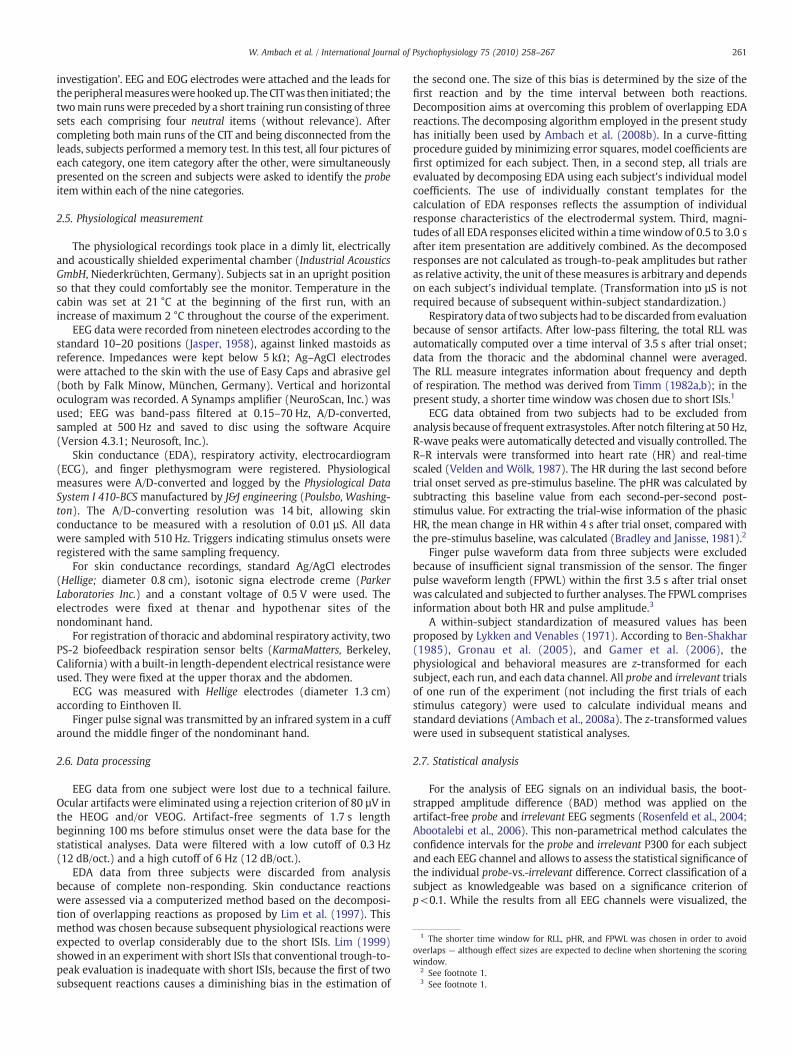
Fig. 3 shows the EEG grandmeans at electrode site Pz for probe andirrelevant items separately for the ‘word’ and the ‘picture’ group.Regarding the course of ERPs, it might be suspected that verbal stimuliled to a differentiation between probe and irrelevant stimuli thatoccurred earlier within a trial, i.e. after about 250 ms for the verbal vs.300 ms for the pictorial condition. With respect to trial-wise responsescoring however, the conditions did not differ in significance or size ofthe effect. An evaluation of the sub-components of the P300, or ERPcomponents other than the P300, was not subject of our hypotheses.
For both conditions, grandmeans of the event-related potentials atthe electrode Pz showed a larger positivity for probe than for irrele-vant trials within a time window from 300 to 800 ms.
All statistics, which will be reported hereafter, were first per-formed with Group as a between-subjects factor (“word” group vs.“picture group”); a t-test was performed to compare the bootstrapresults for P300 from both groups. Since it emerged that for none ofthe measures a Group main effect or interaction with either Probe orRun was found, this factor was dropped from the analyses and allparticipants were thereafter analyzed as one group. As the ANOVAwas based on within-run standardized data, a possible main effect forRun is outside of scope.
The BAD procedure, whichwas applied to assess the significance ofthe peak-to-peak amplitude difference between probe and irrelevanttrials for each subject, revealed a significantly positive amplitudedifference (p<0.1) in 22 of 30 subjects. Assuming the mutualindependence of the individual bootstrap results, the individualsignificance levels can be combined towards an overall assessment ofsignificance via z-values (originally from Stouffer et al., 1949). Thesignificance levels p obtained for each subject were transformed intoz-values by the inverse Gaussian function. Overall assessment of thesignificance of differential responding to probe vs. irrelevant stimulifor the entire study was then accomplished by collapsing the z-values
over subjects according to zoverall = 1ffiffi
np ∑
n
i=1zi where zoverall reflects
the overall significance for the study in terms of a z-standardizedvalue, n is the number of participants, and zi is the z-value for the i-thsubject. The resulting overall z-value was 7.61, which correspondswith a significance level of p<0.001.
ANOVA for P300 amplitude showed a main effect for Probe(F1,29=24.83; p<0.001; d=1.69) with the larger mean amplitudefor probe than for irrelevant trials. No interaction Run by Probe(F1,29=2.13) was found.
3.2. Skin conductance
After decomposition and z-standardization of EDA responses,ANOVA showed a main effect for Probe (F1,27=16.38; p<0.001;d=1.55) and a Probe by Run interaction (F1,27=16.46; p<0.001);reactions to probe items were greater than to irrelevant items in thefirst but not in the second run (t27=4.32; p<0.001; d=1.08 andt27=0.81; p>0.1, respectively).4
3.3. Respiration
ANOVA for RLL data showed a main effect for Probe (F1,28=7.93;p<0.01; d=1.06). No interaction Run by Probe (F1,28=2.13) wasfound. Respiration was lower in probe than in irrelevant trials.
4 In an additional analysis, EDA effect sizes and classification rates were determinedseparately for each run. Although the second run, per se, showed a poor item-typedifferentiation, analyzing just the first run did not outperform the analysis of both runstogether.
3.4. Heart rate
Second-per-second values of HR after trial onset for probeand irrelevant items are depicted for both experimental groupsin Fig. 4. A decelerative HR response was seen in probe but notin irrelevant trials; the patterns for both groups were visuallyidentical.
ANOVA for pHR data showed a main effect for Probe (F1,28=7.83;p<0.01;d=1.04) and a Probe by Run interaction (F1,28=5.58;p<0.05).HR decelerations were enhanced after probe items compared with irre-levant items; this effect was more pronounced in the first than in thesecond run (t28=−4.73; p<0.001; d=−1.16 and t28=−0.91; p>0.1,respectively).
3.5. Finger pulse
ANOVA for FPWL revealed a main effect for Probe (F1,27=4.87;p<0.05; d=0.90); FPWL values were lower in probe than in irrelevanttrials. No interaction Probe by Run (F1,27=0.42) was found.
3.6. Logistic regression model
The binary logistic regression and the following results refer to adiscrimination between guilty and hypothetical innocent subjectsusing P300, EDA, pHR, RLL, and FPWL as predictors. In the first ana-lysis, only P300 was included. The second analysis used a stepwiseinclusion following theWald statistic; this led to the inclusion of P300and EDA only; none of the further measures pHR, RLL, and FPWLyielded incremental validity. Optimal weights, standard errors, Waldstatistic, and significance levels for both analyses are summarized inTable 2.
Correct-classification rates (criterion: p>0.5 for classification asguilty, according to the percentage of guilty subjects) with P300were 70.4% for guilty subjects and 73.1% for the hypotheticalinnocents (shrinkage-corrected using the hold-one-out method),whereas the combination of P300 and EDA, which were included bythe Wald statistic, classified 75% of guilty and 81.5% of innocentsubjects correctly. Rates of false-positive (classification of an inno-cent subject as guilty) and false-negative outcomes (classification ofa guilty subject as innocent), obtained under variation of the cutoffpoint for decision can be summarized in ROC curves. Areas underthese curves, reflecting overall accuracy of subject classification,were 0.738 (0.613–0.863) with only P300, and 0.829 (0.715–0.943)when combining P300 and EDA. An additional analysis taking thecorrelation between paired ROC areas into account was performedin order to assess the significance of the difference between ROCareas (Hanley and McNeil, 1983). The analysis exactly following theprocedure described by Hanley and McNeil (1983) resulted in a z-value of 1.89, corresponding to a significance level of p=0.029.Thus, the incremental validity of EDA over P300 is reflected in theresults of the Wald statistic as well as in the difference between ROCareas.
4. Discussion
The presented CIT study is regarded as a fundamental stepcontributing to the methodology used in the detection of con-cealed information and to the integration of different existingapproaches. Recent publications underline the interest in studyingthe combination of EEG and autonomic measurement in decep-tion detection (Gamer and Berti, 2010; Matsuda et al., 2009).The study focused on investigating the incremental validity ofperipheral physiological measurement over ERPs in a CIT with com-bined measurement. As a secondary issue, the modality of CIT sti-muli was varied; either pictures of objects or written words werepresented.
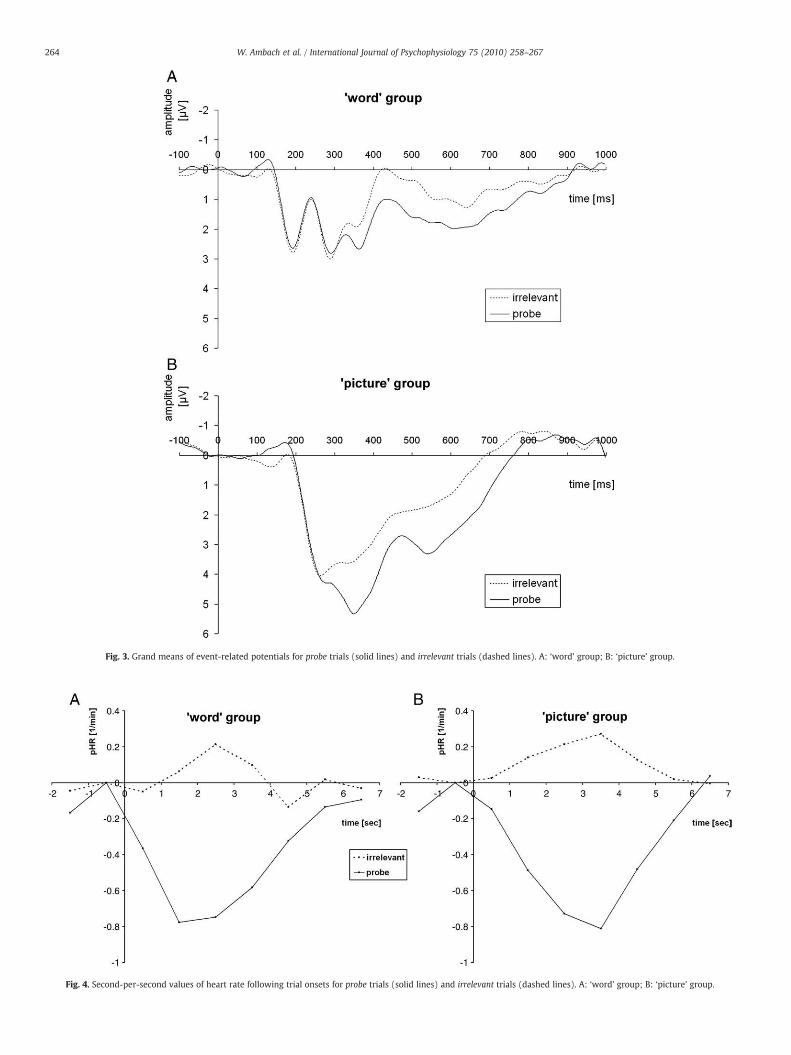
Fig. 3. Grand means of event-related potentials for probe trials (solid lines) and irrelevant trials (dashed lines). A: ‘word’ group; B: ‘picture’ group.
Fig. 4. Second-per-second values of heart rate following trial onsets for probe trials (solid lines) and irrelevant trials (dashed lines). A: ‘word’ group; B: ‘picture’ group.
264 W. Ambach et al. / International Journal of Psychophysiology 75 (2010) 258–267

Table 2Physiological measures included in the binary logistic regression analyses: optimalweights (β), standard errors (SE) of β, Wald statistic and significance level (p) are listedfor the analyses with inclusion of only P300 amplitude (P300) and with stepwiseinclusion (Wald statistic) of P300 and electrodermal activity (EDA).
Measure β SE Wald p
Only P300P300 5.490 1.880 8.53 0.004Constant −0.338 0.329 1.06 0.304
StepwiseP300 7.273 2.378 9.35 0.002EDA 10.938 3.630 9.08 0.003Constant −1.016 0.438 5.38 0.204
265W. Ambach et al. / International Journal of Psychophysiology 75 (2010) 258–267
4.1. Combination of EEG and autonomic measurement
Brain electrical measurement as well as each of the autonomicmeasures revealed a significant difference between probe and irrele-vant items and thus turned out to be sensitive to concealed infor-mation. This seems particularly noteworthy against the backgroundof the short ISIs employed which are untypical with autonomicmeasurement.
The modality of stimulus presentation in the CIT, i.e. object pic-tures vs. written words, did not influence the physiological responsedifferences between probe and irrelevant stimuli; this holds for eachof the measures recorded; data from all participants were furtheranalyzed without respect to presentation modality.
Among the dependent measures, P300 peak-to-peak amplitudeyielded the greatest overall effect size and was the first predictorincluded in the regression analysis. A comparison among the singlemeasures with respect to their validity as a single predictor was notthe aim of the study; additionally, such a comparison would not bevery meaningful since the study design and parameters cannot bechosen optimally for all measures simultaneously.
The main question of the study was whether the autonomic mea-sures would yield incremental information over ERPs. This questionwas positively affirmed with the help of two regression analyses.Following P300, EDA was included in the stepwise regression analysisas a significant second predictor. This also led to visibly higher correct-classification rates in comparison to sole P300; the correspondingincrease in the area under the ROC was significant. Gamer and Berti(2010) argue that the finding of incremental validity indicates that thecentral and the autonomic nervous system are differentially respon-sive to concealed information. While we confirmed an incrementalvalidity of EDA over ERPs, it is still an open question whether thisfinding is due to the reflection of different sub-processes of the CIT orjust to a reduction of error variance by additional data.
4.2. Small effect sizes
Looking at the measures in detail reveals that the effect sizes ofeach of the measures as well as the correct-classification rates in thisstudy remained below those of most CIT studies; this holds for acomparison with ERP-based as well as with autonomic-based studies.
Several reasons might account for this:With respect to the autonomic measurement, the use of short ISIs
and the presentation of a great number of items are supposed to havediminished the physiological responses as well as item-type effects.Electrodermal as well as cardiovascular and respiratory responses areknown to accept a decrease in their phasic amplitudes as well as intheir probe-vs.-irrelevant effect sizes when they are elicited with ahigher stimulus frequency. The relatively small raw scores of thephasic EDA and pHR responses are in line with this; the EDA rawamplitudes are comparable to those from other studies with short ISIs(e.g. Barry et al., 1993) but far smaller than in most autonomic-basedCIT studies (e.g. Ambach et al., 2008b; for an overview, see Ben-
Shakhar and Elaad, 2003). On the level of data analysis, the inevitableuse of uncommonly short scoring intervals, e.g. 4 s for the phasiccardiovascular and respiratory responses, adds to this problem. Inaddition, habituation effects might be more pronounced than instudies with a smaller number of repetitions of each single stimulus.The observed decrease of the differential (probe vs. irrelevant) EDAresponse from the first to the second run provides an impressiveevidence of this.
For ERPs, the large number of trials led to a sufficient number ofepochs to be averaged and thereby, meaningful effect sizes andcorrect-classification rates. Yet a comparison with other ERP-basedCIT studies (e.g. Rosenfeld et al., 2006) revealed a decreased meandifference of P300 amplitudes between probe and irrelevant trials anda smaller effect size. One possible reason for this might be the use of atwo-class paradigm without target stimuli. Rosenfeld et al. (2006)found this paradigm equivalent from a statistical perspective, yet itmight still be questioned whether the omission of targets might haveaffected the subjects' attention. Yet, whereas Rosenfeld et al. (2006)gave special instructions (announcing unpredictable interruptions inthe experiment asking for the name of the last-shown object) in orderto maintain the subjects' attention, no such instructions were given inthe present study. Hence, the subjects' attention was not fullyguaranteed, which is most likely the reason for the rather small effectsizes observed. Furthermore, the omission of a deceptive answer isknown to reduce CIT accuracy in the classic, autonomic-based CIT(Furedy and Ben-Shakhar, 1991) as well as in the ERP-based CIT(Verschuere et al., 2009a). One might suspect that the completeomission of answers and the ‘quiet’ course of the experiment, whichwere chosen in order to reduce motor artifacts, might have reducedthe subjects' attention, motivation and involvement in the experi-ment even more and might thereby have diminished not onlyautonomic but also ERP responses. The omission of a criminal contextin the mock-crime instruction might have contributed to this.
While it was not surprising to find smaller effect sizes than studies,which used either brain electrical or autonomic measurement sing-ularly, the question of interest was whether such a reduction of effectsin the single measures would be outbalanced by the incrementalinformation obtained from the multimodal measurement. As a com-mon procedure in the research on the detection of concealed infor-mation, logistic regression analysis was employed to estimate theincremental information of the peripheral measures over ERPs withrespect to subject classification as ‘guilty’ or ‘innocent’. While EDAresponses yielded incremental validity over ERPs, absolute anddifferential response amplitudes were visibly lower than in otherstudies using unimodal measurement; the same holds for the overallcorrect-classification rates. In sum, the incremental information fromthe multimodal measurement did not outbalance the drawbacksarising from the trade-off between the adverse requirements from thesingle measures.
In a CIT study with combined measurement and ISIs of 7 to 9 s,Gamer and Berti (2010) did not find a significant P300 amplitudedifference between honest denial of knowledge and its concealment;they argue, P300 is sensitive to task relevance rather than to encodedinformation. In the present study, P300 was found sensitive to theinformation encoded during the mock crime; this seems notable sinceno verbal or motor response was required from the subjects. Asoutlined, this difference might be due to the longer ISIs used whichmight have reduced differential responding; yet, it might still beargued that P300 depends on task relevance, since in the presentstudy, the knowledge from the mock crime was linked to a specificinstruction, namely to hide the knowledge silently and not to letanything show.
In a further CIT study with combined measurement, Matsuda et al.(2009) presented acoustic stimuli every 22 s. They reported differen-tial responding to concealed information for each of the autonomicmeasures but not for P300 amplitude, which they discuss as being due

266 W. Ambach et al. / International Journal of Psychophysiology 75 (2010) 258–267
to a ceiling effect on the P300 amplitude. In the light of the presentresults, the frequency (and number) of stimulus presentations instudies with combined measurement determines the relative validityof autonomic measures vs. P300 amplitude. As the different ap-proaches suggest, an optimal experimental trade-off between therequirements from both types of measures, which would entailsignificant and meaningful results for each of the measures, has notbeen employed so far; this study appears to mark the short end ofpossible ISIs.
4.3. Verbal vs. pictorial stimuli
While for both stimulus presentation modalities (i.e. verbal andpictorial) significant probe-vs.-irrelevant effects for eachmeasurewererevealed by the analyses of variance, no significant difference in theseeffects was found between modalities. For P300, the results from thebootstrap method confirmed the equivalence of modalities, as did theanalyses of variance for each of the measures. Visual inspection ofmean EDA responses suggested a greater (probe-vs.-irrelevant) effectsize for the pictorial condition; this difference was however notsignificant.
It may further be questioned whether the CIT presentationmodalities can be compared adequately using the ‘double encoding’procedure employed here. The finding that nearly 100% of subjects inboth groups remembered all presented stimuli correctly, suggests asufficient encoding in both conditions with respect to memorability.Beyond memorability however, an equivalent encoding of bothmodalities was not proven. Not only the presentation modality assuch but also the detailed specifications of the item presentation (orthe contact with the item) during the encoding phase might haveinfluenced the physiological responses and the observed effects in theCIT. The fact that modality was varied only in the CIT but not in themock crime, makes it difficult to generalize the finding that CITaccuracy was independent from stimulus modality. With respect toERP-based CIT however, the results suggest that the verbal material,which was predominantly used so far, might be replaced withecologically more valid stimuli without accepting a decrease in CITaccuracy. Further ERP studies might clarify this by independentlyvarying stimulus modalities in the encoding procedure and in the CIT.
5. Conclusions
The present study found incremental validity from EDA over theERPs measured simultaneously. Yet, the benefit of incrementalinformation did not outbalance the accepted decrease in effect sizesin each of the singular measures. It is not clear whether the combinedmeasurement, per se, was critical for this decrease or whether specificdetails of the study caused it. On the one hand, it might well be thatnot the best trade-off between the partly contrary requirementsarising from ERP and peripheral measurements (e.g. number andfrequency of stimulus presentations) was chosen for the presentexperimental design. On the other hand, it is possible that specificdetails of themock crime (e.g. the absence of a criminal context, or thedouble encoding procedure) led to a diminished involvement of theparticipants; possibly, the omission of answers in the CIT was alsodisadvantageous.
Two different consequences can be drawn with respect to furtherstudies: Firstly, stimulus presentation should be modified towardsslightly longer ISIs in order to entail greater autonomic responses and toallow for longer scoring intervals. Secondly, a two-part CIT study couldbe performed with sequential instead of simultaneous recordings,analogously to a study investigating the RT-based and the classic CITseparately (Verschuere et al., 2009b). Each part should be optimizedwith respect to the measures recorded; stimulus number, stimulusfrequency, and answer demands should be determined with respect tothe requirements from either EEG or peripheral measurement.
As a concluding suggestion with respect to the increasing numberof fMRI studies in the research on deception detection, a combinedmeasurement including brain imaging, and the experimental de-mands arising from it, might be studied in future deception-detectionprojects.
References
Abootalebi, V., Moradi, M.H., Khalilzadeh, M.A., 2006. A comparison of methods for ERPassessment in a P300-based GKT. Int. J. Psychophysiol. 62, 309–320.
Alexander, D.M., Tengrove, D., Johnston, P., 2005. Separating individual skin conduc-tance responses in a short interstimulus-interval paradigm. J. Neurosci. Methods146, 116–123.
Allen, J.J.B., Iacono, W.G., 1997. A comparison of methods for the analysis of event-related potentials in deception detection. Psychophysiology 34, 234–240.
Ambach, W., Stark, R., Peper, M., Vaitl, D., 2008a. An interfering Go/No-go task does notaffect accuracy in a Concealed Information Test. Int. J. Psychophysiol. 68, 6–16.
Ambach, W., Stark, R., Peper, M., Vaitl, D., 2008b. Separating deceptive and orientingcomponents in a Concealed Information Test. Int. J. Psychophysiol. 70, 95–104.
Bahramali, H., Gordon, E., Lim, C.L., Li,W., Lagopoulos, J., Leslie, J., Rennie, C., Meares, R.A.,1997. Evoked related potentials associated with and without an orienting reflex.NeuroReport 8, 2665–2669.
Bamber, D., 1975. The area above the ordinal dominance graph and the area below thereceiver operating characteristic graph. J. Math. Psychol. 12, 387–415.
Barry, R.J., Feldmann, S., Gordon, E., Cocker, K.I., 1993. Elicitation and habituation of theelectrodermal orienting response in a short interstimulus interval paradigm. Int. J.Psychophysiol. 15, 247–253.
Ben-Shakhar, G., 1985. Standardization within individuals: a simple method to neu-tralize individual differences in skin conductance. Psychophysiology 22, 292–299.
Ben-Shakhar, G., Gati, I., 1987. Common and distinctive features of verbal and pictorialstimuli as determinants of psychophysiological responsivity. Journal of Experi-mental Psychology: General 116, 91–105.
Ben-Shakhar, G., Elaad, E., 2003. The validity of psychophysiological detection of infor-mation with the Guilty Knowledge Test: a meta-analytic review. J. Appl. Psychol. 88,131–151.
Ben-Shakhar, G., Frost, R., Gati, I., Kresh, Y., 1996. Is an apple a fruit? Semantic rela-tedness as reflected by psychophysiological responsivity. Psychophysiology 33,671–679.
Bradley, M.T., Janisse, M.P., 1981. Accuracy demonstrations, threat, and the detection ofdeception: cardiovascular, electrodermal, and pupillary measures. Psychophysiol-ogy 18, 307–315.
Bradley, M.T., Rettinger, J., 1992. Awareness of crime-relevant information and theGuilty Knowledge Test. J. Appl. Psychol. 77, 55–59.
Carmel, D., Dayan, E., Naveh, A., Raveh, O., Ben-Shakhar, G., 2003. Estimating the validityof the Guilty Knowledge Test from simulated experiments: the external validity ofmock crime studies. J. Exp. Psychol. Appl. 9, 261–269.
Cohen, J., 1988. Statistical Power Analysis for the Behavioral Sciences, 2nd edn.Lawrence Earlbaum Associates, Hillsdale, NJ.
Copas, J.B., Corbett, P., 2002. Overestimation of the receiver operating characteristiccurve for logistic regression. Biometrika 89, 315–331.
Donchin, E., Coles, M.G.H., 1988. Is the P300 component a manifestation of contextupdating? Behav. Brain Sci. 11, 355–425.
Duncan-Johnson, C.C., Donchin, E., 1977. On quantifying surprise: the variation ofevent-related potentials with subjective probability. Psychophysiology 14,456–467.
Duncan-Johnson, C.C., Donchin, E., 1982. The P300 component of the event-relatedbrain potential as an index of information processing. Biol. Psychol. 14, 1–52.
Elaad, E., 1998. The challenge of the Concealed Knowledge Polygraph Test. Expert Evid.6, 161–187.
Elaad, E., Ben-Shakhar, G., 2006. Finger pulse waveform length in the detection ofconcealed information. Int. J. Psychophysiol. 61, 226–234.
Elton, M., Schandry, R., Sparrer, B., 1983. A comparative investigation of ERPcomponents and the SCR in a habituation and dishabituation paradigm. Int. J.Neurosci. 22, 55–62.
Farwell, L.A., Donchin, E., 1991. The truth will out: interrogative polygraphy (“liedetection”) with event-related brain potentials. Psychophysiology 28, 531–547.
Furedy, J.J., Ben-Shakhar, G., 1991. The Roles of Deception, Intention to Deceive, andMotivation to Avoid Detection in the Psychophysiological Detection of GuiltyKnowledge. Psychophysiology 28, 163–171.
Gamer, M., Berti, S., 2010. Task relevance and recognition of concealed informationhave different influence on electrodermal activity and event-related brainpotentials. Psychophysiology 47, 355–364.
Gamer, M., Rill, H.G., Vossel, G., Gödert, H.W., 2006. Psychophysiological and vocalmeasures in the detection of guilty knowledge. Int. J. Psychophysiol. 60, 76–87.
Gati, I., Ben-Shakhar, G., 1990. Novelty and significance in orientation and habituation:a feature-matching approach. J. Exp. Psychol. Gen. 119, 251–263.
Gronau, N., Ben-Shakhar, G., Cohen, A., 2005. Behavioral and physiological measures inthe detection of concealed information. J. Appl. Psychol. 90, 147–158.
Hanley, J.A., McNeil, B.J., 1983. A method of comparing the areas under receiveroperating characteristic curves derived from the same cases. Radiology 148,839–843.
Hirota, A., Sawada, Y., Tanaka, G., Nagano, Y., Matsuda, I., Takasawa, N., 2003. A newindex for psychophysiological detection of deception: applicability of normalizedpulse volume. Jpn. J. Physiol. Psychol. Psychophysiol. 21, 217–230.

267W. Ambach et al. / International Journal of Psychophysiology 75 (2010) 258–267
Jasper, J.J., 1958. The 10/20 international electrode system. Electroencephalogr. Clin.Neurophysiol. 10, 371–375.
Jokinen, A., Santtila, P., Ravaja, N., Puttonen, S., 2006. Salience of guilty knowledgetest items affects accuracy in realistic mock crimes. Int. J. Psychophysiol. 62,175–184.
Lazzaro, I., Gordon, E., Li, W., Lim, C.L., Plahn, M., Whitmont, S., Clarke, S., Barry, R.J.,Dosen, A., Meares, R., 1999. Simultaneous EEG and EDA measures in adolescentattention deficit hyperactivity disorder. Int. J. Psychophysiol. 34, 123–134.
Lefebvre, C.D., Marchand, Y., Smith, S.M., Connolly, J.F., 2001. Determining eyewitnessidentification accuracy using event-related brain potentials (ERPs). Psychophysi-ology 44, 894–904.
Lim, C.L., 1999. Dynamics of SCR, EEG, and ERP activity in an oddball paradigm withshort interstimulus intervals. Psychophysiology 36, 543–551.
Lim, C.L., Rennie, C., Barry, R.J., Bahramali, H., Lazzaro, I., Manor, B., Gordon, E., 1997. Decom-posing skin conductance into tonic and phasic components. Int. J. Psychophysiol. 25,97–109.
Lykken, D.T., 1959. The GSR in the detection of guilt. J. Appl. Psychol. 43, 385–388.Lykken, D.T., Venables, P.H., 1971. Direct measurement of skin conductance: a proposal
for standardization. Psychophysiology 8, 656–672.Lyytinen, H., Näätänen, R., 1987. Autonomic and ERP responses to deviant stimuli:
analysis of covariation. Electroencephalogr. Clin. Neurophysiol. Suppl. 40, 108–117.MacLaren, V.V., 2001. A quantitative review of the Guilty Knowledge Test. J. Appl.
Psychol. 86, 674–683.Matsuda, I., Nittono, H., Hirota, A., Ogawa, T., Takasawa, N., 2009. Event-related brain
potentials during the standard autonomic-based Concealed Information Test. Int. J.Psychophysiol. 74, 58–68.
Meijer, E., Smulders, F., Merckelbach, H., 2006. Combining P300 and SCR in thedetection of concealed information. Psychophysiology 43, 66.
Meijer, E., Smulders, F., Johnston, J., Merckelbach, H., 2007. Combining P300 andforced choice in the detection of concealed information. Psychophysiology 44,814–822.
Polich, J., 1986. Attention, probability, and task demands as determinants of P300latency from auditory stimuli. Electroencephalogr. Clin. Neurophysiol. 63,251–259.
Rill, H.G., Gamer, M., Gödert, H.W., Vossel, G., Ashcroft, K.R., Busuttil, A., 2003. Detectingconcealed information using the guilty knowledge test with visual stimuli: a studyof the effects of linguistic versus photographic presentation. Abstr. Br. Psychophy-siol. Soc. 30th., vol. 105.
Rosenfeld, J.P., 2002. Event-related potentials in the detection of deception, malinger-ing, and false memories. In: Kleiner, M. (Ed.), Handbook of Polygraphy. AcademicPress, New York, pp. 265–286.
Rosenfeld, J.P., 2005. “Brain Fingerprinting”: a critical analysis. Sci. Rev. Ment. HealthPract. 4, 20–37.
Rosenfeld, J.P., Nasman, V.T., Whalen, R., Cantwell, B., Mazzeri, L., 1987. Late vertexpositivity in event-related potentials as a guilty knowledge indicator: a newmethod of lie detection. Int. J. Neurosci. 34, 125–129.
Rosenfeld, J.P., Angell, A., Johnson, M., Qian, J.H., 1991. An ERP-based, control-questionlie detector analog: algorithms for discriminating effects within individuals'average waveforms. Psychophysiology 28, 319–335.
Rosenfeld, J.P., Soskins, M., Bosh, G., Ryan, A., 2004. Simple, effective countermeasuresto P300-based tests of detection of concealed information. Psychophysiology 41,205–219.
Rosenfeld, J.P., Biroschak, J.R., Furedy, J.J., 2006. P300-based detection of concealedautobiographical versus incidentally acquired information in target and non-targetparadigms. Int. J. Psychophysiol. 60, 251–259.
Rösler, F., Hasselmann, D., Sojka, B., 1987. Central and peripheral correlates of orientingand habituation. Electroencephalogr. Clin. Neurophysiol. Suppl. 40, 366–372.
Rosnow, R.L., Rosenthal, R., 1996. Computing contrasts, effect sizes, and counternulls onother people's published data: general procedures for research consumers. Psychol.Methods 1, 331–340.
Seymour, T.L., Kerlin, J.R., 2008. Successful detection of verbal and visual concealedknowledge using an RT-based paradigm. Appl. Cogn. Psychol. 22, 475–490.
Soskins, M., Rosenfeld, J.P., Niendamm, T., 2001. Peak-to-peak measurement of P300recorded at 0.3 Hz high pass filter settings in intraindividual diagnosis: complex vs.simple paradigms. Int. J. Psychophysiol. 40, 173–180.
Stouffer, S.A., Suchman, L.C., Devinney, S.A., Star, A., Williams, R.M., 1949. The AmericanSoldier: Adjustment during Army Life: Studies in Social Psychology inWorldWar II,Vol. 1. Princeton University Press, Princeton, NJ.
Timm, H.W., 1982a. Effect of altered outcome expectancies stemming from placebo andfeedback treatments on the validity of the guilty knowledge technique. J. Appl.Psychol. 67, 391–400.
Timm, H.W., 1982b. Analyzing deception from respiration patterns. J. Police Sci. Adm.10, 47–51.
Velden, M., Wölk, C., 1987. Depicting cardiac activity over real time: a proposal forstandardization. J. Psychophysiol. 1, 173–175.
Verschuere, B., Crombez, G., De Clercq, A., Koster, E.H.W., 2004. Autonomic andbehavioral responding to concealed information: differentiating orienting anddefensive responses. Psychophysiology 41, 461–466.
Verschuere, B., Rosenfeld, J.P., Winograd, M., Labkovsky, E., Wiersema, R., 2009a. Therole of deception in P300 memory detection. Legal Criminol. Psych. 14, 253–262.
Verschuere, B., Crombez, G., Degrootte, T., Rosseel, Y., 2009b. Detecting concealedinformation with reaction times: validity and comparison with the polygraph.Appl. Cogn. Psychol. 23, 1–11.
Williams, L.M., Bahramali, H., Hemsley, D.R., Harris, A.W., Brown, K., Gordon, E., 2003.Electrodermal responsivity distinguishes ERP activity and symptom profile inschizophrenia. Schizophr. Res. 59, 115–125.