a computational and experimental analysis of impact to...
TRANSCRIPT

A Computational and Experimental Analysis of Impact to Aircraft
Structures
By
Pierce Kennedy, B. Eng.
This thesis is submitted to Dublin City University as the fulfilment o f the
requirement for the award o f
Master of Engineering
Supervisor: Dr. Bryan J. MacDonald, Ph. D
School of Mechanical and Manufacturing Engineering
Dublin City University
July 2005

Declaration
I hereby certify that this material, which I now submit for assessment on the
programme o f study leading to the award o f Master o f Engineering, is entirely
my own work and has not been taken from work o f others save and to the extent
that such work has been cited and acknowledged w ith in the text o f my work.
Picrcc Kennedy
99284111

Acknowledgements
I would like to express m y sincere gratitude to Dr. Bryan M acDonald for his guidance and help over the past two years. I would also like to thank m y school ' technician, Mr. Liam Domican, and m y workshop technician, Mr. Cian M em e, for their help throughout the project.

A Computational and Experimental Analysis of Impact to Aircraft Structures Pierce Kennedy B. Eng
Abstract
The m odelling and analysis o f high energy impact on aircraft structures is highlycom plex. Traditional methods give only a limited understanding o f what occurs and it is evident from the continuing problem o f uncontained engine failure and other debris impact that a more accurate way o f predicting the results o f such impacts is needed. Finite element techniques can provide that solution.
This work attempts to model accurately impacts to existing aircraft structures. O f particular interest is the behaviour at the ballistic velocity as this is where the problem is m ost difficult to predict. Initially the model consisted o f a sim ple sheet subject to impact by a cylindrical projectile. This was used to develop the m odelling techniques for the more com plex m odel. Issues that arose included the mesh density, the material model and the penalty stiffness factor used. Experimental testing was carried out using a gas fired projectile launcher to validate the finite elem ent model. The geometry o f the second m odel was more com plex, a right angled stringer was riveted to a plate using four rivets. Tw o different approaches were used in m odelling here, that o f m odelling the rivets in 3D and that o f m odelling the rivets using 2D approximations. M odelling the rivets in 3D proved to be impractical and o f the 2D approximations the m odel where the rivets were not allowed to fail proved the m ost accurate. Experimental testing was again used for validation.
Finally a new gas powered projectile launcher was designed and built. Improvements over its predecessor included the ability to accommodate a half metre squared test plate, impact this plate anywhere on its surface and tilt the plate through 45°. A lso included were m odifications to the barrel so that projectiles o f any shape or size up to a maximum o f 50mm in diameter could be used.
i

Contents
Abstract.................................................................................................................... iNomenclature..........................................................................................................vList of Figures..................................................................................................... viiiList of Tables..........................................................................................................xi1. Introduction.................................................................................................... 1
1.1 Impact on Aircraft Structures.................................................................................11.2 The Finite Element Method and the A nalysis o f Impact Events...............31.3 Thesis O b jectives...................................................................................................... 41.4 Summary o f Chapter 1 .............................................................................................4
2. Literature Survey...............................................................................................52.1 Introduction........................................................................................................................ 52.2 General Experimental and Analytical Studies........................................................52.3 General Numerical Studies................................................................................... 142.4 Aircraft Experimental and Analytical S tu d ies .............................................. 182.5 Aircraft Numerical Studies...................................................................................202.6 Summary o f Chapter 2 .......................................................................................... 25
3. Theory of Impact to Plates and Plate Structures....................................273.1 Introduction................................................................................................................273.2 Static Plastic Behaviour o f Beams and P lates............................................... 27
3.2.1 Basic Equations for B e a m s........................................................................273.2.2 Plastic Collapse Theory for beam s.......................................................... 293.2.3 Static Plastic Collapse o f a Fully Clamped B eam ..............................323.2.4 Basic Equation for P la tes ........................................................................... 333.2.5 Static Collapse o f Plate with Sim ple Supports....................................35
3.3 Dynamic Plastic Behaviour o f Beam s and P la tes ........................................ 393.3.1 Considerations for Dynam ic Plastic Collapse o f B eam s..................393.3.2 Dynam ic Collapse o f a Sim ply Supported B eam ........................... 403.3.3 Dynam ic Collapse o f a Sim ply Supported Beam for p0> 3pc 433.3.4 Considerations for the Dynam ic Collapse o f a Plate........................493.3.5 Dynam ic Collapse o f a Sim ply Supported P la te ............................50
3.4 Effects o f finite d isplacem ents............................................................................ 54

3.5 Strain Rate E ffects...................................................................................................563.5.1 C owper-Sym onds Constitutive Equation............................................. 57
3.6 Early Tim e response/Near Contact Phenom enon......................................... 573.7 Summary o f Chapter 3 .......................................................................................... 59
4. A nalysis o f S im ple P late S tru ctu res.......................................................................604.1 Introduction...............................................................................................................'604.2 Experimental T estin g ............................................................................................ 60
4.2.1 The Experimental Test Set-up...................................................................604.2.2 Initial T e stin g ................................................................................................. 624.2.3 Ballistic V elocity T esting........................................................................... 62
4.3 M odelling the Sim ple P late.......................................................... 654.3.1 Initial R esults...................................................................................................6 6
4.3.2 Examination o f M esh Convergence........................................................ 6 8
4.3.3 Problems encountered during M odelling .............................................. 704.3.4 Strain-rate e f fe c ts .......................................................................................... 714.3.5 Cost Cutting M easures.................................................................................724.3.6 The Final Results for the Simple Plate................................................... 74
4.4 Sum m ary....................................................................................................................785. A nalysis o f Im p act to R iveted Sheet M etal S tru ctu res................................. 79
5.1 Introduction............................................................................................................... 795.2 Experimental A n a ly s is ..........................................................................................795.3 3D M odelling o f Riveted Plate Structure........................................................83
5.3.1 Initial R esults................................................................................................... 8 6
5.3.2 M odelling o f Pretension in R ivets............................................................ 8 8
5.4 2D M odelling o f Rivets with Failure...............................................................915.4.1 TNW F R iv e ts ..................................................................................................915.4.2 Spot-weld R iv e ts ............................................................................ 92
5.5 2D M odelling o f Rivets without Failure......................................................... 935.6 Final R esu lts..............................................................................................................955.7 Summary o f Chapter 5 .......................................................................................... 97
6 . D esign and M anu factu re o f G as-pow ered P rojectile L a u n c h e r ................986.1 Introduction................................................................................................................986.2 Projectile Firing Concepts and D esign .............................................................98
6.2.1 Proof o f Concept C alcu lations..................................................................... 100
iii

6.3 Reservoir D esig n ....................................................................................................1026.3.1 Wall Thickness C alcu lation ............................................................ 1026.3.2 Endplate Bolt C alculations....................................................................... 103
6.4 Final Barrel A ssem bly................................................................................................ 1046.5 Clamping and Tilting M echanism .................................................................... 1066 . 6 Sliding M echanism .................................................................................................1076.7 Final D esign Issues.................. 1086 . 8 Problems Encountered with the Completed Impact Test R ig ................ 1096.9 Summary o f Chapter 6 ......................................................................................... 110
7. D iscu ssio n ........................................................................................................................ I l l7.1 Analysis o f Simple Plate Structures.................................................................I l l7.2 Analysis o f Impact to Riveted Sheet Metal Structures.............................1137.3 Design and Manufacture o f Gas-powered Projectile Launcher 115
8 . C onclusions and R ecom m en d ation s....................................................................1178.1 C onclusions.............................................................................................................. 1178.2 Recom m endations.................................................................................................. 118
R eferen ce ................................................................................................................................... 119A ppendix 1 ...................................................................................................................................A
Datasheets..................................................................................................................................AA ppendix 2 ...................................................................................................................................G
W orking Drawings for N ew Gas-powered Projectile Launcher............................G

Nomenclature
' S y m b o l D e f in i t io n D im e n s io n
X(Used in Impact Theory) deflection in x-direction m
y deflection in y-direction mz deflection in z-direction mA Cross-sectional beam area 2mH Beam height mB Beam breath mL Beam length mQ Shear Force NM Bending M oment NmN Membrane Force NP external pressure load PaF Set o f external loads Nm mass Kgt time secondsW Displacem ent at centre o f beam mD Cowper-Sym onds Constant s‘lq Cowper-Sym onds Constant -V projectile velocity m /s2
GreekG Stress N /m 2
8 Strain -K Beam curvature mY Curvature in other direction for m
CDplatesBeam displacem ent at plastic hinge m
0 A ngle at plastic hinges in beam radians<i> Second angle describing plastic radians
V

hinge in plateX multiplier -I Specific time seconds11 ratio o f dynamic pulse pressure -Ç position o f travelling plastic hinges mn mass per unit area Kg/m 2
SubscriptX in x-direction -y in y-direction -z in z-direction -xy in xy plane -xz in xz plane -yz in yz plane -0 at time zero -i at i locations -j at j locations -c collapse -eq equivalent -s slug -P projectile -b ballistic -
Superscript• First derivative -
Second derivative -s static -u upper -k kinematic -
stationary -i dynamic "
(impact rig design)V Volume m 3
vi

r1
mvEPtWbGyFk
GreekP
Subscriptrbstiutay
radius rnlength mmass Kgvelocity m /s2
energy Jpressure Pathickness mseal load Ngasket width mgasket seal diameter mseating stress N /mforce Ngasket factor
density Kg/m 3
reservoirbarrelsabottensioninternalultimate tensile available at yield
vii

Figure Description Page1.1 Damage to Delta Airlines Flight 1288 11.2 Engine fire in Air France Concorde flight 4590 22.1 Perforation m echanism s in plate failure 6
2.2 Energy absorption m echanisms for impact o f blunt projectile 8
on flat plate2.3 Schematic illustration o f the effect o f target thickness on failure
mode o f titanium alloy targets 1 1
2.4 Final obliquity as a function o f initial obliquity for 3.175m m and 6.35m m thick 2024-0 aluminium targets struck by hardsteel conical nosed projectiles 13
2.5 High speed camera im ages compared with numericalsimulation from Borvik et al. 15
2.6 Plugging failure in 0.15 inch thick aluminium platesstruck with FSP projectile 18
2.7 Technical Coordinating Group for Munitions Effectiveness(JTCG/ME) penetration equations 20
2.8 Calculated residual velocity vs. element number through thethickness o f the plate 24
3.1 Notation for beam s 283.2 Fully clamped beam subjected to a uniformly distributed
pressure load. 323.3 Representation o f a plate with generalized stresses 343.4 Sim ply supported rectangular plate subjected to a uniformly
distributed load 35
3.5 Tresca (hexagonal) yield condition with inscribing Johansenyield criteria 36
3.6 Static plastic collapse o f a simply supported rectangular plate 383.7 Uniform ly loaded beam with simple supports 413.8 Transverse velocity profile for a sim ply supported beam with
List of Figures
viii

subject to a pressure load greater than 3pc 443.9 Infinitesimal element (dx dy) o f a rectangular plate 503.10 Sim ply supported square plate subjected to a uniform ly
distributed load. 513.11 Element o f a beam 553.12 Engineering and equivalent true stress-strain curves for the
mild steel at several strain rates 563.13 Impact o f square-ended projectile causing plugging and
impact o f conical projectile with a com et at the impact siteand some petalling 58
3.14 Square-ended projectile causing plugging in plate 594.1 Gas powered projectile launcher 614.2 Case 1 : N o perforation o f the plate 634.3 Case 2: Perforation and petalling o f the plate 634.4 Case 3 : Complete penetration o f the plate with plugging 644.5 Plot o f displacement in the z direction for the initial
m odelling o f the problem 674.6 Plugging o f plate and petalling o f plate 694.7 Graph o f ballistic velocity vs. number o f elem ents 694.8 N o damage penetration o f projectile through plate 704.9 Graph o f sliding interface energy for different values o f SIP F 714 .10 Comparison o f residual velocity in m odels with (below )
and without (above) strain-rate effects 724.11 Mesh after removal o f elem ents under clamps and with line ratios 744.12 Graph o f projectile velocity for ballistic simulation 754.13 Maximum deformation at impact site in finite elem ent simulations 764 .14 Comparison between maximum deformation for experimental
and finite element results 774.15 Final deformation o f test plate for the three cases 775.1 Riveted plate structure geometry 795.2 Dim ensions for formed rivet heads and com m on imperfections 80
5.3 Test plate 4 with no perforation o f angle and no rivetfailure. Initial velocity = 162m/s 82
ix

5.4 Test plate 9 with plugging o f plate and failure o f threerivets but no perforation o f angle. Initial velocity 208m /s 82
5.5 Test plate 7 with petalling o f plate with tearing, failure o f allfour rivets but no perforation o f angle. Initial velocity 218m /s 83
5.6 Rivets failure by shearing 835.7 Area to be swept to form rivet 845.8 Details o f the m esh used in 3D model 855.9 3D M odel after plugging o f plate and failure o f rivets. Initial
projectile velocity 125m /s 8 6
5.10 3D M odel with full penetration o f plate and angle. Initialprojectile velocity = 150m /s 87
5 . 1 1 I/2 symmetric mesh for used for pretension analysis 8 8
5.12 Plot o f initial strain induced in the plate and angle due tothe riveting process 89
5.13 Plot o f von-m ises stress in cross-section through rivets, plateand angle induced by the riveting process 90
5.14 Comparison o f displacement between pretension model(top) and standard m odel (bottom) 90
5.15 Comparison between 3D m odel (top) and TNWF model(bottom) after 0.3m s 92
5.16 Comparison plot between the deformation o f spot-weld rivets(top) and 3D rivets (bottom) 93
5.17 Failure o f plate and four rivets. Initial projectile velocity = 150m/s 946.1 Sabot design used by Knight et al. 996.2 Sabot design by Manchor and Frankenberger 1006.3 First sabot design 1046.4 Barrel A ssem bly 1056.5 Reservoir 1056 . 6 Clamping and tilting m echanism 1066.7 Rails and clamp assem bly for m oving the test plate in the x-y plane 1076 . 8 R ig Wiring Schematic 1086.9 Full gas powered projectile launcher assembly 109
x

List of Tables
Table Description Page2.1 Table o f different SIPF’s used with ratios o f sliding interface
energy, Es, to total energy, Et, and internal energy, E[ 2 1
2.2 Table o f maximum and residual strains induced riveted jointsby riveting process 23
4.1 A verage plate deformations for the three categories 644.2 Material models for A12014 T4 and Ti-6A1-4V 654.3 Comparison between experimental and finite elem ent velocities 754.4 Comparison between max deformations at impact site 765.1 Deformation modes from experimental analysis 815.2 Comparison o f experimental and finite elem ent results 96
xi

1. Introduction
1.1 Impact on Aircraft Structures
Impacts to aircrafts are regular occurrences and thin aircraft structures are particularly vulnerable to failure through impact damage. These impacts com e from many source both during flight, and on takeoff and landing. Uncontained engine failure, bird strike, hail and tyre rubber are just some o f the sources o f debris that aircraft encounter and there are many reports o f such events available in literature. Uncontained engine failure remains one o f the major causes o f aircraft crashes outside o f takeoff and landing. The Society for Autom otive Engineers produced a report [1] stating that 315 uncontained rotor failures occurred between the years 1976-1983 and a further investigation by the Federal Aviation Authority in the US [2] described 676 uncontained engine failures occurring in the 28 year period between 1969 and 1997. One particular case [3] on July 6 , 1996, saw Delta Airlines Flight 1288 experience an uncontained failure o f the left engine resulted in pieces o f the hub and attached fan section being flung out at high speed and tearing into the fuselage (see figure 1 . 1 ).
Figure 1.1: Damage to Delta Airlines Flight 1288 [3]
1

A mother and her 12-yr-old son died instantly as blades and fragments penetrated the cabin.
Bird strike is one o f the main causes o f uncontained engine failure as well as direct damage to other parts o f the aircraft fuselage. Between 1990 and 2002, 46,514 w ild life strikes were reported to the FAA [4] with bird strikes accounting for 97% o f these. The most common aircraft com ponents struck by birds were nose, windshield, engine, wing/rotor, and fuselage with engines suffering the most frequent damage at 34% o f all damaged components.
Engine failure is not the only cause o f catastrophic damage caused by debris impact. An obvious exam ple o f this was the Air France Concorde flight 4590 crash near Paris Charles de Gaulle airport in 2000, figure 1.2 [5]. The inquest determined that the major cause o f the accident was a tyre blow out caused by debris on the runway. This piece o f tyre rubber impacted the underside o f the left wing causing a mechanical reaction to form a shock w ave in the fuel tank which appears to have ruptured the tank. The leak caused an engine fire and subsequently caused the plane to crash.
Figure 1.2: Engine fire in Air France Concorde flight 4590 [5]
2

1.2 The Finite Element Method and the Analysis of Impact Events
The finite elem ent method was first developed in the 1960’s with the appearance o f digital computers. In the late 1960’s the problem o f plasticity was introduced to finite elem ent analysis when an elastic-plastic constitutive model was incorporated into a com m ercially available code. Initial applications were restrained to problems containing plastic strains in the order o f 0 . 1 % but in the 1970’s limited nonlinear solvers were developed that could handle problems with higher strains. S ince then the advances in computer technology, both hardware and software, has resulted in advanced implicit and explicit solvers becom ing available with the capabilities to analyse and reproduce the com plex behaviour encountered during impact events. One such application involves simulating the response o f a fuselage skin when impacted by uncontained aircraft engine debris. D eveloping accurate finite element models and analysis o f this event has the potential o f significantly improving the design, reliability, and safety o f engines and primary aircraft structures, especially for commercial transport applications. Two potential hazards involving turbine-engine debris are:
• Containing failed engine debris within the engine housing - contained failure. Exam ples o f research in this area include an FAA report on uncontained engine failure [2] and the work o f Carney et al. [6 ].
• The potential impact o f uncontained failed engine debris on other parts o f the aircraft - uncontained failure. Examples o f research in this area include the work o f Lundin [7], Frankenberger [8 ] and Knight et al [9].
Most o f these studies have used simple plates to simulate the aircraft skins behaviour during impact, with som e then attempting to introduce new materials such as CFRP to improve behaviour. Analysis o f more com plex aircraft geometries has how ever been limited. The European program entitled “IMT crashworthiness for commercial aircraft” [ 1 0 ] concluded that although finite element methods could accurately predict failure to aircraft structures when the m ode o f failure included plastic hinge development, the accuracy o f m odels predicting failure through plate or fastener failure was unsatisfactory. Rivet
3

m odeling in particular has been seen to be a problem due to their nonlinear behaviour and the effects induced in the plate during the riveting process [ 1 0 ].
1.3 Thesis Objectives
The objectives o f this thesis are as follows:• To obtain an accurate finite element m odel o f the impact o f a blunt,
cylindrical projectile on an aircraft skin material (A1 2014 T4)• To use the m odelling knowledge gained in the first task to model a more
complex aircraft geometry including rivets and stringers.• To investigate the different m odelling techniques available for rivets and
to compare them with regards to accuracy and cost• To design and develop a new impact testing rig with the knowledge
gained from the tasks above
1.4 Summary of Chapter 1
Chapter 1 introduced the concepts and causes o f impacts to aircraft structures. An overview was given o f the accidents that may occur when debris impacts an aircraft and some o f the consequences o f such impacts were seen. A brief history o f the finite element method was presented along with its application to highly dynamic deformations and failures such as those seen in high energy impact events.
4

2. Literature Survey
2.1 Introduction
This thesis seeks to exam ine impact to aircraft structures using finite element analysis. A s aircraft structures are essentially thin skins with support structures the literature survey presented here looks initially at impacts to general plates and plate structures before exam ining aircraft structures in more detail. Both experimental and analytical studies along with finite elem ent analyses are investigated with the purpose o f identifying common areas o f research and reoccurring problems.
2.2 General Experimental and Analytical Studies
The field o f impact dynamics covers an extremely wide range o f situations and is o f interest to engineers from a number o f different disciplines. Indeed whenever two bodies collide or risk collision the subject o f impact dynamics arises. The studies that have been undertaken o f impact on plates and plate structures have various aims and application ranging from armour to metal forming to debris protection and the materials under study have ranged from titanium alloys to aluminium alloys to com posites such as CFRP. The field also covers a large range o f loading conditions such as hypervelocity impact, blast loading, jet impact, projectile penetration, dropped-object loading, structural crushing etc. This literature review concentrates primarily on the impact o f m etallic targets with thicknesses o f the order o f magnitude o f the impinging projectile (plates) subject to sub-ordnance velocities (up to approximately 300m /s) from the view point o f investigating the penetration and perforation processes involved.
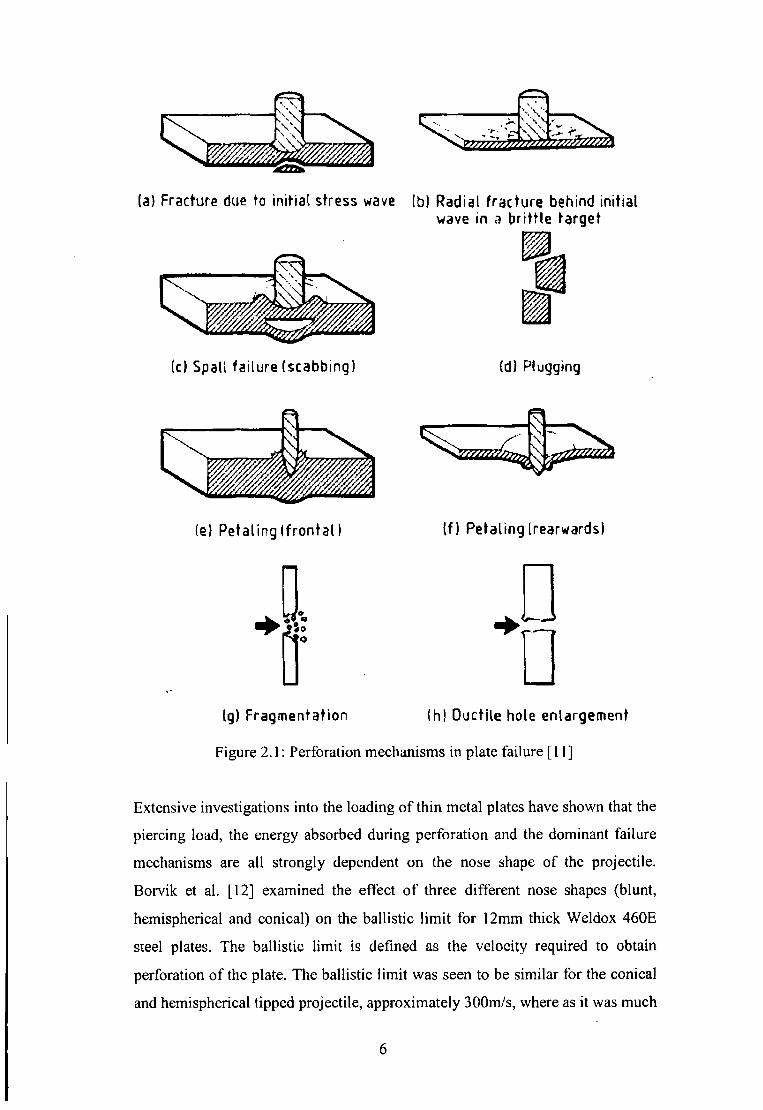
There are several different m echanism s by which a target can fail and these may occur singly or in combinations o f two or more. The eight most com m only occurring types o f failure o f thin or intermediately thick targets have been identified as those shown in figure 2 . 1 [ 1 1 ]
5
(a) Fracture due to initial stress wave (b) Radial fracture behind initialwave in a brittle target
(c) Spall failure (scabbing) (d) Plugging
(e> Petaling(frontal) (f) Petaling (rearwards)
□□(g) Fragmentation (h) Ductile hole enlargement
Figure 2.1: Perforation mechanisms in plate failure [11]
Extensive investigations into the loading of thin metal plates have shown that the piercing load, the energy absorbed during perforation and the dominant failure mechanisms are all strongly dependent on the nose shape of the projectile. Borvik et al. [12] examined the effect of three different nose shapes (blunt, hemispherical and conical) on the ballistic limit for 12mm thick Weldox 460E steel plates. The ballistic limit is defined as the velocity required to obtain perforation of the plate. The ballistic limit was seen to be similar for the conical and hemispherical tipped projectile, approximately 300m/s, where as it was much

lower for the blunt projectiles at 185m/s. The study also showed that the residual velocity was influenced by nose shape with the blunt and hemispherical projectile’s velocity coinciding as the impact velocity becomes high compared with the ballistic velocity. The residual velocity (the velocity of the projectile after the impact event) for the conical nosed projectile in this case is much higher and approaches the residual velocity line (i.e. the residual velocity for a plate of zero thickness). The differences in the ballistic velocities for the different projectiles are attributed to the change in energy absorption and failure mode of the target for each nose shape. The variation in residual velocities is partly caused by projectile deformation with the deformation of the blunt projectiles increasing linearly with impact velocity whereas conical projectiles hardly deform at all. It was also seen that sliding friction effects can be neglected for blunt projectiles but not for the conical or hemispherical projectiles.
The energy required for perforation of steel plates under impact loading conditions was also shown to be dependent on projectile nose shape by Corran et al. [13]. Blunt nosed projectiles of different radii were fired and the critical impact energy (the energy required to reach the ballistic limit) for each radius was recorded. The effect of increasing the nose radius was to change the mechanism of penetration from ductile hole enlargement to tensile thinning to shear failure each of which related to a change in the critical impact energy. The energy absorption mechanisms encountered when impacting a flat plate with a blunt projectile were analysed by dividing the energy into the four components as in figure 2.2. Corran et al. [13] also investigated the effects of clamp pressure on the ballistic limit of the target and found a steady increase in the velocity needed for ballistic penetration with decreasing clamp load. This runs contrary to claims of previous authors who have tended to disregard changes in clamp conditions [11]. Shen et al. [14] also found that nose radius affected the energy needed for perforation. It was observed that deformation consisted of local indentation and a global deformation and that the local indentation played a significant role and should not be neglected.
7

Goldsmith and Finnegan [15] investigated impact on aluminium and steel plates by projectiles (hard steel spheres) travelling between sub-ordnance (150m/s) and ultra-ordnance (2,700m/s) velocities.
1. Elastic energy:, _3nr^fc0( l - v J)ff,2< = ---------- o r --------
2 Plastic energy:E p ~ j (N o« , + M 0Kr + M 0Ka)2nr dr
3. Plugging energy:£pl = 2itrpeh0xyy,
4. Projectile mushrooming:p 2na1Har‘
rc = clamp radius, h0 = initial thickness, v = velocity, oy = material yield stress, E = Young’s modulus, rp = projectile radius, N0 = full plastic membrane force, £r = radial strain, M0 = full plastic yield moment, Kr = radial curvature, k0 = circumferential curvature, e = width of intense shear zone around projectile edge, Ty = shear yield stress, yf = shear strain to failure, a = projectile nose radius before mushrooming, b = projectile nose radius after mushroomingFigure 2.2: Absorption energies associated with deformation mechanisms for
impact of blunt projectile on flat plate [13]
Measurements taken included the initial and residual projectile velocities, the strain histories at several points, and the dimensions of the final deformation of the impact area and projectile. The velocity drop between the initial and residual velocities was seen to decrease to a minimum just above the ballistic limit and then increase steadily thereafter. A dishing in the plug ejected by thin targets was observed similar to that shown in figure 2.3 and was shown to be at a maximum at the ballistic velocity. High speed photographs of the impact event showed that the terminal plug and projectile velocities were very similar.
8
Levy and Goldsmith [16] investigated the impact of hemispherical, conical and blunt nosed projectiles on aluminium alloy and steel plates, measuring the forces, strains, permanent deflections and plug shapes produced. The projectiles contained a piezoelectric crystal which enabled it to measure the force of the impact directly. The paper’s main conclusions were that plug formation is concurrent with other deformations occurring to the plate, that permanent deflections and peak force increase up to the ballistic velocity and drop thereafter and that permanent hoop and radial strains in the plates are significant in the impact zone but decrease rapidly with increasing radius from the impact. Forcetime histories obtained for different projectile shapes indicate that hemispherical and blunt projectiles tend to produce shorter impact force duration times but higher peak loads than conically-ended projectiles.
Deya et al. [17] examined the effect of conical, ogival and blunt nosed projectiles on steel of varying strengths. The experimental analysis found that the ballistic velocity for the ogival and conical projectiles was much greater. It also found that an increase in strength of the material caused an increase in the ballistic velocity of the plates for the conical and ogival projectiles while the same increase in strength in the blunt nosed case resulted in a decrease in the ballistic velocity. One reason for this may have been a change in the micro-structure of the material in the shear bands caused by the plugging failure.
Borvik et al. [18] performed a series of tests on impact to aluminium alloy (AA5083-H116) plates between 15mm and 30mm thick. For each target thickness, the initial projectile velocity was adjusted so that the projectile impacted the target at velocities well above and just below the ballistic limit of the target. Conical and ogival projectiles were used and all o f the plates failed through ductile hole enlargement. The projectile opened a hole in the plate at the point of impact and the hole was enlarged as the projectile passes through due to high radial pressure. The plate material surrounding the hole was thickened as a result. It was noted that the time taken for the projectile to pierce the plate increased almost linearly as a function of target thickness even though different impact velocities were involved. The impact resistance o f the aluminium was compared with some previous tests carried out on steel and concrete targets and
9
it was seen that for equal perforation resistance a smaller weight of aluminium was needed than either steel or concrete.
The effects of plate thickness were again investigated in Chen et al. [19] with thin, intermediate and thick plate being impacted by a blunt projectile. An analytical model used to predict the ballistic limit and residual velocity was developed. Three separate models were presented for thin, intermediate and thick plates with assumptions such as perfectly plastic material for the plate and perfectly rigid material for the projectile. It was also assumed that the projectile and the plug travel at the same velocity once the plug is formed. The model is valid for the perforation of plates by shear plugging failure with or without structural bending response and local penetration. The model was compared with experimental results from several sources and gives good correlation. Another analytical model developed by Chen et al. [20] based on the Johnson-Cook flow law shows that when the thickness of the plate increases, penetration may become a distinct stage and in this case, a two-stage model should be introduced for thick plates (i.e. penetration/indention and shear plugging via the dynamic cavity expansion model and the rigid-plastic model).
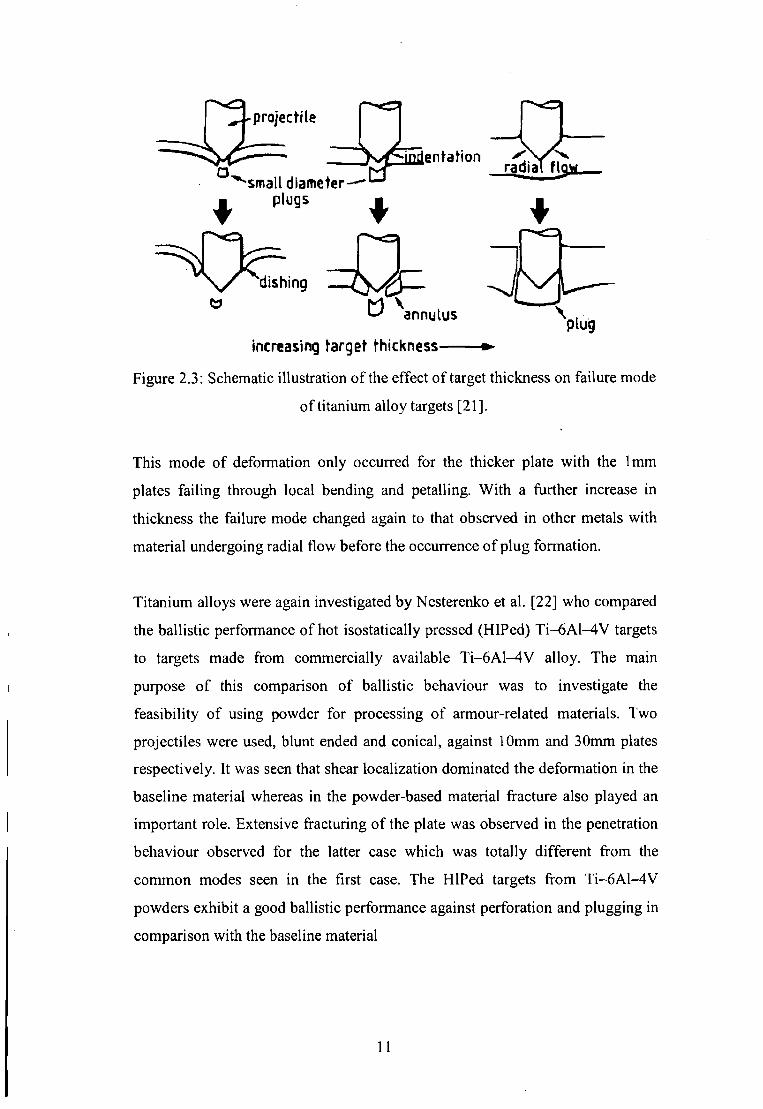
Leppin and Woodward [21] also examined the effects of plate thickness and projectile geometry, this time on thin titanium alloy plates. Titanium was chosen because of its known susceptibility to plugging. Blunt projectiles produced a similar deformation through shear plugging as seen in other materials. Conical projectiles, however, produced a result unique to titanium. The mechanisms by which the plate allowed projectile passage, once the initial plug was formed, was seen to change as the plate thickness and/or nose cone angle were increased, figure 2.3. At low velocities a plug smaller than the projectile diameter was ejected with no penetration of the projectile through the plate. When the projectile velocity was increased the formation of the small plug was followed by the formation of an annulus as the projectile passed through the pate.
10
annulus
[en tati on- Qradial fig)
*
plugincreasing target thickness
Figure 2.3: Schematic illustration of the effect of target thickness on failure modeof titanium alloy targets [2 1 ].
This mode of deformation only occurred for the thicker plate with the 1mm plates failing through local bending and petalling. With a further increase in thickness the failure mode changed again to that observed in other metals with material undergoing radial flow before the occurrence of plug formation.
Titanium alloys were again investigated by Nesterenko et al. [22] who compared the ballistic performance of hot isostatically pressed (HIPed) Ti-6A1^V targets to targets made from commercially available Ti-6A1-4V alloy. The main purpose of this comparison of ballistic behaviour was to investigate the feasibility of using powder for processing of armour-related materials. Two projectiles were used, blunt ended and conical, against 10mm and 30mm plates respectively. It was seen that shear localization dominated the deformation in the baseline material whereas in the powder-based material fracture also played an important role. Extensive fracturing of the plate was observed in the penetration behaviour observed for the latter case which was totally different from the common modes seen in the first case. The HIPed targets from Ti-6A1-4V powders exhibit a good ballistic performance against perforation and plugging in comparison with the baseline material
11

Langseth and Larsen [23] carried out an in-depth investigate into the plugging capacity of dropped objects on steel plates. The analysis was performed to simulate dropped drill housings onto oil rig platforms. Similitude analysis was used to construct 1:4 scale model of a typical offshore deck panel being struck by a falling drill collar. The projectiles used in the tests were flat-faced and had masses ranging from 18 to 50 kg. The effects of target thickness, projectile mass and in-plane target stiffness on the energy required to perforate the panels were investigated. It was found that the critical plugging energy increased with plate thickness, decreased with increasing projectile mass and decreased with increasing in-plane panel stiffness over the velocity and mass range tested. The effect of stringers attached to the mid span on the critical plugging energy was investigated and found to be negligible as were strain rate effects.
The influence of the obliqueness of the impact angle on the penetration and perforation of steel and aluminium target is discussed by Goldsmith and Finnegan [24]. The investigation concluded that projectile nose shape and mass had little effect on the ballistic limit and that the impact on a plate is not overly sensitive to increases in obliquity with the ballistic limit rising from 97m/s at normal incidence to only 130m/s at 53° incidence for 3.175mm aluminium plates struck by hardened steel projectiles. The deformations seen for the oblique impacts were similar to those noted for normal impacts with petalling and plugging both present. However the pattern of the petalling differed for different angles of incidence and petals on one side were often sheared off as the projectile penetrated the plate. The perforations became more oval-shaped as the obliquity increased. The exit obliquity angle was also examined and it was noted that it increased more rapidly with initial angle of incidence for the 3.175mm aluminium plates but varied linearly for the thicker aluminium plates and both the steel plates as seen in figure 2.4.
12
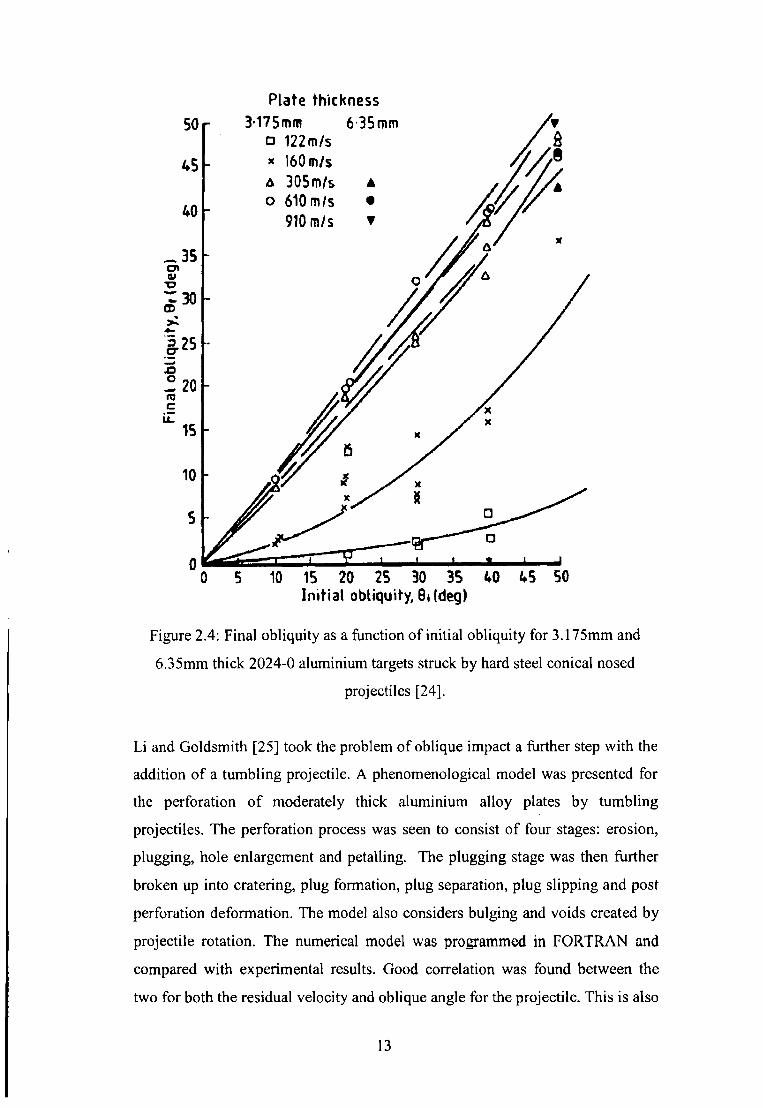
Plate thickness
Figure 2.4: Final obliquity as a function of initial obliquity for 3.175mm and 6.35mm thick 2024-0 aluminium targets struck by hard steel conical nosed
projectiles [24].
Li and Goldsmith [25] took the problem of oblique impact a further step with the addition of a tumbling projectile. A phenomenological model was presented for the perforation of moderately thick aluminium alloy plates by tumbling projectiles. The perforation process was seen to consist of four stages: erosion, plugging, hole enlargement and petalling. The plugging stage was then further broken up into cratering, plug formation, plug separation, plug slipping and post perforation deformation. The model also considers bulging and voids created by projectile rotation. The numerical model was programmed in FORTRAN and compared with experimental results. Good correlation was found between the two for both the residual velocity and oblique angle for the projectile. This is also
13

true for the computed and observed final velocities o f the plug, however, good correlation for the final oblique angle of the plug was not seen. It was explained that the forces acting on the plug were not axi-symmetric and that the direction of the plug was strongly effected by the last portion of the shear process, which was very hard to predict. The model also failed to predict accurately any perforation with an impact angle over 25° as the dominant failure model changed from plugging to petalling.
2.3 General Numerical StudiesFinite element and other numerical methods have been accepted these days as general computational tools in all areas of engineering and have been observed to simulate non-linear events accurately. Even so, some behaviour such as perforation of plates, which involves material instabilities and highly dynamic responses, remains difficult to reproduce. Borvik et al. [26] noted that the complexity of the fracture process in shear plugging has limited both numerical and analytical studies in the area, with the problem being mostly treated experimentally. With this in mind a computational model for visco-plasticity and ductile damage was developed and implemented in the explicit finite element code LS-DYNA. A study was conducted varying parameters such as strain-rate and temperature dependence in the Johnson-Cook constitutive model to investigate their importance. Element size was found to be a vital parameter in numerical simulations involving adiabatic shear localization and strain-rate sensitivity, temperature and stress states (tension, compression or shear) were all found to be significant. The model gave good agreement between plugging failure observed in the experimental analysis and the numerical analysis, see figure 2.5. It was noted that no discussion was made in the paper of contact algorithms or adaptive meshing and while these issues were not significant in the modelling of plugging failure they may have large effects in other cases such as ductile hole enlargement.
14

Figure 2.5: High speed camera images compared with numerical simulation fromBorvik et al. [26]
A further study by Borvik et al. [27] involved the modelling of impact with blunt, conical and hemispherical nosed projectiles. Again the simulation was conducted using the LS-DYNA explicit code and the Johnson-Cook constitutive equation. The projectile was modelled with a simpler bilinear elastic-plastic model. Severe element distortions were experienced when modelling the impact of the conical nosed projectile resulting in the termination o f the simulation. Adaptive meshing was used to overcome the problem. In general, close correlation between numerical and experimental results was achieved. Important parameters in the penetration problem such as ballistic limit velocity, residual projectile velocity, shape o f residual velocity curve, maximum target deformation, perforation time and energy absorption, were all well predicted using numerical simulations.
Shi et al. [28] investigated the different finite element modelling techniques of panel-like targets in perforation simulations. The performances of eight-node brick element, four-node quadrilateral thin shell element and eight-node solid shell element were discussed. In general it was observed that the accuracy o f the shell modelling of targets in the simulations was controlled by the influence of
15

the transverse normal stress and the wave propagation in the target. This influence, in turn, was controlled by the aspect ratio of projectile diameter to target thickness and the stiffness/strength ratio of projectile to target. The following conclusions were drawn from the study: when the target panels satisfy certain conditions (when normal stress through the plate could be neglected), the thin panel targets can be modelled by shell elements and the model can predict residual velocities of plate perforations. The shell element models of the targets can save computation time and computer memory while still yielding reasonable results compared to the solid element modelling of the targets. In general, the thick (solid) shell element modelling of the target gives better results than the thin shell element. Therefore, the thick shell element is an efficient alternative for the modelling of target materials in the perforation simulations of projectiles against thin panel targets.
The static and dynamic behaviour of plate structures subject to axial compressive loading using the finite element method (FEM) was investigated by Webb et al. [29] using the ABAQUS finite element code. The analysis examines the effects of inertia and strain-rate effects and five distinct phases are seen:
• a pre-compression wave - leading to the establishment of a combined incident and reflected stress wave pattern
• a compression phase• mechanism formation - and the dissipation of energy by the rotation of
the plastic hinges• separation of the striker from the model brought on by elastic recovery of
the deformed platesThe computed FE results were in good agreement, with regard to force, moment and energy considerations, to the experimental results presented.
Kurtaran et al. [30] examined the behaviour of a GT model military jeep door subject to impacts by a bullet at velocities of 500m/s, lOOOm/s and 1500m/s using the explicit finite element code LS-DYNA. A comparison was made between two material models commonly used in impact analyses, the plastic kinematic hardening model, which is an elastic-plastic model using the Cowper-
16
Symonds model to describe strain rate, and the Johnson-Cook model, which is a strain-rate and temperature dependent visco-plastic model. The Johnson-Cook model was used with the Mie-Gruneisen equation of state to describe the pressure-volume relationship in compression and expansion. Finite element simulations were carried out on a single plate 7.62mm in diameter and 2mm thick using the two material models and the results from the two models show a noticeable difference in the deformation of both plate and projectile. According to the authors this is evidence that thermal softening effects are significant in this case although no experimental analysis is presented as validation. Subsequently, the JC model was used and the effects of adding a 2mm plate, a 20mm plate and a 2mm plate angled at 10° to the back of the present plate were investigated.
Park et al. [31] presented what is described as the first trial regarding the optimal design of multi-plate targets under ballistic impact. An optimal design for multiplate targets subject to ballistic impact was sought using finite element methods, namely the NET2D Langrangian finite element code. The Johnson-Cook constitutive model was used in the simulation to account for strain-rate hardening and thermal softening effects. The response surface method based on the design of experiments was used to obtain the optimal design. The average temperature or the equivalent plastic strain was introduced as a response for the optimisation of the impact problem. The optimised thickness of each layer for which perforation did not occur and for which the strength of the multi-layer plate is maximized is obtained for a constant projectile velocity. As an optimum condition in a two-plate structure, the thickness of the upper aluminium layer increases to 1.34mm from 1.0mm. The thickness of the lower steel layer decreases to 0.66mm from 1.0mm. As a result the total mass is decreased, because the density of aluminium is lower than that of steel, and the strength of the entire structure is improved.
17

2.4 Aircraft Experimental and Analytical Studies
As mentioned in section 2.1 impacts to aircraft structures can be essentially described as impacts to thin plates and plate structures. Some of the projectiles involved in impacts on aircraft are commonly seen in other areas with debris from unconstrained engine failure producing blunt, conical and spherical shapes. Another area to consider however is the unique range of projectiles that impinge on aircraft including birds and hail.
A series of Federal Aviation Authority (FAA) reports detailed experimental studies into some of the common debris impacts and their effects. Gogolowski and Morgan [32] conducted experiments to test the ballistic capabilities of two commonly used aircraft materials, A1 2024 - T3 and Ti 6AL - 4V. Plates of different thicknesses were impacted with blunt cylinders and fragment stimulant projectiles (FSP) with chiselled noses see figure 2.6. Little difference was seen between the modes of failure for the two projectiles. The modes of failure for the aluminium plates included plugging and petalling depending on the impact velocity. No deformation of the projectile was seen. In the test for the titanium plates, failure occurred by plugging with some mushrooming of the projectile. The results of the tests were used to validate the DYNA-3D finite element code.
Figure 2.6: Plugging failure in 0.15 inch thick aluminium plates struck with FSPprojectile [32].
18
A second FAA report saw Frankenberger [8 ] conduct an analysis to identify the characteristics of uncontained engine failure experienced by large commercial aircraft. The objective of the analysis was to define the debris size, weight, exit velocity, and trajectory. The effort was conducted by gathering historical data from uncontained engine failures. This data included, when available, phase of flight, engine operating condition, the failed engine component, aircraft damage location, and damage size. With this basic information, debris size was correlated to damage size. A methodology was developed to estimate debris exit velocity. Representative engine cases and cowls were defined and existing ballistic penetration equations used to calculate debris exit velocity. This analysis was conducted for disk and blade failures on fan, compressor, and turbine components. The analysis showed that present trajectories, defined in FAA regulations, are too narrow and should be expanded. The analysis also highlighted the fact that during an uncontained event the aircraft is subjected to multiple small fragment impacts, not just a single impact. It is the combined effects from the small fragments that pose the highest hazard potential to the aircraft.
A further analysis by Lundin [7] concerned a series o f simulated uncontained engine failure tests into aircraft fuselage. A large gas gun was used to fire turbine blade segments of various sizes and impact and residual projectile velocity were noted. An empirical methodology called the joint Technical Coordinating Group for Munitions Effectiveness (JTCG/ME) penetration equations, figure 2.7, which were originally developed to predict the penetration and residual velocity of ballistic weapon projectiles upon impact with various materials, were used to try and predict the residual projectile velocity. The data showed that the penetration equations produce excellent agreement to the actual residual energies for the skin only structure. There is a reduced agreement for the complex structures where the aircraft skin was supported by a stringer.
Liu and Stronge [33] noted impacts by soft or deformable objects, such as birds, result in a shape change for the projectile on impact and the deformation increased the area of the contact surface.
19

, = J ± 3The Residual Velocity Equation:
50_ pA I
1.0 + P-jf cosí?
T h e B a llis tic L im it E q u a tio n :
‘'so “ Cb f('•’./•'•'Vib( ( •' sec* 0If.**ft \
fp/ Ap ]>V„
W here:
V - d e b ris in itia l v e lo c ity- d eb ris b a llis tic lim it velocity . P en etra tio n o cc u rs 5 0% o f the tim e.
VT - d eb ris re sid u a l v e lo c ity p} - d eb ris sp ecif ic w eigh t (d eb ris w eigh t/vo lum e) p - p la te spec ific w eigh t (p la te w eigh t/vo lum e) i - p la te th ickn essAp - d eb ris p resen ted a re a a lon g d irection o f travel
Figure 2.7: Technical Coordinating Group for Munitions Effectiveness (JTCG/ME) penetration equations [7].
The paper investigated the effects of relative deformability of missile and plate on the ballistic limit for thin aluminium plates stuck at normal incidence. A missile deformability index, pmVbi2/Y, was developed where pm is the missile density, Vbi is the plates ballistic velocity and Y is the missile dynamic yield stress. It was found that if the index is less than 0.45, the mushrooming of the projectile hardly affects the deformation and failure behaviour but for values greater than 0.45 the effects are significant and the failure is more likely to occur by discing than by plugging.
2.5 Aircraft Numerical Studies
The same problem with complexity noted in section 2.3 for plate structures are true for aircraft structure modelling when using finite element and other numerical methods. Here several specific cases are presented with their analysis of the difficulties and solutions. Knight et al. [9] examined the modelling of uncontained engine failure debris impact on aircraft fuselage-like panels. This
20
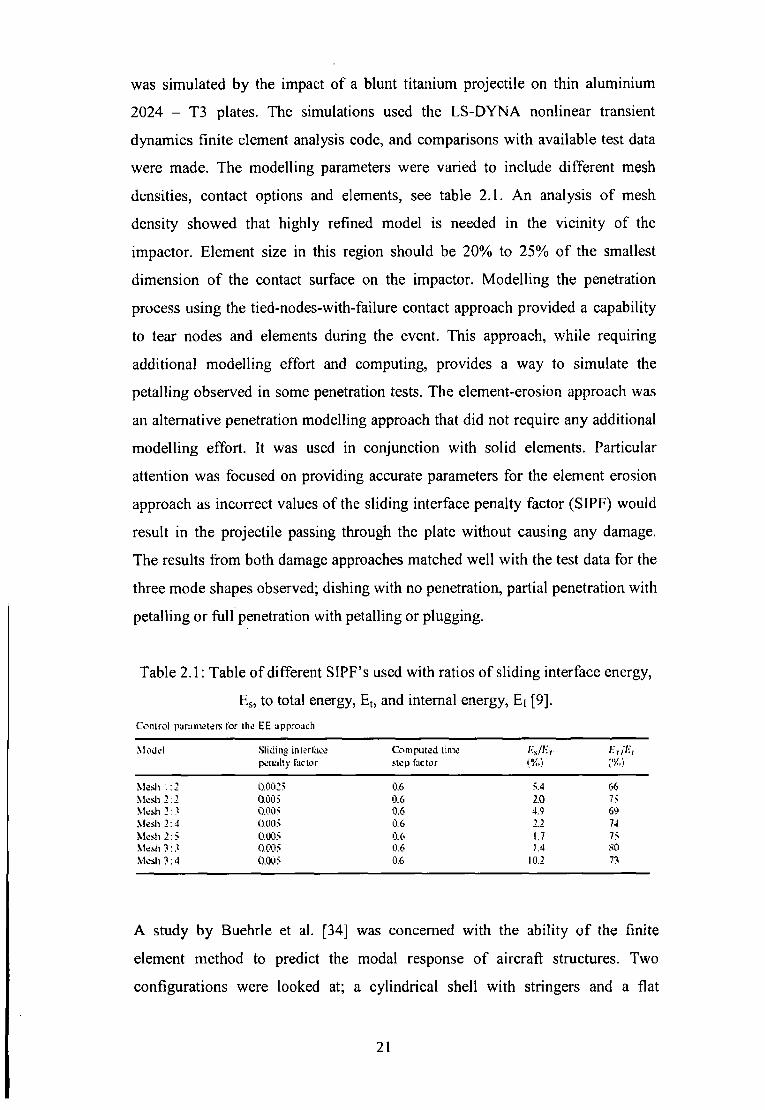
was simulated by the impact of a blunt titanium projectile on thin aluminium 2024 - T3 plates. The simulations used the LS-DYNA nonlinear transient dynamics finite element analysis code, and comparisons with available test data were made. The modelling parameters were varied to include different mesh densities, contact options and elements, see table 2.1. An analysis of mesh density showed that highly refined model is needed in the vicinity of the impactor. Element size in this region should be 20% to 25% of the smallest dimension of the contact surface on the impactor. Modelling the penetration process using the tied-nodes-with-failure contact approach provided a capability to tear nodes and elements during the event. This approach, while requiring additional modelling effort and computing, provides a way to simulate the petalling observed in some penetration tests. The element-erosion approach was an alternative penetration modelling approach that did not require any additional modelling effort. It was used in conjunction with solid elements. Particular attention was focused on providing accurate parameters for the element erosion approach as incorrect values of the sliding interface penalty factor (SIPF) would result in the projectile passing through the plate without causing any damage. The results from both damage approaches matched well with the test data for the three mode shapes observed; dishing with no penetration, partial penetration with petalling or full penetration with petalling or plugging.
Table 2.1: Table of different SIPF’s used with ratios of sliding interface energy, Es, to total energy, Et, and internal energy, Ei [9].
Conlrol para me te re for the EE approachModel Sliding interlace
penally factorComputed time step factor fis/Er-(‘/V.’l (%J
Mesh 1:2 0.0025 0.6 5.4 66Mesh 2 :2 Q.0Ü5 0.6 2.0 75Mesh 2 :-? 0.005 0.6 4.9 6$Mesh 2 :4 0.005 0.6 J J 74Mesh 2 :5 0.005 0.6 1.7 75Mesh?:.? 0.005 0.6 1.4 SOMesh?: 4 0.005 0.6 10.2 73
A study by Buehrle et al. [34] was concerned with the ability o f the finite element method to predict the modal response of aircraft structures. Two configurations were looked at; a cylindrical shell with stringers and a flat
21
fuselage-like panel. Beam, shell and solid elements were evaluated for the stringer components as well as different attachment models between the stiffeners and the skin. It was found that beam elements were sufficient for characterising the dynamic response of the stringers but that in assembly models solid elements were needed to incorporate the different attachment models. The model of the complete cylinder tended to over estimate the natural frequency of the assembly. The modelling of the fuselage panel concentrated on the stiffener to skin attachment models. It was seen that restraining the entire contact surface between the stringer and the skin produced a model that was too stiff and that constraining the stringer only along a line coincident with the rivets produced better results. Predicted frequencies for this model were still lower than measured however, showing the need for further research in the area of rivet modelling.
Langrand et al. [10] examined the problem of riveted joints more closely. Three main aims were addressed: investigations o f structural embrittlement due to the riveting process, mechanical strength characterisation and simplified modelling of bonding. In the first part structural embrittlement was identified, with the maximum and residual strains shown below in table 2 .2 , and modelled correctly using the finite element code Pam-Crash. In the second part Gurson damage parameters were identified and validated for both sheet and plate materials. Finally a new rivet model was developed using a non-linear spring element to reproduce the pure shear and tensile non-linear behaviour of the rivet. When implemented in an airframe with 700 rivets the new rivet model showed improved response with regard to the experimental testing but still failed to describe the airframe’s stiffness correctly and did not reproduce the correct failure phenomenon.
Teng and Wierzbicki [35] presented a parametric study into the perforation process of an aircraft material (Al 2024 - T351) subject to impact, undertaken using the ABAQUS finite element code. In particular crack growth due to shear plugging was investigated and it was found that a critical indentation depth of0.2h - 0.3h can be used as a failure indicator in shear failure.
22

Table 2.2: Table o f maximum and residual strains induced riveted joints by riveting process. L=length, (p=diameter, 5j=gauge position, emax=max strain,
£res=residual strain [10].Table 1to peri menuil results of riveiiny tests0/2 U2 (mm) (mm) nJ yauge ('»i (mm) i-mi*
Median Diagonal(a) Circular specimens2 10 3 4.3 - 0.04 x nr3 - 0.04 10 ~ 24 2.,x - o.iox iir2 - 0.06 10~25 \J - 0.74 x IO' 2 - 0.70 10'-’Mi“ 0.5 > - 0.2 —2 7.5 I 4.3 - 0.0-S x nr2 - 0.07 I0~22 3 - 0.15 X 10“2 - 0.14 10~23 1.6 — 0.52 x ur2 -0.51 10~2H)d 0.45 > - 0.2 —2 5 1 1.4 - 0.63 x nr2 -0.63 10“2io- 0.6 > - 0.2 —(bi Si/uare specimens2 10 i 7.3 - o.o2x ur- - 0.02 x 10" 23 4.4 0.05 x 10" 2 0.02 x 10“J5 U - 1,0-S x 10“2 - 1.00 x 10~27 7.1 - o.oi x 10""* - 0.01 x I0-2S 4.3 — 0.04 x I0“2 - 0.04 x I0“21.3 -0 » x I0“2 - 0.47 x IO-2uv 0.6 > - 0.2 —2 7.5 1 4.4 0.02 x nr2 O.oi x IO“2■> 2>) 0.11 x lir- 0.04 x 10“-3 U — 0.35 x ur2 - 0.2S x IO“27 4.3 0.04 x nr2 0.00S 2.x - II. 10x |0~- 0.009 1.4 - 0.55 x I0~2 - 0.4* x IO“2UV 0.5 > - 0.2 —2 5 1 1J - 0.26x 10"2 - 0.22 x IO“2ri } 7 - o.on x nr2 0.04 x IO“27 1.3 - i.70x I0~2 - 1.63 x IO“21UJ 0.S > - 0.2 —
JGau<:e failure before end of lest
The affect of mesh density with regard to plugging failure was also examined and it was found that there was a unique asymptotic value of the residual velocity of the plate as the mesh density increases, see figure 2 .8 .
Carney et al. [6] conducted a study of turbine fan cases with the aim of weight reduction. A simulation of the fan blade containment system was tested experimentally at the NASA GRC Ballistic Impact lab and analysed using the finite element code LS-DYNA. Two configurations were tested, that of a simple flat plate and that of a plate with convex curvature.
23

Figure 2.8: Calculated residual velocity vs. element number through thethickness of the plate [35]
It was seen that the curved plate forced the blade to deform plastically, dissipating energy before the full impact and this resulted in higher ballistic velocity for the curved plate. The finite element analysis proved to have good correlation with the experimental results except with respect to the projectile which experienced less deformation than seen experimentally.
The effects of pre-pressurisation on aircraft fuselage panels subjected to impact loading were investigated by Veldman et al. [36]. While the cause of the impact loading (explosives) was significantly different from the other studies reviewed it was felt that the effect of pre-pressurisation was an interesting case. A plate was subjected to tests where an explosive was detonated at a fixed distance from both un-pressurized and pressurised plates. In addition to this finite element simulations were carried out using the ANSYS/LS-DYNA. Comparisons between the experimental and finite element results showed good correlation with regard to permanent deformation of the plate. For the explosive loads measured no significant change in deformation was noted as the pre- pressurisation was increased from OkPa to 62.1kPa. No perforation of the plates occurred during the testing and it is thought that pre-pressurisation might have a more significant effect in this case.
24

The final study reviewed here, presented by Anghileri et al. [37], sought to develop numerical methods of predicting damage from hail on aircraft structures. Three numerical models were developed; a finite element model, an arbitrary Langrangain Eulerian (ALE) and a smooth particle hydrodynamics (SPH) model. Initial comparisons were made of impact to flat plates and all three methods resembled experimental tests closely. Subsequently simulations were created of an impact to the nose-lip of an engine nacelle and the results were compared with documented damage with regard to deformation shape and size. Although the differences between the models seemed to be minor it was concluded the SPD model was the most efficient and effective as this model granted the closest correlation to experimental results and has a considerably shorter computation time.
2.6 Summary of Chapter 2
A literature review of impact to plate and aircraft structures was conducted of both experimental and computational studies and it was noted that:
• The deformation behaviour was at its most complex in the range surrounding the ballistic velocity of the plate.
• The most common failure mechanism for conical projectiles was that of ductile hole enlargement with petalling.
• Shear plugging was seen to be the most common form of failure with blunt projectiles.
• For other projectiles such as hemispherical nosed and ogival shapescombinations of shear plugging and ductile hole enlargement wereobserved.
• In general the ballistic velocity was seen to be greater for blunt nosed projectiles with the limit for conical and hemispherical nosed projectiles being similar
• Plate thickness was seen to be a significant factor in perforation withdifferent failure modes observed as the plate thickness increased
25

Residual projectile velocities were often used to compare experimental results and calculate energy absorbed during impact and it was seen that residual velocities reach a minimum just above the ballistic limit and subsequently increase monotonically.In finite element studies mesh size, element choice and material models were seen to be significant parameters and it was noted that the element size at impact needed to be 20%-25% of the smallest impact area to ensure sufficient accuracyBoth shell and solid elements were used successfully in the impact simulations presented although it was observed that solid elements were necessary when dealing with complex assembliesThe two most commonly used material models were the plastic kinematic hardening model which used the Cowper-Symonds model to describe strain-rate, and the Johnson-Cook temperature dependent visco-plasticity model.Some other numerical methods used included the arbitrary Langrangian Eulerian (ALE) methods and the smooth particle hydrodynamics (SPD) method.
26

3. Theory of Im pact to Plates and Plate Structures
3.1 Introduction
Impact Mechanics is a complex area of study and it can be divided into many areas of consideration. The analysis of an impact on a semi-infinite medium differs considerably from an analysis of a plate impact. It is allowable to consider a plate impact if the thickness of the plate is o f the same order of magnitude as the diameter of the projectile and the lateral extent of the plate is at least an order of magnitude greater [38]. Beams are defined as structures having a length that is large compared with the height and breath of the member. In this case the main area of interest is the plastic deformation and often partial or complete penetration of the plate. As a result of this the assumption of perfect plastic behavior for the material can be made. The following theory is drawn primarily from reference [39].
3.2 Static Plastic Behaviour of Beams and Plates
To gain a better understanding of the theory behind the dynamic plastic behavior of beams and plates we must first look briefly at the static case. With the assumption of perfect plasticity it is possible to obtain the principal characteristics of the structural response without too much difficulty and with confidence of a reasonable degree of accuracy when compared with experimental results. Firstly some basic beam equations need to be introduced.
3.2.1 Basic Equations for BeamsIt is common in beam theory to replace the actual force distribution across the depth of the beam by a shear force, Q = iAaxzdA, and a bending moment, M = iAoxzdA, as seen in figure 3.1. The actual strain field is then described in terms
27
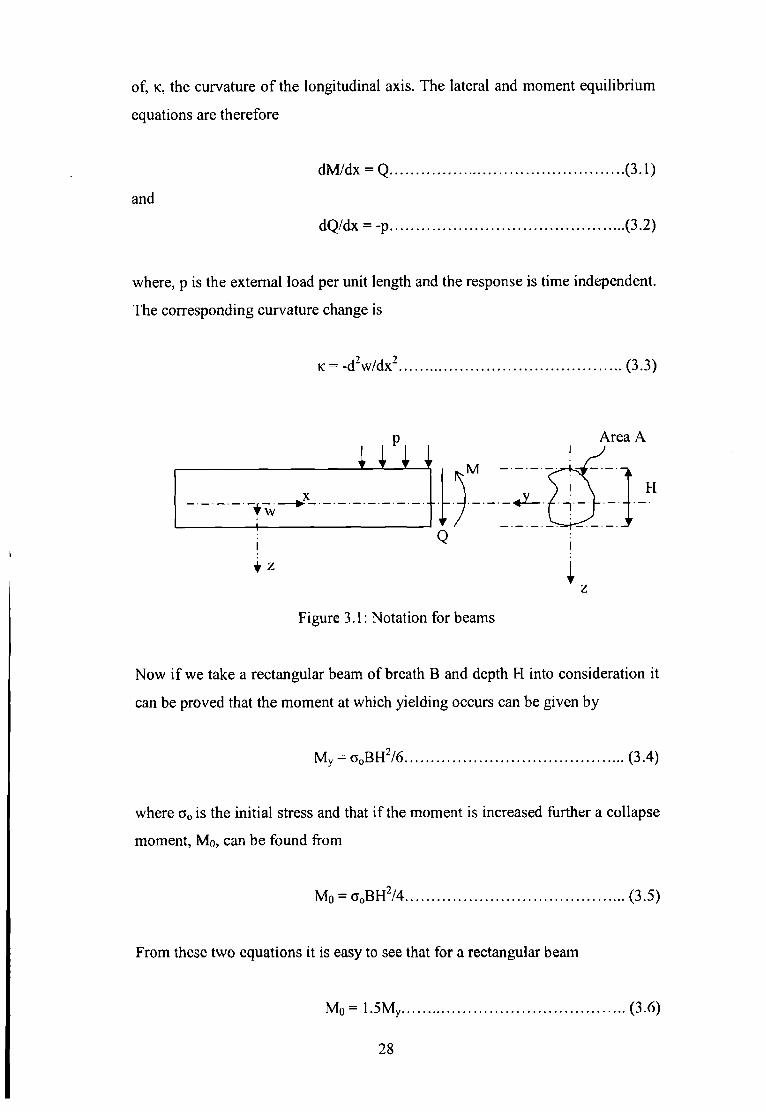
of, k , the curvature of the longitudinal axis. The lateral and moment equilibrium equations are therefore
dM/dx = Q...............................................................(3.1)and
dQ/dx = -p...............................................................(3.2)
where, p is the external load per unit length and the response is time independent. The corresponding curvature change is
k = -d2w/dx2............................................................ (3.3)
i z
Figure 3.1: Notation for beams
Now if we take a rectangular beam of breath B and depth H into consideration it can be proved that the moment at which yielding occurs can be given by
My = c„BH2/ 6 ............................................................(3.4)
where c 0 is the initial stress and that if the moment is increased further a collapse moment, Mo, can be found from
M0 = o0BH2/4 ............................................................(3.5)
From these two equations it is easy to see that for a rectangular beam
M0 = 1.5My................................................................. (3.6)
28

This 1.5 value is known as the shape factor and depends on the cross-sectional shape of a beam.
3.2.2 Plastic Collapse Theory for beams
In the last section it was shown that M0 was the moment required for the plastic collapse of a square cross-sectional beam. However this does not explain how beams fail when subjected to a bending moment distribution that varies along its axis. For this we need the limit theorems of plasticity which can provide estimates for the static collapse loads for any external static load. The theorems consist of the lower and upper bound theorems which apply to the static (equilibrium) and kinematic (deformation) requirements respectively.
3.2.2.1 The Lower Bound Theorem
The lower bound theorem states: If any system of bending moments, which is in equilibrium with the applied loads and which nowhere violates the yield condition, can be found, then the beam will not collapse, or is at the point of collapse (incident collapse)
It is assumed that F(x) is defined as the set of external loads that cause incidentcollapse of the beam and the collapse mechanism for the beam is described by a
• • •velocity profile, co (x), and a rotation rate 9 with 9\ at i locations. These discretelocations are where the rigid parts of the beam are connected to each other and they are known as plastic hinges. The bending moment distribution is then givenby M(x) and Mj at the plastic hinges. According to the principal of virtualvelocities [40] it can then be stated that
lA /,0 , = \F c o d x (3.7)

The object of the lower bound theorem in then to find a multiplier A,1 so that the load ^F(x) does not cause the collapse of the beam. The bending moment Ms(x) is then statically admissible if it satisfies the equilibrium equation is section 3.2.1 above and if it never exceeds the yield moment M0. Again using the principle of virtual velocities we can say that
Z M /0 . = \ X F œ d x .....................................................(3.8)
which when subtracted from the previous equation gives
(1 - Â ' ) i F codx = Z(M,. - M I ) 0 ............................................ (3.9)
By the assumption that M and 9 are non-negative it can be said that M 9 > 0 and that according to the definition of a statically admissible bending field |MS| > |M|. Therefore it can be said that
(M,.- M ; ) 9 i > 0 ..................... (3.10)
and from equation 3.9
( l - A' ) i Fcodx > 0 ......................................................(3.11)
and since the external work rate
Fcodx> 0 ............................................................ (3.12)
%}< 1............................................................... (3.13)
This proves the lower bound theorem stated above as the multiplier I 1 will not cause collapse of the beam.
30

3.2.2.2 The Upper Bound Theorem
The upper bound theorem states: If the work rate of the system of applied loads during any kinematically admissible collapse of a beam is equated to the corresponding internal energy dissipation rate, then that system of loads will cause collapse, or incident collapse, o f the beam.
Let it be assumed that a beam collapses under a load X,uF(x) with a bendingmoment distribution Mk(x) and a velocity field co k(x), which has rotation rates •0 kj at j plastic hinges. Thus it can be said that the external work rate is equal to
the internal energy dissipation
• •'LMkJ 6 ki= \ X!Fa>k d x .............................................. (3.14)
where Mkj is the bending moment at the plastic hinges.Again using the principal of virtual velocities it is possible to show that
(A" -1 ) \Fcok dx = I (M ) - M j ) 0 j ..................................... (3.15)
and therefore prover > 0 .................................................................................................... ( 3 . 1 6 )
proving the upper bound theorem for perfect plastic beams as stated above.
3.2.2.3 The Exact Static Collapse Load
To get the exact static collapse load both the upper and lower bound theorem results must be true. This can only happen in one case where
A ,'= r= l ..................................................................... (3.17)
31
The solution is then both statically and kinematically admissible.
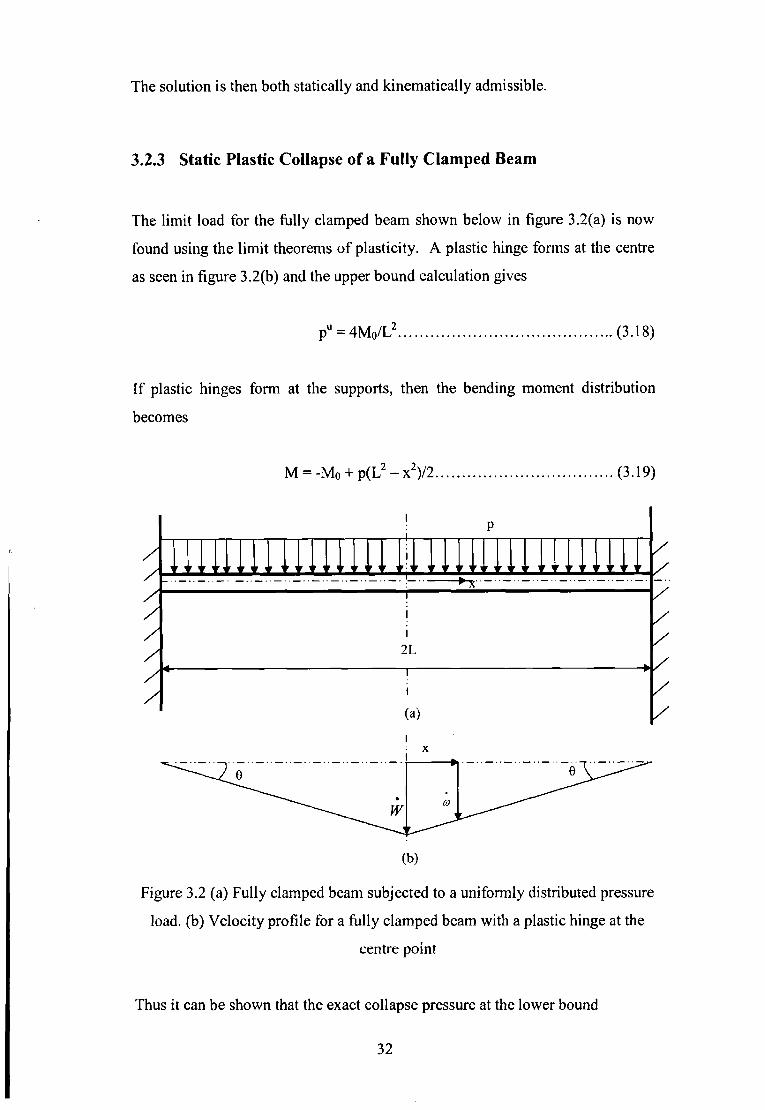
3.2.3 Static Plastic Collapse o f a Fully Clamped Beam
The limit load for the fully clamped beam shown below in figure 3.2(a) is now found using the limit theorems of plasticity. A plastic hinge forms at the centre as seen in figure 3.2(b) and the upper bound calculation gives
pu = 4M0/L2.......................................................... (3.18)
If plastic hinges form at the supports, then the bending moment distribution becomes
M = -M0 + p(L2 — x2)/2................................................ (3.19)
U ///////
Iii
2LT “
(a)
Figure 3.2 (a) Fully clamped beam subjected to a uniformly distributed pressure load, (b) Velocity profile for a fully clamped beam with a plastic hinge at the
centre point
Thus it can be shown that the exact collapse pressure at the lower bound
32
p 1 = 4M0/L2 (3.20)
is obtained when the maximum value of M in eq. (3.19) above is equal to Mo. The exact collapse pressure for a fully clamped beam according to the limits theorems of plasticity is therefore
~pc = m j i } ........................................................ (3.2i)
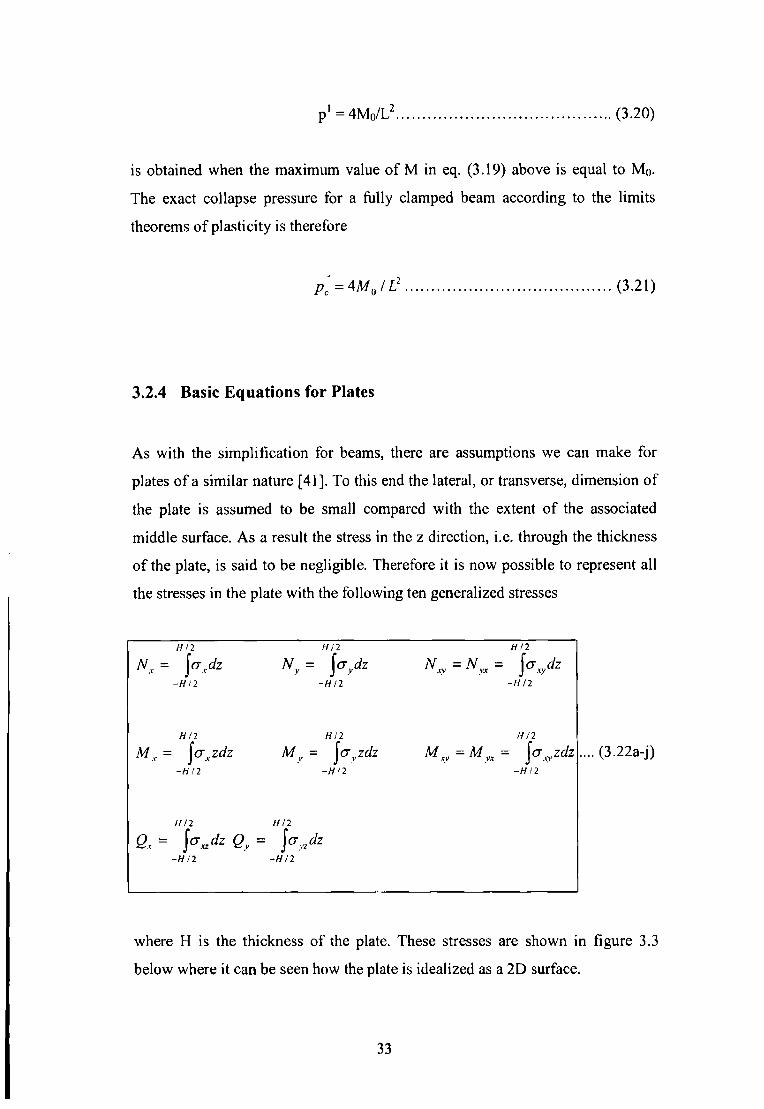
3.2.4 Basic Equations for Plates
As with the simplification for beams, there are assumptions we can make for plates of a similar nature [41]. To this end the lateral, or transverse, dimension of the plate is assumed to be small compared with the extent of the associated middle surface. As a result the stress in the z direction, i.e. through the thickness of the plate, is said to be negligible. Therefore it is now possible to represent all the stresses in the plate with the following ten generalized stresses
HI 2 HI 2 HI 2Nx = ¡crxdz N y = \ a ydz Nxy = N yx = j a^dz
-HI 2 - HI 2 - HI 2
HI 2 HI 2 H/ 2M x = jcr,zdz M y = Jcr yzdz M xy = M yx = fcr^zdz
- H/ 2 - HI 2 - H/ 2
H/2 H12Q, = J o a dz Qy = J a y!dz
- HI 2 - H/ 2
.... (3.22a-j)
where H is the thickness of the plate. These stresses are shown in figure 3.3 below where it can be seen how the plate is idealized as a 2D surface.
33
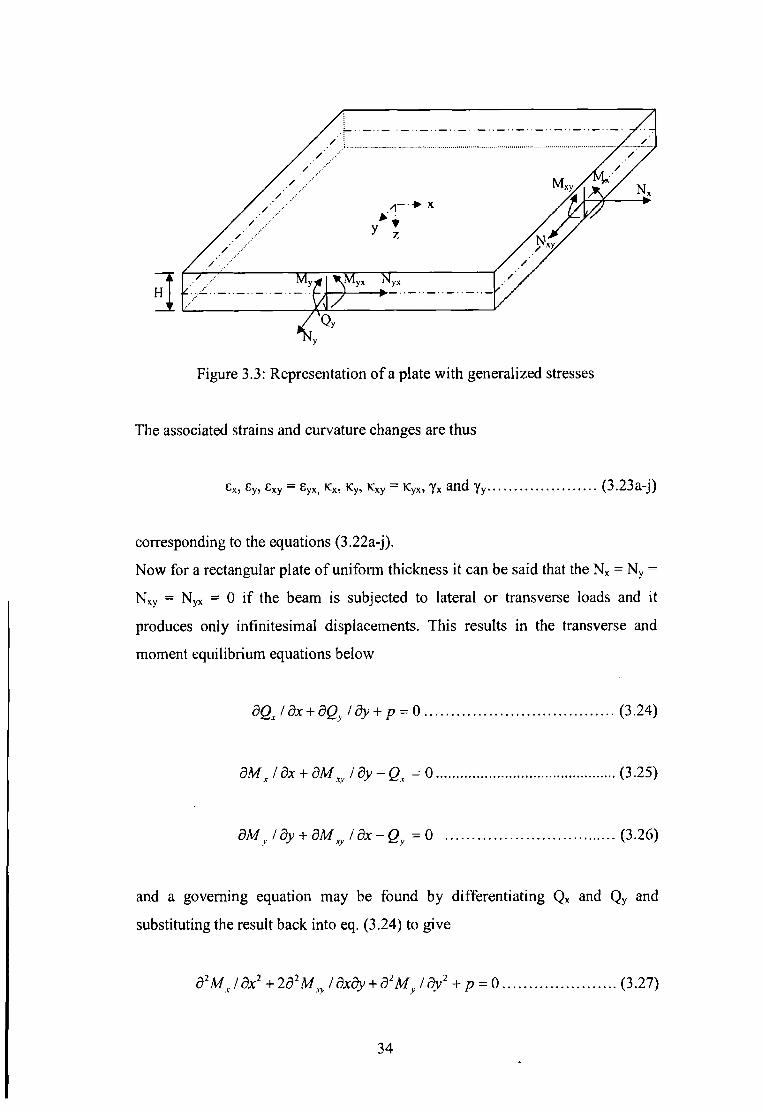
Figure 3.3: Representation o f a plate with generalized stresses
The associated strains and curvature changes are thus
(3.23a-j)
corresponding to the equations (3.22a-j).Now for a rectangular plate of uniform thickness it can be said that the Nx = Ny = Nxy = Nyx = 0 if the beam is subjected to lateral or transverse loads and it produces only infinitesimal displacements. This results in the transverse and moment equilibrium equations below
and a governing equation may be found by differentiating Qx and Qy and substituting the result back into eq. (3.24) to give
dQx / dx + dQy / dy + p - 0 (3.24)
dM T / dx + dMxy / d y - Q x = 0 (3.25)
dM y i dy + dM ̂ I d x - Q y = 0 (3.26)
d2M x / dx2 + 2d1M ry / dxdy + d2M y /dy2+ p = 0 (3.27)

The principal bending moments, M | and M2, are then defined as
M ,= M + M , (3.28)
+M: (3.29)
3.2.5 Static Collapse of Plate with Simple Supports
2B
I2L
n n n n u u n n n n u u n u n + u n u n i .1H
:----------------------------------------Figure 3.4: Simply supported rectangular plate subjected to a uniformly
distributed load
To find the exact collapse pressure for the simply supported beam shown in figure 3.4 the limit theorems of plasticity are again used just as with beams. The plate is assumed to behave in a perfectly plastic manner and to obey the Johansen yield criterion shown in figure 3.5. If the square, Johansen, yield curve had |Mj| = M0/2 and IM2I = Mo/2 then it would inscribe the Tresca yield criterion [42] that the plate material is assumed to obey.
35

Figure 3.5: Tresca (hexagonal) yield condition with inscribed Johansen yieldcriterion [42]
3.2.5.1 Lower Bound Calculations
Now symmetry can now be used to further simplify the problem as the plasticcollapse of a rectangular plate is symmetrical around both the x and the y axesand therefore only one quadrant is considered. As a result the bending moment must be written in the form
Mx = Mo -ax2My = M o-by2 ..............................................(3.30a-c)
Mxy = -cxy
where a = MJ L 2, b = M„/B2 and c = M<>/BL.So by differentiating the above generalized stresses and substituting them into the governing equation (3.27-3.29) it can be shown that the
p l = 2 M 0[l + y B + ( y B)2] /L2 ..................................... (3.31)j
is the lower bound to the exact collapse pressure for a rectangular perfectly plastic plate.
36

3.2.5.2 Upper Bound Calculations
The transverse velocity profile in figure 3.6 is kinematically admissible and can be used to calculate the upper bound to the static collapse pressure for the rectangular plate. It is expressed in the form
.........................................(3.32)
in region I and
w = W { B - y ) ! B .....................................................(3.33)
in region II where W is the maximum transverse velocity at the centre of theplate. The angular velocities at the outer support boundaries of the two regions are
- W ! B t o n ^ . . . . . ......... (3.34)
02 = W! B ...............................................................(3.35)
and at the boundary between the regions is
¿3 = 07 5 sin ̂ .......................................................... (3.36)
Therefore the total internal energy dissipated in the plate is
D = 4M 0 W(L/B + co tfi)........................................... (3.37)
37

2L(a) x
(b)
Figure 3.6: Static plastic collapse of a simply supported rectangular plate (a) plan view of plastic hinge (b) side view of transverse velocity profile
where Mo = aoH2/4.If the internal energy dissipation is then equated to the external work rate, which is
E = 2B2 W p " ( L / B - t a n 0 / 3 ) (3.38)
then the static collapse pressure can be found to be
6M0(l + /7/tan <j>) 5 2(3-/?tan^) (3.39)
where P = B/L.
The collapse pressure pu is then at a minimum when - = 0 thus5 tan (j>
tan (j> = ~P + yjl + p (3.40)
38

Substituting this in eq. (3.39) gives the exact collapse pressure to be
P„= 2 , 6-M ° ------^ .........................................- (3 .4 1 )3 2(V3 + P 2 - P Ÿ
3.3 Dynamic Plastic Behaviour of Beams and Plates
3.3.1 Considerations for Dynamic Plastic Collapse o f Beams
The assumptions and simplifications that were made earlier in the earlier sections for beams are still relevant here, when discussing dynamic loading. The elastic effects are again assumed to be negligible and therefore the perfect plastic model is again adopted. The procedure for generating the theoretical solution is very similar to that of the static case and indeed the kinematically admissible velocity field needed is often very similar to the static collapse profile. The normalityrequirements of plasticity are used to find the correct portion of the yield surfacethat is associated with the velocity field by integrating the governing equations and meeting the initial and boundary conditions it is usually possible to find a solution. However if there have been any yield violations then the velocity profile used is insufficient and another must be tried for these cases. The governing equations for the dynamic behavior of a beam are
Q = d M ! d x ..................................................(3.42)
dQi dx = - p + md2w / d t 2 ....................................(3.43)
K = - d 2wfdx2 ................................................(3.44)
which are the same as the equations for the static case except in eq. (3.43) where the effects of inertia are included. Thus the theoretical solution must satisfy
39

equations (3.42) and (3.43) along with the initial and boundary conditions. The bending moment, M, must remain statically admissible i.e. -Mo<M<Mo and not violate yield conditions. The curvature rate vector in the active plastic regionmust also be normal to the yield curve at the corresponding point i.e. k > 0 whenM = Mo and k < 0 when M = -Mo. The theoretical solution is then said to be exact if the generalised stress field is statically admissible and the transverse velocity field is kinematically admissible.
3.3.2 Dynamic Collapse o f a Simply Supported Beam
Now under consideration is the dynamic response of the beam shown in figure 3.7. It is subjected to a pressure pulse, figure 3.7(c), which may be expressed in the form
The above equations suggest that it is convenient to consider the analysis in two time steps i.e. 0 < t < r and t < t < T where T is the duration of the motion of the beam. As before we need only consider one half of the beam 0 < x < L due to symmetry.
3.3.2.1 First Phase of Motion 0 < t < t
The transverse velocity field shown above in figure 3.7(b) can be expressed in the form
p = p0 for 0 < t < x (3.45)and
p = 0 for t > i (3.46)
• ♦w = W( 1 - x/L) for 0 < x < L (3.47)
where W is the lateral velocity at the midpoint.
40

p
Po
T(C)
Figure 3.7: (a) Uniformly loaded beam with simple supports, (b) Transverse velocity field, (c) Rectangular pressure pulse.
The change in the curvature k can be shown by equations (3.44) and (3.47) to be♦zero except at x = 0 where k = oo. This means that the beam can be idealised as
two rigid section connected by a plastic hinge. Now by differentiating eq. (3.42) and substituting it into eq. (3.43) it is possible to show that
d2MIdx2 = - p 0 + m ( l - x ! L ) d 2WIdt2 .................................(3.48)
which when integrated gives
M = - p Qx2 /2 + m(x2 / 2 - x } /6L)d2WIdt2 + M a ........................... (3.49)
41

but since M = 0 at x = L for a simply supported beam
d2W/dt2 = 3(r| - l)Mo/mL2.............................................. (3.50)
where r| = p0/pc is the ratio of the dynamic pressure pulse to the static collapsepressure load. Integrating with respect to time and taking into account that thefirst phase of motion is finished at t = x gives
W = 3(r| - 1)M0 T2/2mL2..................................................(3.51)and
FT = 3 ( i i - l)M0 T/mL2....................................................(3.52)
3.3.2.2 Second Phase of Motion t < t < T
At t = t the pressure p0 is removed and displacement in this section is caused by residual kinetic energy as the beam still has a transverse velocity. The velocity field is assumed to still be valid so eq. (3.50) now becomes
d2W/dt2 = 3M0/mL2......................................................(3.53)
which when integrated using equations (3.51) and (3.52) as initial conditionsgives
W = 3 Mo (2ti Tt - t^irc2) /2mL2.........................................(3.54)
f f = 3 M 0 (t| t — t) /mL2................................................ (3.55)
The beam reaches it final position when W = 0 as there is no elastic unloading for a perfectly plastic material. This occurs when T = rye according to eq. (3.54). The final deformation profile can then be given by
w = 3t|(t| - 1)M0t2(1- x/L)/2mL2 ......................................... (3.56)
42

3.3.2.3 Static AdmissibilityiIThe above analysis stratifies the initial conditions, boundary conditions and equilibrium equations but it is necessary to check that the bending moment does not violate the yield conditions anywhere along the length of the beam. If eq. (3.49) is rewritten using eq. (3.50) as
M/Mo = 1 - Tl(x/L)2 + (n - 1 )(3 - x/L)(x/L)2/2 ............................ (3.57)
it can be seen that dM/dx = 0 for x = 0. Also
(L2/M0)d2M/dx2 = ri - 3 - 3(ri - l)x /L .................................... (3.58)which gives d2M/dx2 > 0 as long as r| < 3. This means the analysis is staticallyadmissible provided rj < 3 or pc < po < 3pc. For pressures above 3pc the solution is incorrect and a new velocity profile must be found that satisfies all the conditions.
3.3.3 Dynam ic Collapse of a Simply Supported Beam for p0> 3pc
In order to obtain the correct solution in this case it is necessary to create a different transverse velocity profile. The yield violations in the previous analysis can give valuable hints as to a correct shape for this profile. Equation (3.58) with r| > 3 and x = 0 is positive which implies that a local minimum develops in the bending at the mid-span. This suggests the velocity profile shown in figure 3.8 where plastic hinges form at x = and T\ is the time at which the travellingplastic hinges meet at the midpoint and become stationary.
3.3.3.1 First Phase of Motion
The transverse velocity field is given by
w = JV i, 0< x < C o ..............................................(3.59a)
43

< L L
i
(b)
(c)
Figure 3.8: Transverse velocity profile for a simply supported beam with subject to a pressure load greater than 3pc. (a) First Phase of motion, 0 < t < t. (b) Second
Phase of motion x < t < Tj. (c) Third Phase of motion Ti < t < T.
andw = W i ( L - x ) / ( L - £ 0) 9 Co< x < L ............................. (3.59b)
It is assumed the plastic hinge at x = ^ remains stationary for the first phase of motion. According to the equilibrium equations (3.42-3.44) and the first part of the velocity profile (3.59a) it can then be shown that
44

d1M / d x 2 = - p 0 + m d 2WJ d t \ 0 < x < ^ 0 (3.60)
which when integrated with respect to x gives
dM I dx = (~p0 + md2W{ I dt2) x ........................................ (3.61)
However since dM I dx = Q = 0 at the plastic hinges we get
M = M0............................................................... (3.62)
when it is integrated further.Now for the second part of the velocity profile (3.59b) and according to the equilibrium equations (3.42-3.44)
d 2M / d x 2 = - p (l+ m[ (L- x) / (L-<Z<i)]d2Wi / d t 2, C o< x< L .........(3.63)
which when integrated becomes
dM I dx = - p 0x + p 0(Lx - x2 /2)i (L - <̂0) + A] ........................(3.64)
where Ai = poCo- poio(L- C0/2)/(L- £q) and when integrated again becomes
M = - p 0x 2 + Po(Lx2 ¡ 2 - x 3 / 6 ) ! ( L - £ 0) + Alx + Bl ...................(3.65)
where B, = p0L2/2 - p0L3/3(L - &>) - p & L + poC0L(L - QJ2)/(L - &,).Since we must satisfy the yield condition that M = Mo at the plastic hinge it can be shown that
0 - £o)2 = 3 / 7 ......................................................... (3.66)where = £$/L.The bending moment distribution now becomes
45

% • =r j ------------------------z r ~ ^ \ --------------- > C o<x<L3(T-Co)(3.67)
2 2From equation (3.61) and (3.62) it can be seen that md Wi/dt = p0 so integrating
dW,/dt = pot/m .............................................(3.68)and
W| = p0t2/2m.......................................................... (3.69)
3.3.3.2 Second Phase of Motion, t < t < Ti
In the second phase of motion the pressure load is removed and beam continuesto be deformed by the remaining kinetic energy. The velocity profile is describedas per figure 3.8(b) where the plastic hinges are assumed to be moving in
* •towards the mid-span of the beam. W i is replaced by W 2 and po = 0 for 0 < x < £ and therefore
d2W2/dt2 = 0 ......................................................... (3.70)
dW2/dt = pot/m...................................................... (3.71)
W2 = pott/m - po^^m ......................................................(3.72)
The governing equation becomes
d 2M / dx2 = p 0r L—X, W / d t ....................................... (3.73)Cl - Q
which when integrated becomes
46
(.Lx - x/ 2 Kd M/ d t = p Qr ^ A — + A.(L - O ' (3.74)
U - f y t ■ ■where A2 = - p 0rC - 2 and integrating again gives
° ( £ - £ )(3.75)
where B2 = - ^ - /¡2Z.. At the travelling plastic hinges M =M0 so3 ( W )
therefore from equation (3.75) it can be seen that
M0 = - Pot ( L - £ ) / 3 (3.76)
Therefore it can be shown that the bending moment distribution is
M,M, 2 1(3.77)
3.3.3.3 Third Phase of Motion, T| < t < T
In the final phase of motion the plastic hinge remains stationary at the mid-spanft *
of the beam which results in = 0 and W i is replaced by W 3 . Equations (3.42- 3.44) now give
47
d2M / ô x 2 = m ( \ - x / L ) W 3 .............................................(3.78)
dM / dx = m(x - x 2 / 2L) W3 .............................................(3.79)
andM = m(x2 / 2 + x 3 / 6L) W, + M 0 ........................................ (3.80)
As equation (3.80) needs to satisfy the simply supported boundary conditions itcan be in the form
W3 ~ -3M 0 / m l ) ..................................................... (3.81)
The transverse velocity can then be found by integrating
fF3 = - 3 M 0t / mL2 + 3 p 0r / 2 m ........................................ (3.82)
which when integrated gives
and integrating again the transverse displacement is given by
Wy = - 3 M 0t 2 !2mL2 + 3 p 0tr 1 2 m - p 0r 2 1 2 m - p^L2r 2 !24mM0 .... (3.83)
Finally the bending moment distribution, from equation (3.81), is given by
M/M0 = 1 - (3x2/L2 - x3/L3)/2, for 0 < x < L...........................(3.84)
The static and kinematic admissibility of the above solution can be proved similar to section 3.3.2.3 [43].
48

The same basic procedure developed for beams in the previously section will beThe same basic procedure developed for beams in the previously section will be used for the analysis of the dynamic collapse o f plates. When considering the dynamic collapse of a rectangular plate it is found that the governing equations are
dQx I dx + dQy / dy + p - f i w ........................................... (3.85)
dMx / dx + dMxy / d y - Q x = 0 ............................................ (3 .8 6 )
dMy / dy + dM^ f d x - Q y = 0 ............................................ (3.87)
Kx = - d 2widx2 ....................................................... (3.88)
Kv ^ - d 2w i d y 2 ....................................................... (3.89)
fcxy = - d 2wi dxdy ...................................................... (3.90)
The principal bending moments are now given by
M, = ( M x + M J / 2 + t] ( Mx - M J 2 + 4M]y / 2 ...........................(3 .9 1 )
M , = ( M x + M y ) / 2 - ^ ( M , - M y ) 2 + 4 M l / 2 ........................... (3 .9 2 )
where Mx, My and Mxy are defined in figure 3.9 below.
3.3.4 Considerations for the Dynamic Collapse of a Plate
49
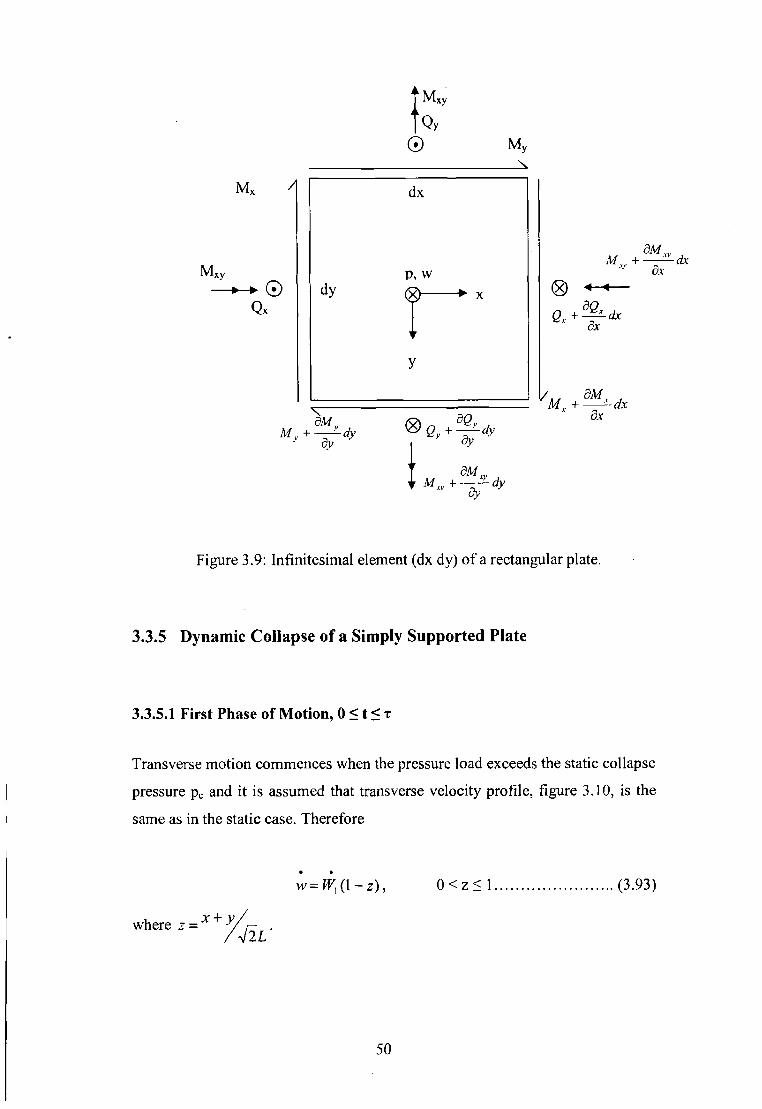
lì©
xy
M
M + dMxdx dx
ex
/ . , dMKM r + ---- dxx dx
Figure 3.9: Infinitesimal element (dx dy) of a rectangular plate.
3.3.5 Dynamic Collapse o f a Simply Supported Plate
3.3.5.1 First Phase of Motion, 0 < t < r
Transverse motion commences when the pressure load exceeds the static collapse pressure pc and it is assumed that transverse velocity profile, figure 3.10, is the same as in the static case. Therefore
w = W l( \ - z ) , 0 < z < 1..................................(3.93)
w h erez- jr+X & . '
50
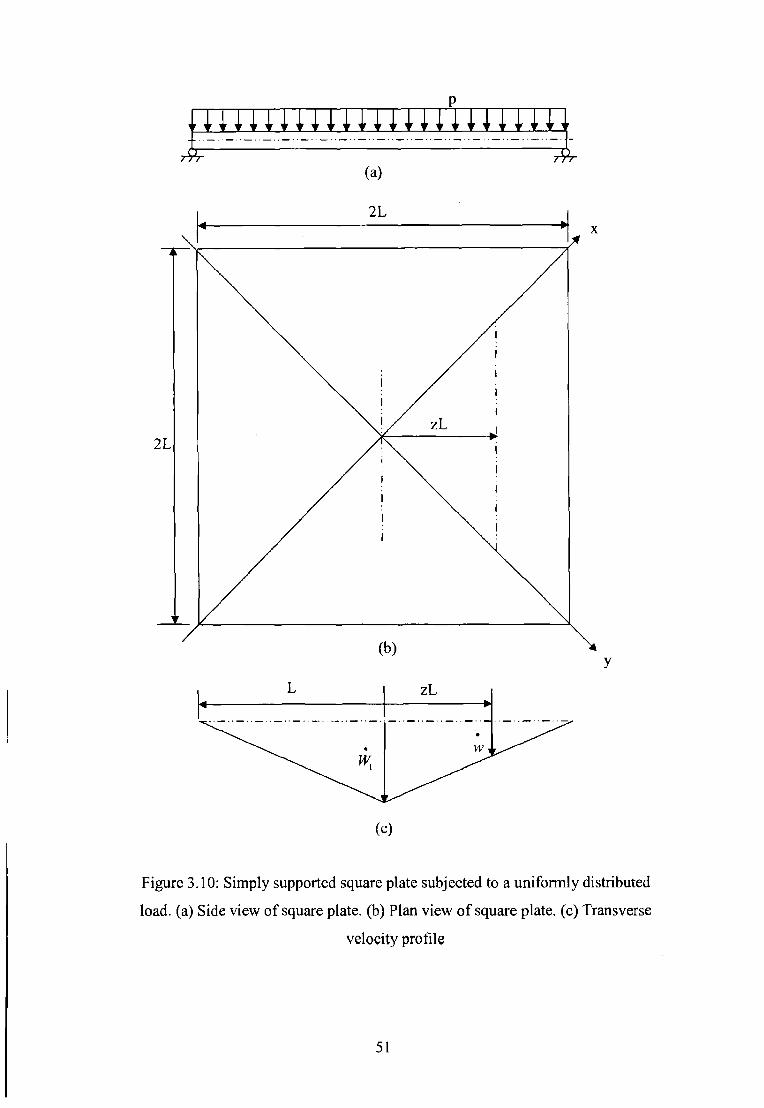
(C)
Figure 3.10: Simply supported square plate subjected to a uniformly distributed load, (a) Side view of square plate, (b) Plan view of square plate, (c) Transverse
velocity profile
51

From the equilibrium equations (3.85.-3.88) and using p = po and the transverse velocity profile it is possible to show that
d2M x t d x 2 Jr 2 d 1M xy I d x d y + d lM v / dy2 = fJ,Wx (1 - z) - p 0 (3.94)
From symmetry considerations it can be shown that Mx = My = Mq and Mxy = 0 at the centre of the plate and along the plastic hinges it can be shown that
My = Mo when y = 0 and 0 < x < 4 l L ................................ (3.95)and
Mx = Mo when x = 0 and 0 < y < 4 l L ................................. (3.96)
Thus from the Johansen yield condition it can be shown that
M, = (M x + M y ) / 2 + J ( M x + M y y + 4 M lxy 12 = M , ............................( 3 . 9 7 )
- M 0 < M , = ( Mx + M y) / 2 - tJ(Mx + M y )2 + 4 M]y / 2 < M 0 ............................ (3.98)
Simplifying, these equations can be written
Mx = M0 + x2f,(z)................................................... (3.99)
My = M0 + ^ 1(2) ................................................. (3.100)
Mxy = xyf,(z)......................................................(3.101)
where f x =(/uWl- p 0) / 6 - juW{z /12 .The simply supported boundary condition requires that
(Mx+ My)/2 + M xy = 0, z = 1 ............................. (3.102)
52

thus substituting in equations (3.99-3.101) gives
juW{ = 2 (p0 - p c) ................................................. (3.103)
Integrating with respect to time gives the transverse velocity
w = 2 ( p 0 - p c) z ( l - z ) / h ..........................................(3.104)
and the transverse displacement
w ='1(Po (3.105)
3.3.S.2 Second Phase of Motion
When the pressure pulse is removed from the plate at t = x the remaining kinetic energy in the plate results in a second phase of motion where the energy is dissipated plastically. The transverse velocity profile remains the same
w = i v 2( l - z ) ..................................................... (3.106)
but p = 0 for t > x. Therefore the governing equation can now be written
d 2M x idx 2 + 2d2M xyidxdy'+d2M y I dy2 = juW 2( \ - z ) ..................(3.107)
Equations (3.99-3.101) remain valid with f[ replacedby f 2 = ju W2 / 6 - // W2 z /12 . Thus the simply supported boundary condition yields
¿iW2 = - 2 p c .........................................................(3.108)
53
and integrating with respect to time gives
w2 = 2 (p 0r - p ct) l H (3.109)
w2 =-PJ21 V + 2p0tr! / / - p^1 /n (3.110)
3.3.5.3 Static Admissibility
It may be shown by substituting equations (3.99-3.101) and equation (3.103) into equation (3.97) that Mj = Mo, 0 < z < 1 which satisfies equation (3.97) for the first phase of motion. Similarly substituting in equations (3.99-3.101) into the inequality (3.98) results in
which shows a yield violation at the plate centre when r\ > 2. Thus a different velocity profile is required for loads greater than 2 pc similar to the beam outlined in section 3.3.3.
3.4 Effects of finite displacements
In the previous sections it was assumed that the displacements that the elements of the beams or plates were undergoing were infinitesimal. The equilibrium equations were developed for the undeformed shape and ignored any change in shape during an impact event. This method has proved to be accurate in many cases and has been verified by experimental testing. However, it is evident that if the change in geometry is not ignored then the previous equilibrium equations
“M0 < M0 + (x2 + y2)f1(z) < M0 (3.111)
which can be rearranged into the form
(3.112)
54

fail to describe the problem. The membrane force shown in figure 3.11 turns out to be the most important development of a finite displacement.
The centre line of the beam must be longer when the beam with axial restraints is deformed and this deformation creates an axial membrane strain and the membrane force N shown in figure 3.11. As seen in section 3.2.1 the equilibrium of a beam with infinitesimal displacements is governed by a bending moment M and a shear force Q but when transverse displacements are considered a third force, the membrane force N must be considered. As the transverse displacement increases so does the effect of the membrane force until the other forces become negligible themselves. This is known as a string response and at this point a beam made from perfectly plastic material will flow plastically at the fully plastic membrane force No for the cross-section. Similar geometry changes can also occur during the static and dynamic responses of plates and have similar effect on their equilibrium equations. No general theorems have been developed for finite displacement analysis of beams and plates that are of interest here but some have been obtained for special cases and have good correlation with experimental results [44].
55

3.5 Strain Rate Effects
In the previous sections it has been assumed that the plastic flow in the structures were independent o f strain rate. However, for many materials this is not the case. This is known as strain rate sensitivity or viscoplasticity. Figure 3.12 below shows a graph of mild steel subjected different strain rates during tensile tests.
(a) e
<b) e'eqFigure 3.12: (a) Engineering and (b) equivalent true stress-strain curves for the
mild steel at several strain rates [45]
From figure 3.12 it is evident that mild steel has a high sensitivity to strain rate. Some materials are sensitive to a lesser extent or not at all and often experimentation is needed to provide accurate data for a range of different strain rates. Stain rate sensitivity is a material effect and the geometry of the object has no effect with regard to it. The influence of strain rate sensitivity is that of a strengthening effect and so it is often taken as an extra safety factor in design.
56

3.5.1 Cowper-Symonds Constitutive Equation
There has been a lot of research undertaken to find constitutive equations that describe the strain rate sensitivity of materials resulting in many different equations. Experimental work is needed to generate the coefficients needed for these equations and in some cases this can be extensive. Even then there is still much debate on the accuracy o f the models. One equation that is popular is the Cowper-Symonds constitutive equation because of its simplicity. The Cowper- Symonds equation states
e = D Z l - 1 (3.113)
where a0 is the dynamic flow stress at a uniaxial plastic strain rate e , ao is the associated static flow stress, and D and q are constants of a particular material. If values of D = 40.4s"1 and q = 5 are used close agreement to the graph in figure 3.12 is seen for mild steel.
3.6 Early Time response/Near Contact Phenomenon
The near contact phenomena of an impact to a plate structure are concerned with the deformation immediately around the region in which the impact occurs. They occur within the same order of time taken for a stress wave to propagate through the plate which can generally be measured in microseconds. Thus they are also known as the early time response of the structure. Some of the factors which affect the behavior of this response include the speed and angle of impact, the shape of the projectile, the material properties o f the plate and of the projectile and the ratio of the projectile diameter to the plate thickness [38].
As already mentioned the shape of the projectile, or more correctly the projectile nose shape, is a major consideration when try to predict impact behaviour. There are three categories of projectiles recognized:
57

1. ogival and the conical ended circular cylinder,2 . the square ended circular cylinder and3. spherical
It should be noted that the deformations described are due to normal impact of the projectile and that impact at an angle can cause changes in this behavior. The velocities of the projectile range from 50m/s to lOOOm/s for penetration behavior. Impacts above these speeds are known as transvelocity and hypervelocity impacts and have distinct properties.
Conical-ended, ogival and to some extent spherical projectiles all have similar behavior starting by indentation of the plate. With ductile materials this indentation is accompanied by a coronet around the impact site, see figure 3.13. With brittle materials the behavior includes fractures immediately under the projectile. As a result of the high strain rates brittle behavior is more commonly observed when dealing with penetration analysis. As the conical-ended or ogival projectile, penetrates further the mode of deformation changes. The metal is now pushed radially outwards resulting in radial compression of the material involved.
(>») (Vi
Figure 3.13: (a) Impact of square-ended projectile causing plugging, (b) Impact of conical projectile with a comet at the impact site and some petalling. [12]
Finally, sometimes accompanied by spalling cracks, the bottom layers are dished, fractured and bent downwards as the projectile penetrates the plate. There is
58

often pet ailing o f the material if it is ductile. The behavior o f the plate during impact with a square-ended projectile, see figure 3.14, and in some cases ball projectiles, is quite different from that o f an ogival projectile. In these cases a plug is punched from the plate with cracks being formed parallel to and ahead of the projectile as it penetrates. There is also the possibility that one side of the plug will remain attached and will result in the petalling effect. The plug diameter is usually equivalent to that of the projectile and is usually dished shaped. This is because it tends to be forced out at high velocity, but with the edges restrained they are held back while the centre progresses. The inertia o f the plug plays a significant role during the impact event as do the strength properties of the plate. From experiments [38] it is seen that the plug and the projectile have almost the same velocity at the moment o f separation from the plate. The velocity o f the plug and projectile vr can be given by
vr= v02 - v b: /I +ms/mp........................................ (3.114)
where v0 is the initial projectile velocity, v& is the ballistic velocity just sufficient to cause ejection o f the plug, m, is the mass o f the plug and mp the mass o f the projectile.
i
Figure 3.14: Square-ended projectile causing plugging in plate [46]
3.7 Summary of Chapter 3
This chapter concerned the theory o f impact mechanics specifically with impact on thin plates in mind. A study was made o f the theory o f plastic deformation and near contact phenomena causing failure.
59

4. Analysis of Simple Plate Structures4.1 Introduction
This chapter concerns the experimental and computational analysis of a simple sheet metal aircraft structure subject to high energy impact. The idea is to gain in-depth understanding of this simple problem to facilitate analysis of more complex structures. Experimental testing was carried out using an existing gas powered projectile launcher. Thin aluminium plates were impacted at velocities up to 150m/s with a titanium projectile. Computer simulations were then carried out using the Ansys/Ls-Dyna software attempting to reproduce the impact event accurately.
4.2 Experimental Testing
4.2.1 The Experim ental Test Set-up
As mentioned above experimental testing was undertaken to allow for validation for the finite element model and to provide knowledge in its own right. It was carried out using an existing impact testing rig, shown in figure 4.1, which had been modified for the purpose [48]. Aluminium plates 150mm2 were clamped on two 28mm strips on each side. The idea of using smaller strips to conserve material was considered but it was found that the clamping mechanism was insufficient and the plates slipped when impacted. The plates used were 1mm thick 2014 T4 Aluminium. The projectile, which was a titanium (Ti-6A1-4V) cylinder 9mm in diameter and 19mm long, was placed in a lm barrel and shot at the test plates. The projectile launcher was powered from a compressed nitrogen gas cylinder. A reservoir was filled with the gas and then released into the barrel by a solenoid valve. The projectile was thereby fired down the barrel at velocities up to 150m/s. The velocity of the projectile was measured as it exited the barrel by means of a laser and receiver. A timer measured the length of time the laser
60

beam was broken and the velocity o f the projectile could then be calculated by dividing the length o f the projectile by the time taken for it to pass the laser.
Figure 4.1: Gas powered projectile launcher
The projectile was caught either in the shielded box surrounding the clamping mechanism, if it failed to penetrate the plate, or in a bucket filled with cloth to absorb the impact if it penetrated the plate. This whole area was sealed o ff by aluminium plate during operation for safety.
6 1

4.2.2 Initial Testing
Tests were performed at a range of velocities from 50m/s to 150m/and it was noted that for most of the velocities the tests were very repeatable with regard to the deformation of the plate. Below approximately 90m/s the plate would deform slightly with a dishing in the centre where the projectile impacted. Above approximately 130m/s a plug was ejected from the plate more or less the same diameter as the projectile, again with dishing of the plate around the impact site and slight deformation of the plate in other areas. However, between 90m/s and 130m/s, the behaviour of the plate was much more complex and the results less repeatable. This was the range of velocities surrounding the ballistic velocity of the plate, the velocity at which the plate was perforated by the projectile, and because of these variations it was decided to concentrates the analysis on velocities in this region.
4.2.3 Ballistic Velocity Testing
A series of further tests were thus undertaken at velocities around the ballistic velocity. For this case the ballistic velocity was taken to be the velocity needed to obtain any perforation of the plate by the projectile. Twenty plates were tested at velocities between 90m/s and 130m/s. A 10mm grid was drawn on the plates to help identify the damage. Three distinct groups of damage were noted
• No perforation (figure 4.2)• Perforation without completed penetration of the plate (figure 4.3)• and complete penetration of the plate by the projectile (figure 4.4)
The first occurred mostly in the 90m/s- lOOm/s range but also in two other plates, one at 117m/s and the other at 119m/s. The second case occurred at a low of 99.7m/s but other wise was confined to the 115m/s-120m/s range. This perforation was accompanied by a petalling of the plate where the projectile hit. The final case occurred at velocities greater than 119m/s and the deformation was either petalling, as in the previous case, or plugging, as with the greater than 130m/s cases. However the hole in these cases also experienced some tearing with oblong holes noted in some of the cases.
62

Figure 4.2; Case I ; No perforation o f the plate
Figure 4.3: Case 2: Perforation and petalling of the plate
63
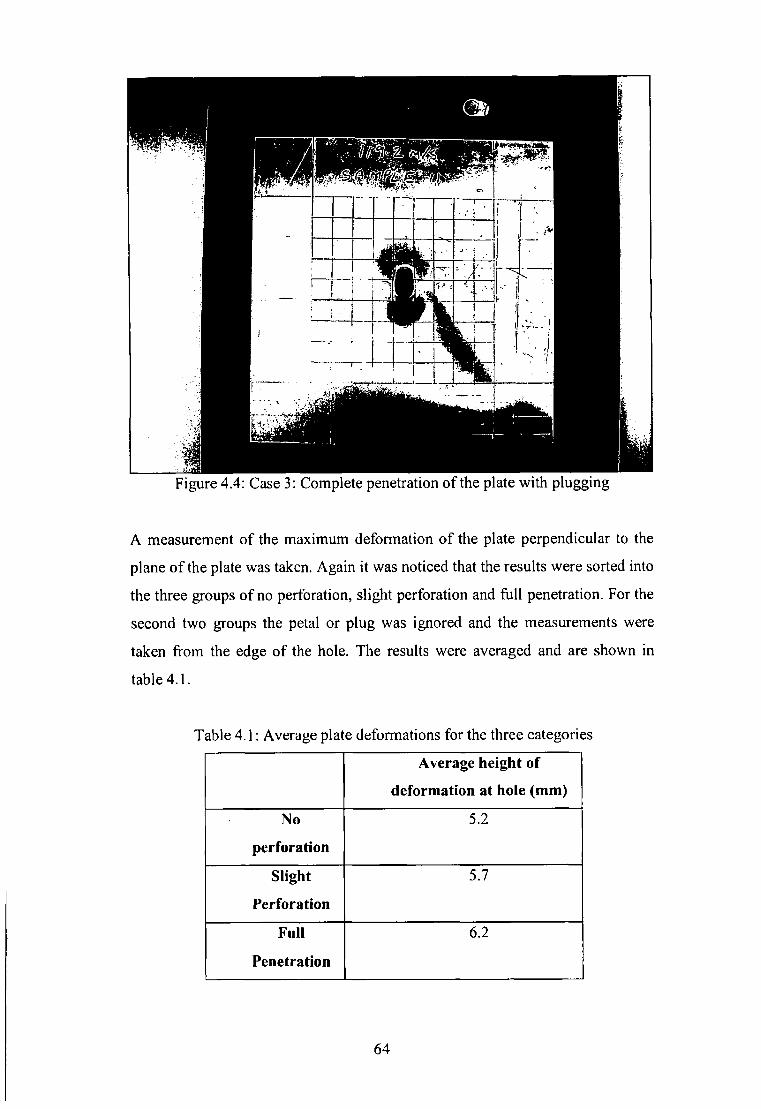
Figure 4.4: Case 3: Complete penetration o f the plate with plugging
A measurement of the maximum deformation of the plate perpendicular to the plane of the plate was taken. Again it was noticed that the results were sorted into the three groups of no perforation, slight perforation and full penetration. For the second two groups the petal or plug was ignored and the measurements were taken from the edge of the hole. The results were averaged and are shown in table 4.1.
Table 4.1: Average plate deformations for the three categoriesAverage height of
deformation at hole (mm)No
perforation5.2
SlightPerforation
5.7
FullPenetration
6.2
64

4.3 Modelling the Simple Plate
The software package used for the finite element modelling and solution was Ansys/Ls-Dyna which was chosen because of previous experience with Ansys, its proven ability to solve dynamic problems [9] and its availability. Ansys was used initially for post-processing o f the results but when the file became large it proved to be inadequate and LS-Prepost, the post-processor supplied with Ls- Dyna, was used subsequently. The computer hardware used was a 2.7Ghz Pentium IV with 512Mb of RAM. The parameters for the material model for the A1 2014 material were taken from the material specifications given by the supplier (see appendix 1) and the parameters for the titanium model were adapted from those used by Knight et al [9]. The parameters used are shown in table 4.2 below. The tangent modulus was calculated as a linear approximation between the yield stress and the ultimate tensile stress on the stress-strain graph. The model is a non-linear plastic kinematic model. The stress-strain curve is essentially bilinear and is described by the Young’s modulus and the tangent modulus. The hardening parameter gives a combination of isotropic and kinematic hardening. The model on the left, representing the plate material Al 2014 T4, also has a failure strain specified at which point the elements in the
Table 4.2: (left) Material model for A12014 T4. (right) Material Model for Ti-6A1-4V
Plastic Kinematic Properties for Material Numbe...® Plastic Kinematic Properties for Material Numbe...fx) |Plastic Kinematic Material Properties for Material Number 1 | | Plastic Kinematic Material Properties for Material Number 2
DENS I \ DENS IBHBME&affilHlEX (72.4 1 EX ¡110.32NUXY ¡0.33 NUXY (3.3Yield Stress (0 255 Yield Stress (0.8274Tangent Modulus [0.768 Tangent Modulus [2.0685Hardening Parm |0.2 Hardening Parm MStrain Rate (c) [6500 Strain Rate (c) 1°Strain Rate (P) h Strain Rate (P) |0Failure Strain • ¡0.2 iiFailure Strain p ............
I 0K | Cancel Help | OK Cancel j Help j I
65

mesh concerned would fail. The titanium model does not need this parameter as it is not expected to fail. The models used by Knight et al [9] did not take strain rate sensitivity o f the materials into account. Their effects are examined later in section 4.3.4. With a view to future, more complex, models that would need two contact surfaces it was decided to use solid 164 elements rather than shell elements to build the model. The geometry of the problem was created such that the projectile was offset from the plate by 1mm. This offset distance was chosen so that too much processor time was not wasted while the projectile was travelling through air before hitting the plate. The plate was initially meshed with 3600 brick elements, which included four elements through the thickness of the plate and 30 along either side, and the projectile was meshed with 76 brick elements. An eroding surface to surface contact algorithm was setup between the projectile and the plate. This algorithm allowed for deformation to occur to both the elements in the plate and the projectile up to the point where the failure strain was reached in an element, at which point it was eroded from the solution. Using this method allowed through thickness damage to occur in the plate. The projectile experienced little or no deformation due to its shape and superior stiffness. The nodes of the plates were constrained in all directions along two 28mm wide strips on opposite sides of the plate to simulate the clamping of the plate. A velocity, initially 90m/s, was then prescribed to nodes making up the projectile. At this velocity it was calculated that the projectile would take 0.01ms to reach the plate. As a result the solution time, the time at which the simulation would end, was set to Sms as a “first guess” as to how long would be needed for the complete impact event to occur. However after the results of the first simulation were examined it was clear that all of the significant events occurred within a much shorter time frame. As a result further simulations were carried out using the more suitable solution time of 0.5ms.
4.3.1 Initial Results
As already mentioned above the initial velocity prescribed to the projectile in the simulation was 90m/s, the lower end of the range of velocities used in the experimental testing. The results of the simulation were encouraging with the plate being deformed in a similar fashion with a dish shaped indentation at the
66
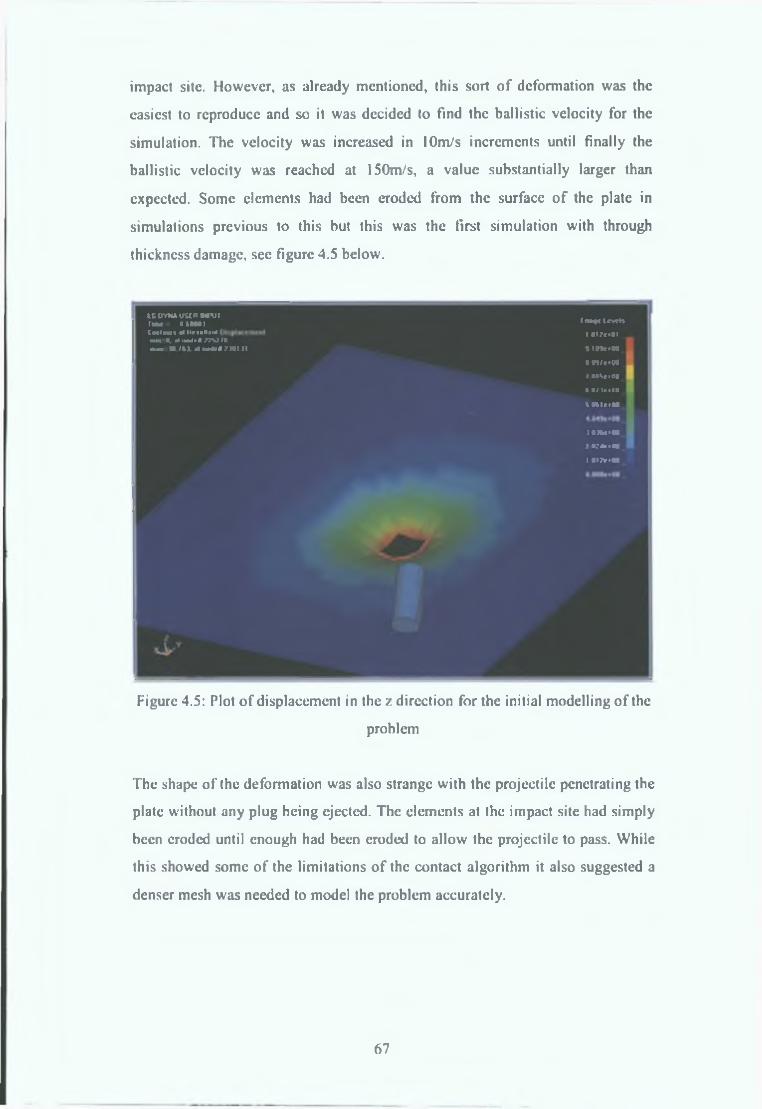
impact site. However, as already mentioned, this sort o f deformation was the easiest to reproduce and so it was decided to find the ballistic velocity for the simulation. The velocity was increased in lOm/s increments until finally the ballistic velocity was reached at 150m/s, a value substantially larger than expected. Some elements had been eroded from the surface o f the plate in simulations previous to this but this was the first simulation with through thickncss damage, sec figure 4.5 below.
LCOYNAVSCM •« 'V ilIMM ' (1600111 f r t a f t I c v r t tC u l l » Uf H r» » « ..* I i i ; o i im u. 0. .1 I w l r l . W I Im a i M ( t L H « * l 7 N I ] l 1 1 t v * 00
■ n /c > Mi oosooo
» O /lf.O Ot a t t o o «
1 0 * « < 0 03 • . '* » • 0 0 _i ot?r>oa .
Figure 4.5: Plot of displacement in the /. direction for the initial modelling o f theproblem
The shape o f the deformation was also strange with the projectile penetrating the plate without any plug being ejectcd. The elements at the impact site had simply been eroded until enough had been eroded to allow the projectile to pass. While this showed some of the limitations o f the contact algorithm it also suggested a denser mesh was needed to model the problem accurately.
67
4.3.2 Examination of Mesh Convergence
It is widely accepted that there is a convergence in the results o f a linear finite element model as the mesh density is increased and that to obtain an accurate solution this convergence should be sought [49]. An example o f an inaccurate solution was presented in the section above where although the geometry and loading conditions o f the problem were correct the lack o f adequate mesh density caused the solution to be inaccurate. Often designers are content to accept the results o f a simulation if they appear to be correct but, as will be seen in the following section, the solution which may look correct is not always the converged solution and while the unconverged solution may seem correct at the time it may prove to be unpredictable when loading conditions or other parameters are changed. It was assumed before beginning this investigation o f mesh convergence that the accuracy o f the solution would increase gradually, settling as the point o f convergence was reached however what was experienced was more like an oscillation which decreased as convergence was reached as the results varied significantly as the mesh was refined. Several simulations whose results seemed to tally closely with the experimental observations were followed by models o f greater mesh density with hugely different results.
The first aspect o f the mesh density to be examined was the effect o f the number o f elements through the thickness o f the plate. Previous literature [9,28] have put forward that a thickness o f three or four elements is needed for accuracy and after some tests four was seen to be the best solution. After this the surface mesh was increased in a uniform manner by increasing the number o f elements along each side o f the plate to 50, 70, 90 etc. As the mesh density was increased the features o f deformation seen in the experimental testing began to appear. At a surface mesh density o f 70x70 the plate underwent pettaling as can be seen below in figure 4.6. The ballistic velocity at this point was quite reasonable, at 135m/s, when compared with the experimental results but as the mesh was increased again the solution changed considerably. After the petalling the deformed shape changed to plugging for ballistic impacts which penetrated the plate and remained so until convergence was achieved.
6 8

Figure 4.6: (left) Plugging o f plate, (right) Petalling o f plate
It was decided to use the ballistic velocity as the convergence factor and it settled eventually when the mesh density reached 155x155 for the surface o f the plate, which gave a total o f 96100 elements in the plate. Figure 4.7 shows a plot o f the ballistic velocity plotted against an increasing number o f elements. A steadier, more monotonic increase was expected as seen by Teng and Wierzbicki [35] (see figure 2.10) but it can still clearly be seen that the ballistic velocity settles at approximately lOOm/s with the results o f the last two simulations being almost identical and that the results o f the previous simulations contained considerable errors.
Bd*McVstoc*y
N ftO ttlO T « «
Figure 4.7: Graph o f ballistic velocity vs. number o f elements
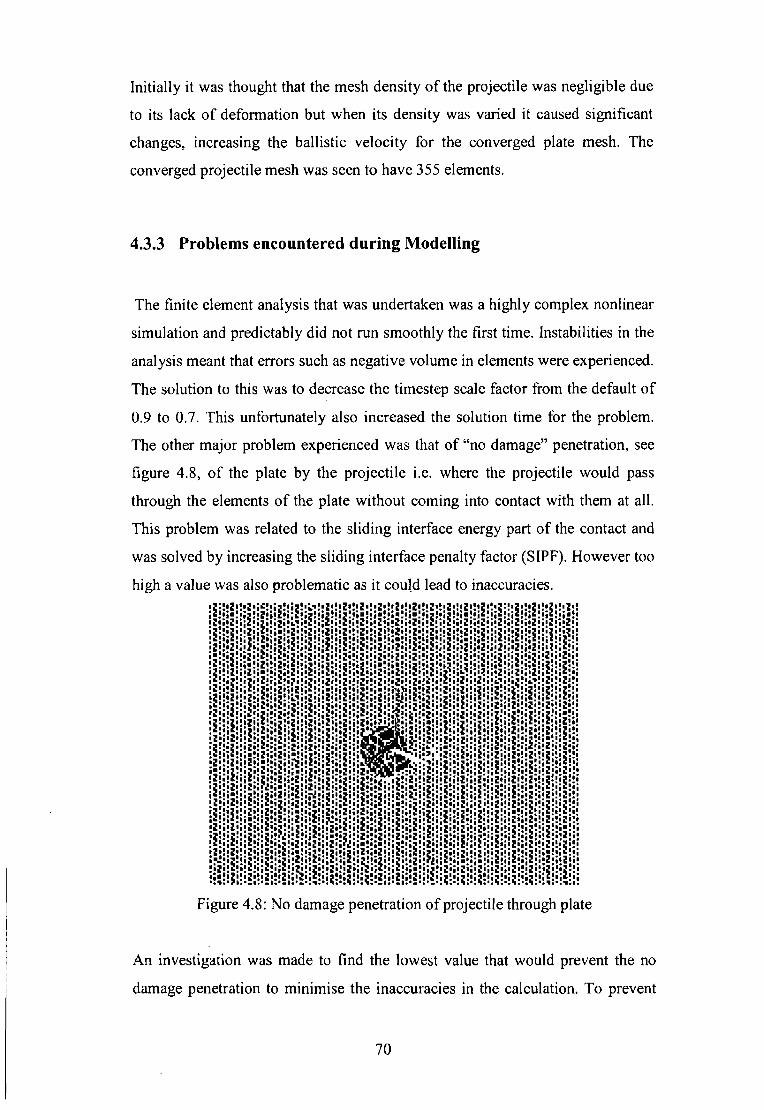
Initially it was thought that the mesh density o f the projectile was negligible due to its lack o f deformation but when its density was varied it caused significant changes, increasing the ballistic velocity for the converged plate mesh. The converged projectile mesh was seen to have 355 elements.
4.3.3 Problems encountered during Modelling
The finite element analysis that was undertaken was a highly complex nonlinear simulation and predictably did not run smoothly the first time. Instabilities in the analysis meant that errors such as negative volume in elements were experienced. The solution to this was to decrease the timestep scale factor from the default o f 0.9 to 0.7. This unfortunately also increased the solution time for the problem. The other major problem experienced was that o f “no damage” penetration, see figure 4.8, o f the plate by the projectile i.e. where the projectile would pass through the elements o f the plate without coming into contact with them at all. This problem was related to the sliding interface energy part o f the contact and was solved by increasing the sliding interface penalty factor (SIPF). However too high a value was also problematic as it could lead to inaccuracies.
Figure 4.8: No damage penetration o f projectile through plate
An investigation was made to find the lowest value that would prevent the no damage penetration to minimise the inaccuracies in the calculation. To prevent
70
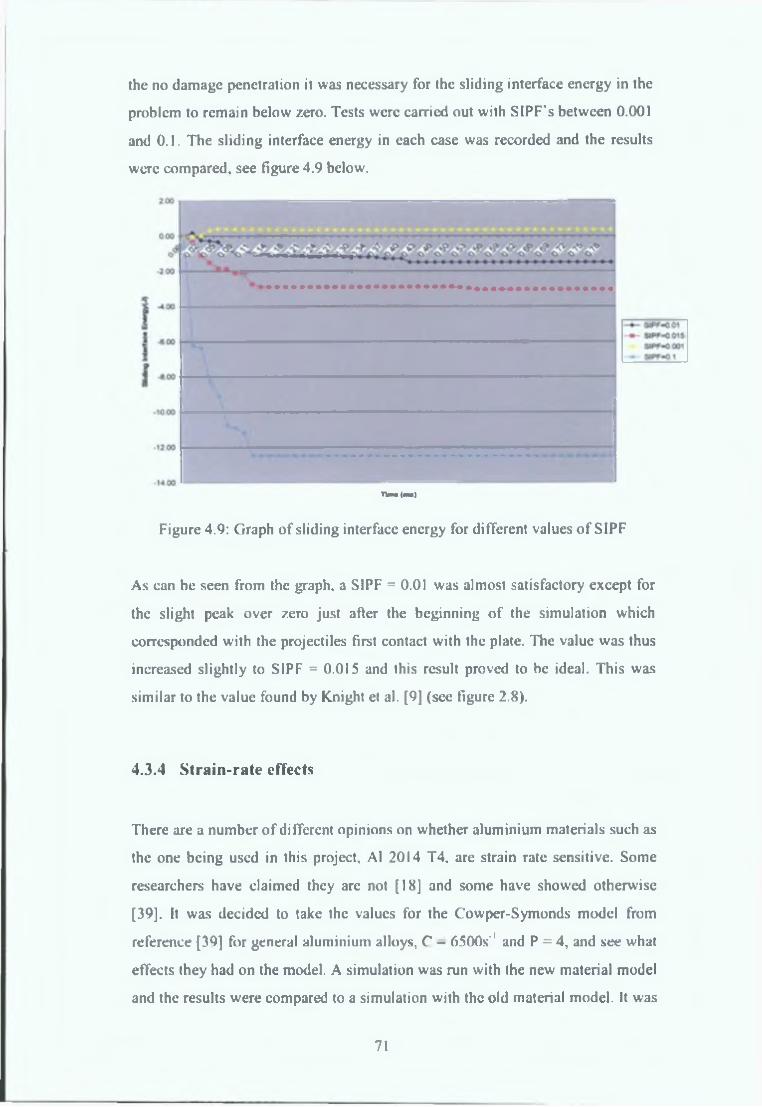
the no damage penetration it was necessary for the sliding interface energy in the problem to remain below zero. Tests were carried out with SIPF's between 0.001 and 0.1. The sliding interface energy in each case was recorded and the results were compared, see figure 4.9 below.
Tkn«(m *)
Figure 4.9: Graph o f sliding interface energy for different values o f SIPF
As can be seen from the graph, a SIPF = 0.01 was almost satisfactory except for the slight peak over zero just after the beginning o f the simulation which corresponded with the projectiles first contact with the plate. The value was thus increased slightly to SIPF = 0.015 and this result proved to be ideal. This was similar to the value found by Knight et al. [9] (see figure 2.8).
4.3.4 Strain-rate effects
There are a number o f different opinions on whether aluminium materials such as the one being used in this project, Al 2014 T4, are strain rate sensitive. Some researchers have claimed they are not [18] and some have showed otherwise [39]. It was decided to take the values for the Cowper-Symonds model from reference [39] for general aluminium alloys, C - 6500s’1 and P = 4, and see what effects they had on the model. A simulation was run with the new material model and the results were compared to a simulation with the old material model. It was
71
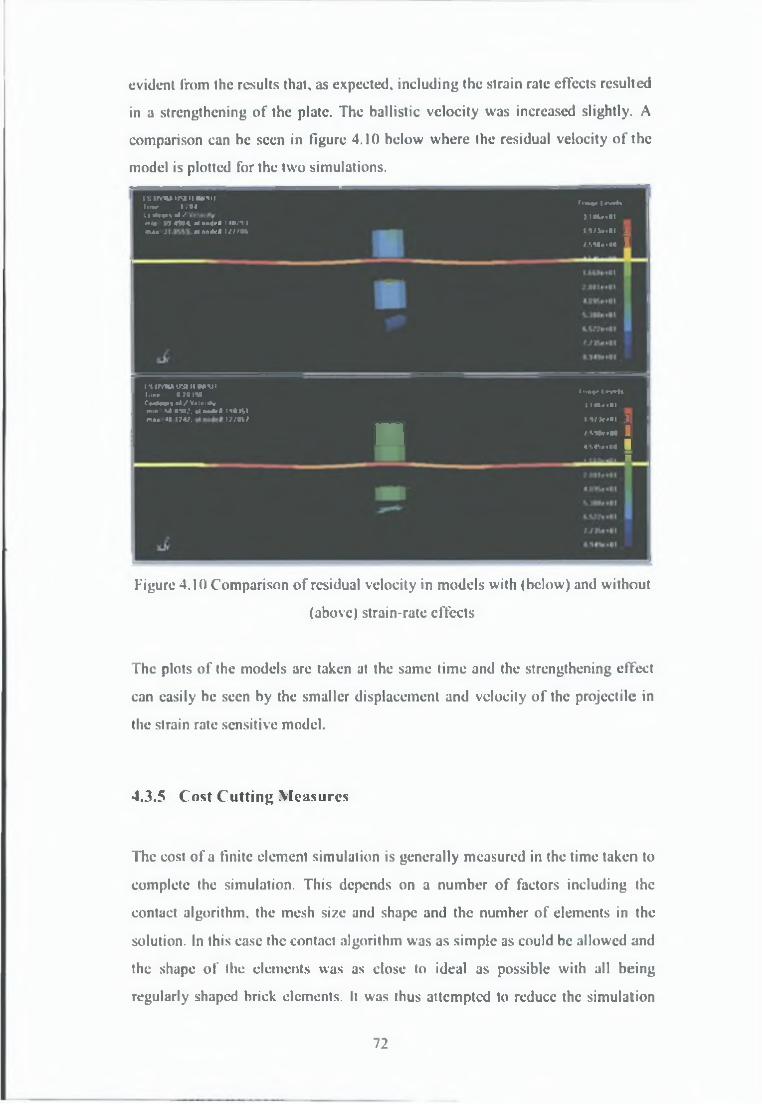
evident from the results that, as expected, including the strain rate effects resulted in a strengthening o f the plate. The ballistic velocity was increased slightly. A comparison can be seen in figure 4.10 below where the residual velocity o f the model is plotted for the two simulations.
IS irVNA IISIII Ml* IIIm I .»« lt«*oe livrtiC i lin •* / 1 IKe'01ml* n m x »ndrf 1 «U.-11ffUa Jl dHodc« !/;/•% ll/loll 1/ '»IOit • 110 1
ISO Y IU U SIH IN IU Ilititr 0 70 I'M 1 iiAifr 1 i v r hCm M i n l/V rlu .# » 1 1 M r i l lmin M I'M.’. « * ~ » ' l I10JSIm»» *0 1 2 V . I / /B 1 / ________ I V k i l l I
■ f M k i M 14.S«S*«I0 I1 I tH .i l l l I
Figure 4.10 Comparison o f residual velocity in models with (below) and without(above) strain-rate effects
The plots o f the models are taken at the same time and the strengthening effect can easily be seen by the smaller displacement and velocity o f the projectile in the strain rate sensitive model.
4.3.5 Cost Cutting Measures
The cost o f a finite element simulation is generally measured in the time taken to complete the simulation. This depends on a number o f factors including the contact algorithm, the mesh size and shape and the number o f elements in the solution. In this case the contact algorithm was as simple as could be allowed and the shape o f the elements was as close to ideal as possible with all being regularly shaped brick elements. It was thus attempted to reduce the simulation
7 2
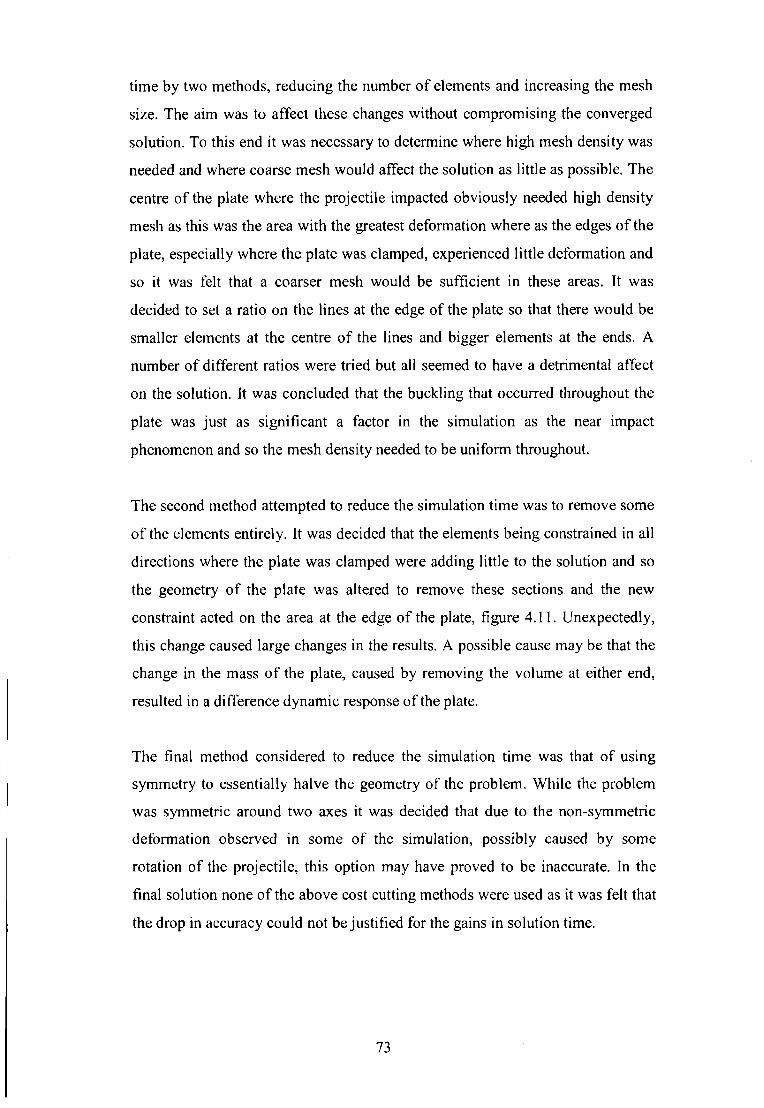
time by two methods, reducing the number o f elements and increasing the mesh size. The aim was to affect these changes without compromising the converged solution. To this end it was necessary to determine where high mesh density was needed and where coarse mesh would affect the solution as little as possible. The centre o f the plate where the projectile impacted obviously needed high density mesh as this was the area with the greatest deformation where as the edges o f the plate, especially where the plate was clamped, experienced little deformation and so it was felt that a coarser mesh would be sufficient in these areas. It was decided to set a ratio on the lines at the edge o f the plate so that there would be smaller elements at the centre o f the lines and bigger elements at the ends. A number o f different ratios were tried but all seemed to have a detrimental affect on the solution. It was concluded that the buckling that occurred throughout the plate was just as significant a factor in the simulation as the near impact phenomenon and so the mesh density needed to be uniform throughout.
The second method attempted to reduce the simulation time was to remove some o f the elements entirely. It was decided that the elements being constrained in all directions where the plate was clamped were adding little to the solution and so the geometry o f the plate was altered to remove these sections and the new constraint acted on the area at the edge o f the plate, figure 4.11. Unexpectedly, this change caused large changes in the results. A possible cause may be that the change in the mass o f the plate, caused by removing the volume at either end, resulted in a difference dynamic response o f the plate.
The final method considered to reduce the simulation time was that o f using symmetry to essentially halve the geometry o f the problem. While the problem was symmetric around two axes it was decided that due to the non-symmetric deformation observed in some o f the simulation, possibly caused by some rotation o f the projectile, this option may have proved to be inaccurate. In the final solution none o f the above cost cutting methods were used as it was felt that the drop in accuracy could not be justified for the gains in solution time.
7 3
Figure 4 .11: Mesh after removal o f elements under clamps anil with line ratios
4.3.6 The Final Results for the Simple Plate
The Final results for the simple plate are shown below. The finite element solutions were compared with the experimental results in three ways. A comparison was made between
• the projectile velocity needed for the various deformations,• the maximum deformation in the z-dircetion. excluding the ejected plug
or petal, experienced by the plate, and• the appearances o f the deformations in each case.
The finite element model appeared to give a reasonable prediction o f the ballistic velocity o f the plate with it occurring at KWm's whereas during experimental testing is occurred anywhere in the 115m/s-l20m/s range, except for the anomaly where some penetration was seen at 100m/s, table 4.3.
74

T a b l e 4 . 3 : C o m p a r i s o n b e t w e e n e x p e r i m e n t a l a n d f i n i t e e l e m e n t v e l o c i t i e s
Deformation Type ExperimentalVelocity
Finite Element Velocity
No perforation <115 <104Slight Perforation 115-120 104Full Penetration >120 >104
Figure 4.12 offers proof that this is the ballistic velocity where a graph o f the projectile velocity shows the residual velocity to be close to zero as it penetrates the plate after 0.3ms The range o f deformation, from slight penetration to petalling to plugging, seen in the experimental analysis was not seen in the final finite element model with plugging occurring, directly after the slight perforation, at 105m/s. The error, however, is within 10% and quite acceptable for this kind o f non-linear simulation.
Figure 4.12: Graph o f projectile velocity for ballistic simulation
The second characteristic from the finite element model that was compared with the experimental testing was that o f the maximum deformation o f the plate in the z-direction. In the experiments the results were broken up into three categories, no perforation, slight perforation and complete penetration. In the finite element
7 5

simulations graphs were produced o f maximum displacement o f the plate in the z direction. For the no penetration case node 238131 was chosen at the centre o f the plate and for the other two cases node 12551 was chosen at the edge o f the hole. Figure 4.13 shows their displacement graph over time for several different projectile velocities. The reason for the longer time frames for the 1 lOm/s and 120m/s plots was that they took longer to settle.
LS-DYNA USER INPUT
Figure 4.13: Maximum deformation at impact site in finite element simulations
Table 4.4 shows that the finite element results match well with the experimental results for two o f the three cases in terms o f the height o f deformation. Between the no perforation and slight perforation case there is only a maximum error o f 5%.
Table 4.4: Comparison between max deformations at impact siteAverage height of deformation at impact site (mm)
Experimental Finite ElementNo
perforationSlight
PerforationFull
Penetration
5.2
5.7
6 . 2
5.0
6.0
4 . 5
7 6

In the case o f the full penetration model, however, there is considerably more error in the region o f 30%. The decrease in the height o f the deformation after the ballistic velocity was observed in other research [16] but not in this case, see figure 4.14. The reason for this would seem to be the small additional petals seen on some o f the full penetration tests. This feature was not present in the finite element solution.
Pi. 1«. lil. VilKiDy mm uFigure 4 .14: Comparison between maximum deformation for experimental and
finite clement results.
Figure 4 .15: Final deformation o f test plate for the three cases, (top) No perforation, (middle) At ballistic velocity Slight Perforation, (bottom) Full
penetration
77

Qualitively, the deformation appeared to match quite well. In the finite element studies the plate was seen to undergo large amount o f buckling but then settle back to be almost flat. One can presume this was also the case under testing as the plates have all buckled slightly. The perforations that were observed in the experimental testing were all observed at some stage in the finite element study with the only exception being the tearing o f an oblong hole that was observed with some o f the through plate penetrations. The lack o f this feature in the finite element study may have been due to the limitations o f the contact algorithm. Other methods such as tied node with failure contact allow tearing to occur but are much more difficult to set up and do not have some o f the capabilities o f eroding contact.
4.4 Summary• The ballistic velocity o f the a simple test plate in the experimental testing
was found to be in the region o f 115m/s-120m/s• Three distinct deformation shapes were observed
o Dishing with no penetration o Slight penetration with petalling o Full penetration with petalling or plugging
• A finite element analysis was undertaken using Ansys/LS-Dyna• The ballistic velocity o f the plate was predicted to be 104m/s reasonably
close to the experimental testing• All three major deformation shapes were seen during the finite element
analysis although some minor features were missing
78

5 . A n a l y s i s o f I m p a c t t o R i v e t e d S h e e t M e t a l S t r u c t u r e s
5.1 Introduction
This chapter concerns the experimental and computational analysis o f impacts to riveted sheet metal structures and in particular a plate with a right angled support, or stringer, attached by four rivets. This represented an increase in complexity from the analysis in the previous section. As before, a set o f experimental tests were undertaken in order to validate the finite element results. Two approaches were taken in the computational analysis, modelling the problem fully in 3D and subsequently using 2D approximations for the rivets.
5.2 Experimental Analysis
The experimental analysis was carried out using the gas-fired projectile launcher described in chapter 4. initial tests were undertaken with right-angles o f A1 2014 pop-riveted to plates o f A1 2014, however, because o f the fact that pop rivets are not representative o f fasteners used in aircraft structures it was decided to obtain aircraft standard rivets.
Figure 5.1 : Riveted plate structure geometry
7 9

For this reason aircraft standard rivets, A1 2117 T4, were obtained and used to fasten the angle to the plates as described in figure 5.1. The same titanium projectile used in the previous testing was used. The dimensions for the rivets were obtained from an aircraft repairs manual and are the minimum allowable for the shank diameter used.
»ai DIMENSIONS- TOR FORMEO BjVET..HEAPS.
T fJ o U °C
tr't° ,
(10 M IN /)L in J \ .A&a
. <■£ o m i n i
(b) RIVETING TOOLS,INCORRECT CORRECT SHAPE FOR RIVET SNAP OR SET.
bucking barOR DOLt-V-
RIVET DRIVEN AT SLANT, RIVET DRIVEN ftlVET FLAT ON ONECORRECTLY, OOLLY SIDE OR OOLLY HElOMEAD AT SLANT, FLAT.
BODY OF RIVET TOO SHORT. CLOSING HEAD SHAPEO TOO MUCH WITH SNAP DIE.RIVET NOT PULLED TIGHT, CLINCHES BETWEENPLATES, CLOSING HEAD TOO FLAT.
RIVET TIGHT, PLATES BULGED ON ACCOUNT OF POOR FIT.
RIVETEO TOO MUCH. RIVET 00 DY CLINCHED TOO MUCH» PLATES CLINCHED AT RIVET AND DRIVEN APART,RIVETING TOOL DAMAGED PLATE
HEAD CRACXEp. MATERIAL TOO HARO WHEN fORMEO;
Figure 5.2: Dimensions for formed rivet heads and common imperfections [47]
These parameters and the required shape are shown in figure 5.2. The assembled test plates were impacted at velocities between 125m/s and 220m/s and three main deformation shapes were seen. Table 5.1 outlines these results for both the
80

pop-rivet and solid rivet assemblies and figures 5.3-5.5 shows each o f the failure types in the solid rivets assembly. The tearing noted in table 5.1 resulted in some of the rivet fastenings failing through pulling out o f the plate but in general the failure mode o f the rivets was through shearing o f the shank. Figure 5.6 shows an example o f this. No perforation o f the angle was seen for the solid rivet assembly for projectile velocities within the range o f the gas powered projectile launcher used, however, if the trends observed in the pop rivet model are consistent this failure mode should occur somewhere in the 275m/s-325m/s range.
Table 5.1: Deformation modes from experimental analysisAverage
Projectile Velocity (m/s)
Pop-Rivet Assembly Deformation
Plate Angle Rivet
125 Partial plugging o f plate No perforation
Centre rivets pulling out o f
plate150 Plugging o f plate No perforation All rivets failed200 Plugging o f plate Slight petalling
o f angle All rivets failed
250 Plugging o f plate Large petalling failure o f angle All rivets failed
300 Plugging o f plate Plugging o f angle All rivets failedSolid Rivet Assembly deformation
Plate Angle Rivet125 No perforation
of plateNo perforation of
angle No rivet failure
150 Partial plugging o f plate
No perforation of angle ' No rivet failure
175:Partial plugging
of plate with some tearing
No perforation of angle No rivet failure
200Full plugging o f
plate with tearing
No perforation o f angle 2-3 rivets failing
220Full plugging o f plate some with
tearingNo perforation of
angle All rivets failed
81

Figure 5.3: Test plate 4 with no perforation o f angle and no rivet failure. Initialvelocity =162 m/s
Figure 5.4: Test plate 9 with plugging o f plate and failure o f three rivets but no perforation o f angle. Initial velocity 208m/s

Figure 5.5: Test plate 7 with petalling o f plate with tearing, failure o f all four rivets but no perforation o f angle. Initial velocity 218m/s
I
Figure 5.6: Rivets failure by shearing
5.3 3D Modelling of Riveted Plate Structure
It was decided to model the problem in 3D in an attempt to get an accurate solution with no regard for the cost o f the simulation. The geometry o f the plate and angle were created in the normal way with the holes cut in the plates by subtracting the volume o f the holes.
8 3

/Figure 5.7: Area to be swept to form rivet
The rivet geometry was originally produced by creating three cylinders, corresponding to the two heads and the shank, and then adding the volumes together, however, this geometry then proved difficult to mesh in a satisfactory manner. Instead, a section was taken though half the rivet and the area then swept around the central axis as shown in figure 5.7. Some difficulty was also experienced in meshing the plate and angle due to the presence o f holes. Firstly the volumes were split up to enable a cube around the holes to be meshed separately but this proved to be problematic. It was only possible to mesh this cube around the hole with tetrahedral elements, which are less accurate than hexahedral elements, and the interface between the tetrahedral and hexahedral elements was not very satisfactory. It was also found to be difficult to create a symmetric mesh while meshing the volumes separately. It was found subsequently to be possible to mesh the volume all together using the sweep command. The plate was meshed by creating a 2D mesh on the front face o f the plate and then sweeping the mesh o f the face all the way through to the back surface. The same was done with the part o f the angle parallel to the plate with the volume perpendicular to the plate meshed separately. The size o f the mesh was based on the mesh from the converged solution o f the simple plate with 155 elements along each side o f the plate, shown in figure 5.8. This resulted in a total o f 160941 elements for the plate, 22395 elements for the angle, 355 elements for the projectile and a total o f 6960 elements between the four rivets, which were treated as one part. As before an investigation o f convergence was made and this model was judged to be a converged solution.
8 4

Figure 5.8: Details of the mesh used in 3D model
Contact was again defined between all the parts. Eroding surface to surface contact was used in most cases, i.e. between the projectile, the plate and the angle and between the rivets, the plate and the angle. However automatic surface to surface contact was used between the plate and the angle as no erosion of elements was expected here and the automatic contact option tends to be more robust. The ideal value for the SIPF was again investigated and in this case the default of 0.1 provided good accuracy without causing any damage free penetration.
The material model for the titanium projectile was the same as it was in the simple plate analysis but the material used for the rivets was different. The rivets were made from Al 2117 T4. The same non-linear kinematic hardening model was used as before and parameters were found from the manufacturers certificates with some reference again to Knights ct al [9].
85

5.3.1 In itia l R esu lts
As in the case of the simple plate it was decided again to concentrate on the ballistic characteristics of the riveted plate structure. In this case the ballistic velocity was a bit more complicated as the projectile was impinging on two surfaces, that of the plate and the angle. As seen in the experimental results this resulted in several different deformation modes. These included:
■ no perforation of plate or angle,■ perforation of plate, either partially or full, but no perforation of angle■ and perforation of plate and angle, either partially of fully.
Another factor that needed to be considered was that of the rivets, their deformation, if they failed and their mode of failure.
The first tests were carried out at the ballistic velocity of the simple plate, which was in the region of lOSm/s. As was expected the riveted plate structure proved to be more resilient than the simple plate and no perforation of the plate or angle was seen at this velocity. It was then decided to increase the velocity to 125m/s.
Figure 5.9: 3D Model after plugging of plate and failure of rivets. Initialprojectile velocity 125m/s
8 6

At this velocity the second deformation mode was seen with the projectile penetrating the plate fully but failing to perforate the angle, as seen in figure 5.9. The four rivets in this case failed by shearing within 0.075ms of the beginning of the simulation, the failure being cause by the dynamic buckling of the plate. This was the mode of failure of the majority of the rivets seen in the experimental testing but it occurred at a much lower projectile velocity. As the projectile velocity was increased further, it was found that the initial projectile velocity needed to be in the region of 150m/s to penetrate both the plate and the angle before the rivets failed, as seen in figure 5.10. All of the rivets failed before the projectile came to rest. This deformation mode was not experienced at all with the solid rivets assembly. When compared with the experimental results it is clear that the finite element model was not succeeding in modelling the rivets correctly. The projectile velocity needed to induce rivet failure in the FE model was found to be too low as was the velocity needed to penetrate both plate and angle. Since the modelling of impact to the simple plate had only small errors in comparison it was assumed that the modelling of the rivets was at fault.
Figure 5.10: 3D Model with full penetration of plate and angle. Initial projectilevelocity = 150m/s
87

Due to the large differences between the finite element and experimental results for the riveted plate structure it was decided to investigate possible methods for reducing the error. One of the possibilities that had not been taken into account in the original model was that the original riveting process would affect the characteristics of the assembly before it was impacted. Therefore it was decided to introduce a pretension into the rivets to simulate the stresses induced during the riveting process. To do this it was necessary to employ the implicit Ansys package to do a combined implicit-explicit analysis. The pretension would be introduced to the model in a static analysis and the resulting displacements would be exported to the explicit Ls-Dyna solver. The explicit analysis would then be solved using these new displacements as initial conditions.
From the beginning this analysis proved problematic. The implicit solution needed to be solved in Ansys. Unfortunately the version of Ansys available had a restriction of a maximum of 20,000 elements so it was impossible to use the same mesh with proven convergence that had been used in the last section.
5.3.2 Modelling of Pretension in Rivets
L5-DYNA usei input Time = D
Figure 5.11: Vi symmetric mesh for used for pretension analysis
8 8

In fact it was required that the number of elements be reduced by (190,651- 20,000) = 170,651 elements. As a result of this the accuracy of this model was always going to be questionable. In an attempt to minimize this it was decided to use the symmetry of the problem and model only half of the riveted plate assembly as seen in figure 5.11. As mentioned before in section 4 this was not considered to be as accurate a method as using the full plate due to the non- symmetric deformation noted but it was decided that it would have a less detrimental affect than using a courser mesh.
The pretension was applied in Ansys by creating a section through the rivets and then meshing them with pretension elements. A load was then applied to these elements and the model was solved. The aim was to induce maximum residual strains of 2x10⁴ in the assembly to simulate the strains induced by riveting as seen in figure 2.9 [10]. The effects of this are shown below in figure 5.12 and figure 5.13. The resulting displacements from this implicit static analysis were then saved and the model reopened and renamed to preserve this data. The elements were then changed to explicit elements and the initial conditions and material models were updated.
Figure 5.12: Plot of initial strain induced in the plate and angle due to theriveting process
I \ DvNA «-.»I inputI ini» . I) Fling« lrw«Mt KIBe 0*il orit.li»M 111 . .iraMt r.in ii liim.lUfcV utrlrm» I7K?.... »nil« tv *•*•<•• i m4 iw c iv
I IM rll,
MS«H)4
I tIV 01,
• 0 lip 0«.
in it o*.
A I Hr II* .
».line q4 t l.’Or 0«
I
89

Figure 5.13: Plot o f von-mises stress in cross-section through rivets, plate and angle induced by the riveting process.
It was necessary to delete the sections and the pretension elements from the model as they had no mirror in the explicit solution and were in any case redundant at this stage.
IS 1IYNA mpulrim» 0 1*(•ulmm •> RmulUnl Oitplintmriil mm • i* n n .lr» IW*V ■ n II1 M I/ .« in * * ! .’ ¡'IMI
I
J ,
f ilniji I rwhi niv.«t. IlltfOO I l.'le.on .
/ MSi-ilM UMeiN .S 0;*.r.llO . »tsi.iic.wi IU4V.IW . T miifim » in*,*-OK a iiuikiim
I S (>YNA ih|imI limr • B itCanN«« «1 Ilf %ull«iil Dit̂ MviBeiil »In-0, «1 ID/M11.0/«. «1 mid»* .*l?//'l
I 'inftI«.*/?€•* Ia hi. t* i»o
• • •. .04 I
■ IIIHnH IIi V40eilM ■4iJ7r.UOi tap _ ?.?iu<oo i loanoo.
«OOOf.OO::Figure 5.14: Comparison o f displacement between pretension model (top) and
standard model (bottom)

Finally the displacements from the implicit analysis were read into the explicit analysis. The model was then solved as normal with the first step used to initialise the displacements through the dynamic relax function.
The results obtained were compared with a similar model without the initial displacements as it was felt that the difference in the mesh with the full model would make the comparison invalid. Figure 5.14 below shows a comparison between the maximum displacement in the two o f the models and it clearly shows that the pretension has resulted in very little change in the results. The maximum deflection at the centre o f the angle is 10.15mm for the pretension case and 11mm for the model without pretension after 0.15ms. The mode o f failure o f the plate, plugging, and the rivets, all four fail by shearing is similar. As a result o f these negligible differences it was decided that applying pretension to the 3D rivets did not sufficiently approximate the riveting process and was in no way beneficial towards modelling the problem in a satisfactory manner.
5.4 2D Modelling of Rivets with Failure
The idea behind initially modelling the rivets in 3D was to find out if it waspossible to model this problem accurately but it was not found to be at allpractical. For a simulation lasting 0.75ms the solution time was 73 hours 49minutes. This is for a model with four rivets. The time would increase significantly with each new rivet and quickly become not just impractical but impossible to solve. As a result a more practical and efficient way was sought. 2D approximations are the recognised way o f modelling fasteners such as rivets and so an investigation was conducted into their application and accuracy.
5.4.1 TNWF RivetsThe first method used to approximate the rivets used the tied node with failure (TNWF) contact option. This option ties coincident nodes together until failure criteria are reached. In this case the failure criteria were the shear and tensile forces experienced by the nodes and were given by the shear and tensile yield
9 1

Figure 5.15: Comparison between 3D model (top) and TNWF model (bottom)after 0.3ms.
strengths o f the rivet material. To simulate the rivets several nodes, in a diameter equal to the head o f the rivet, on the adjoining surfaces o f the plate and angle were constrained using TNWF. The results were compared with the 3D model and the experimental results. The comparison below between the 3D model and the TNWF 2D approximation, figure 5.15, show that the TNWF rivets tended to fail much earlier than the full 3D rivets and with less deformation o f the plate around the rivets.
5 .4 .2 S p o t-w e ld R iv ets
The other method used to approximately represent the rivets was that o f a spot- weld. This facility allows non-coincident nodes to be tied together. Failure was again linked to the tensile and shear forces on the rivets. Nodes on the adjoining surfaces o f the plate and angle were again constrained with much the same results as the TNWF rivets. Attempts were made to improve its performance by coupling the nodes in the plate and angle where the rivet would be, but due to the fact that the surfacc nodes that were spot-welded could not be included, the coupling had little or no effect. Some improvement was seen when nodes from

the opposite side o f the plate and angle were constrained. This was valid i f one worked on the assumptions that the rivets essentially created a solid component between the two rivet heads until the rivet failed and it was possible, because unlike TNWF, the nodes did not need to be coincident. This method produced results similar to those o f the 3D model in terms o f deformation and timing o f rivet failure as seen below in figure 5.16. The advantage o f the 2D model at this point is that the solution time is roughly one tenth o f that needed for the full 3D model. The 2D model also had some through thickness damage done to the plate at the rivet sites which may be read as the rivets pulling out o f the plate. However as the model was similar to the 3D model large inaccuracies still existed.
Figure 5.16: Comparison plot between the deformation o f spot-weld rivets (top)and 3D rivets (bottom)
5.5 21) Modelling of Rivets without Failure
To begin with this option was not considered feasible as modelling rivets that cannot fail would appear at first to be inherently wrong since it is obvious that
93

rivets do fail. However when the modes o f failure o f a riveted joint are examined it becomes clear that such a model could work well. One o f the causes o f failure in riveted joints is not the failure o f the rivets themselves it’s the failure o f the plate around the head o f the rivets i.e. the rivets pull out o f the plate [10]. As a result is was decided to model rivets with no failure criteria to see if it was possible to reproduce this in a finite element simulation.
Having learned from the TNWF and spot-weld rivets it was decided not to use the tied node contact option. A facility within the weld command was found by w'hich two non-coincident nodes could be constrained without any failure criterion. It was unsurprisingly called the rivet command. Again a selection of nodes o f diameter 3mm on opposite sides o f the plate and angle were constrained. The results o f this FE model were closer to the experimental results with the rivets proving to be much more robust. The plot o f the assembly's deformation after an impact with a projectile velocity o f 150m/s, figure 5.17, shows the second deformation mode, that o f perforation o f the plate with failure o f the all four rivets. The holes around the centre rivets simulate the rivet pulling out o f the plate as was expected. Unfortunately the plate elements around the outer holes remain for the most part intact. The elements on the surface o f the
ISUVMUSfflMVI IM U I im
J*Figure 5.17: Failure o f plate and four rivets. Initial projectile velocity =
150m/s
9 4

plate, with which the constrained nodes are attached, erode away before the others and release the constraint. This results in a slight dent in the surface o f the plate and no through thickness damage. All three deformation shapes were again seen for this model and although the projectile velocities were close to those observed for the pop-rivet assemblies, they still underestimated the more realistic solid rivet assembly’s behaviour by a margin o f 25%-35%.
5.6 Final Results
A comparison between all o f the results both experimental and numerical is presented in table 5.2 on the following page.
95

D eform ation Type
P rojectile V elocity
(m /s)
125-150
150-175
175-200
200-250
250-300
N o perforation o f plate or angle and
no rivet failure
Solid rivet assemb.
Sonie perforation o f p late but no
rivet failure
Pop rivet assemb. 2D rivet model
Solid rivet assemb
Som e perforation o f p late, som e rivet
fa ilure, no perforation o f
angle
Pop rivet assemb. 2D rivet model
Solid rivet assemb
P erforation o f plate, no
perforation o f angle and total
rivet failure
3D rivet model
Pop rivet assemb. 2D rivet model
Solid rivet assemb Pop rivet assemb
Solid rivet assemb
Table 5.2: Comparison o f experimental and finite element results
Perforation o f plate and angle and total rivet
failure
3D rivet model
3D rivet model
2D rivet model
Pop rivet assemb 2D rivet model3D rivet model
96
An experimental analysis was undertaken using the gas powered projectile launcher. A1 2014 test plates were fabricated with A1 2014 angles riveted to plates using pop rivets and standard (A1 2117) aircraft rivets. Three main deformation shapes were seen:
■ No perforation o f plate or angle with no rivet failure■ Partial or full penetration o f plate with no perforation o f angle and some
rivet damage■ And full penetration o f plate and angle with failure o f all rivets.
This last mode was only seen for the pop rivet assembly.
The experimental analysis was followed by a finite element analysis. Several modelling techniques were attempted including:
■ Modelling the rivets in 3D with and without pretension■ Modelling the rivets as simple approximations with failure using the
TNWF contact option and the spot-weld facility■ And modelling the rivets as simple approximations without failure using
the rivet command.When compared with the experimental results all o f the models proved to have large inaccuracies. The 3D rivet model was comparable with the spot-weld model but had errors o f almost 50% when compared with the solid rivet assembly. The rivet model without failure was closer to the experimental results, matching closely to the pop rivet assembly, but still gave an error o f 30% when compared with the solid rivet assembly.
5.7 Summary of Chapter 5
97

6 . D e s i g n a n d M a n u f a c t u r e o f G a s - p o w e r e d P r o j e c t i l e
L a u n c h e r
6.1 Introduction
The testing that was undertaken for this project was carried out with the gas- powered projectile launcher shown in figure 4,1 in chapter 4. Clearly this rig was limited in terms o f the projectile size and shape that could be fired and test plate size that could be used. As a result it was decided to design a new test rig that would be available in the university for further experimental testing in the area o f impact mechanics. The aims o f the design process are outlined below
• To be able to take test plates o f up to 0.5m• To be able to fire projectiles o f any shape up to a maximum diameter o f
50mm• To be able to impact the plate at any point and so facilitate multiple
impacts to plates• To be able to impact the plate at an angle
The design was based on the older rig but was to be fabricated from scratch with these four new concepts integrated.
6.2 Projectile Firing Concepts and Design
The main aspects o f the new test rig were to be taken from the proven concepts o f the older rig. As a result the design and modification history o f the old rig was examined closely [48]. An investigation o f alternative design types o f gas- powered projectile launchers available in literature was also undertaken [7-9, 12- 19].
The first challenge was to find a method o f firing different sizes and shaped projectiles. Some early concepts included either replacing the barrel or having
9 8

inserts for each projectile but both were rejected as too costly and time consuming. A solution was found however after examining other designs in literature. In several cases [8, 9, 49] a device called a sabot had been used to overcome the problem. The sabot was essentially a seat for the projectile, the outside diameter o f which conformed to the inside diameter o f the barrel. The sabot would impact a stop towards the end o f the barrel and the projectile would continue onto the target. To facilitate different sizes and shaped projectiles different sabots could be manufactured.
Figure 6.1: Sabot design used by Knight et al. [50]
The two most important features o f this design are the sabot and the sabot stop. In figure 6.1 above it can be seen that the sabot is designed to maximise the pushing power o f the gas and that the sabot stop is made from crushable aluminium foam that absorbs some o f the impact. This is necessary so that the sabot is not damaged on each firing. Another design for sabot and sabot stop that has proven successful is shown below in figure 6.2. The sabot itself is made from an impact absorbing rubber so that it is not damaged on impact. This design was chosen for the new test rig because o f its simplicity. Some other useful features o f this design included the Teflon bushings, which reduced the friction effects
99

between the barrel and the sabot, and the open end that vented the gas from the barrel.
Teflon Teflon
SteelFragment Slot and Chamber
Plate Attachment Screws
Front View Side View Rear View
Gun Muzzle
Figure 6.2: Sabot design by Manchor and Frankenberger [51]
With the design decided on for firing the projectile by using a sabot it was now necessary to check that the solution would be practical to implement. The calculations below show that it is.
6.2.1 Proof of Concept Calculations
These calculations were developed from those used in the design o f the old rig [48]. Since the diameter o f the barrel was to be scaled up it was thus necessary to scale up some o f the other components. The length of the barrel was increased from lm to 1.5m to give a greater length to accelerate the projectile and the gas reservoir was scaled up to have a volume greater than that o f the barrel. As a result the volume o f the reservoir, V r, became
V r = 7urr l r ( 6 . 1 )
100

where rr = radius o f the reservoir = 75mm and lr = length o f the reservoir = 500mm. Therefore
Vr = 7T x .0752 x .5 = 8.84 x 10‘3m3................................... (6.2)
The volume o f the barrel, Vb, is then
Vb = k x .032 x 1.5 = 4.24 x 10"3m3................................... (6.3)
where rb = radius o f barrel = 60mm and lb = length o f barrel = 1.5m and the volume o f the sabot, Vs
Vs = 7i x .032 x .04 = 1.13 x 10"4m3................................... (6.4)
The sabot was to be mostly manufactured from an impact resistant polymer called Ertalon 6PLA. Its density, p, was 1.15g/cm3. The sabot’s mass was therefore given by
m = 1150 x 1.13 x 1 O'4 = 0.13 Kg.................................... (6.5)
If the maximum velocity that the projectile needs to reach is assumed to be v=300m/s then the energy needed to accelerate the projectile to this speed is
E = l/2mv2 = 5.85kJ.......................................(6.6)
The pressure required in the reservoir is therefore given by the equation below
— m v 2} y / N ......................................... < " >V. Inf 1 + W y
/ r /
So Pi = 0.586 MPa or 5.86 bar. This is only an approximate value as it does not take into account friction effects but it is easily within the capabilities o f the high pressure gas cylinder available.
101

6.3 Reservoir Design
As mentioned above it was necessary to scale up the gas reservoir as the barrel was scaled up. The idea o f this was that the reservoir should have a greater volume o f gas stored than was necessary to fill the volume o f the barrel. This would insure that the projectile was accelerated down the full length o f the barrel. As a result o f this the internal volume that was needed for the reservoir was known. However it was still important to design the reservoir in a safe and practical way. Initially welding o f the end plates was considered but the lack of the facilities to check the welds and the high pressures involved ruled out this option. So it was decided to bolt the end plates to the reservoir. To show that the pressure vessel was suitable for the application intended it was designed according to the following calculations.
6.3.1 W all T hickn ess C alcu lation
Clavarino’s equation (for ductile materials) gives a wall thickness t for thick walled closed ended pressure vessels.
where d t = internal diameter = 150mm = 0.15m, St = permissible working stress in tension, jj, = Poisson’s ratio = 0.3, pi = internal pressure = 25 bar = 2500000. For En-16 Steel, St = aut/safety factor where aut = allowable UTS = 620MPa and taking a safety factor o f 3 gives St = 207Mpa.
Therefore from equation 1 the wall thickness, t, was determined as 7.7x 10⁴ m ~0.8mm. The walls o f the pressure vessel exceed this by a large margin, the walls being 10mm thick, due to the necessity o f bolting on the end plates.
(6.8)
102

6.3.2 Endplate Bolt Calculations
From [52] the minimum seal load on a bolt for a pressure vessel is given by:
Wln2 = TibGy......................................................... (6.9)
where b = gasket width = 0.002m, G = Gasket sealing diameter = 0.155m, y = seating stress = 1.4 for a rubber O-ring. This gives us = 1363N.
Therefore the initial tightening stress oi on each bolt is:
Gi = Initial Load/Root A rea ................................... (6.10)
where the root area Ar = — d 2r = 1.96 x 10‘5 m24 rThis gives us a value o f G\ = 69.4 MPa. The bolt material is high tensile steelwith a tensile yield stress ay = 586MPa. Hence the available stress o a = a y - o\ =516.6MPa
Taking a factor o f safety o f 2 the available load per capacity per bolt over the stressing area,
Fa=Ar x c a/2 = 5062.7 N ......................................(6.11)
The minimum required bolt load for operating conditions is given by:
Wm, = jtG2P/4 + 2;tGbkP.....................................(6.12)
Where P = Operating Pressure = 25 bar, k = gasket factor = 0.25This gives a value o f 47172 N. Therefore the number o f bolts required is
Wml/Fa = 9.3 => 10 b olts................................(6.13)
When fabricated each end plate was bolted with 18 bolts for additional safety.
1 0 3

6.4 Final Barrel Assembly
The final barrel assembly was designed and modelled in Pro Engineer. In the previous test rig the barrel was vertical but because o f the extra half metre in the barrel length and the larger reservoir this was not practical in the new rig and the barrel was mounted horizontally. The initial sabot, see figure 6.3, was designed to hold the titanium projectile used by the other test rig.
Figure 6.3: First sabot design
The barrel was fabricated from a tube with an internal bore o f 60mm and a 10mm wall thickness. One end o f the tube has threaded internally to connect to the valve. At the other end a stop was bolted to the end o f the barrel for the sabot to impact. 40mm from this end a series o f holes were drilled to exhaust the gases after the projectile had fired. The final modification to the barrel tube was to cut a breach into which the sabot and projectile could be loaded. This was then covered by a semi-circular section and a collar to hold it in place. The whole assembly is shown in figure 6.4
For the reservoir design the internal volume and wall thicknesses were already set. The diameter was decided by the biggest size tube o f the correct wall thickness that could be found and so the length needed was found to be 500mm. One end plate was a simple circle with bolt holes at the circumference and a hole at the centre to fit the gas feed.
I1 0 4

Figure 6.4: Barrel Assembly
The other end plate was cone shaped to ensure that the gas would escape into the barrel at the highest possible velocity with the minimum o f losses. At the end o f the cone was a threaded section to attach to the valve. The complete reservoir is shown in figure 6.5
Figure 6.5: Reservoir
1 0 5

6.5 Clamping and Tilting Mechanism
One o f the main aims o f this design process was to be able to accommodate test plates with an area 0.5m2. The clamping mechanism on the old rig was not designed very well so instead o f just scaling it up it was decided to redesign it completely. To simulate real aircraft structure behaviour it was decided to clamp the plate on all four sides. This resulted in the design seen below in figure 6.6.
Figure 6.6: Clamping and tilting mechanism
The bottom clamp has threaded bars which protrude through holes in the top clamp. Wing nuts are fastened to them to produce the clamping pressure. The bottom clamp is actually made from four strips bolted together. This was required to save on the costs o f buying a large plate 10mm thick. The bottom clamp needs to be this thick to accommodate the dowel on which the whole clamp rotates. The clamps can rotate through 45° on their mounting plates and are secured by bolts that fit into holes at the ends o f the bottom clamp.
1 0 6

6.6 Sliding Mechanism
The sliding mechanism was designed so that the test plate could be moved through 0.5m in the plane perpendicular to the barrel with the aim being the ability to impact the plate at any point. It consists primarily o f two pairs o f rails with attached carriages that enable the plate to be moved vertically and horizontally, see figure 6.7. The rails and carriages were sourced from Rhino products. Initially they were both to be locked in place using heavy duty magnetic clamps for quick and easy use but unfortunately the assembly proved
o
too heavy for the clamps and travel in the vertical direction was constrained using a clamp bolted to the frame.
Figure 6.7: Rails and clamp assembly for moving the test plate in the x-y plane
1 0 7

6.7 Final Design Issues
At this point all the aims outlined for the design o f the new impact testing rig had been met and the only issues remaining were safety and the overall assembly. A frame was designed to hold both the barrel and the clamping assembly from box steel and this was covered with sheet aluminium to prevent the projectile from escaping when it is fired. A trap was designed at the rear o f the frame to catch projectiles that penetrated the test plates. This consisted o f an angled plate at the same height as the barrel and an enclosure. The idea was that the projectiles impact on the angled plate would change its direction through 90° and it would come to stop in the enclosure.
Safety was the main reason behind the aluminium sheet that covered the frame but it was necessary to hinge most o f the sheets and make doors for access. As a result safety switches were installed on all the doors to ensure they were closed during operation o f the projectile launcher. The switches were wired in series with the power to the valve actuator so that if any door was open no electricity would flow and it would be impossible to open the valve. In addition to this a key switch was also wired in series with the power to the valve no that no unauthorised person could activate the rig. The wiring diagram for the switches and valve is shown below in figure 6.8.
1 0 8

The On/Off switch shown is a button switch that opened the valve then pressed and closed the valve when released.
The final assembly drawing o f the new gas powered projectile launcher is shown below in figure 6.9. This was submitted with the working drawings (see appendix 2) to the work shop in Dublin City University to be manufactured. It was completed with minimal changes to the design. When the work was finished in the workshop the rig was wired, the velocity measuring system from the old test rig was transferred to the new rig and the high pressure nitrogen cylinder was plumbed in. The rig was then ready to be tested.
Figure 6.9: Full gas powered projectile launcher assembly
6.8 Problems Encountered with the Completed Impact Test Rig
As one would expect with a completely new design all o f the problems with the new impact testing rig had not been solved in the design phase. The first problem that was apparent was that the motorised valve operated too slowly. For the previous test rig the valve was operated by a solenoid and so opened almost instantaneously. The motorised valve, however, took several seconds to open and restricted the gas escaping from the reservoir. This resulted in a lower gas velocity and hence a lower sabot and projectile velocity than anticipated.
1 0 9

Unfortunately the valve manufacturer did not supply an actuator that could open the valve faster as all o f their actuators were designed with laminar flow in mind. To ensure that the theory presented in section 6.2.1 for the possible sabot velocity was correct the actuator was removed and the valve was operated manually. A series o f tests were conducted and the results showed that it was possible to reach a projectile velocity o f 200m/s without difficulty. Unfortunately it was not possible to operate the valve continuously on a manual basis as all o f the safety features were built into the electrical actuation. Possible alternative actuators for the valve would include other electric motors, rotary pneumatic actuators or solenoid actuators, as in the original test rig. These options are currently being investigated by the researchers assigned to continue with the project.
One other problem that occurred with the final design was that the Teflon plate at the front of the sabot deformed slightly on impact with the sabot stop. The deformation resulted in the sabot being unable to fit back into the barrel. Placing a mild steel plate in front o f the Teflon plate solved the problem.
6.9 Summary of Chapter 6
A new gas powered projectile launcher was designed and manufactured. Its capabilities included:
• a clamping mechanism capable o f taking a test plate 500mm in area• a titling mechanism on the clamp to allow impact at oblique angles• a sliding mechanism to allow impact at any point on the plate• a barrel and sabot design that allowed the rig to accommodate projectile
o f any shape and size up to a maximum diameter o f 50mm
Some problems were encountered with the sabot and the valve actuation and solutions were provided in the case o f the sabot design. An investigation into the valve actuation problem is continuing.
110
7 . D i s c u s s i o n
An experimental analysis was carried out with a gas-powered projectile launcher. Results from the tests showed three modes of deformation; dishing o f the plate without perforation, perforation with petalling o f the plate and full penetration with either perforation or plugging. The failure modes were much as expected in thin aluminium plates with shear plugging being the dominant failure mode. Petalling occurred mostly in tests where the projectile failed to penetrate the plate completely. The tearing observed may have occurred due to slightly oblique impacts o f the projectile. If such impacts occurred they would have resulted in a sharp edge impacting the plate first with indentation o f the plate taking place before the rest o f the projectile face could come in contact with the plate. The result observed from this would have been for one side o f the projectile to penetrate the plate first possibly causing the tearing damage seen. Unfortunately there was no possible way o f knowing if such an oblique impact had occurred during the experimental testing. The height o f the deformation was also within expected ranges although the increase in the height after the ballistic limit (see figure 4.14) was not as seen in previous research [16]. It is thought that the additional petals caused by radial cracks around the hole are responsible and that the height o f the deformation would decrease again if the projectile velocity was increased further.
The finite element simulation was conducted using the LS-DYNA explicit finite element code because o f its proven ability to solve dynamic problems. Ansys was used as a pre-processor, and initially as the post-processor, because o f previous experience with Ansys and LS-Prepost was used as the post-processor after difficulties were experienced with the size o f the file in Ansys. Much thought was given to the material model to be used in the finite element analysis with the temperature and strain-rate sensitive Johnson-Cook model initially considered. Unfortunately, a large number o f material parameters are needed to
7,1 Analysis of Simple Plate Structures
111

formulate this material model completely and the experimental facilities did not exist to obtain them. Instead the nonlinear kinematic hardening model was used (see table 4.2). This model has a bilinear stress-strain curve with a combination o f isotropic and kinematic hardening. Material strain-rate sensitivity could be accounted for by the user using the Cowper-Symonds strain-rate model. Initial analyses were performed without these strain-rate parameters but accounting for strain-rate behaviour in the material improved the model’s accuracy with regard to the experimental results.
The elements chosen for the simulation were 164 solid elements. Shells elements were considered but were rejected due to their inability to have contact on both sides o f the element. This was not a concern with the simple plate but was necessary when higher assemblies with stringers were considered. The mesh density was seen to be an extremely important factor in the FE simulation. An investigation observed that four elements were needed through the thickness o f the plate and 155 along each side to provide an accurate solution. This equated to elements less than 0.94mm2 in area and only 0.25mm thick. The reason that such small elements were necessary was because o f the failure mode. The shear bands that cause shear plugging have been observed to be in the region o f 100-300|im [19].
The contact algorithm used in the model was the eroding surface to surface contact option. It was used so that through-thickness penetration could occur in the simulation. It was observed that the accuracy o f this algorithm depended on the levels o f sliding interface energy generated between the two surfaces. A positive value would lead to parts penetrating through each other without causing damage while too negative a value could lead to instability and an inaccurate solution. The sliding interface energy levels were controlled by the sliding interface penalty factor (SIPF) and it was seen that for the simple plate problem a value o f 0.015 was ideal (see figure 4.9).
Overall the finite element solution gives good correlation to the experimental testing with the ballistic velocity for the plate predicted to within 10% and most o f the deformation modes observed. The absence o f a significant gap between the
112

velocities needed to induced partial perforation with petalling and those needed for plugging may have been due to the simplistic material model and the fact that, due to the lack o f temperature dependence, there could be no thermal softening. The height o f the deformation at the point o f impact was seen to match up well with the experimental results for two o f the three deformation modes. For the plugging case the finite element model showed a decreasing deformation trend after the ballistic limit, something that was seen in previous research. The experimental tests showed an increase in this case, however, as already mentioned caused by the secondary petals. The inability o f the eroding failure mechanism to reproduce cracks explains why this increase is not seen in the FE analysis and also explains the lack o f petals with tearing.
7.2 Analysis of Impact to Riveted Sheet Metal Structures
An experimental analysis was again undertaking with the projectile launcher pictured in figure 4.1. Right-angled sections o f aluminium were riveted to plate o f the same material initially with pop-rivets, however as pop-rivets are not recognised as aircraft standard rivets, solid A1 2117 - T4 rivets were obtained and used. These rivets are commonly used for aircraft repairs and were chosen because they can be driven cold without any special preparation. The results o f the tests showed similar plugging failure to that seen for the simple plate in section 4.2. The rivets were seen to fail by shear in most cases with rivets pulling out o f the plates only where cracks reached the edge o f the rivet hole. Full ballistic penetration o f the plate and angle was observed for the pop-rivet assembly at approximately 300m/s but was not observed for the solid rivet assembly as too high a projectile velocity was required was too high. It is assumed that it would occur somewhere in the 350-400m/s range if the pattern seen in the pop-rivet case continued.
The finite element modelling o f the riveted plate structure concentrated on the modelling o f the rivets. A full 3D model was created to try to get an accurate model o f the problem, however, this was not the case. The rivets failed through shear just as in the experimental tests but their failure occurred at a much lower
1 1 3

projectile velocity. The rivets in this case were idealised and had not experienced any deformation or initial stresses as would be present in a real rivet. Thus it was decided to induce these effects in the rivet to see i f it would behave closer to that observed in the experimental analysis. To this end a pretension was applied in the implicit solver Ansys which induced strains o f 1 x 10"3 in the plate and rivets. These strains were then used as initial conditions in the explicit analysis where the assembly was impacted by the titanium projectile. Unfortunately the results were disappointing with the difference between the model with pretension and without being minuscule. The coarse mesh that resulted from a restriction on the number o f elements allowable in Ansys may have had a significant effect on the results and it is also possible that pretension is not a good enough method to simulate the riveting process. The effects o f the riveting process and the nonlinear behaviour o f rivet assemblies are still thought to be the factors causing the significant errors in the finite element results.
The second half o f chapter 5 saw an investigation into 2D rivet approximations. Actually the models were ID nodal constraints but since they were grouped together in a planar shape equal to the area o f the rivet head they were known as 2D approximations. Two sets o f 2D approximations were looks at; those with failure and those without. The rivet models with failure were based on the ultimate tensile and shear failure strengths o f the rivet material, initially two areas, equal to the cross-sectional area o f the rivet, were constrained on the adjoining surfaces o f the plate and angle. The results o f this simulation saw the rivets fail much earlier than even the 3D rivet model. It was decided that if the rivet was assumed to create a solid component until failure that it could be modelled by constraining two regions at opposite sides o f the plate and angle instead. This model, still based on the shear and tensile material behaviour, behaved much more like the 3D rivet model with deformations occurring at the same projectile velocities. The behaviour was still nothing like that observed in the experimental testing which was not a surprise as the failure mechanism based on two fixed values could not be expected to simulate the complex non-linear rivet behaviour. The second 2D model, however, did not try and predict the behaviour at all as it had no failure criterion. Instead it worked on the assumptions that rivet joints can fail by the riveting pulling out o f the plate. Even
1 1 4

though this did not occur in the experimental analysis presented it has been observed in other literature [10]. The same geometry as the previous 2D model was used with areas from opposite sides o f the plate and angle being constrained. The results showed these rivet joints to more robust with failure occurring at similar projectile velocities to the pop-rivet assembly in the experimental testing. The mode o f failure was validated with the plate failing by element erosion simulating the rivets pulling out o f the plate. The ballistic velocity however was still underestimated by 25-30% when compared with the solid rivet assembly and this suggests that new rivet approximations are still necessary to model these nonlinear fasteners correctly and cheaply.
7.3 Design and Manufacture of Gas-powered Projectile Launcher
With the limitations o f the old impact testing rig in mind a new gas-powered projectile launcher was designed and manufactured. Its capabilities included a barrel and sabot assembly that could fire projectiles o f any size and shape up to 50mm in diameter. The reason for this was to allow projectiles other than cylinders or spheres to be fired. It also allows for tumbling projectiles with the right sabot design. The large diameter was so soft debris, like the tyre rubber in the Concorde case [5], could be fired in sufficient masses to investigate their effects on structures. The angling o f the test plate was another capability o f the new impact rig which was obviously designed with oblique impacts in mind. The sliding mechanism was included to enable the plate to be impacted at any point on its area and also to facilitate research into multiple impacts on plates where the residual stresses and strains o f earlier impacts may affect a later one. Finally the idea behind the large test plate size was that a test plate with multiple stringers at the correct spacing could be accommodated and that if a smaller plate was required that a simple adaptor could be made so that it would fit.
Several other improvements to the new impact testing rig are possible given the time and budget. Obviously fixing the problem with the valve actuation should
1 1 5

be top o f the list. The valve itself operates perfectly and does not require too much torque to open and close. With that in mind it should not be difficult to find a solution. A stepper motor would be ideal if one could be found with sufficient torque. Another option would be a rotary pneumatic actuator. Its control values could be controlled electrically so that it could be tied into the safety switches on the doors. A solenoid switch might prove difficult to integrate with the present valve but if possible would definitely open the valve quickly enough to avoid restrictions on the flow.
One other improvement considered early on and investigated fully was that o f a high speed camera. The camera would serve several functions, replacing the need for the laser velocity measurement system, checking the angle o f attack o f the projectile, obtaining images o f the impact event itself and calculating the residual projectile velocity. Unfortunately the cost o f the camera was prohibitive ruling it out for this project, however it should be considered in the future.
Measuring the residual velocity o f the projectile was mentioned above and has been observed in literature [6-10] as a common parameter measured in ballistic plate impact testing. Even without the digital camera it should be possible to implement this although the laser system used for the initial velocity measurement would not be suitable as it would be difficult to predict the exact path or orientation o f the projectile after impact. An alternative method observed in literature [e] has been to use two self inducting coils placed a known distance apart in the path o f the projectile and observing the time between signals induced by the projectiles passage.
1 1 6

8. Conclusions and Recommendations
8.1 Conclusions
A finite element model was created to simulate the impact o f a titanium projectile on a simple plate using the LS-DYNA explicit code. The model correlated well to results from experimental testing undertaken with regards to ballistic velocity o f the plate, height o f final deformation and deformation shapes. Small errors, in the region o f 10%, were seen for the velocity needed to perforate and penetrate the plate. The finite elements prediction o f the height o f deformation was accurate except in the case o f full penetration where the models inability to simulate the radial cracks at the hole resulted in it underestimating the deformation.
A more complex assembly which included a stringer and rivets was analysed experimentally and computationally. The experimental analysis was conducted using both pop-rivets and aircraft standard rivets. Two separate approaches were attempted for modelling the rivets using full 3D modelling and using 2D approximations. It was concluded that the 3D model failed to predict the rivet behaviour correctly even when the effects o f the riveting process were taken into account. The 2D approximations that took rivet failure into account was also disappointing with similar behaviour to the 3D model, however some improvement was shown for the 2D approximation without rivet failure. This model proved to have behaviour closest to that observed during the experimental testing with good correlation to the pop-rivet assembly’s behaviour. When compared with the solid rivets, however, the results were still poor with an error in the region o f 30%.
Lastly, a new gas-powered projectile launcher was designed and manufactured. Innovations in this design included:
♦ • 9• the ability to test plates o f up to 0.5m• the ability to impact the plate at oblique angle up to 45°
1 1 7

• the ability to fire projectile o f any shape or size up to 50mm in diameter• and the ability to impact the plate at any point on its surface.
The manufacture o f the new rig was completed successfully and the rig operated as expected with the only problems encountered being valve actuation and some slight sabot deformation.
8.2 Recommendations
One o f the main difficulties encountered during this project has been the modelling o f the rivets. Further work should be carried out to investigate their nonlinear behaviour and to develop an accurate, cost effective model to use in industry.
One aspect o f the material model that was not investigated thoroughly but which may be significant was the failure strain. An average value was used due to the extensive material testing needed to properly determine the failure strain for the material and appeared to be quite accurate in the case o f the simple plate. An investigation into the effects o f varying this parameter should be undertaken.
With regard to impacts to plate structures this project only examined a tiny portion o f the field. The new test rig was design so that further research could be carried out. Some suggestions as to the direction this work should take are:
• examination o f the effects o f different shape projectile• examination o f oblique and tumbling projectile impacts• examination o f the effects o f multiple stringers on a plate• examination o f multiple impacts to a plate• examinations o f other materials such as composite and sandwich structure
1 1 8

Reference
1. Society o f Automotive Engineers Committee on Engine Containment, Report on Engine Containment, SAE-AIR-4003, September 1987.
2. Federal Aviation Authority, Design considerations for minimizing hazards caused by uncontained turbine engine and auxiliary power unit failure. FAA Advisory Circular, No. 20-128A, 1997.
3. National Transportation Safety Board Aircraft Accident Report, Uncontained Engine Failure Delta Air Lines Flight 1288, McDonnell Douglas MD-88, N927DA, Pensacola, Florida, July 6, 1996
4. E. C. Cleary, R. A. Dolbeer, S. E. Wright, Wildlife strike to civil aircraft in the United States 1990-2002, FAA National Wildlife Strike Database Serial Report Number 9, June 2003.
5. Accident on 25 July 2000 at “La Patte d’Oie” in Gonesse (95) to the Concorde registered F-BTSC operated by Air France, Interim Report, Dec 2001.
6. K. Carney, M. Pereira, D. Revilock, P. Matheny, Jet Engine Fan Blade Containment using two different geometries, 4th European LS-DYNA Users Conference, Ulm, Germany 2003.
7. S. J. Lundin, Engine Debris Fuselage Penetration Testing, Phase I, FAA Report DOT/FAA/AR-Ol/27, 2001
8. C.E. Frankenberger, Large Engine Uncontained Debris Analysis, FAA Report DOT/FAA/AR-99/11, 1999
9. N. F. Knight Jr, N. Jaunky, R. E. Lawson, D. R. Ambur, Penetration simulation for uncontained engine debris impact on fuselage-like panels using LS-DYNA, Finite Elements in Analysis and Design Vol. 36,2000, 99-133
10. B. Langrand, E. Deletombe, E. Markiewicz, P. Drazeh, Riveted joint modelling for numerical analysis o f airframe crashworthiness, Finite Elements in Analysis and Design Vol. 38, 2001, 21- 44.
1 1 9

11. G. G. Corbett, S. R. Reid, W. Johnson, Impact loading o f plates and shells by free-flying projectiles: A review, International Journal o f Impact Engineering Vol. 18, Issue 2, 1996, 141-230.
12. T. Borvik, M. Langseth, O.S. Hopperstad, K.A. Malo, Perforation o f 12mm thick steel plates by 20mm diameter projectiles with flat, hemispherical and conical noses Part I: Experimental study, International Journal o f Impact Engineering, Vol. 27, 2002, 19-35.
13. R. S. J. Corran, P. J. Shadbolt, C. Ruiz, Impact loading o f plates - An experimental investigation, International Journal o f Impact Engineering, Vol. 1, 1983,3-22.
14. W. Q. Shen, N. O. Rieve and B. Baharun, A study on the failure o f circular plates struck by masses. Part 1: experimental results, International Journal o f Impact Engineering Vol. 27, 2002, 399^412.
15. W. Goldsmith, S. A. Finnegan, Penetration and perforation processes in metal targets at and above ballistic velocities, International Journal o f Mechanical Science, Vol. 13, 1971, 843-866.
16. N. Levy, W. Goldsmith, Normal impact and perforation o f thin plates by hemispherically-tipped projectiles - II. Experimental results, International Journal o f Impact Engineering, Vol. 2, 1984, 299-324.
17. S. Deya, T. Borvika, O.S. Hopperstada, J.R. Leinumc, M. Langsetha, The effect o f target strength on the perforation o f steel plates using three different projectile nose shapes, International Journal o f Impact Engineering Vol. 30, 2004, 1005-10038
18. T. Borvik,b, A. H. Clausena, O. S. Hopperstada, M. Langsetha, Perforation o f AA5083-H116 aluminium plates with conical-nose steel projectiles— experimental study, International Journal o f Impact Engineering Vol. 30, 2004, 367-384.
19. X.W. Chen, Q.M. Li, Shear plugging and perforation o f ductile circular plates struck by a blunt projectile, International Journal o f Impact Engineering Vol. 28, 2003, 513-536.
20. X. W. Chen, Q. M. Li and S. C. Fan, Initiation o f adiabatic shear failure in a clamped circular plate struck by a blunt projectile, International Journal o f Impact Engineering Vol. 31, 2005, 877-893.
120

21. S. Leppin, R. L. Woodward, Perforation mechanisms in thin titanium alloy targets, International Journal o f Impact Engineering, Vol. 4, 1986, 107-115.
22. V. F. Nesterenko, W. Goldsmith, S. S. Indrakanti, YaBei Gu, Response o f hot isostatically pressed Ti-6A1^1V targets to normal impact by conical and blunt projectiles, International Journal o f Impact Engineering Vol. 28, 2003, 137-160.
23. M. Langseth and P. K. Larsen, Dropped objects’ plugging capacity o f steel plates: An experimental investigation, International Journal o f Impact Engineering, Vol. 9, 1990, 289-316.
24. W. Goldsmith, S. A. Finnegan, Normal and oblique impact o f cylindro- conical and cylindrical projectiles on metallic plates, International Journal o f Impact Engineering, Vol. 4, 1986, 83-105.
25. K. Li and W. Goldsmith, A phenomenological model for perforation o f moderately thick plates by tumbling projectiles, International Journal o f Solids Structures Vol. 33, 1996, 3561-3575.
26. T. B0 rvik, O. S. Hopperstad, T. Berstad and M. Langseth, Numerical simulation o f plugging in ballistic penetration, International Journal o f Solids and Structures Vol. 38, 2001, 6241-6264.
27. T. B0 rvik O. S. Hopperstad, T. Berstad and M. Langseth, Perforation o f 12 mm thick steel plates by 20 mm diameter projectiles with flat, hemispherical and conical noses Part II: numerical simulations, International Journal o f Impact Engineering Vol. 27, 2002, 37-64.
28. G. Shi, J. Guo, C. Lu, Efficient modelling o f panel-like targets in perforation simulation, 3rd LS-DYNA European users conference, Paris France, 2001.
29. D. C. Webb, K. Kormi, S. T. S. Al-Hassani, The influence o f inertia and strain-rate on large deformation o f plate-structures under impact loading, Computers and Structures Vol. 79, 2000, 1781-1797.
30. H. Kurtaran, M. Buyuk, A. Eskandarian, Ballistic impact simulation o f GT model vehicle door using finite element method, Theoretical and Applied Fracture Mechanics Vol. 40, 2003, 113-121.
121

31. M. Park, J. Yoo , D. Chung, An optimization o f a multi-layered plate under ballistic impact, International Journal o f Solids and Structures, Vol. 42, 2005, 123-137.
32. R. P. Gogolowski and B. R. Morgan, FAA DOT/FAA/AR-01/21 Ballistic Experiments With Titanium and Aluminium Targets, Report DOT/FAA/AR-01/21, 2001
33. D. Liu, W.J. Stronge, Ballistic limit o f metal plates struck by blunt deformable missiles: experiments, International Journal o f Solids and Structures, Vol. 37, 2000, 1403-1423.
34. R. D. Buehrle, G. A. Fleming, R. S. Pappa, F. W. Grosveld, Finite Element Model Development And Validation For Aircraft Fuselage Structures, 18th International Modal Analysis Conference, San Antonio, Texas, 2001
35 .X . Teng and T. Wierzbicki, Numerical study on crack propagation in high velocity perforation, Computers and Structures, Vol. 83, 2005, 989-1004.
36. R.L. Veldman, J. Ari-Jur, C. Clum, J. Folkert, Effects o f Pre- Pressurisation on plastic deformation o f blast-loaded square aluminium plates, 8th International LS-DYNA Users Conference, Michigan, USA,2004.
37. M. Anghileri, L. M. L. Castelletti, F. Invemizzi, M. Mascheroni, A survey o f numerical models for hail impact analysis using explicit finite element codes, International Journal o f Impact Engineering, Vol. 31,2005, 929-944.
38. W. Johnson, Impact Strength o f Materials, Edward Arnold, 1972.39. N. Jones, Structural Impact, Cambridge Univeristy Press, 1989.40. V. L. Kolmogorov, A method for calculating the stress-strain state in the
general boundary value problem o f metal forming: part 1, International Journal o f Solids and Structures, Vol. 36, 1999, 1253-1262.
41. Prager, W., An introduction to plasticity, Addison-Wesley, 1959.42. Subhash C. Anand, Frank E. Weisgerber, Usage o f the Tresca yield
condition in finite element plane strain analysis, International Journal o f Solids Structures, Vol. 14, Issue 8, 1978, 625-637
122

43. E. H. Lee, and P. S. Symonds, Large Plastic deformations o f beams under transverse impact, Journal o f Applied Mechanics, Vol. 19, 1954, 308- 335.
44. P. S. Symonds and T. Wierzbicki, Membrane mode solutions for impulsively loaded circular plates, Journal o f Applied Mechanics, Vol. 46, Issue 1, 1979,58-64.
45. M. Alves and N. Jones, Impact failure o f beams using damage mechanics: Part II— Application, International Journal o f Impact Engineering, vol 27 issue 8, 2002, 863-890.
46. X. Teng and T. Wierzbicki, Dynamic Shear Plugging o f beams and plates with an advancing crack, International Journal o f Impact Engineering, Vol. 31, Issue 6, 2005, 667-698.
47. Boeing Structural Repairs Manual, 1997.48. A. M. S. Hamouda, A novel constitutive law for describing material
behaviour at high strain rate and large deformation, PhD, Dublin City University, 1995.
49. R. D. Cook, D. S. Malkus, M. E. Plesha, Concepts and Applications o f Finite Element Analysis - Third Edition, John Wiley & Sons, 1989.
50. D. A. Shockey, J. H. Giovanola, J. W. Simpson, D. C. Erlich, R. W. Kloop, S. R. Skaggs, Advanced Armor Technology: Application potential for engine fragment barriers for commercial aircraft, FAA Report DOT/FAA/AR-97/53, 1997.
51. J. Manchor and C. Frankenberger, Engine Debris Penetration Testing, FAA Report DOT/FAA/AR-99/19, 1999.
52. J. Spence and A.S. Tooth, Pressure Vessel Design - Concepts and Principles, E & FN Spon, 1994.
1 2 3

A p p e n d i x 1
Datasheets
A
O rn a i A R T . 101 2 -w a y f u l l -b o r e th r e a d e d - e n d s b r a s s b a l l v a lv eART. 101
2-way full-bore threaded-ends brass ball valve
dal n i l al 2T doppia foratura from V1I4 to T double drfflng
| MATERIALS |
[1) Shaft ¡¡Brass | [EN12164 CW614N |
¡2) O-Ring ¡¡FKM ............ ....... i l ........................... J
¡3) Gland nut ‘[Brass j[EN 12164 CW614N ____________ I(4) Shaft seat ¡[P.T.F.E. ¡I t
¡5) Antifriction rings _ J P-T-F-E: .................................. .... II
[6) Seals [P.T.F.E !l j|7) Ball .[Brass chromium plated j [EN 12164 CW614N .......................Ì¡8) Body .[Brass ¡¡EN 12165 CW617N
|9) Threaded ends j [Brass ||eN 12165 GA/617N J
[Surface treatment: bright nickel plating ______________I
j DIMENSIONS |[ Size J l . A J ! _„Ji__ jl. __op__ !|__ E il . L - J L G i oH J L oL J l ch*M _ . j L l u| 3/8“ J 69 È ¥ * J . . 9 J l . . _31^ . . . J L 38,5 ij . 3 ° '5 || 36 i 36_ . j L S.5 „ ! L _ 25 .J l 10 Ij 1/2" J L 69 . . I l - j j j . I 9 il 31,8 j| 38,5 J j _ 5 5 _ I L 36 j 36 5.5 j l 25 — J l . 15 J| 3/4" . J i 77 J I . B L II. a J . A ° il. 45,3 ;| 36,3 i| 36 j 36 . L 5.5 _ J l . j l “ „ I| 1“ ll 89 J L J i ? J L J J L _ « _ J L 49,2 ¡j _ j o £ j | 36 ! __ 36 _ 5,5 .. J l__ 5 _ . - J I - . 2 5 JI 1*1/4 II 103 II 51.5 II 9 ll 60 || 60,5 ;| 51 <5 !l 42 | 36/42 ;i 5,5 II « ll 32 I| 1"1/2 J L 114 J L ? .. . J l._ U L 70,6 j| . J L . . J L _ “ . . J L 42 J 36/42 l
kn ;
Ln < j l 54 . J L “ J
1 T J L 134 J l JL 11 i[ 88,5 |f 76.3 J 65,3 |j 46 j 42/50 j 5.5/6,5 i| 66 II 50 || 2M1/2 ll 161 j [ 80,5" ] [ 14 |l J J 2 . J L 97 i| 83 |j 65 I 50/70 6,5/8,5 ¡I . _ T * J| 3" J L 185_ JL 92.5. j | J i J L 138,4 || 108.5 | f 9‘ .5 J l . 65 j 50/70 !l 6,5/8.5 ll 98 . J l “ J
B

Sabot M ateria l: E rta lo n 6PLA
ERTALON® 6PLACast Nylon 6 (PA6G)
E R T A L O N ® 6 P L A is a n a t u r a l w h i t e c a s t n y l o n 6 w i th a g o o d o v e r a l l b a l a n c e o f p h y s i c a l p r o p e r t i e s , c o m b i n i n g
g o o d t e n s i l e p e r f o r m a n c e w i t h w e a r r e s i s t a n c e , t o u g h n e s s , f l e x ib i l i ty a r i d c r e e p r e s i s t a n c e .
• H i g h i m p a c t s t r e n g t h • G o o d f a t i g u e r e s i s t a n c e
• H i g h m e c h a n i c a l d a m p i n g • L o w w e i g h t ( 1 / 6 v s s t e e l )
• G o o d a l k a l i n e r e s i s t a n c e { u p to p H 1 2 ) • G o o d w e a r r e s i s t a n c e
• H i g h s t r e n g t h / s t i f f n e s s • C o n t i n u o u s t e m p e r a t u r e 9 0 ° C ( m a x . 1 7 0 ° C )
C o m m o n a p p l i c a t i o n s : R a c k s ; P in i o n s : G e a r s ; B e a r i n g s ; R o l le r s : W h e e l s ; C a m s ; N u ts ; V a l v e s e a t s ;
P u l l e y s ; G a s k e t s ; E l e c t r i c a l i n s u l a t o r s .
Delivery Programme
Rod 3m long
Diameter (mm): 50 (Min) 150 (Max)
Rod 1m long
Diameter(mm): 50 (Min) 500 (Max)
Rod 500mm long
Diameter (mm): 210 (Min) 500 (Max)
Plate
Thickness (mm): 10 (Min) 100 (Max)
Sizes (mm): 610 x 1220. 1220 x 2000
1220 x 2440
Tube 2m long
O.D.(mm): 50 (Min) 150 (Max)
f.O.(mm): 20 |Min> 135 (Max)
Tube 1000mm long
O.D.{mm): 155 (Min) 260 (Max)
I.D.(mm): 50 (Min) 235 (Max)
T ube 600mm long
O.D.(mm): 220 (Min) 600 (Max)
I.D.(mm): 70 (Min) 570 (Max)
Distributor
G ilbert Curry Industrial Plastics C o Ltd
Tel: 024 76 588 388Fax: 024 74 588 389 email: plasilcsdgclp.co.uk
Aecip
Technical Specification
Property ISO
M eth ods
U n its ERTALON®
6P LA
C o lo u r - - N a tu ra l
D ensity 1183 g /c m 3 1.15
W a le r absorption
S a turation in a ir (23(’C / 50% RH) % 2 .20
S aturation in w a te r (23°C) - % 6 .50
Tensile s tre n g th '1 527 N /m m 2 85
Tensile m odulus o f e ia s tic ity * ' 527 N /rn m 2 3 5 0 0
Elonga tion at b reak*' 527 % 25
Im pact - C h arpy” 1 7 9 /te U kJ /m 2 no break
Im pact - Izod no tched ’ ’ t6 0 /2 A kJ /m 2 3.5
H a rd n e s s R o ckw e ll - MSB
Snore D - -
M elt point - °C 2 2 0
M ax a llow able service tem p in a ir
for short periods “C 170
continuously for 20,C0Ghrs - "C 90
Linear therm al expansion coe ffic ie n t - K-’ x1Q-5 3.0
Therm al conductiv ity - W /(K .m ) 0 .29
F lam in a b ility *2 (6m m th ickne ss } - - HB
Volum e res is tiv ity*1 IEC93 O h m .cm > 1 0 14
D ie lectric s tren g th *’ IE C 2 43 kV /m m 25
O utside app lica tions - U V res is tance - - B/A
A cids - strong (pH < 3) - - C
A lka lis - strong (pH > 11) - - B/C
C h lorina ted hydrocarbons - - A 'B
H o i w a ter - - B
'A‘ - Acceptable service: ‘B’ - Limited service; 'C - Unacceptable.*■' Measured on dry test specimens (where applicable)
Tests completed by Quadrant EPP, using UL test methods
Noi a I matet sJ sizes shown wuhin tfie dciivcry piogra-Tmo section ci :h s data shoet aie ava ilatxo a« standard Please ccrua Guatì ra r.: £ PP UK Lid fer furthei deta ils
c

L aser for velocity m easurem ent system
Self-C ontained Helium-Neon Laser S ystem s 1500 Series ( 2
Model 1500 Series Novette™ Self-Contained Helium-Neon Laser Systems(S pecific ;)lions in inches unless o therw ise no ted .)
T1.75Is ■■ 1
T2-50
1L00-te-| -7.00- H
1̂2-27 ►T3.75
1DC plug with 6 foot cable
SpecificationsParameter Model 1500 Series Novctte Laser Systems
Model Number {note1)1507 1507P 1506 I 508P
OpticalMinimum output power (TLM»&) 6.̂ 3 nm 0.8 mW 0.8 roW 0.5 mW 0.5 m\vlk jm diameter (ile 2 t>ointj-» ± 3%) CMS mm 0.48 mm 0,48 mm 0.48 mmBeam divergence (±3%) 1,7 mrud 1.7 m n d 1.7 mrad 1.7 mradM inimum polarizaton ratio n / a 500:1 N/A 500:1Longitudinal mode spacing 1090 MHz 1090 Ml-lz 1090 MHz 1090 MHzMaximum noise (rm*, 30 Hz to 10 MHz) 1.0% 1.0% 1.0% LOWMaximum driit (note2) ±2.5*;. ¿ 2.5% ± 2.5% ± 23%Maximum mode sweeping contribution io; r, 10% 20% 20%Maximum warm-up lime (note1) 10 10 10 10CDRH class 11 la Ilia II 11ElectricalOpera ling current
AC at 120 VAC 150 mA 1 50 mA 150 mA 150mAAC at 220 V AC 82 mA 82 mA S2 mA 82 mAAC at 100 V AC N/A N/A N/A N/A
PhpicalWeight 4.0 lbs. ■1.0 lbs. 4.0 lbs. 4.0 lbs.l. Add -1 for 120 V AC -> lb i 220 V AC, w -J for 100 V AC operation. For cample, 1507-2 will bo ccnlijitrcd for 220 V AC open (ion 1 Mem pcwrr measured OTer is hours 3. Minimum id 95*>'i powr
D

C arriages and Rails
i n o 1AccuGlide'" T-Series'“ Linear Ball GuidesAT-A - A Siyle
M aterial•Rail:•Carriage:
►Speed:’ Max. Temp:
Alum inium with Steel strips Aluminium/Steel
Max. 3m /s acceleration 50m /s? 30CC
— Y§
i i— Screw size
t
J
: i : : ! ! !
Y§ Will be equal on both ends, unless otherwise specified.
Quoam Im R rw mWhen ordering a rail, please specify the number of carriages required (1,2,3. etc.,) per rail, for example: 1 x RT20AL1000 and 1 x AT20A
Please note: a minimum ol 1 carriage must be ordered per rail. Carriages are dimensionalty matched to rails during assembly.'Important - Carriages are not ball retained/
Typo | A Ai A2 As H Hi Hi
Dimensions (mm) MaiEi Ei Si Sz Sa Ss So Ni N& Ns X LSeries 20 63 31.5 20 21.5 3D 25.0 1B 76 53 40 M5 M3 1.15 5.8 9.5 10.00 6.25 7.5 60 3000Series 25 70 35.0 23 23.5 35 29.5 22 88 57 45 Mo M9 MS 7.0 10.7 12.00 3.00 10.0 60 3000Series 35 100 50.0 34 33 0 4B 40.0 29 117 82 62 Ma MIO 1.18 9.0 14.0 1 5.26 6.60 11.0 8 0 3000
ÌT25AL1 OOP t:>. AT25A RT35AL.1 OOP AT35A
l 13000 15000 £ 1 0 0 ,4 0 £42.691 25000 28000 .O l i . 221. £112.75 i ' £80152
A higher precision all steel version linear ball guide is also available. Please ask sales tor details
* Modifications p o ss ib ly * T© I :+44 (0)1246 261300 Fax:+44 (0)1246 261688
E

Al 2014 -T 4 M ateria lfc ^M ß Y -2 0 0 4 1 6 :5 4 .FROM:
‘ '42004 1 3 :3 6 FAl 0203700203B A tU M IN rU ÌI SUPPLY AERO
TO: 900 353170 03333 .
TYLÜESLEY.
nopy Pon.coNSjCNeE, f
, -Toiàprc*^; (01492)014200
Fax: (01492) 614295 (Sales)
'aluminium SUPPLY (AEROSPACS) lid fPO BOX 257 AU.UM WAVto ttsriegeLONDON N20 9QS
P. 3 '3
® 0Ü1/00-3
ceRTiRCATE of coNPonacmr APPROVÈD CERTIFICATE MOD DCL Reg. No: 185 AOI
GAA Approval AI/9777/01 BAe/AG/30391/MAA '
Sonai no . 54705 A fi-CC tó
186466/1
3 /0 5 7 5
»»me Roliwd Produoc»Divlalan of Aieoa MartufncmrtnB IGB) Umtead
Your Ofdor No.
04 SSP 2001
O l > 2 . > SDOLGARROQ
CONWY LL32 0JH e?I O
Our Work» 1 Order Na.
C«orip(iofVCouni Ce» ld«ntJfic*iIon Specification WaitfitKfl C u tNo.
Tisi No,
32155/1/03 .2000.00 x 10C0.00 x l.OQntt
77 Clad SheetsCaßs no21 S771L164/L166
A l lo y2014A
7oa|perT4
hit er artificial ageino at 175 äeg C +/-S dog c for 9 to 12 bear», the material is capable of moating tho r©quiiomant* of L167-T62. After solution h*at treating. foetal meets the reguiramante of L166-T42.
m 2014N202
Tha sbovo materiel te stamped or tallied with the spsdficaitan number, tost numtjur end in ip ^ to r's sterpp. ttrus: x
jjEJTE S T RESULTS
Thickrtfft*■ 'i
R»Cw Rjj Au CHEMICAL ANALYSIS %mm MPb( M?S % Si f t Cu Mfl Me 2n T! C r
t . o o 2 5 4 .0 4 2 3 .0 1i
17 T4 .7 2 . 3 3 ' 4 .4 ? .6 9 .6 1 0 .0 3 ♦ 034 .0 2 1.9 9 2 5 7 .0 4 2 7 ,0 18 T4
1 .0 0 2 5 5 .0 4 2 9 .0 20 T42 1 ,
1 .0 0 2 5 3 .0 4 2 5 .0 20 T 42 "" - t j f + 2r .0 3 9. . 90 4O É.0 454 >0 T62
.9 9 4 0 5 .0 « 2 , 0 7 T62 C la flä ä rag Ana l y s i s. .08 . > '.2 1 ’ .0 0 6 ' ;o o 5 .0 0 3 .0 0 3 .0 2 2 .0 0 2
‘ *dX$ 0&
i vj
'Csrtilifid tfi*i tna wfcot» hereon have bson Impacted,toitod, and inless oth«r\rte* siat^W fficrm’In aJf'raawcts with tne /eguirsmftna of me Centraci Of Offler.The quality wflttt^&rmnseirwnb atoptvd !n ««pact of m «* »upptoo have accorried witn ihA contfilions &S £N 0062 >4’Certflnd tn&t.u«ess öthwtbe ataaa we virola os ff.t anew rnanuùftéd nQterials hava been mamjtadurw, tested and inspect«) in accordance vriiii ths ;«rms ol_ Oxi oid*r/c«/rtmci uppKcable thereto. *rt<3 fully to IfW «tandfi«!*/a»cWcauon* quo tad herncm ana tht fequi/mnant* oi th* Civil Aviation Autnarlty.-
Signed:
for and on bQhett Of ALCOA EUROPE04 SEP 2001
P . 0:
F
Working Drawings for New Gas-powered Projectile Launcher
Appendix 2
G


ou
S c h o o l o f M e c h a n i c a l and M a n u f a c i u r i n g E n g i n e e r i ng
Name : P i e r c e Ke n n e d y D a t e : 15 Mar c h 2004
Pa r t : F u l l As s emb1 y N o t e s :
S c a l e : 0 . 0 6
Ou an t i t y : 1
/

I 1
80
o>oo IT i8 5^ ' r
ooCO 1 1 0 0 *
1 1 6 0 .1
990

uo OvJ
lO
<Z>OCXJ
Sc hoo 1 o f Mec han i c a 1 and M a n u f a c t u r i n g E n g i n e e r i n g
Name : P i e r c e Ke n n e d y Da t e : 5 Apr i 1 2004
P a r t : Mai n Frame N o t e s : A l l 50mm □ t u b i n g . A l l d ime n s i on s i n mm
S c a l e : 0 . 0 4
Q u a n t i t y : 1

0101
380

S c h o o l o f M e c h a n i c a l and M a n u f a c t u r i n g E n g i n e e r i n g
Name : P i e r c e Ke n n e d y D a t e : 9 Mar c h 2004
P a r t : S l i d e Frame N o t e s : A l l t u b i n g 50mm □ A l l d i m e n s i o n s i n mm
S c a l e : 0. 1
Q u a n t i t y : 1

S c h o o l o f M e c h a n i c a l and M a n u f a c t u r i n g E n g i n e e r i n g
Name: P i e r c e Ke n n e d y D a t e : 23 Ma r c h 2004
P a r i : B a r r e l N o t e s : A l l d i m e n s i o n s i n mmS c a l e : 0 . 0 4
Quan t i t y : 1
0 7 5 T h r e a d e d

S c h o o l o f M e c h a n i c a l and M a n u f a c t u r i n g E n g i n e e r i n g
Name : P i e r c e Ke n n e d y D a t e : 23 Ma r c h 2004
P a r t : S l eev e F i x N o t e s . A I 1 H o l e s t he sa me . A l l d i m e n s i o n s i n mm
S c a l e : 1
Q u a n t i t y : 1
<z>L O

S c h o o l o f M e c h a n i c a l and M a n u f a c t u r i n g E n g i n e e r i n g
Name: P i e r c e Ke nned y D a t e : 23 Mar c h 2004
P a r t : B a r r e l Ope Cover N o t e s : B o t h Ho l e s t he s a m e . A l l d i m e n s i o n s i n mm
S c a l e : 1
Ouan t i t y : 1

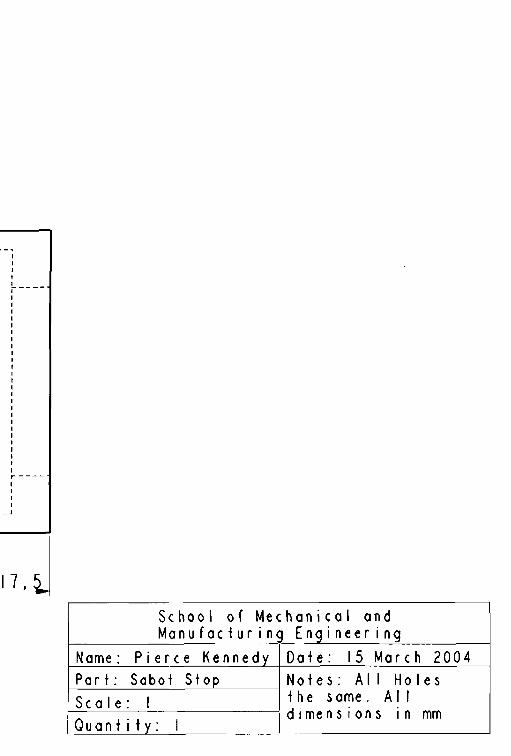
Sc h o o l o f M e c h a n i c a l and M a n u f a c i u r i n g E n g i n e e r i n g
Name : P i e r c e Ke n n e d y D a t e : 15 Mar c h 2004
Par f : Sabot St op N o t e s : A l l Ho l e s t he s ame . A l l d i m e n s i o n s i n mm
S c a l e : 1
Q u a n t i t y : 1
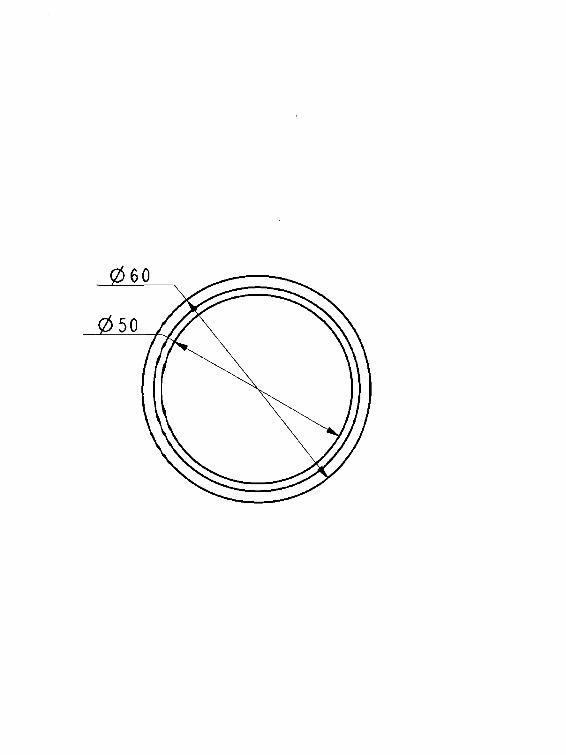
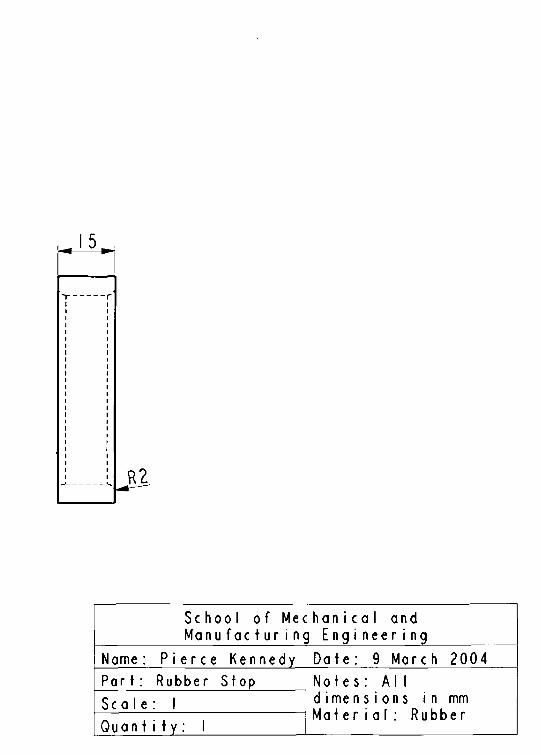
15
'i-----------r
S c h o o l o f M e c h a n i c a l and M a n u f a c t u r i n g E n g i n e e r i n g
Name : P i e r c e Ke nned y D a t e : 9 Mar c h 2004
P a r t : Rubber St op N o t e s : Al 1 d i m e n s i o n s i n mm Ma t e r i a 1 : Rubber
S c a l e : 1
Q u a n t i t y : 1

0 7 0
0 7 5 Threaded
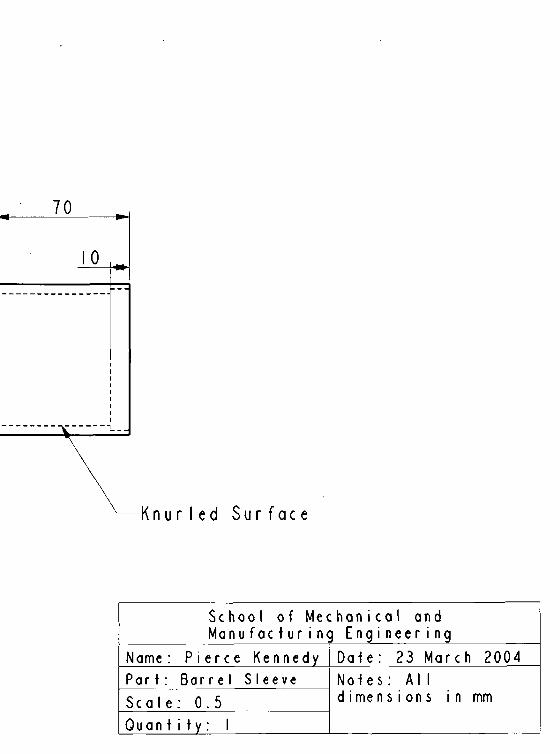
70
10
S c h o o l o f M e c h a n i c a l and M a n u f a c t u r i n g E n g i n e e r i n g
Name: P i e r c e Ke nned y Dat e : 23 Mar c h 2004
P a r t : B a r r e l S l eev e No t e s : Al 1 d i m e n s i o n s i n mmS c a l e : 0 . 5
Q u a n t i t y : 1

050,
8
62
OsJ I I CO<T>
<T>rO
tOTQt
LO
Threaded Sec t i o n

Threaded Sec t i on
S c h o o l o f M e c h a n i c a l and M a n u f a c t u r i n g E n g i n e e r i n g
Name : P i e r c e Ke n n e d y D a t e : 23 Ma r c h 2004
Par t : Connec t o r N o t e s : Al 1 d i m e n s i o n s i n mmS c a l e : 1
Ouan t i t y : 1

0 7 0 0 5
Oo
17!O
<z>"^r

S c h o o l o f M e c h a n i c a l and M a n u f a c t u r i n g E n g i n e e r i n g
Name : P i e r c e Ke nned y D a t e : 09 Ma r c h 2004
P a r t : B a r r e l Cl amp N o t e s : A l l d i m e n s i o n s i n mmS c a l e : 0 . 5
Q u a n t i t y : 3


Body
S c h o o l o f M e c h a n i c a l and M a n u f a c t u r i n g E n g i n e e r i n g
Name: P i e r c e Ke n n e d y Da t e ; 15 Mar c h 2004
P a r t : Sabot Assembl y N o t e s :
S c a l e : 1
Quan t i t y : 1

o

S c h o o l o f M e c h a n i c a l and M a n u f a c t u r i n g E n g i n e e r i n g
Name: P i e r c e Ke nned y Da t e : 9 Mar c h 2004
Par t : Sabot Fr ont Pl at e No t e s : A 11 H o l e s t he s a m e . A l l d i m e n s i o n s i n mm
S c a l e : 1
Ouan t i t y : 1


40
! 5 _
I
S c h o o l o f M e c h a n i c a l and M a n u f a c t u r i n g E n g i n e e r i n g
Name : P i e r c e Ke n n e d y D a t e : 9 Mar c h 2004
P a r t : Sabot Body Notes: Al 1 Holes the same. A l l dimensions in mm Mater i a 1 : Rubber
S c a l e : 1
Ou an t i t y : 1

0 6 0

S c h o o l o f M e c h a n i c a l and M a n u f a c t u r i n g E n g i n e e r i n g
Name: P i e r c e Ke nned y Da t e : 9 Mar c h 2004
P a r t : Sabot s l i d e s Notes: A l l Holes t he same. A l l dimensions in mm. Ma f e r i a l : Tef l on
S c a l e : 1
Ouan t i t y : 2

o

S c h o o l o f M e c h a n i c a l and M a n u f a c t u r i n g E n g i n e e r i n g
Name : P i e r c e Ke n n e d y D a t e : 9 Mar c h 2004
P a r t : Sabo t Bac k P l a t e N o t e s : A l l H o l e s t he sa me . A l l d ime n s i on s in mm
S c a l e : 1
Ouan t i t y : 1
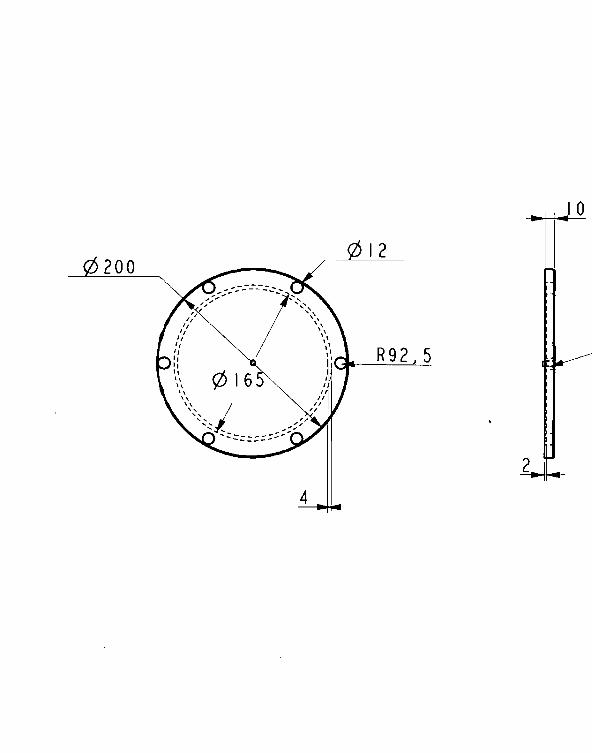

1/4" BSP
S c h o o l o f M e c h a n i c a l and M a n u f a c t u r i n g E n g i n e e r i n g
Name: P i e r c e Ke n n e d y D a t e : 15 Marc h 2004Par f : Reservoir Endplote (2) N o t e s : A 1 1 H o l e s t he
same u n l e s s s t a t e d . A l l d i m e n s i o n s i n mm
S c a l e : 0 . 2 5
Q u a n t i t y : 1

L O
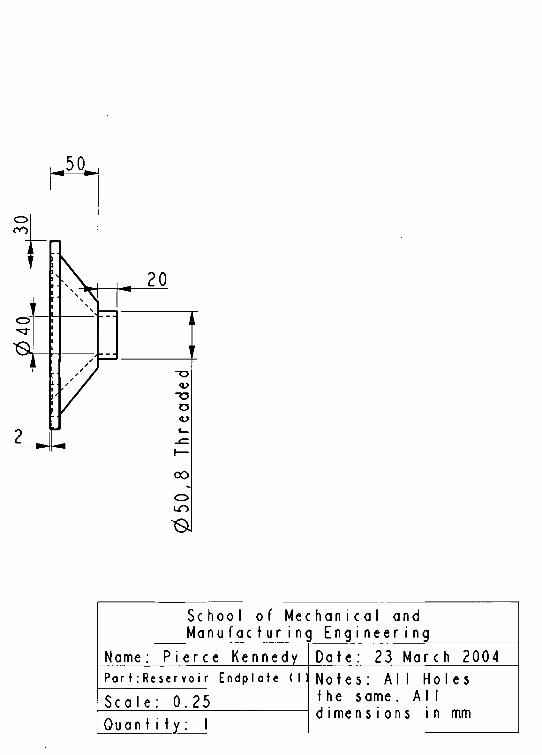
50.
S c h o o l o f Mec han i c a 1 and M a n u f a c t u r i n g E n g i n e e r i n g
Name : P i e r c e Ke n n e d y D a t e : 23 Ma r c h 2004P a r t : Re ser voi r Endplafe (M N o t e s : Al 1 H o l e s
t he s a m e . A l l d ime n s i on s in mm
S c a l e : 0 . 2 5
Q u a n t i t y : 1

02
00

R92.
5
S c h o o l o f Mec han i c a 1 and M a n u f a c t u r i n g E n g i n e e r i n g
Name: P i e r c e Ke n n e d y Da t e : 15 Mar c h 2004
Par t : R e s e r v o i r Body N o t e s : A l l h o l e s t he s am e . A l l d i me n s i ons i n mm
S c a l e : 0 . 2
Quan t i t y : 1

009M5
S c h o o l o f M e c h a n i c a l and M a n u f a c t u r i n g E n g i n e e r i n g
Name .‘ . P i e r c e Ke n n e d y D a t e : 9 Ma r c h 2004
Par t : Cl amp Suppor t Not es: A l l ho l es t he same un l ess spec i f i ed A l l d i mens i ons in mm
S c a l e : 0 . 2
Q u a n t i t y : 2
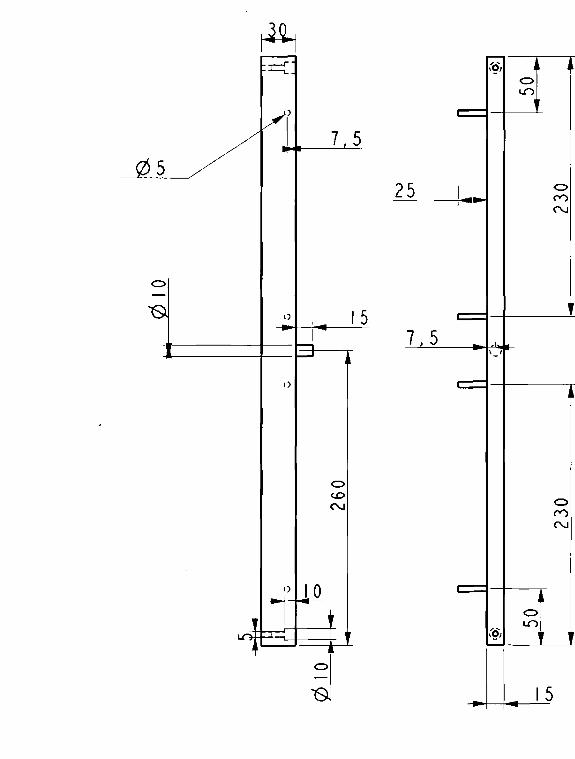
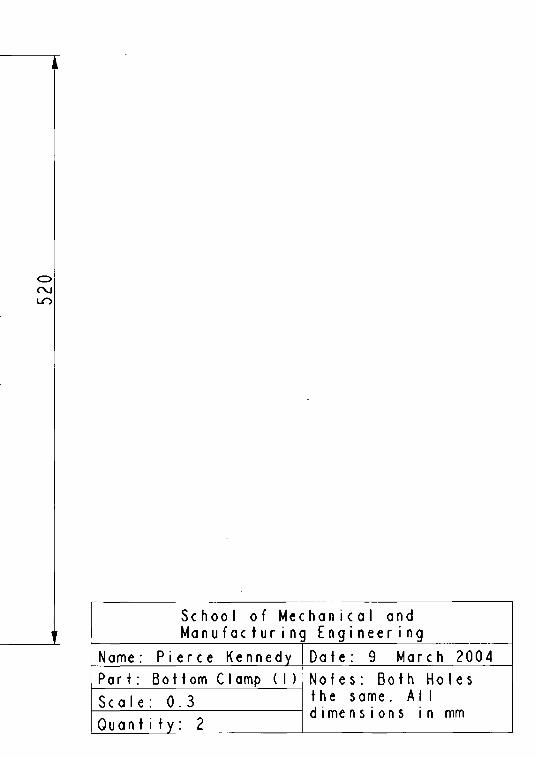
S c h o o l o f M e c h a n i c a l and M a n u f a c t u r i n g E n g i n e e r i n g
Name : P i e r c e Ke nned y D a t e : 9 Ma r c h 2004
Par t : Bo t t o m C 1 amp ( 1) N o t e s : B o t h H o l e s t he s a me . A l l d i m e n s i o n s i n mm
S c a l e : 0 . 3
Q u a n t i t y : 2

hole M5
S c h o o l o f M e c h a n i c a l and M a n u f a c t u r i n g E n g i n e e r i n g
Name : P i e r c e Ke n n e d y D a t e : 9 Ma r c h 2004
P a r t : Bot t om C 1 amp ( 2 ) N o t e s : B o t h Ho l e s t he s a m e . A l l d i m e n s i o n s i n mm
S c a l e : 0 . 3
Ouan t i t y : 2

-4-lJ
OO
S c h o o l o f M e c h a n i c a l and M a n u f a c t u r i n g E n g i n e e r i n g
Name : P i e r c e Ke n n e d y D a t e : 15 Mar c h 2004
P a r t : Suppor t S t r u t N o t e s : A I I H o l e s t he s a me . A l l d i m e n s i o n s i n mm
S c a l e : 0 . 3
Q u an t i t y : 2

5
13
Sc hoo 1 o f Mec hon i c o 1 and M a n u f a c t u r i n g E n g i n e e r i n g
Name: P i e r c e Ke n n e d y D a t e : 15 Ma r c h 2004
Par t : Car r i age Plate (1) N o t e s : A l 1 d ime n s i on s in mmS c a l e : 0 . 3
Ouan t i t y : 2

63
(Ö)
(Q )
< & -
0 5
<Z>
(Ô)
<z>
1 1 . 5

Sc h o o l o f M e c h a n i c a l and M a n u f a c t u r i n g E n g i n e e r i n g
Name: P i e r c e Ke n n e d y D a t e : 9 Mar c h 2004
Par t ; Car r i age Pl a t e (2) No t e s : Al 1d i m e n s i o n s i n mmS c a l e : 1
Q u a n t i t y : 2

130
t
0 1 2<z>
1 oor \ / c \
X . _ r i -
J K
J O1 8 , 75 9 2 . 5

Sc hoo 1 o f Mec han i c a 1 and M a n u f a c t u r i n g E n g i n e e r i n g
Name: P i e r c e Ke nned y Da t e : 15 Mar c h 2004
P a r t : R e s e r v o i r B r a c k e t N o t e s : A l l d i m e n s i o n s i n mmS c a l e : 0 . 5
0 u a n t i t y : 1


S c h o o l o f M e c h a n i c a l and M a n u f a c t u r i n g E n g i n e e r i n g
Name: P i e r c e Ke n n e d y Da t e : 5 A p r i l 2004
Par t : Bot tom C 1 amp ( 1 ) N o t e s : B o t h H o l e s t he sa me . A M d i m e n s i o n s i n mm
S c a l e : 1
Q u a n t i t y : 2


08
25
50
5
S c h o o l o f M e c h a n i c a l and M a n u f a c t u r i n g E n g i n e e r i n g
Name : P i e r c e Ke nned y D a t e : 9 Mar c h 2004Part : Mag Clamp Br acket ( l ) N o t e s : Al 1
d i m e n s i o n s i n mmS c a l e : 1
Ouan t i t y : 2