a compressed sensing based approach for subtyping of leukemia from gene expression data
TRANSCRIPT

Classifying Six Glioma Subtypes from Combined Gene Expression and CNVs Data Based on Compressive Sensing Approach
Wenlong Tang1, Hongbao Cao1, Ji-Gang Zhang2, Junbo Duan1, Dongdong Lin1, and Yu-Ping Wang1, 2
1 Department of Biomedical Engineering, 2 Department of Biostatistics and Bioinformatics,Tulane University, New Orleans, USA
Abstract—It is realized that a combined analysis of different types of genomic measurements tends to give more reliable classification results. However, how to efficiently combine data with different resolutions is challenging. We propose a novel compressed sensing based approach for the combined analysis of gene expression and copy number variants data for the purpose of subtyping six types of Gliomas. Experiment results show that the proposed combined approach can substantially improve the classification accuracy compared to that of using either of individual data type. The proposed approach can be applicable to many other types of genomic data.
Keywords-Combined; glioma; subtyping; compressive sensing
I. INTRODUCTION
In recent years, the development of bio-techniques allows researchers to collect different types of data from an experiment, such as gene expression, SNP, and copy number variation (CNV) data. A better result could be generated based on combining multiple types of data than using any individual data. Combined analysis with different data types of genome-wide measurements is not a new concept, but how to combine them efficiently for biological discovery is always challenging. A web based platform, called Magellan, was developed for the integrated analysis of DNA copy number and expression data in ovarian cancer [1]. The significant correlation between gene expression and patient survival has been found by Magellan. Troyanskaya et al. [2] developed a Bayesian framework to combineheterogeneous data sources for predicting gene function. Improved accuracy of the gene groupings has been achieved compared with microarray analysis alone. Kernel-based statistical learning algorithms were also used in the combine analysis of multiple genome-wide datasets [3]. Some combined analysis methods need the datasets to have the same distribution [4]; one has to transform the datasets to be the same distribution before the analysis. Recently, an integrative approach combining linkage, gene
expression, and association has been reported to identify candidate genes regulating BMD [5]. The combined analysis approach proposed in this work has no specific requirement for the data types or data distributions. In order to test the effectiveness of our approach, we applied it to the subtyping of gilomas.
Gliomas are tumors that start in the brain or spine and arise from glial cells [6]. Gliomas are the most common type of primary brain tumors in adults [7].The classification of gliomas can be based on cell type, grade and location. For instance, gliomas can be classified into low-grade and high-grade determined by pathologic evaluation of the tumor. In this study, we define the subtypes based on genetic and molecular signatures according to the reference [7].
The classification of glioma subtypes based on genomic data has attracted a lot of attentions and has been investigated by many research groups. Most of the works have been based on gene expression data. It was reported that four subtypes of gliomas, oligodendroglioma, anaplastic oligodendroglioma,anaplastic astrocytoma and glioblastoma multiforme,can be distinguished by only two-gene or three-gene combinations [8]. Nutt et al. built a k-nearest model with 20 features to classify 28 glioblastomas and 22 anaplastic oligodendrogliomas. It was claimed that class distinctions according to the model were significantly associated with survival outcome (P=0.05) [9]. Clakraborty et al. considered several Bayesian classification methods to classify gliomas with gene expression data. A Bayesian variable selection scheme was also proposed for gene selection[10]. Noushmehr et al. found a distinct subset of samples in The Cancer Genome Atlas (TCGA) glioma samples displaying concerted hypermethylation at a large number of loci. They took it as evidence that a glioma-CpG island methylator phenotype exists [11].Verhaak et al. classified glioma into four subtypes: Proneural, Neural, Classical, and Messenchymal, based on gene expression data [12]. MRI data have also been used in the classification of gliomas [13] [14]. However, to the authors’ best knowledge, few researchers have combined two or more than two types of data to improve the gliomas classification.
282
2011 IEEE International Conference on Bioinformatics and Biomedicine Workshops
978-1-4577-1613-3/11/$26.00 ©2011 IEEE

Therefore, a novel approach that can combine multiple data sets is needed for improved classification. Compressed sensing (CS), also called compressive sampling, has been developed recently in statistics and signal processing, and becomes a powerful tool for data analysis. We recently used CS method to classify chromosomes from multicolor fluorescence in-situ hybridization (M-FISH) images [15], as well as integrated analysis of copy number data and gene expression data for identifying gene groups susceptible to cancers [16]. In these studies, we demonstrated the advantages of the CS methods in compact representation of combined genomic data, resulting in higher classification accuracy.
The work described in this work is to develop a CS based integration and classification methods and apply them to identify the subtyping of gliomas. The results demonstrate that the proposed methods can significantly improve the classification accuracy of gliomas compared to individual gene expression orCNVs data analysis.
II. DATA COLLECTION
The data in this study is publicly available from the website of National Cancer Institute (https://caintegrator.nci.nih.gov/rembrandt/home.do). Two unsupervised methods had been used to analyze the six glioma subtypes based on the gene expression data of the patients [7]. In our study, we classify the six Glioma subtypes by integrated analysis of both gene expression and CNVs data. The overview of the six hierarchically nested subtypes of gliomas is shown in Figure 1.
Figure 1. The hierarchical structure of the six subtypes of gliomas.
We collected a dataset that has 56 samples (patients) with both gene expression data (54675probes for each sample) and CNV data (758 probesfor each sample). Eight samples belong to theOligodendroglioma-rich (O) main type that has 4 OAs
and 4 OBs. For the rest 48 samples, Glioblastoma-rich (G), we have 27 GAs (10 GA1s and 17 GA2s) and 21 GBs (13 GB1s and 8 GB2s).
III. METHODS
According to the structure of the six subtypes described in Figure 1, we used divisive (TOP-DOWN) algorithm to subtype each of the 6 classes.At the top level, the data are classified into two main types O and G; then those two subtypes are further classified, untill 6 subtypes are obtained at the bottom level. Sparse representation clustering (SRC) methodproposed by us is applied to select informative variables (IVs) (genes or probes) for the subtyping of gliomas in the analysis. SRC algorithm was obtained from compressed sensing (CS) theory, which aims to approximate a sparse solution of y x� A in a given underdetermined matrix A, where A is a characteristic matrix, y is a testing signal and x is a known signal.
A. Feature SelectionTo distinguish the two groups (e.g., O and G), it is
helpful to extract significant features from the overall gene expression and CNVs data, respectively. For each gene or probe, we extracted 4 features: the standard deviation of each group ( 1Std and 2Std ), the absolute value of the mean difference of the two groups (MD), and the Pearson's linear correlation coefficient (Corr). Thus for i-th variable, we have a 4 dimensional feature vector as follows:
� �1 24, , ,i i i i iV Std Std MD Corr� �� , (1)
where i=1,2,...N, and N is the number of genes/CNVs.Each feature is normalized by its overall maximum value so that each entry of � �0,1iV � . A number of MIVs can be selected accordingly, yielding M N� .The detail of the feature selection can be found in reference [17]. After the normalization, we get the feature dataset as the input of SRC algorithm.
B. SRC Algorithm
In CS theory, if a signal nx R� is sparse, it could be recovered stably by its measurements x y�A .This can be formulated as solving the following optimization problem:
(P0) 0x̂ argmin x� , subject to x y�A (2)
where 0x is l-0 norm, ky R� , k n�� , k nR �A .This is an NP hard problem by traversing all possible entries for x. The l-1norm is used instead by minimizing the nonzero numbers, which can be considered as a linear programming problem:
(P1) 1x̂ argmin x� , subject to x y�A (3)
283

where 1 1
n
ix x
�� . The solution path of this
problem has a piecewise-linear-property [18], andcan be solved with k-steps when x is sparse enough,and A is under certain condition [19] [20].
The basic problem in SRC is to use labelled training samples (included in A) from distinct classes to correctly determine the class to which a new test sample belongs. If we design � � k n
ia R � �A , ia is a
positive unite vector with 1ia � , a new unclassified
sample ky R� will result in an estimate of sparsesolution x̂ , whose non-zero entries correspond to aparticular cluster.
Sparse Representation-based clustering (SRC):1. Input characteristic matrix A with vectors of
s different clusters and a test sample 1ky �� .
2. Normalize the columns of A to have unit l-2norm.
3. Solve the l-1 norm minimization problem (P1) defined by Equation (3).
4. Calculate the vector angle � �� �,i iy x �A ,
� �1,2, ,i s� � , where � �i x� is a mask
function that maps x to a sparse vector, with non-zero entries in the i-th group.
5. ( ) arg min ( )i iIdentity y � .The details of the SRC algorithm can be found in
reference [16].
C. Transformation Matrix DesignTo design a transformation matrix A, several
methods have been proposed [19], such as incoherent matrices, random projection matrices, etc. In this study, we propose a method of designing A by considering all possible classes in a subtyping work.
The matrix A should have some specific properties. We require that the column vectors in Aare all positive and have the unit l-2 norm. Moreover, the feature extraction approach introduced in Sec. 3.1 requires that the s different clusters contained in Ahave low standard deviations, high mean difference and high Pearson’s correlation. To guarantee that any vector from a class in matrix A is represented by its corresponding characteristic matrix, we require thematrix A is of full rank.
For any given vector ia �A , the sparse representation coefficients x̂ of ia in A should haveonly nonzero entries concentrated on a single cluster with high sparsity. Otherwise, ia is thought to be
invalid. The Sparsity Concentration Index (SCI) [21]shown in Eq. (4) is introduced to validate A to measure how concentrated the feature vectors are on a particular class in the dataset.
� �
� �
� �1
1
max 10,1 ,
1
ii
xs
xSCI x
s
� �
� ��
(4)
where s is the number of classes, � �k x� is a mask function that that maps x to a sparse vector, with non-zero entries in the i-th group. For a solution x̂ found by the SRC algorithm, if � �ˆ 1SCI x � , the feature vector y is represented using vectors only from a single class; if � �ˆ 0SCI x � , the sparse coefficients are spread evenly over all classes. We choose a threshold � �0,1� � and accept a vector as valid if
� �ˆSCI x �� ; otherwise, reject it as invalid.
D. Compressed Sensing Based ClassifierThe training of transformation matrix can be
formulated as a sparse representation problem as shown in Eq. (5),
0�� �Y S n , (5)
where { } M ci
� �Y �y are the gene expressions of selected genes for the total samples/patients;
20 0 N~ (0,� I )�n is i.i.d. Gaussian noise;
{ } N c� �S �is are the gene expressions of all the genes for the total samples/patients, and M N� .The matrix M N� �� is a sparse transformation matrix. The linear system given by (5) is an underdetermined sparse system, which can be solved by using l-1 norm minimization algorithm.
A CS based classifier is developed to classify the glioma subtypes. To testify whether a given vector
M��y belongs to a known signal N��is or not, we set the hypothesis as follows [22]:
0H ��� : y n ,
� �1 iH �� �:� y s n . (6)
From (6), we have � �y (0, 2 T� �� ) under 0H� ,
� �y ( i�s , 2 T� �� ) under 1H� , which gives:
� �� �
� �
12
0 12 2 2
12
2
TT
NT
expf y
� ��
� �� �
�� ��� �� ��
y y, (7)
and
284

� �� � � � � �
� �
12
1 12 2 2
12
2
T
T
Ti i
N
expf y
� � �� �
� �� �
�� �� � �� �� ��
y s y s. (8)
Thus, the likelihood ratio test is: if 1
0
( )1
( )f yf y
� , y is
under 0H� ; otherwise, y is under 1H� . The likelihood ratio test can be simplified by taking a logarithm and the compressive classification of M��y can be derived as follows.
Define compressive detector �t as:
� � 1T T�� ��
��t : y S , (9)
where � � � �1 c N ci it � � � �� � � �,t S s , i=1,2, …, c.
It has been proven by reference [18] that under the condition of 0H� :
it� ~ � � 120, T T Tii� � �� �
�� �� �� �� s s , (10)
while under the condition of 1H� :
it� ~ � � � �1 12, .T T T T T Ti i i i� �� � � � �� �
� �� �� �� �� s s s s
(11)We then calculate the differences of the standard score of � �i idst t� � under the two conditions:
i
i i
i ii
ts
ttd
�� �
�� �� �
� , (12)
where
� � 12 1/2( )T T Ti i i� � � �� �
�� s s ,
and � � 1T T Ti i iµ � �� �
�� s s .
We assign a class ID label to the vector y:( ) arg max ( )i iIdentity dst� �y . (13)
If � �Identity y is within the range of 1 to 1c , ybelongs to class 1; otherwise, y belongs to class 2.Obviously, our proposed approach can be extended to the classification of multiple classes.
It can be seen that by introducing the sparse transformation matrix � , we projected the originalsignal 1
iN��s to a very smaller dimensional
signal 1Mi
� ��s . In the following process, instead of dealing with the original signal, we only used
1Mi
� ��s and T M M�� �� in the construction of the compressive detector �t and calculation of
i� and iµ , leading to a fast classification.
E. Cross-Validation and Experiment DesignA cross validation method, Leave One Out (LOO)
[23], is widely used in evaluating the detection accuracy of different classes of subjects. It was employed here to evaluate the efficiency of feature selection and the performances of compressive detector.
To find the best LOO accuracy for each subtyping, we calculated the classification accuracyby LOO, based on from 5 to 200 IVs, in three cases:subtyping based on gene expression data, CNVs data and their combinations.
IV. RESULTS
The SRC approach was used to select different numbers of IVs, while the CS based classifier was employed to classify the subtypes of gliomas. Finally,the classification accuracy was calculated by the LOO method. Figure 2 plots the classification accuracies of O and G on the top level of the hierarchical structure for suptyping gliomas. Three results are compared in the Figure 2: classification accuracies calculated by CNVs data, by gene expression data and by the combination of the two types of data. The combined result was calculated by fixing the number of IVs from CNVs data as the one that achieves the highest accuracy and iterating the number of IVs from gene expression data from 5 to 200 genes. In this specific case, combined analysis doesn’t show any significant advantages compared to the gene expression analysis only.
Figure 2. The classification accuracies of O and G subtypes by using gene expression data only (circle) and the combined data (square), corresponding to different numbers of IVs from 5 to 200.For the CNVs data (star), the maximum number of IVs that can be reached is 30 due to the limitation of sample size. In this specific case, combined analysis doesn’t show any significant advantages compared to the gene expression analysis only.
285
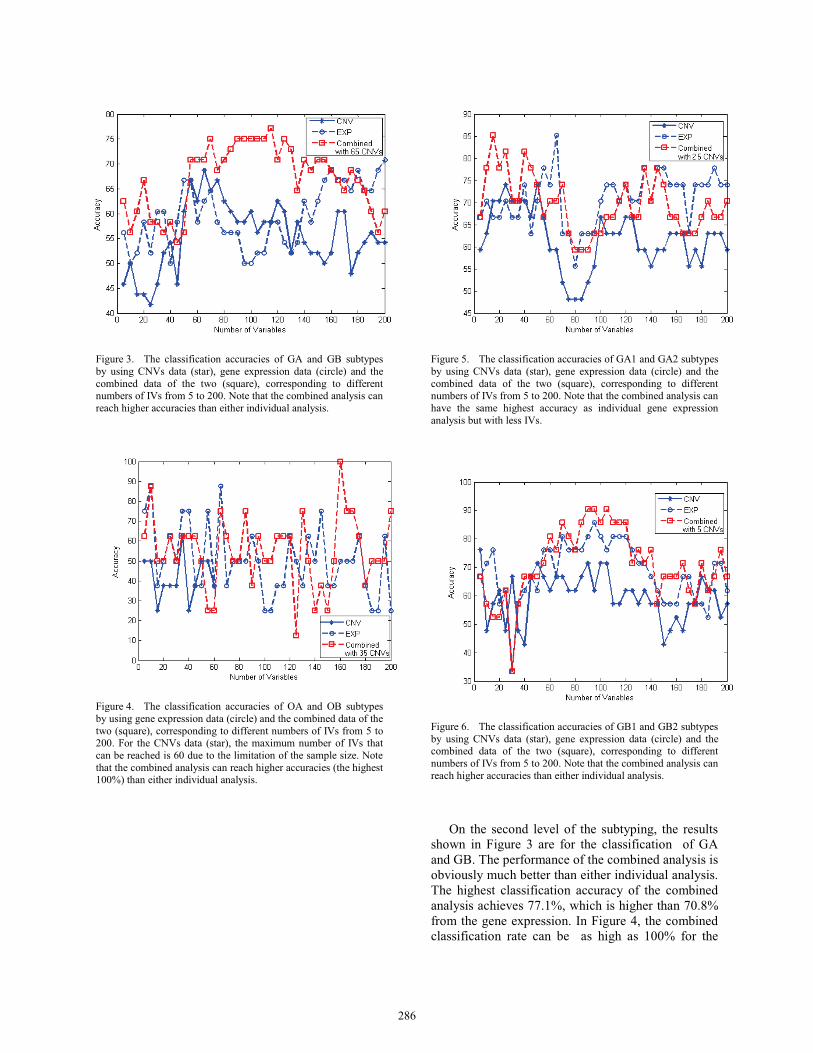
Figure 3. The classification accuracies of GA and GB subtypes by using CNVs data (star), gene expression data (circle) and the combined data of the two (square), corresponding to different numbers of IVs from 5 to 200. Note that the combined analysis can reach higher accuracies than either individual analysis.
Figure 4. The classification accuracies of OA and OB subtypes by using gene expression data (circle) and the combined data of the two (square), corresponding to different numbers of IVs from 5 to 200. For the CNVs data (star), the maximum number of IVs that can be reached is 60 due to the limitation of the sample size. Note that the combined analysis can reach higher accuracies (the highest 100%) than either individual analysis.
Figure 5. The classification accuracies of GA1 and GA2 subtypes by using CNVs data (star), gene expression data (circle) and the combined data of the two (square), corresponding to different numbers of IVs from 5 to 200. Note that the combined analysis can have the same highest accuracy as individual gene expression analysis but with less IVs.
Figure 6. The classification accuracies of GB1 and GB2 subtypesby using CNVs data (star), gene expression data (circle) and the combined data of the two (square), corresponding to different numbers of IVs from 5 to 200. Note that the combined analysis can reach higher accuracies than either individual analysis.
On the second level of the subtyping, the results shown in Figure 3 are for the classification of GA and GB. The performance of the combined analysis is obviously much better than either individual analysis.The highest classification accuracy of the combined analysis achieves 77.1%, which is higher than 70.8% from the gene expression. In Figure 4, the combined classification rate can be as high as 100% for the
286

subtyping of OA and OB compared to the highest classification rate of 87.5% from the gene expression data, individully.
On the bottom level, in Figure 5, it can be seen that the combined data analysis for clasifying GA1 and GA2 has the same highest classification rate, 85.2%, as the individual analysis of gene expressiondata, but with less IVs. The combined analysis used only 15 IVs to achieve the highest classification accuracy, 50 IVs less compared to the individual gene expression analysis. Figure 6 shows the comparison of the combined analysis and individual analysis for the classification of GB1 and GB2subtypes. It is shown that the combined analysis yields higher classification accuracy (90.5%) than either individual analysis, 81.0% for gene expression and 76.2% for CNVs.
It can be found that combined analysis performs better than either individual analysis in the classification of OA and OB, GA and GB, GB1 and GB2 in Figure 7. For the other two classification, O and G, GA1 and GA2, the combined method has comparable classification rate with the gene expression data analysis. The classification rate based on the CNVs data is the lowest.
Figure 7. The maximum classification accuracies for the five binary classifications. Note that the classification accuracy of using the CNVs data individual analysis is the worst; the accuracy using gene expression data individual analysis is better and the accuracy of using combined analysis is the best among the three cases.
V. CONCLUSION AND DISCUSSION
This paper proposed a CS based method to subtype gliomas by combining gene expression data and CNVs data from the same subject of patients.Experiments have been performed to compare the results of combined analysis with individual analysis.
The calculation results show that the combined analysis achieves a significant improvement of the classification accuracy than using the individual analysis except for the subtyping of O and G types of gliomas.
The sample size of the Oligodendroglioma-rich (O) is relatively small (4 OAs and 4 OBs). That could influence the reliability of the result. That is probably the reason why we cannot obtain improved accuracy classification of O and G, even with combined data analysis. It could also explain why the classification results in Figure 4 oscillate, with the accuracies up and down. Those problems could be avoided by increasing the sample size of O subtype.
In summary, the combined analysis method proposed in this work provides an improved way of subtyping gliomas than using an individual data. It has the potential to improve the diagnostic accuracy in the clinical practice.
ACKNOWLEDGMENT
This work has been supported by the NIH grant R21 LM010042 and NSF grant. The authors thank Dr. Aiguo Li and Dr. Howard A. Fine from National Cancer Institute for their great help.
REFERENCES
[1] C.B. Kingsley, W-L. Kuo, D. Polikoff, A. Berchuck, J.W. Gray, A.N. Jain, “Magellan: a web based system for the integrated analysis of heterogeneous biological data and annotations; application to DNA copy number and expression data in ovarian cancer”, Cancer Informatics, 2006, 2: pp.10-21.
[2] O.G. Troyanskaya, K. Dolinski, A.B. Owen, R.B. Altman, D. Botstein, “A bayesian framework for combining heterogeneous data sources for gene function prediction (in Saccharomyces cerevisiae)”, PNAS, 2003, 100(4): pp. 8348-8353.
[3] G.R.G. Lanckriet, T.D. Bie, N. Cristianini, M.I. Jordan, W. S. Noble, “A statistical framework for genomic data fusion”, Bioinformatics, 2004, 20(16): pp. 2626-2635.
[4] J.A. Berger, S. Hautaniemi, S.K. Mitra, and J. Astola, “Jointly analyzing gene expression and copy number data in breast cancer using data reduction models”, IEEE/ACM Transactions on Computational Biology and Bioinformatics,2006, 3(1): pp. 2-15.
[5] C. R. Farber, A. V. Nas, A. Ghazalpour, J. E. Aten, S. Doss, B. Sos, E.E. Schadt, L. Ingram-Drake, R.C. Davis, S. Horvath, D.J. Smith, T.A. Drake, and A.J. Lusis, “An Integrative Genetics Approach to Identify Candidate Genes Regulating BMD: Combining Linkage, Gene Expression,and Association”, J. of Bone and Mineral Research, 2009, 24(1): pp. 105-116.
[6] A.N. Mamelak, and D.B. Jacoby, "Targeted delivery of antitumoral therapy to glioma and other malignancies with synthetic chlorotoxin (TM-601)", Expert Opin Drug Deliv,2007 4 (2): pp. 175–86.
287

[7] A. Li, J. Walling, S. Ahn, Y. Kotliarov, Q. Su, M. Quezado,J.C. Oberholtzer, J. Park, J.C. Zenklusen, and H.A. Fine., “Unsupervised analysis of transcriptomic profiles reveals six glioma subtypes”, Cancer Res, 2009, 69(5) : pp. 2091-2099.
[8] K. Seungchan, E.R. Dougherty, I. Shmulevich, K.R. Hess, S.R. Hamilton, J.M. Trent, G.N. Fuller, and W. Zhang, “Identification of combination gene sets for glioma classification”, Molecular Cancer Therapeutics, 2002, 1: pp. 1229-1236.
[9] C.L. Nutt, D.R. Mani, R.A. Betensky, P. Tamayo, J. G. Cairncross, C. Ladd, U. Pohl, C. Hartmann, M.E. McLaughlin, T.T. Batchelor, P.M. Black, A.V. Deimling, S.L. Pomeroy, T.R. Golub, and D. N. Louis, “Gene Expression-based Classification of Malignant Gliomas Correlates Better with Survival than Histological Classification”, Cancer Research, 2003, 63: pp. 1602-1607.
[10] S. Chakraborty, B.K. Mallick, D. Ghosh, M. Ghosh, and E. Dougherty, “Gene Expression-Based Glioma Classification Using Hierarchical Bayesian Vector Machines”, The Indian Journal of Statistics: Special Issue on Statistics in Biology and Health Sciences, 2007, 69(3): pp. 514-547.
[11] H. Noushmehr, D.J. Weisenberger, K. Diefes, H.S. Phillips, K. Pujara, B. P. Berman, F. Pan, C.E. Pelloski, E.P. Sulman, K.P. Bhat, R.G.W. Verhaak, K.A. Hoadley, D.N. Hayes, C.M. Perou, H.K. Schmidt, L.Ding, R. K. Wilson, D. V. Den Berg, H. Shen, H. Bengtsson, P. Neuvial, L.M. Cope, J. Buckley, J.G. Herman, S.B. Baylin, P.W. Laird, K. Aldape, and The Cancer Genome Atlas Research Network, “Identification of a CpG Island Methylator Phenotype that Defines a Distinct Subgroup of Glioma”, Cancer Cell. 2010, 17: pp. 510-522.
[12] R.G.W. Verhaak, K.A. Hoadley, E. Purdom, V.Wang, Y. Qi, M,D. Wilkerson, C.R. Miller, L. Ding, T. Golub, J.P. Mesirov, G.Alexe, M. Lawrence, M.O’Kelly, P. Tamayo, B.A. Weir, S. Gabriel, W. Winckler, S. Gupta, L. Jakkula, H.S. Feiler, J. G. Hodgson, C.D. James, J.N. Sarkaria, C. Brennan, A. Kahn, P.T. Spellman, R.K. Wilson, T.P.Speed, J.W. Gray, M. Meyerson, G. Getz, C.M. Perou, D.N. Hayes, and The Cancer Genome Atlas Research Network, “Integrated Genomic Analysis Identifies Clinically Relevant Subtypes of Glioblastoma Characterized by Abnormalities in PDGFRA, IDH1, EGFR, and NF1”, Cancer Cell. 2010, 17: pp. 98-110.
[13] J-S. Guillamo, A. Monjour, L. Taillandier, B. Devaux, P. Varlet, C. Haie-Meder, G-L. Defer, P. Maison, J-J. Mazeron, P. Cornu, and J-Y., Delattre, “Brainstem gliomas in adults: prognostic factors and classification. Brain”, Brain, 2001, 124: pp. 2528-2539.
[14] M. Morris, R. Greiner, J. Sander, A. Murtha, and M. Schmidt, “Learning a classification-based glioma growth model using MRI data”, Journal of Computers, 2006, 1(7): pp. 21-31.
[15] H. Cao, and Y-P. Wang, “M-Fish image analysis with improived adaptive fuzzy C-Means clustering based segmentation and sparse representation classification,” 3rd
International Conference on Bioinformatics and Computational Biology (BICoB), New Orleans, Louisiana, USA, March 23-25, 2011, In press.
[16] H. Cao, and Y-P. Wang, “Integrated analysis of gene expression and copy number data using sparse representation based clustering model,” 3rd International Conference on Bioinformatics and Computational Biology (BICoB), New Orleans, Louisiana, USA, March 23-25, 2011, In press.
[17] W. Tang, H. Cao, J. Duan, Y-P. Wang, “A compressed sensing based approach for subtyping of leukemia from geneexpression data,” J. of Bioinformatics and Computational Biology, 2011; 9: 631-645. doi: 10.1142/S0219720011005689.
[18] R. Tibshirani, “Regression shrinkage and selection via the Lasso”, J. R. Statist. Soc. B, 1996, 58(1), pp. 267–288.
[19] D. L. Donoho and Y. Tsaig, “Fast solution of l1-norm minimization problems when the solution may be sparse”, IEEE Trans. Inf. Theory, 2008, 54(11), pp. 4789–4812.
[20] B. Efron, T. Hastie, I. Johnstone, and R. Tibshirani, “Least angle regression”, Annals Statist., 2004, 32(2), pp. 407–499.
[21] J. Wright, A.Y. Yang, A. Ganesh, S. S. Sastry, and Y. Ma. “Robust Face Recognition via Sparse Representation”, IEEE TRANS. PAMI, 2009, 31(2), pp. 210-227,
[22] M.A. Davenport, M.B. Wakin, and R.G. Baraniuk, “Detection and estimation with compressive measurements,” Technical Report, January 24, 2007.
[23] B. Efron and R. J. Tibshirani, An introduction to the bootstrap, Chapman and Hall, New York, 1993.
288