a comprehensive laboratory manual for environmental
TRANSCRIPT


Copyright © 2009, New Age International (P) Ltd., PublishersPublished by New Age International (P) Ltd., Publishers
All rights reserved.No part of this ebook may be reproduced in any form, by photostat, microfilm, xerography,or any other means, or incorporated into any information retrieval system, electronic ormechanical, without the written permission of the publisher. All inquiries should beemailed to [email protected]
ISBN (13) : 978-81-224-2951-0
PUBLISHING FOR ONE WORLD
NEW AGE INTERNATIONAL (P) LIMITED, PUBLISHERS4835/24, Ansari Road, Daryaganj, New Delhi - 110002Visit us at www.newagepublishers.com

The awareness on environmental matters is spreading fast and attained importance on global scale, which has ledto a better scope for a systematic study in Environmental Science and Engineering. In the last decade, a goodnumber of undergraduate and postgraduate courses in environmental science and engineering has come up inmost of the Universities in India, aiming at the tremendous employment potential in this area. In addition, theUniversity Grants Commission has made it mandatory that at least one paper on environmental studies should becompulsorily included in the syllabus of any basic degree course in the country. Most of the newly begunundergraduate and postgraduate courses in Environmental Science and Engineering have laboratory sessionsattached to it. Many students of these courses are missing the fundamentals necessary for conducting experimentsin this field due to the non-availability of a standard reference book.
This book is basically meant for students, consultants, researchers and voluntary activists engaged inEnvironmental Science and Engineering field, who would like to learn all the fundamental experiments necessaryfor them. The book is designed to be a comprehensive reference manual as well as a practical record book. Sincethe different Universities have different syllabi for the same subject, all the common experiments are discussedhere, so that students of any particular institution can resort to the selected experiments of their choice.
It is worth mentioning that digital meters are now available for most of the tests in this field. The difficulty withthese instruments are that they require very costly consumable and reagents, which are mostly proprietary. Inaddition, their accuracy cannot be confirmed without frequent calibration. Hence the validity of these experimentswill survive the test of time as cost-effective and popularly accepted ones. Moreover, any environmental scientist/engineer is supposed to know the fundamental principles of the experiment, before resorting to sophisticatedinstruments.
P. R. Sreemahadevan Pillai
PREFACE

This pageintentionally left
blank

Preface vGENERAL
I. Instructions 1II. DOs and DON’Ts in the Laboratory 1
III. General Information 2IV. Introduction 5
EXPERIMENTS
1. Determination of Solids in Water 72. Determination of Turbidity of Water 153. Determination of Alkalinity of Water 214. Determination of Hardness of Water by EDTA Titrimetric Method 275. Determination of pH of Water 316. Determination of Chloride in Water 357. Determination of Iron and Manganese in Water 398. Determination of Sulphate and Sulphide in Water 479. Jar Test for Determining Optimum Coagulant Dosage 55
10. Determination of Dissolved Oxygen in Water 5911. Determination of B.O.D. of Wastewater Sample 6312. Determination of Available Chlorine in Bleaching Powder 6913. Test for Residual Chlorine 7514. Test for Coliforms in Water 8315. Determination of Ammonia Nitrogen 9316. Determination of Nitrate Nitrogen 9917. Determination of Nitrite Nitrogen 103
CONTENTS

viii Contents
18. Determination of Kjeldahl Nitrogen 10719. Determination of Fluoride in Water 11120. Determination of Acidity of Water 11721. Determination of COD in Water 12122. Determination of Oil and Grease 12523. Determination of Odour 12924. Determination of Colour 133
APPENDICES
I. Preparation of Reagents and Media 137II. Standards for Drinking Water 143
III. MPN Table 144

GENERAL
I. Instructions
1. This laboratory manual is for reference and use for those using the environmental science/engineeringlaboratory.
2. Discussion after each experiment should be based on the following points:(i) Limit prescribed for that constituent in drinking water standards.(ii) The suitability of the sample for drinking purpose with respect to that particular constituent.
3. Users may refer the following for writing the discussion after each experiment:(i) “Standard Methods for the Examination of Water and Waste Water”, American Public Health
Association, 1015, 15th Street, N.W., Washington D.C., 2005.(ii) “Chemistry for Environmental Engineers”, Sawyer and McCarty, Tata Mc-Graw Hill.(iii) “Manual of Standards of Quality for Drinking Water Supplies”, Indian Council of Medical
Research, New Delhi.(iv) “International Standards for Drinking Water” — World Health Organisation.(v) “IS 2490 - 1981, IS 3306 - 1974, IS 3307 - 1977, IS 7968 - 1976, IS 2296 - 1974”, Bureau
of Indian Standards, New Delhi.
II. DOs and DON’Ts in the Laboratory
1. Do thoroughly clean the glassware before and after use.2. Do handle the glassware carefully.3. Do not handle chemicals with bare hands.4. Do not blow out the last drop from the pipette. When the liquid has drained out completely, touch the
tip of the pipette to the inner surface of the vessel.5. Do not add water to acids. Do always add acid to water.6. Do use large volumes of water, when a person is splashed with acid to prevent serious burns.7. Do weigh the articles in a balance only at room temperature.8. Do use different pipette for different reagents.

2 A Comprehensive Laboratory Manual for Environmental Science and Engineering
9. Do not pipette out acids and other toxic reagents by mouth.10. Do read the level of the curve (meniscus), in all volumetric glassware, with the eye at approximately the
same level as the curve of solution.
III. General Information
In water and wastewater analysis, the results are usually reported in terms of mg/L of some particular ion, elementor compound. It is most convenient to have the standard titrating agent of such strength, that 1mL is equivalent to1mg of material being measured. Thus 1 litre of the standard solution is usually equivalent to 1g of the standardsubstance.
NormalityThe desired normality of the titrant is obtained by the relationship of 1 to the equivalent weight of the measuredmaterial. Thus normality of acid solution to measure ammonia, ammonia nitrogen, and alkalinity as CaCO3
Ammonia — 1/eq. wt. = 1/17 = N/17 = 0.0588NAmmonia N — 1/eq. wt. = 1/14 = N/14 = 0.0715NAlkalinity — 1/eq. wt. = 1/50 = N/50 = 0.020NThe normality of basic solution to measure mineral acidity as CaCO3 is:Acidity — 1/eq. wt. = 1/50 = N/50 = 0.020NThe normality of silver nitrate to measure chloride and sodium chloride is:Chloride — 1/eq. wt. = 1/35.45 = N/35.45 = 0.0282NSodium chloride — 1/eq. wt. = 1/58.44 = N/58.44 = 0.071NThus the substance measured is calculated as follows:
=mL of titrant used 1,000 mg / L
mLof sample×
Most materials subjected to the analysis of water and wastewater fall in the realm of dilute solutions i.e., a few mgin a litre. So the results are normally expressed in mg/L or ppm. Parts per million (ppm) is a weight ratio; but mg/Lis a weight by volume ratio. The relationship is given as follows:
ppm = mg / LSp.gr.
If concentrations are less than 0.1 mg /L, express them in µg/L (micrograms per litre).If concentrations are more than 10,000 mg/L, they are expressed in percentages.
Plotting of GraphsRules listed by Worthing and Geffner are to be followed while plotting graphs. They are:
1. The independent and dependent variables should be plotted on abscissa and ordinate respectively.2. The scale should be so chosen that the value of either coordinate could be found quickly and easily.3. The curve should cover as much of the graph sheet as possible.4. The scales should be so chosen that the slope of the curve approach unity as nearly as possible.5. The variables should be chosen to give a plot that will be as nearly a straight line as possible.

General 3
2. Chemical substanceswhich may affect health
1. Toxic substances
Classification of ProceduresLaboratory analytical procedures are classified to quantify the chemical substances as follows:
1. Toxic chemical substances: e.g., lead, arsenic, selenium, hexavalent chromium, cyanide.2. Chemical substances affecting health: e.g., fluoride, nitrate.3. Chemical substances affecting potability: e.g., residue, turbidity, colour, taste and odour, iron, manganese,
copper, zinc, calcium, magnesium, sulphate, chloride, pH and phenolic compounds.4. Chemical substances indicative of pollution: e.g., total organic matter, BOD, Kjeldahl nitrogen (total
organic nitrogen), albuminoid nitrogen, nitrite nitrogen and phosphate.5. Residual chlorine.
Standards of Water QualityStandards of water quality are presented as follows:
Bacteriological Quality1. Treated water: In 90% of the samples examined throughout the year, the coliform bacteria shall not
be detected or the MPN index shall be less than 10. None of the samples shall have an MPN indexof coliform bacteria in excess of 10. An MPN index of 8–10 shall not occur in consecutive samples.
2. Untreated water: In 90% of the samples examined throughout the year, the MPN index of coliformorganisms should not be less than 10. None of the samples should show an MPN index greater than20. An MPN index of 15 or more should not be permitted in consecutive samples.
Chemical and Physical Quality
Classification Substances Maximum allowable concentration
Lead (Pb) 0.1 mg/L
Selenium (Se) 0.05 mg/L
Arsenic (As) 0.2 mg/L
Chromium (Cr6+) 0.05 mg/L
Cyanide (CN) 0.01 mg/L
Fluoride (F–) 0.08–1.0 mg/LNitrate –
3(NO ) 50.0 mg/L
Total solids 500 mg/L
Colour 5 Units
Turbidity 5 Units
Taste Unobjectionable
Odour Unobjectionable
Manganese (Mn) 0.1 mg/L
Contd...

4 A Comprehensive Laboratory Manual for Environmental Science and Engineering
Iron (Fe) 0.3 mg/L
Copper (Cu) 1.0 mg/L
Zinc (Zn) 5.0 mg/L
Calcium (Ca) 75 mg/L
Magnesium (Mg) 50 mg/LSulphate 200 mg/L
Chloride (Cl–) 200 mg/L
pH range 7.0–8.5
Phenolic substances 0.001mg/L
Significance and Determination of Chemical ParametersChemical parameters and their significance are presented as follows. The methods of the analysis adopted are alsopresented. However, only simple methods will be dealt within this manual.
Chemical parameters commonly determined in natural waters and water supplies
No. Chemical species Significance in water Methods of analysiscommonly used
1. Acidity Indicative of industrial Titrationpollution, acid mine drainage
2. Alkalinity Water treatment, buffering, Titrationalgal productivity
3. Ammonia Productivity, pollution Colorimetry
4. Calcium Hardness, productivity Atomic absorptiontreatment
5. Carbon dioxide Bacterial action, corrosion Titration, calculation
6. Chloride Saline water contamination Titration, potentiometry
7. Chlorine Water treatment Colorimetry, titration
8. Fluoride Water treatment, toxic at Colorimetry, potentiometryhigh level
9. Hardness Water quality, treatment Titration, atomic absorption
10. Iron Water quality, treatment Colorimetry, atomicabsorption
11. Magnesium Hardness Atomic absorption
12. Manganese Water quality Atomic absorption
13. Nitrate Productivity, toxicity Colorimetry, potentiometry
14. Nitrite Toxic, pollutant Colorimetry
3. Chemical substancesaffecting the potability ofwater
Contd...

General 5
15. Nitrogen (albumin.) Proteinaceous material Colorimetry
16. Nitrogen (organic) Organic pollution Colorimetry
17. Oxygen Water quality Titration, electrochemical
18. BOD Water quality, pollution Microbiological titration
19. COD Water quality, pollution Chemical oxidation-reduction
20. pH Water quality, pollution Potentiometry
21. Phosphate Water quality, pollution Colorimetry
22. Sulphate Water quality, pollution Gravimetry, turbidimetry
23. Sulphide Water quality, pollution Colorimetry, potentiometrictitration
IV. Introduction
Humanity and EnvironmentA characteristic, which has set Homo sapiens apart from other species, has been their ability to control manyaspects of their environment. Throughout recorded history people have continually struggled to manage theirnatural environment in order to improve their health and well-being. In recent years environmental sanitation inmany parts of the world has led to large reduction or virtual elimination of diseases spread via the environment.Continuous environmental vigilance is necessary to keep away these weeds from the garden of humanity fromincreasing out of proportion among a large part of the earth’s population.
People’s success in the control of environmental borne diseases has not reduced the need for ever-increasedefforts of effective management of the total environment. The population explosion, an affluent society with desiresfor a vast array of products, increased radiations, greater energy use, increased food production needs, and otherdevelopments have created strains on parts of the ecological systems. Perhaps never in history have peopledemonstrated such great concern for their total environment as is now being witnessed in many parts of the earth,particularly in those areas which have benefited most from people’s environmental control efforts toward effectiveuse of human, material and natural resources. Over the years, intensification of old problems and the introductionof new ones have led to basic changes in the philosophy of environmental engineering practice.
Water is one of the materials required to sustain life and has long been suspected of being the source of manyof the illnesses of man. It was not until a little over 100 years ago that definite proof of disease transmission throughwater was established. Originally the major objectives were to produce hygienically safe water supplies and todispose off wastes in a manner that would prevent the development of nuisance conditions. Many other factorsconcerned with aesthetics, economics, recreation and other elements of better living are important considerationsand have become part of the responsibilities of the modern environmental engineer.
The public has been more exacting in their demands as time has passed, and today water engineers areexpected to produce finished waters that are free of colour, turbidity, taste, odour and harmful metal ions. Inaddition, the public desires water, which is low in hardness and total solids, non-corrosive, and non-scale forming.To meet with such stringent standards, chemists, biologists and engineers must combine their efforts and talentstogether and hence the need for analytical testing of water and waste becomes necessary.

6 A Comprehensive Laboratory Manual for Environmental Science and Engineering
Importance of Quantitative AnalysisQuantitative analysis serves as the keystone of engineering practice. Environmental engineering is perhaps mostdemanding in this respect, for it requires the use of not only the conventional measuring devices employed byengineers but, in addition many of the techniques and methods of measurement used by chemists, physicists andsome of those used by biologists.
Every problem in environmental engineering must be approached initially in a manner that will define the problem.This approach necessitates the use of analytical methods and procedures in the field and laboratory, which haveproved to yield reliable results. Once the problem has been defined quantitatively, the engineer is usually in aposition to design facilities that will provide a satisfactory solution.
After construction of the facilities has been completed and they have been placed in operation, usually constantsupervision employing quantitative procedure is required to maintain economical and satisfactory performance.The increase in population density and new developments in industrial technology are constantly intensifying oldproblems and creating new ones. In addition, engineers are forever seeking more economical methods of solvingold problems. Research is continuously under way to find answers to the new problems and better answers to oldones. Quantitative analysis will continue to serve as the basis for such studies.
Character of ProblemsMost problems in environmental engineering practice involve relationships between living organisms and theirenvironment. Because of this, the analytical procedures needed to obtain quantitative information are in often astrange mixture of chemical and biochemical methods, and interpretation of the data is usually related to the effecton microorganisms or human beings. Also, many of the determination used fall into the realm of microanalysisbecause of the small amounts of contaminants present in the samples. Ordinarily, the amounts determined are a fewmilligrams per litre and often they are found only in few micrograms.
Standard Methods of AnalysisConcurrent with the evaluation of environmental engineering practice, analytical methods have been developed toobtain the factual information required for the resolution and solution of problems. In many cases different methodshave been proposed for the same determination, and many of them were modified in some manner. As a result,analytical data obtained by analysis were often in disagreement.
In an attempt to bring order out of chaos, the American Public Health Association appointed a committee tostudy the various analytical methods available and published the recommendation of the committee as “StandardMethods of Water Analysis” in 1905.
“Standard Methods” as published today is the product of the untiring effort of hundreds of individuals whoserve on committees, testing and improving analytical procedures for the purpose of selecting those best suited forinclusion in “Standard Methods”, which is now available as “Standard methods for the examination of water andwaste water”.

Aim
The aim of the experiments is to determine the following types of solids in the given sample(s):(a) Total solids(b) Total (inorganic) fixed solids(c) Total volatile (organic) solids(d) Total dissolved solids(e) Dissolved fixed (inorganic) solids(f) Dissolved volatile (organic) solids(g) Total suspended solids(h) Suspended fixed (inorganic) solids(i) Suspended volatile (organic) solids(j) Settleable solids
Principle
‘Total solids’ is the term applied to the material left in the vessel after evaporation of a sample of water/waste waterand its subsequent drying in an oven at a definite temperature. Total solids include “total suspended solids” theportion of total solids retained by a filter and “total dissolved solids” the portion that passes through the filter. Fixedsolids is the residue remaining after ignition for 1 hour at 550°C. The solid portion that is volatilised during ignitionis called volatile solids. It will be mostly organic matter. Waters that are low in organic matter and total mineralcontent and are intended for human consumption may be examined under 103–105°C or 179–181°C. But watercontaining considerable organic matter or those with pH over 9.0 should be dried at 179–181°C. In any case, thereport should indicate the drying temperature.
The sample is filtered and the filtrate evaporate in a weighed dish on a steam bath, the residue left afterevaporation is dried to constant weight in an oven at either 103–105°C or 179–181°C. The increase in weightover that of the empty dish represents total dissolved solids and includes all materials, liquid or solid, in solution orotherwise, which passes through the filter and not volatilised during the drying process.
DETERMINATION OF SOLIDS
Experiment No. ___________________ Date ___________________

8 A Comprehensive Laboratory Manual for Environmental Science and Engineering
The difference between the total solids and the total dissolved solids will give the total suspended solids. Thedishes with the residue retained after completion of the tests for total solids and total dissolved solids are subjectedto heat for 1 hour in a muffle furnace held at 550°C. The increase in weight over that of the ignited empty vesselrepresents fixed solids in each instance.
The difference between the total dissolved/total suspended solids and the corresponding fixed solids will givevolatile solids in each instance. All the quantities should be expressed in mg/L. Settleable matter in surface andsaline waters as well as domestic and industrial wastes may be determined and reported on a volume basis asmillilitre per litre.
Apparatus1. Porcelain evaporating dishes of 150–200 mL capacity2. Steam bath3. Drying oven4. Desiccators5. Analytical balance or monopan balance6. Filter paper (preferably of glass fibre)7. Electric muffle furnace8. Imhoff cone
Procedure(a) Total solids
1. Ignite the clean evaporating dishes in the muffle furnace for 30 minutes at 550°C and cool in adesiccator.
2. Note down the empty weight of the dish (W1).3. Pour a measured portion (50 to 100 mL) of the well-mixed sample into the dish and evaporate
the contents by placing the dish on a steam bath.4. Transfer the dish to an oven maintained at either 103–105°C or 179–181°C and dry it for 1 hour.5. Allow the dish to cool briefly in air before placing it, while still warm in a desiccator to complete
cooling in a dry atmosphere.6. Weigh the dish as soon as it has completely cooled (W2).7. Weight of residue = (W2 – W1) mg.
W2 and W1 should be expressed in mg.(b) Total fixed solids
1. Keep the same dish used for determining total residue in a muffle furnace for 1 hour at 550°C.2. Allow the dish to partially cool in air until most of the heat has dissipated, then transfer to a desiccator
for final cooling in a dry atmosphere.3. Weigh the dish as soon as it has cooled (W3).4. Weight of total fixed residue = (W3 – W1) mg.
W3 and W1 should be expressed in mg.

Determination of Solids 9
(c) Total dissolved solids1. Filter a measured portion of the mixed sample (50 or 100 mL) through a filter paper and collect
the filtrate in a previously prepared and weighed evaporating dish.2. Repeat the steps 3 to 6 outlined in total solids procedure.3. Weight of dissolved solids = (W5 – W4) mg.
W4 = Weight of empty evaporating dish in mg.W5 = Weight of empty evaporating dish in mg + Residue left after evaporating the filtrate in mg.
(d) Total suspended solids = Total solids – Total dissolved solids.(e) Total volatile solids = Total solids – Total fixed solids.(f) Fixed dissolved solids
1. Keep the same evaporating dish used in determining total dissolved solids in a muffle furnace for1 hour at 550°C.
2. Repeat the steps 2 and 3 outlined in total fixed solids procedure.3. Weight of fixed dissolved solids = (W6 – W4) mg.
W6 = Weight of empty evaporating dish + Fixed solids left after ignition at 550°C.(g) Volatile dissolved solids = Total dissolved solids – Fixed dissolved solids.(h) Fixed suspended solids = Total fixed solids – Fixed dissolved solids.(i) Volatile suspended solids = Total volatile solids – Volatile dissolved solids.(j) Settleable solids by volume
1. Fill an imhoff cone to the litre mark with a thoroughly mixed sample.2. Settle for 45 minutes.3. Gently stir the sides of the cone with a rod or by spinning.4. Settle 15 minutes longer.5. Record the volume of settleable matter in the cone as mL/L.
Observation
Sl. Item Sample Sample Sampleno. I II III
1. Volume of sample taken
2. Wt. of empty evaporating dish = W1 mg(For total dissolved solids)
3. Wt. of dish + total solids = W2 mg
4. Total solids = (W2 – W1) mg
5. Wt. of dish + fixed solids = W3 in mg
6. Fixed solids in mg = (W3 – W1)
Contd...

10 A Comprehensive Laboratory Manual for Environmental Science and Engineering
7. Wt. of empty evaporating dish = W4 mg(For total dissolved solids)
8. Wt. of dish + total dissolved solids = W5 mg
9. Total dissolved solids = (W5 – W4) mg
10. Wt. of dish + fixed dissolved solids = W6 mg
11. Fixed dissolved solids = (W6 – W4) mg
12. Total solids in mg/L
13. Total fixed solids in mg/L
14. Total dissolved solids in mg/L
15. Total suspended solids in mg/L
16. Total volatile solids in mg/L
17. Fixed dissolved solids in mg/L
18. Volatile dissolved solids in mg/L
19. Fixed suspended solids in mg/L
20. Volatile suspended solids in mg/L
21. Settleable solids in mg/L
Calculation
1. mg/L total solids = mg total solids × 1000
mL of sample
2. mg/L total fixed solids = mg total fixed solids × 1000
mL of sample
3. mg/L total dissolved solids = mg of total dissolved solids ×1000
mL of sample
4. mg/L total suspended solids = mg/L of total solids – mg/L of total dissolved solids5. mg/L total volatile solids = mg/L of total solids – mg/L of total fixed solids
6. mg/L fixed dissolved solids = mg fixed dissolved solids ×1000
mL of sample
7. mg/L volatile dissolved solids = mg/L total dissolved solids – mg/L of fixed dissolved solids8. mg/L fixed suspended solids = mg/L total fixed solids – mg/L fixed dissolved solids9. mg/L volatile suspended solids= mg/L total volatile solids – mg/L volatile dissolved solids
Note: These calculations need to be shown only for one sample.

Determination of Solids 11
Results
Sl. Items Sample Sample Sampleno. I II III
1. mg/L of total solids
2. mg/L of total fixed solids
3. mg/L of total dissolved solids
4. mg/L of total suspended solids
5. mg/L of total volatile solids
6. mg/L of fixed dissolved solids
7. mg/L of volatile dissolved solids
8. mg/L of fixed suspended solids
9. mg/L of volatile suspended solids
10. mg/L of settleable solids
Discussion

12 A Comprehensive Laboratory Manual for Environmental Science and Engineering
Questions
1. What is the application of determination of settleable solids?2. Explain the significance of determination of total solids in sanitary engineering.3. How will the volatile solids affect the strength of sewage? Why?4. Why do you determine the fixed solids by igniting at 600°C? How will the result be affected, if it has
magnesium carbonate content?5. What significant information is furnished by the determination of volatile solids?6. What is sludge volume index?

Determination of Solids 13

14 A Comprehensive Laboratory Manual for Environmental Science and Engineering

AimTo determine the turbidity of the given sample using Nephelometer in NTU.
Principle
The method presented below is based on a comparison of the intensity of light scattered by the sample in specificconditions with the intensity of light scattered by standard reference suspension under the same condition. Thehigher the intensity of scattered lights, higher the turbidity. Formazine polymer, which has gained acceptance as theturbidity standard reference suspension is used as a reference turbidity standard suspension for water. It is easy toprepare and is more reproducible in its lights scattering properties than the clay or turbid natural water standardspreviously used. The turbidity of a given concentration of formazine has an approximate turbidity of 100 NTU,when measured on candle turbidity meter. Nephelometric turbidity units based on formazine preparation will haveapproximate units derived from Jackson candle turbidimeter but will not be identical to them.
Apparatus
Nephelometer with accessories
Reagents
(i) Turbidity free distilled water (for setting zero).(ii) Formazine turbidity concentrate (hydrazine sulphate + hexamine).(iii) Formazine standard (for setting 100 of the instrument).
Preparation of Turbidity Free Distilled Water
Pass distilled water through a membrane filter having a precision pore size of less than 10 microns (Whatman filterNo. 42). Rinse collecting flask atleast twice with such filtered water and discard the next 200 mL. Use this filteredwater for setting zero of the instrument.
TURBIDITY
Experiment No. ___________________ Date ___________________

16 A Comprehensive Laboratory Manual for Environmental Science and Engineering
Preparation of Formazine Turbidity Concentrate(a) Solution I
Weigh accurately 5 g of ‘Anal–R’ quality hydrazine sulphate (NH2)2H2SO4 into a 500 mL volumetricflask and add distilled water to make up to the mark. Leave the mixture to stand for 4 hours.
(b) Solution IIWeigh accurately 50g of ‘Anal–R’ quality hexamethylene tetramine (CH2)6N4 (hexamine) into a 500 mLvolumetric flask and add distilled water to make up to the mark.Mix equal volume of solution I and II to form formazine turbidity concentrate. Allow it to stand in aclosed container at 25°C to 30°C for 48 hours to produce insoluble white turbidity corresponding to4000 NTU.
Note: Once prepared, formazine turbidity concentrate (which corresponds to 10000 ppm SiO2) is stable for 2 to 3 months.
Preparation of Formazine Standard
Dilute 25mL of the formazine turbidity concentrate to 1 litre with turbidity free distilled water to obtain 250 ppm or100 NTU for setting ‘100’ of the instrument.Note: Formazine standard 100 NTU should be prepared weekly.
Procedure(1) Switch the instrument on.(2) Open the lid of the sample compartment.(3) Insert a test tube filled with distilled water into the sample compartment. Close the lid.(4) Adjust ‘SET 0’ control to get ‘0’ displayed on the read out.(5) Open the lid. Replace the test tube filled with distilled water with a test tube filled with formazine standard.
Close the lid.(6) Adjust the ‘SET 100’ control to get ‘100’ displayed on the read out.(7) Repeat the above operation to get consistent values of 0 to 100 within 1% to 2%.
Measurement of turbidity less than 100 NTU1. Thoroughly shake the sample.2. Wait until air bubbles disappear and pour the sample into the nephelometer tube.3. Read the turbidity directly from the instrument.
Measurement of turbidity above 100 NTU
Dilute the sample with one or more volume of turbidity free distilled water until the turbidity fall below 100 NTU.
NTU of sample = A(B + C)
Cwhere,
A = NTU found in diluted sampleB = volume of dilution water in mLC = sample volume taken for dilution in mL

Turbidity 17
Observation
0 –100 NTU >100 NTUSample no. NTU A B C NTU = A(B+C)/C
mL mL mL
Results
Description of sample Turbidity in NTU
Discussion

18 A Comprehensive Laboratory Manual for Environmental Science and Engineering
Questions
1. Where do you find the adverse effects of turbidity in environmental engineering? Mention two instances.2. Discuss the significance of determination of turbidity in sanitary engineering.3. Discuss the nature of materials causing turbidity in
(a) River water during flash flood(b) Polluted river water(c) Domestic wastewater
4. What is the standard unit of turbidity?5. What are NTU and JTU?

Turbidity 19

20 A Comprehensive Laboratory Manual for Environmental Science and Engineering
Aim
To determine the amount of the following types of alkalinity present in the given samples:(a) Hydroxide alkalinity(b) Carbonate alkalinity(c) Bicarbonate alkalinity(d) Hydroxide–Carbonate alkalinity(e) Carbonate–Bicarbonate alkalinity
Principle
The alkalinity of water is a measure of its capacity to neutralize acids. It is primarily due to salts of weak acids,although weak or strong bases may also contribute. Alkalinity is usually imparted by bicarbonate, carbonate andhydroxide. It is measured volumetrically by titration with 0.02 N sulphuric acid and is reported in terms of CaCO3equivalent. For samples whose initial pH is above 8.3, the titration is conducted in two steps. In the first step, thetitration is conducted until the pH is lowered to 8.2, the point at which phenolphthalein indicator turns from pink tocolourless. This value corresponds to the points for conversion of carbonate to bicarbonate ion. The second phaseof titration is conducted until the pH is lowered to 4.5, corresponds to methyl orange end point, which correspondsto the equivalence points for the conversion of bicarbonate ion to carbonic acid.
Apparatus
1. Burette 2. Erlenmeyer flask 3. Pipettes
Reagents1. Carbon dioxide free distilled water.2. Phenolphthalein indicator.3. Methyl orange indicator.4. 0.1 N sodium thiosulphate solution5. 0.02 N sulphuric acid.
DETERMINATION OF ALKALINITY
Experiment No. ___________________ Date ___________________

22 A Comprehensive Laboratory Manual for Environmental Science and Engineering
Procedure
1. Pipette 50 mL of sample into a clean Erlenmeyer flask (V).2. Add one drop of sodium thiosulphate solution, if residual chlorine is present.3. Add two drops of phenolphthalein indicator; if the pH is above 8.3, colour of solution becomes pink.4. Titrate against standard sulphuric acid in the burette, till the colour just disappears. Note down the volume
(V1).5. Then add two drops of methyl orange indicator, the colour turns yellow.6. Again titrate against acid, until the colour turns to orange yellow. Note down the total volume (V2).
Graphical Representation of Titration of Samples Containing Various Forms of Alkalinity
10
Carbonate alkalinity
Bicarbonate alkalinity
OH + CO3
OH
CO3 CO3 + HCO3
Phenolphthalein end point
Methyl orange end point
HCO3
4.5 Methyl orange end point
8.3 Phenolphthalein end point
pH 11
Hydroxide alkalinity

Determination of Alkalinity 23
Observation
0.02 N H2SO4 × sample (Methyl orange/phenolphthalein indicator)
Description Trial Burette reading Volume Burette reading Volumeof sample no. (phenolphthalein of acid (methyl orange of acid
indicator) used V1 indicator) used V2
Initial Final Initial Final
Calculation
1. Phenolphthalein alkalinity (P) as mg/L CaCO3 =1V × 1000
mL of sample
2. Total alkalinity (T) as mg/L CaCO3 = 2V × 1000mL of sample
The types of alkalinities present in the samples are calculated using the equations given in the following tableand the results are tabulated.
Result of Hydroxide Carbonate Bicarbonatetitration alkalinity alkalinity alkalinity
as CaCO3 as CaCO3 as CaCO3
P = O O O T
P < ½T O 2P T – 2P
P = ½T O 2P O
P > ½T 2P – T 2 (T – P) O
P = T T O O

24 A Comprehensive Laboratory Manual for Environmental Science and Engineering
Results
Description Hydroxide Carbonate Bicarbonate Hydroxide Carbonateof alkalinity as alkalinity as alkalinity as carbonate bicarbonatesample CaCO3 in mg/L CaCO3 in mg/L CaCO3 in mg/L alkalinity as alkalinity as
CaCO3 in mg/l CaCO3 in mg/L
Discussion
Questions
1. Which is the major form of alkalinity? How is it formed?2. What is excess alkalinity? How do you express it?3. Why do we take 0.02 N H2SO4 for the titration?4. The water where algae are flourishing is alkaline. Why? Will there be diurnal variation in pH?5. Why does the pH change on aerating the water?6. For efficient coagulation the water must be alkaline. Why?7. Why do we use CO2 free distilled water for analysis?

Determination of Alkalinity 25

26 A Comprehensive Laboratory Manual for Environmental Science and Engineering

Aim
To determine the total hardness of the given samples by EDTA titrimetric method.
Principle
Originally, the hardness of water was understood to be a measure of the capacity of water for precipitating soap.Soap is precipitated chiefly by the calcium and magnesium ions commonly present in water, but may also beprecipitated by ions of other polyvalent metals, such as aluminium, iron, manganese, strontium and zinc, and byhydrogen ions. Because, all but the first two are usually present in insignificant concentrations in natural waters,hardness is defined as a characteristic of water, which represents the total concentration of just the calcium and themagnesium ions expressed as calcium carbonate. However, if present in significant amounts, other hardness producingmetallic ions should be included.
When the hardness is numerically greater than the sum of the carbonate alkalinity and the bicarbonate alkalinity,the amount of hardness, which is equivalent to the total alkalinity, is called carbonate hardness; the amount ofhardness in excess of this is called non-carbonate hardness. When the hardness is numerically equal to or lessthan the sum of carbonate and bicarbonate alkalinity all of the hardness is carbonate hardness and there is no non-carbonate hardness. The hardness may range from zero to hundreds of milligrams per litre in terms of calciumcarbonate, depending on the source and treatment to which the water has been subjected.
Ethylenediamine tetra-acetic acid and its sodium salts (EDTA) form a chelated soluble complex when added toa solution of certain metal cations. If a small amount of a dye such as Eriochrome black T is added to an aqueoussolution containing calcium and magnesium ions at a pH of 10 ± 0.1, the solution will become wine red. If EDTA isthen added as a titrant, the calcium and magnesium will be complexed. After sufficient EDTA has been added tocomplex all the magnesium and calcium, the solution will turn from wine red to blue. This is the end point of thetitration.
Apparatus
1. Burette 2. Pipette3. Erlenmeyer flask 4. Bottle etc.
DETERMINATION OF HARDNESS
Experiment No. ___________________ Date ___________________

28 A Comprehensive Laboratory Manual for Environmental Science and Engineering
Reagents1. Standard EDTA titrant (0.01 M)2. Eriochrome black T indicator3. Ammonia buffer solution
Procedure
1. Dilute 25 mL of sample (V) to about 50 mL with distilled water in an Erlenmeyer flask.2. Add 1 mL of buffer solution.3. Add two drops of indicator solution. The solution turns wine red in colour.4. Add the standard EDTA titrant slowly with continuous stirring until the last reddish tinge disappears from
the solution. The colour of the solution at the end point is blue under normal conditions.5. Note down the volume of EDTA added (V1).
Observation
Sample Trial Volume of Burette reading Volume of EDTA no. no. sample (mL) Initial Final (mL)
Calculation
Hardness as CaCO3 = 1V ×S×1000 mg/LV
where, S = mg CaCO3 equivalent to 1 mL of EDTA titrant
= 1 mg CaCO3
Hardness as CaCO3 = 11000 VV = ...… mg/L

Determination of Hardness 29
Results
Sample no. or description Total hardness in mg/L as CaCO3
Discussion
Questions
1. What is degree of hardness? How will you classify water in terms of degree of hardness?2. What is pseudo-hardness?3. Explain the significance of determination of hardness of water in environmental engineering.4. How can you remove permanent hardness from water?5. Can you determine temporary hardness and permanent hardness separately? If yes, how?6. What are the principal cations causing hardness in water and the major anions associated with them?7. How is hardness classified?8. Why is softening of water necessary? What are the advantages of soft water?

30 A Comprehensive Laboratory Manual for Environmental Science and Engineering

Aim
To determine the pH of given samples using (1) universal indicator (2) pH paper, and (3) digital pH meter.
Principle
pH value of water indicates the hydrogen ion concentration in water and concept of pH was put forward bySorenson (1909). pH is expressed as the logarithm of the reciprocal of the hydrogen ion concentration in moles/litre at a given temperature. The pH scale extends from 0 (very acidic) to 14 (very alkaline) with 7 correspondingto exact neutrality at 25°C. pH is used in the calculation of carbonate, bicarbonate and CO2, corrosion and stabilityindex etc. While the alkalinity or acidity measures the total resistance to the pH change or buffering capacity, thepH gives the hydrogen ion activity. pH can be measured colorimetrically or electrometrically. Colorimetric methodis used only for rough estimation. It can be done either by using universal indicator or by using pH paper. Thehydrogen electrode is the absolute standard for the measurement of pH. They range from portable battery operatedunits to highly precise instruments. But glass electrode is less subjected to interferences and is used in combinationwith a calomel reference electrode. This system is based on the fact that a change of 1 pH unit produces an electriccharge of 59.1 mV at 25°C.
Apparatus
1. pH meter with electrode 2. Beaker 3. Thermometer4. Colour comparator with discs 5. Cuvettes
Reagents
1. Buffer solutions 2. pH paper 3. Universal indicator
Procedure(a) Using Universal Indicator
1. 10 mL of sample is taken in a cuvette.
DETERMINATION OF pH
Experiment No. ___________________ Date ___________________

32 A Comprehensive Laboratory Manual for Environmental Science and Engineering
2. Another 10 mL sample is taken in another cuvette and 0.2 mL of universal indicator is added andplaced in the hole provided for.
3. A colour disc corresponding to this indicator is inserted into the comparator and the disc rotatedsuch that the 2 circles indicate identical colours.
4. The reading is noted.5. The procedure can be repeated using an indicator whose range is near the value obtained.6. The exact pH is obtained.
(If comparators are not available, compare the colour with colours given in the chart.)(b) Using pH Papers
1. Dip the pH paper in the sample.2. Compare the colour with that of the colour given on the wrapper of the pH paper book.3. Note down the pH of the sample along with its temperature.
(c) Using pH Meter1. Follow the manufacturer’s operating instructions.2. Dip the electrode in the buffer solution of known pH.3. Switch on the power supply and take the reading. Standardize the instrument using the calibrating
knob.4. After cleaning, again dip the electrodes in the buffer solution of pH 7. Note the reading. If it is
7, the instrument is calibrated. If not, correct the value and is manipulated so that the reading inthe dial comes to 7.0.
5. A solution whose pH is to be found is taken in a beaker and the temperature knob is adjustedsuch that the temperature of solution is same as that in dial.
6. The electrode is washed with distilled water and reused with the solution and then it is dipped inthe solution.
7. The reading on the dial indicates the pH of the solution.
Results
pH
pH paper pH meter Universal indicator
1
2
3
Sample no.

Determination of pH 33
Discussion
Questions
1. Discuss the relationship between (a) pH and hydrogen ion concentration (b) pH and hydroxide ionconcentration?
2. A decrease in pH of 1 unit represents how much of an increase in hydrogen ion concentration?3. Why is it necessary to maintain the pH of water nearly 7?4. What is a buffer solution? Give examples.

34 A Comprehensive Laboratory Manual for Environmental Science and Engineering

Aim
To determine the amount of chloride (in the form of Cl–) present in the given water sample by Mohr’s method.
Principle
If water containing chlorides is titrated with silver nitrate solution, chlorides are precipitated as white silver chloride.Potassium chromate is used as indicator, which supplies chromate ions. As the concentration of chloride ionsapproaches extinction, silver ion concentration increases to a level at which reddish brown precipitate of silverchromate is formed indicating the end point.
Apparatus
1. Burette2. Pipettes3. Erlenmeyer flasks4. Measuring cylinder
Reagents1. Chloride free distilled water.2. Standard silver nitrate solution (0.0141N)3. Potassium chromate indicator.4. Acid or alkali for adjusting pH.
Procedure
1. Take 50mL of sample (V) and dilute to 100mL.2. If the sample is coloured add 3mL of aluminium hydroxide, shake well; allow to settle, filter, wash and
collect filtrate.3. Sample is brought to pH 7–8 by adding acid or alkali as required.4. Add 1mL of indicator (Potassium chromate).
DETERMINATION OF CHLORIDE
Experiment No. ___________________ Date ___________________

36 A Comprehensive Laboratory Manual for Environmental Science and Engineering
5. Titrate the solution against standard silver nitrate solution until a reddish brown precipitate is obtained.Note down the volume (V1).
6. Repeat the procedure for blank and note down the volume (V2).
Observation
Water sample vs Silver nitrate (0.0141 N)(Potassium chromate indicator)
Sample Trial Volume Volume of Chlorideno. no. of sample Initial Final silver nitrate mg/L
(mL) (mL)
(Specimen calculation:) for one sample (Sample No. …...)V =V1 =V2 =N =
Chloride in mg/L = 1 2(V – V ) × N × 35.46 × 1000V
= 1 2(V – V ) × 500 ......... mg / LV
=
1
2
3
1
2
3
1
2
3
1
2
3
1
2
3
DistilledWater
Burette reading

Determination of Chloride 37
Results
Description of sample Chloride concentration in mg/L
Discussion
Questions
1. Explain the significance of high chloride in water.2. What are the sources of chloride in water?3. Explain the need for blank correction.4. Why must be the sample pH neither high nor low?5. Why the normality of silver nitrate solution is taken as zero?6. Would the analytical result by Mohr’s method for chlorides be higher, lower, or the same as the true
value if an excess indicator were accidentally added to the sample? Why?7. What are the methods of determination of chlorides?8. Why do the water has lower content of salt than sewage?

38 A Comprehensive Laboratory Manual for Environmental Science and Engineering

A. DETERMINATION OF IRON
Aim
To determine the quantity of iron present in the given sample of water.
Principle
Iron is usually present in natural water and is not objectionable, if concentration is less than 0.3 ppm. It may be intrue solution in colloidal state that may be peptized by organic matter, in the inorganic and organic iron complexes,or in relatively coarse suspended particles. It may be either ferrous or ferric, suspended or filterable. Iron exists insoils and minerals mainly as insoluble ferric oxide and iron sulphide (pyrite). It occurs in some areas, also as ferrouscarbonate (siderite), which is very slightly soluble.
The phenanthroline method is the preferred standard procedure for the measurement of iron in water exceptwhen phosphate or heavy metal interferences are present. The method depends upon the fact that 1,10-phenanthroline combine with Fe++ to form an orange-red complex. Its colour conforms to Beer’s law and isreadily measured by visual or photometric comparison. Small concentration of iron can be most satisfactorilydetermined by colorimetric analysis. It is also based on Beer’s law. By measuring the intensities of transmitted andincident light through a coloured solution and knowing its optical density or transmission, we can prepare a calibrationcurve and subsequent concentration can be read.
Phenanthroline Method
Apparatus1. Colorimetric equipment; one of the following is required:
(a) Spectrophotometer, for use at 510 nm, providing a light path of 1 cm or longer.(b) Nessler tubes, matched, 100 mL, tall form.
2. Glassware like conical flasks, pipettes and glass beads.
DETERMINATION OF IRON AND MANGANESE
Experiment No. ___________________ Date ___________________

40 A Comprehensive Laboratory Manual for Environmental Science and Engineering
Reagents
1. Hydrochloric acid 2. Hydroxylamine solution3. Ammonium acetate buffer solution 4. Sodium acetate solution5. Phenanthroline solution 6. Stock iron solution7. Standard iron solution (1 mL = 10 µg Fe)
Procedure
1. Pipette 10, 20, 30 and 50 mL. Standard iron solution into 100 mL conical flasks.2. Add 1 mL hydroxylamine solution and 1 mL sodium acetate solution to each flask.3. Dilute each to about 75 mL with distilled water.4. Add 10 mL phenanthroline solution to each flask.5. Make up the contents of each flask exactly to 100mL by adding distilled water and left stand for 10
minutes.6. Take 50 mL distilled water in another conical flask.7. Repeat steps 2 to 5 described above.8. Measure the absorbance of each solution in a spectrophotometer at 508 nm against the reference blank
prepared by treating distilled water as described in steps 6 and 7. Prepare a calibration graph takingmeter reading on y-axis and concentration of iron on x-axis.
9. For visual comparison, pour the solution in 100 mL tall form Nessler tubes and keep them in a stand.10. Mix the sample thoroughly and measure 50 mL into a conical flask.11. Add 2 mL conc. hydrochloric acid (HCl) and 1mL hydroxylamine solution. Add a few glass beads and
heat to boiling. To ensure dissolution of all the iron, continue boiling until the volume is reduced to 15to 20 mL.
12. Cool the flask to room temperature and transfer the solution to a 100 mL Nessler tube.13. Add 10 mL ammonium acetate buffer solution and 2 mL phenanthroline solution and dilute to the 100
mL mark with distilled water.14. Mix thoroughly and allow at least 10 to 15 minutes for maximum colour development.15. Measure the absorbance of the solution in a 1cm cell in a spectrophotometer at 508 nm.16. Read off the conc. of iron (mg Fe) from the calibration graph for the corresponding meter reading.17. For visual comparison, match the colour of the sample with that of the standard prepared in steps 1
to 7 above.18. The matching colour standard will give the concentration of iron in the sample (µg Fe).

Determination of Iron and Manganese 41
Observation
Standard iron solution in mL Iron content in µµµµµg Absorbance
Sample calculation
iron (Fe) in mg/L = µg Fe/mL of sample= ...….. mg/L
Results
Sample no. or description Iron content in mg/L (Fe)
Discussion
Sample no. Absorbance Iron content from graph in µµµµµg Iron as Fe in mg/L

42 A Comprehensive Laboratory Manual for Environmental Science and Engineering
B. DETERMINATION OF MANGANESE
Aim
To determine the quantity of manganese present in the given sample.
Principle
Manganese exists in the soil principally as manganese dioxide, which is very insoluble in water containing carbondioxide. Under anaerobic conditions, the manganese in the dioxide form is reduced from an oxidation state of IVto II and solution occurs. The manganese in ground water is of divalent form. It may be present in trivalent orquadrivalent form also.
The concentration of manganese seldom exceeds a few mg/L. So colorimetric methods are applicable. Themethods are (1) persulphate method, and (2) periodate method. Both methods depend upon oxidation of manganesefrom its lower oxidation state to VII where it forms the highly coloured permanganate ion. The colour produced isdirectly proportional to the concentration of manganese present over a considerable range of concentration inaccordance with Beer’s law. So it can be measured by eye or photometric means. Provisions must be made toovercome the influence of chlorides. Manganese can also be determined by atomic absorption spectrophotometry.Persulphate method is suitable because pretreatment of samples is not required. Chloride concentration is reducedby using mercuric sulphate. Persulphate oxidises manganese to permanganate in the presence of silver nitrate ascatalyst. The colour intensity is observed at a wavelength of 525 nm in a spectrophotometer.
Periodate method is used when concentrations are below 0.1 mg/L. To obtain complete oxidation of smallamounts of manganese, silver nitrate is added and the heating time is increased.
Apparatus
1. Colorimetric equipment: one of the following is required:(a) Spectrophotometer, for use at 252 nm, providing a light path of 1 cm or longer.(b) Nessler tubes, matcheds, 100 mL tall form.
2. Glassware like conical flasks, measuring cylinder and pipette.
Reagents1. Special reagent 2. Ammonium persulphate3. Standard manganese solution 4. Hydrogen peroxide 30%.
Procedure1. Take 50 mL of the sample in a conical flask. Add 50 mL distilled water to it.2. Pipette 1, 2, 3, 4, and 8 mL of standard manganese solution to different flasks, and dilute each to
100 mL using distilled water.3. Add 5 mL special reagent to all the flasks.4. Concentrate the solutions in all the flasks to about 90 mL boiling.5. Add 1g ammonium persulphate to all the flasks, bring to boiling and boil for 1 minute.6. Remove all the flasks from the heat source and let stand for 1 minute.

Determination of Iron and Manganese 43
7. Then cool the flasks under the tap water.8. Dilute the contents in all the flasks to 100 mL with distilled water and mix. Pour the contents into 100 mL
Nessler tubes.9. Match the colour of the sample with that of the colour standards. Note down the concentration of Mn
in µg.10. If the spectrophotometer is used, one distilled water blank has to be prepared along with the colour
standards.11. Measure the absorbance of each solution in a 1cm cell at 525 nm against the reference blank prepared
by treating distilled water.12. Prepare the calibration graph taking meter reading along y-axis and concentration of manganese (in µg)
in colour standards on x-axis.13. Keep the sample in the spectrophotometer and note down the meter reading.14. Read off from the graph, the corresponding concentration of manganese in µg.
Observation
Concentration of Mn in colour standards in µµµµµg Spectrophotometer reading
Sample calculation
Mn in mg/L =g of Mn
mL sampleµ
Sample no. Volume of Concentration of Mn in sample in µµµµµg of Mg/L ofor description sample taken matching colour standard or Mn
from the graph

44 A Comprehensive Laboratory Manual for Environmental Science and Engineering
Results
Discussion
Sample no. or description Concentration of Mn in mg/L
Questions
1. How are the iron and manganese removed from water?2. Explain the significance of Fe and Mn in environmental engineering.3. In what oxidation state must the manganese be for colorimetric measurement?

Determination of Iron and Manganese 45

46 A Comprehensive Laboratory Manual for Environmental Science and Engineering

A. DETERMINATION OF SULPHATE
Aim
To determine the amount of sulphate present in the given samples.
Principle
Sulphate is widely distributed in nature and may be present in natural water in concentrations ranging from a few toseveral thousand milligrams/litre. Sulphates are of considerable concern because they are indirectly responsible fortwo serious problems often associated with the handling and treatment of wastewater. Odour and sewer corrosionproblem result from the reduction of sulphates to hydrogen sulphide under anaerobic conditions.
Sulphates can be determined by1. Gravimetric method with ignition of residue.2. Gravimetric method with drying of residue.3. Turbidimetric method.
1. Gravimetric Method with Ignition of Residue
Principle
Sulphate is precipitated in hydrochloric acid medium as barium sulphates by the addition of barium chloride. Theprecipitation is carried out near the boiling temperature and after a period of digestion the precipitate is filtered;washed with water until free of chlorides, ignited and weighed as barium sulphates.
Apparatus1. Drying oven 2. Desiccator3. Steam bath 4. Analytical balance5. Ashless filter paper (Whatman filter paper No. 42)
DETERMINATION OF SULPHATE AND SULPHIDE
Experiment No. ___________________ Date ___________________

48 A Comprehensive Laboratory Manual for Environmental Science and Engineering
6. Muffle furnace7. Glassware like funnel, flask and pipette
Reagents1. Methyl red indicator solution2. Hydrochloric acid3. Barium chloride solution.4. Silver nitrate–nitric acid reagent
Procedure1. Take 250 mL of the sample in a conical flask.2. Adjust the acidity with HCl to 4.5 to 5 using a pH meter or the orange colour of methyl red indicator.3. Then add an additional 1 to 2mL HCl.4. Heat the solution to boiling and while stirring gently, add barium chloride solution slowly until precipitation
appear to be completed. Then add about 2 mL in excess.5. Digest the precipitate at 80°C to 90°C preferably overnight but for not less than
2 hours.6. Filter the contents in the flask through an ashless filter paper.7. Wash the precipitate with small portion of warm distilled water until the washing is free of chloride as
indicated by testing with silver nitrate–nitric acid reagent.8. Place the precipitate along with filter paper in a crucible after finding its empty weight and dry it.9. Keep the crucible in a muffle furnace and ignite at 800°C for 1 hour.
10. Cool in a desiccator and weigh.11. Find weight of the barium sulphate precipitate.
2. Gravimetric Method with Drying of Residue
If organic matter is not present in the sample, first method can be done without igniting and instead drying theresidue and weighing.
3. Turbidimetric Method
Principle
The turbidimetric method of measuring sulphate is based upon the fact that barium sulphate tends to precipitate ina colloidal form and that this tendency is enhanced in presence of a sodium chloride—hydrochloric acid solutioncontaining glycerol and other organic compounds. The absorbance of the barium sulphate solution is measured bya nephelometer or turbidimeter and the sulphate iron concentration, determined by comparison of the reading witha standard curve.
Apparatus
1. Nephelometer or Turbidimeter2. Magnetic stirrer
Gravimetric method with drying of residue.

Determination of Sulphate and Sulphide 49
3. Stopwatch4. Measuring spoon 0.2 to 0.3 mL capacity.
Reagents1. Conditioning agent2. Barium chloride3. Standard sulphate solution
Procedure
1. Measure 100 mL or suitable portion of the sample into a 250 mL Erlenmeyer flask.2. Add 5 mL of conditioning reagent and mix it by placing on a magnetic stirrer.3. Add a spoonful of barium chloride crystals and begin timing immediately.4. Stir at constant speed exactly for one minute.5. After stirring pour some of the solution into the absorption cell of the photometer, and measure the
turbidity at 30 second intervals for four minutes.6. Usually maximum turbidity occurs within two minutes and the reading remains constant thereafter for
3 to 10 minutes. So, take reading with maximum turbidity occurring in within four minutes.7. Prepare a calibration curve. The standards are prepared at 5 mg/L increments in the
0–40 mg/L sulphate range and their turbidity or absorbance read.8. Absorbance versus sulphate concentration is plotted and a curve is obtained.9. Finding the absorbance for a given sample, the concentration of sulphates in the solution is determined
with the help of calibration curve.
Observation
Weight of filter paper =...........
Sample no. or Volume of the Empty weight Wt. of crucible + Wt. of BaSO4 mg/L description sample (mL) of the crucible residue after ignition precipitated SO4
+ filter paper + filter paper

50 A Comprehensive Laboratory Manual for Environmental Science and Engineering
Calculation
SO4 in mg/L = 4mg of BaSO 411.6mL of sample
× = .........
Results
Sample no. or description mg/L of SO4
Discussion
B. DETERMINATION OF SULPHIDE
Aim
To determine the amount of sulphide present in the sample by titrimetric method.
Principle
Sulphides often occur in ground water especially in hot springs, in wastewater and polluted waters. Hydrogensulphide escaping into the air from sulphide containing wastewater causes odour nuisance. It is highly toxic andcause corrosion of sewers and pipes. Sulphides include H2S and HS– and acid soluble metallic sulphides present inthe suspended matter.
Iodine reacts with sulphide in acid solution, oxidising it to sulphur; a titration based on this reaction is anaccurate method for determining sulphides at concentration above 1mg/L if interferences are absent and if loss ofH2S is avoided.
Determination of Sulphate and Sulphide 51
Apparatus1. Burette2. Pipette3. Erlenmeyer flask.
Reagents
1. Hydrochloric acid2. Standard iodine solution (0.025N)3. Standard sodium thiosulphate solution (0.025N)4. Starch solution
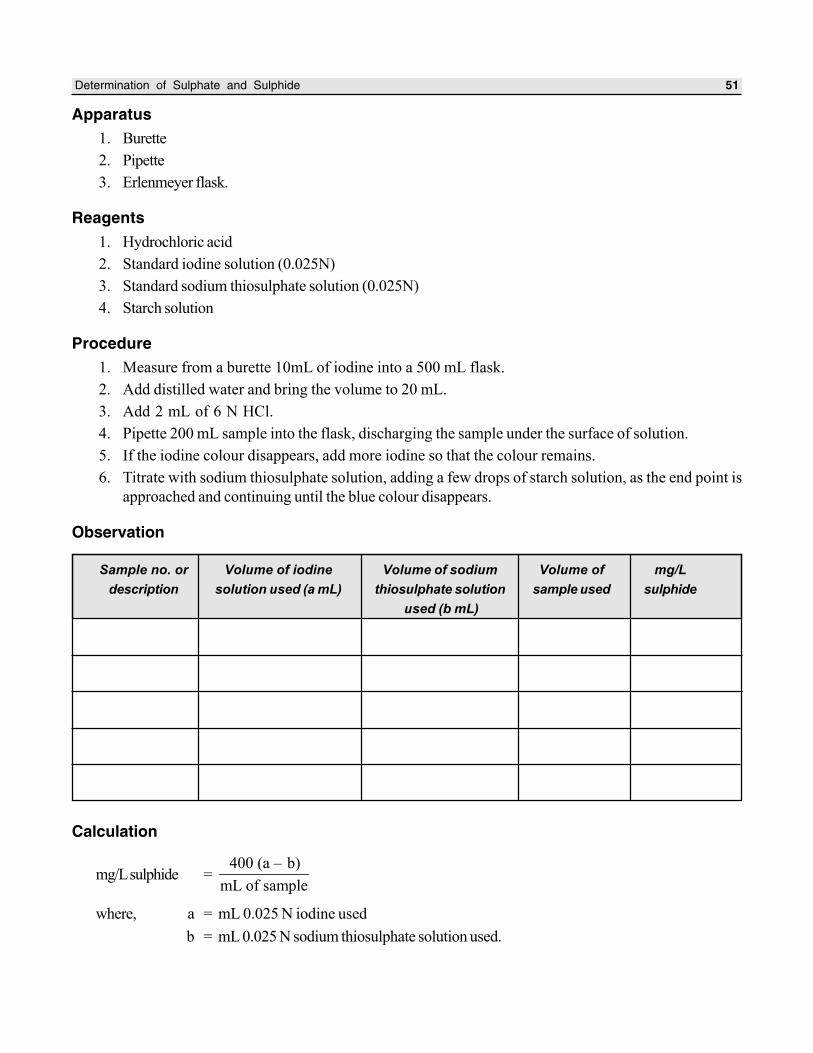
Procedure1. Measure from a burette 10mL of iodine into a 500 mL flask.2. Add distilled water and bring the volume to 20 mL.3. Add 2 mL of 6 N HCl.4. Pipette 200 mL sample into the flask, discharging the sample under the surface of solution.5. If the iodine colour disappears, add more iodine so that the colour remains.6. Titrate with sodium thiosulphate solution, adding a few drops of starch solution, as the end point is
approached and continuing until the blue colour disappears.
Observation
Calculation
mg/L sulphide = 400 (a – b)
mL of sample
where, a = mL 0.025 N iodine usedb = mL 0.025 N sodium thiosulphate solution used.
Sample no. or Volume of iodine Volume of sodium Volume of mg/Ldescription solution used (a mL) thiosulphate solution sample used sulphide
used (b mL)

52 A Comprehensive Laboratory Manual for Environmental Science and Engineering
Results
Discussion
Questions
1. What is the significance of high sulphate concentration in water supplies and in wastewater disposal?2. What is the purpose of digestion of the sample in the gravimetric analysis for sulphates?3. Explain the significance of the determination of sulphide concentration in environmental engineering.4. The water to be used for the preparation of cement concrete products should be free from excess of
sulphates and chlorides. Why?
Sample no. or description mg/L (Sulphide) in the sample

Determination of Sulphate and Sulphide 53

54 A Comprehensive Laboratory Manual for Environmental Science and Engineering

Aim
To determine the optimum coagulant dosage for clarifying the given sample of water by using alum as the coagulantand performing the jar test experiment.
Principle
Coagulants are used in water treatment plants(i) to remove natural suspended and colloidal matter,(ii) to remove material which do not settle in plain sedimentation, and(iii) to assist in filtration.Alum [Al2(SO4)3. 18H2O] is the most widely used coagulant. When alum solution is added to water, the
molecules dissociate to yield 2–4SO and Al3+. The +ve species combine with negatively charged colloidal to neutralise
part of the charge on the colloidal particle. Thus, agglomeration takes place. Coagulation is a quite complexphenomenon and the coagulant should be distributed uniformly throughout the solution. A flash mix accomplishesthis.
Jar test is simple device used to determine this optimum coagulant dose required. The jar test, device consistsof a number of stirrers (4 to 6) provided with paddles. The paddles can be rotated with varying speed with the helpof a motor and regulator. Samples will be taken in jars or beakers and varying dose of coagulant will be addedsimultaneously to all the jars. The paddles will be rotated at 100 rpm for 1 minute and at 40 rpm for 20 to 30minutes, corresponding to the flash mixing and slow mixing in the flocculator of the treatment plant. After 30minutes settling, supernatant will be taken carefully from all the jars to measure turbidity. The dose, which gives theleast turbidity, is taken as the optimum coagulant dose.
Apparatus1. Jar test apparatus 2. Glass beakers3. Pipette 4. Nephelometer5. pH meter
JAR TEST FOR DETERMINING OPTIMUMCOAGULANT DOSAGE
Experiment No. ___________________ Date ___________________

56 A Comprehensive Laboratory Manual for Environmental Science and Engineering
Reagents1. Alum solution (1mL containing 10 mg of alum)2. Lime3. Acid/alkali
Procedure
1. Take 1-litre beakers and fill them with sample up to the mark.2. Keep each beaker below each paddle and lower the paddles, such that each one is about 1cm above
the bottom.3. Find the pH of the sample and adjust it to 6 to 8.5.4. Pipette 1, 2, 3, 4, 5, 6 mL of the alum solution into the test samples.5. Immediately run the paddles at 100 rpm for 1 minute.6. Reduce the speed to 30–40 rpm and run at this rate for 30 minutes.7. Stop the machine, lift out the paddles and allow to settle for 30 minutes.8. Find the residual turbidity of the supernatant using nephelometer.9. Plot a graph with alum dosage along x-axis and turbidity along y-axis.
10. The dosage of alum, which represents least turbidity, gives Optimum Coagulant Dosage (O.C.D.).11. Repeat steps 1–10 with higher dose of alum, if necessary.
Observation
Trial no. Alum dosage in mg/L Turbidity in NTU
ResultsOptimum coagulant dosage = ..........

Jar Test for Determining Optimum Coagulant Dosage 57
Discussion
Questions
1. Why is alum preferred to other coagulants?2. What is the difference between coagulation and flocculation?3. What are coagulant aids?4. Write the significance of pH in coagulation using alum.5. What factors affect the sedimentation of a discrete particle setting in a quiescent liquid?

58 A Comprehensive Laboratory Manual for Environmental Science and Engineering

Aim
The aim of the experiment is to determine the quantity of dissolved oxygen present in the given sample(s) by usingmodified Winkler’s (Azide modification) method.
Principle
Dissolved Oxygen (D.O.) levels in natural and wastewaters are dependent on the physical, chemical and biochemicalactivities prevailing in the water body. The analysis of D.O. is a key test in water pollution control activities andwaste treatment process control.
Improved by various techniques and equipment and aided by instrumentation, the Winkler(or iodometric) test remains the most precise and reliable titrimetric procedure for D.O. analysis. The test is basedon the addition of divalent manganese solution, followed by strong alkali to the water sample in a glass-stopperedbottle. D.O. present in the sample rapidly oxidises in equivalent amount of the dispersed divalent manganoushydroxide precipitate to hydroxides of higher valency states. In the presence of iodide ions and upon acidification,the oxidised manganese reverts to the divalent state, with the liberation of iodine equivalent to the original D.O.content in the sample. The iodine is then titrated with a standard solution of thiosulphate.
Apparatus
1. 300 mL capacity bottle with stopper2. Burette3. Pipettes, etc.
Reagents1. Manganous sulphate solution (MnSO4.4H2O)2. Alkali-iodide azide reagent3. Conc. sulphuric acid (36 N)4. Starch indicator5. Standard sodium thiosulphate solution (0.025N)6. Standard potassium dichromate solution (0.025N)
DETERMINATION OF DISSOLVED OXYGEN
Experiment No. ___________________ Date ___________________

60 A Comprehensive Laboratory Manual for Environmental Science and Engineering
Procedure
1. Add 2 mL of manganous sulphate solution and 2 mL of alkali-iodide azide reagent to the 300 mL sampletaken in the bottle, well below the surface of the liquid.(The pipette should be dipped inside the sample while adding the above two reagents.)
2. Stopper with care to exclude air bubbles and mix by inverting the bottle at least 15 times.3. When the precipitate settles, leaving a clear supernatant above the manganese hydroxide floc, shake
again.4. After 2 minutes of settling, carefully remove the stopper, immediately add 3 mL concentrated sulphuric
acid by allowing the acid to run down the neck of the bottle.5. Restopper and mix by gentle inversion until dissolution is complete.6. Measure out 203 mL of the solution from the bottle to an Erlenmeyer flask. As 2 mL each of manganese
sulphate and azide reagent have been added, the proportionate quantity of yellow solution correspondsto 200 mL of sample is
200×300= =203 mL300–4
7. Titrate with 0.025 N sodium thiosulphate solution to a pale straw colour.8. Add 1–2 mL starch solution and continue the titration to the first disappearance of the blue colour
and note down the volume of sodium thiosulphate solution added (V), which gives directly the D.O.in mg/L.
Observation
Sample × Standard sodium thiosulphate solution (0.025N) (Starch indicator)
Description Trial Volume of Burette reading Volume of D.O. in of sample no. sample (mL) titrant mL mg/LInitial Final
Sample I
Sample II
Sample III

Determination of Dissolved Oxygen 61
Results
Discussion
Questions
1. Discuss the environmental significance of dissolved oxygen.2. Most of the critical conditions related to dissolved oxygen deficiency occur during summer months. Why?3. Why do we use 0.025 N sodium thiosulphate solution for the titration?4. The turbulence of water should be encouraged. Why?5. Draw the oxygen saturation curve.
Description of sample D.O. mg/L
Sample I
Sample II
Sample III

62 A Comprehensive Laboratory Manual for Environmental Science and Engineering

Aim
To determine the amount of B.O.D. exerted by the given sample(s).
Principle
The Biochemical Oxygen Demand (B.O.D.) of sewage or of polluted water is the amount of oxygen required forthe biological decomposition of dissolved organic matter to occur under aerobic condition and at the standardisedtime and temperature. Usually, the time is taken as 5 days and the temperature 20°C as per the global standard.
The B.O.D. test is among the most important method in sanitary analysis to determine the polluting power, orstrength of sewage, industrial wastes or polluted water. It serves as a measure of the amount of clean diluting waterrequired for the successful disposal of sewage by dilution. The test has its widest application in measuring wasteloading to treatment plants and in evaluating the efficiency of such treatment systems.
The test consists in taking the given sample in suitable concentrations in dilute water in B.O.D. bottles. Twobottles are taken for each concentration and three concentrations are used for each sample. One set of bottles isincubated in a B.O.D. incubator for 5 days at 20°C; the dissolved oxygen (initial) content (D1) in the other set ofbottles will be determined immediately. At the end of 5 days, the dissolved oxygen content (D2) in the incubated setof bottles is determined.
Then, mg/L B.O.D. = 1 2(D – D )P
where, P = decimal fraction of sample used.D1 = dissolved oxygen of diluted sample (mg/L), immediately after preparation.D2 = dissolved oxygen of diluted sample (mg/L), at the end of 5 days incubation.
Among the three values of B.O.D. obtained for a sample select that dilution showing the residual dissolvedoxygen of at least 1 mg/L and a depletion of at least 2 mg/L. If two or more dilutions are showing the samecondition then select the B.O.D. value obtained by that dilution in which the maximum dissolved oxygen depletionis obtained.
DETERMINATION OF B.O.D. OFWASTEWATER SAMPLE
Experiment No. ___________________ Date ___________________

64 A Comprehensive Laboratory Manual for Environmental Science and Engineering
Apparatus1. B.O.D. bottles 300mL capacity2. B.O.D. incubator3. Burette4. Pipette5. Air compressor6. Measuring cylinder etc.
Reagents
1. Distilled water2. Phosphate buffer solution3. Magnesium sulphate solution4. Calcium chloride solution5. Ferric chloride solution6. Acid and alkali solution7. Seeding8. Sodium sulphite solution9. Reagents required for the determination of D.O.
Procedure
1. Place the desired volume of distilled water in a 5 litre flask (usually about 3 litres of distilled water willbe needed for each sample).
2. Add 1mL each of phosphate buffer, magnesium sulphate solution, calcium chloride solution and ferricchloride solution for every litre of distilled water.
3. Seed the sample with 1–2 mL of settled domestic sewage.4. Saturate the dilution water in the flask by aerating with a supply of clean compressed air for at least
30 minutes.5. Highly alkaline or acidic samples should be neutralised to pH 7.6. Destroy the chlorine residual in the sample by keeping the sample exposed to air for
1 to 2 hours or by adding a few mL of sodium sulphite solution.7. Take the sample in the required concentrations. The following concentrations are suggested:
Strong industrial waste : 0.1, 0.5 and 1 per centRaw and settled sewage : 1.0, 2.5 and 5 per centOxidised effluents : 5, 12.5 and 25 per centPolluted river water : 25, 50 and 100 per cent
8. Add the required quantity of sample (calculate for 650 mL dilution water the required quantity of samplefor a particular concentration) into a 1000 mL measuring cylinder. Add the dilution water up to the 650mLmark.
9. Mix the contents in the measuring cylinder.10. Add this solution into two B.O.D. bottles, one for incubation and the other for determination of initial
dissolved oxygen in the mixture.

Determination of B.O.D. of Wastewater Sample 65
11. Prepare in the same manner for other concentrations and for all the other samples.12. Lastly fill the dilution water alone into two B.O.D. bottles. Keep one for incubation and the other for
determination of initial dissolved oxygen.13. Place the set of bottles to be incubated in a B.O.D. incubator for 5 days at 20°C. Care should be
taken to maintain the water seal over the bottles throughout the period of incubation.14. Determine the initial dissolved oxygen contents in the other set of bottles and note down the results.15. Determine the dissolved oxygen content in the incubated bottles at the end of
5 days and note down the results.16. Calculate the B.O.D. of the given sample.
Note: The procedure for determining the dissolved oxygen content is same as described in the experiment under “Determinationof dissolved oxygen”.
Observation
Note: B.O.D. value in mg/L = 1 2D – DP
If concentration is 0.1 per cent, then P = 0.1 = 0.001100
and so on.
Sample calculation
D1 = Initial Dissolved Oxygen = ...... mg/LD2 = Dissolved Oxygen at the end of 5 days = ...... mg/LP = Decimal fraction of sample used = ......
Therefore, mg/L of B.O.D. = 1 2D – DP
= ......
Sample no. or Concentration Dissolved oxygen content mg/L B.O.D. mg/Ldescription (5 days 20°C)
Initial (D1) Final (D2)
Bottle D.O. Bottle D.O.no. value no. value
66 A Comprehensive Laboratory Manual for Environmental Science and Engineering
Results
Discussion
Questions
1. What use is made of the B.O.D. test in water pollution control?2. List five requirements, which must be completed with, in order to obtain reliable B.O.D. data.3. List five requirements of satisfactory dilution water for B.O.D. test.4. What are the three methods that can be used to control nitrification in the 5 days B.O.D. test at 20°C?5. What are the factors affecting the rate of biochemical oxidation in the B.O.D. test?
Sample no. or description mg/L 5 days B.O.D. at 20°C

Determination of B.O.D. of Wastewater Sample 67

68 A Comprehensive Laboratory Manual for Environmental Science and Engineering

Aim
To determine the available chlorine in the given sample of bleaching powder by the iodometric method.
Principle
Bleaching powder is commonly used as a disinfectant. The chlorine present in the bleaching powder gets reducedwith time. So, to find the exact quantity of bleaching powder required, the amount of available chlorine in thesample must be found out.
Chlorine will liberate free iodine from potassium iodide solution when its pH is 8 or less. The iodine liberated,which is equivalent to the amount of active chlorine, is titrated with standard sodium thiosulphate solution usingstarch as indicator.
Apparatus
1. Mortar and pestle 2. Volumetric flask3. Burette 4. Pipette5. Erlenmeyer flask.
Reagents1. Concentrated glacial acetic acid2. Standard sodium thiosulphate solution (0.025N)3. Potassium iodide4. Starch indicator5. Iodine solution (0.025N).
Procedure1. Dissolve 1g bleaching powder in 1 litre of distilled water in a volumetric flask, and stopper the container.
(This can be done by first making a paste of the bleaching powder with mortar and pestle.)
DETERMINATION OF AVAILABLE CHLORINE INBLEACHING POWDER
Experiment No. ___________________ Date ___________________

70 A Comprehensive Laboratory Manual for Environmental Science and Engineering
2. Place 5 mL acetic acid in an Erlenmeyer flask and add about 1g potassium iodide crystals. Pour25 mL of bleaching powder solution prepared above and mix with a stirring rod.
3. Titrate with 0.025 N sodium thiosulphate solution until a pale yellow colour is obtained. (Deep yellowchanges to pale yellow.)
4. Add 1mL of starch solution and titrate until the blue colour disappears.5. Note down the volume of sodium thiosulphate solution added (V1).6. Take a volume of distilled water corresponding to the sample used.7. Add 5 mL acetic acid, 1g potassium iodide and 1 mL starch solution.8. If blue colour occurs, titrate with 0.025 N sodium thiosulphate solution until the blue colour disappears.9. Record the volume of sodium thiosulphate solution added (A1).
10. If no blue colour occurs, titrate with 0.025 N iodine solution until a blue colour appears. Note downthe volume of iodine (A2).
11. Then, titrate with 0.025 N sodium thiosulphate solution till the blue colour disappears. Record the volumeof sodium thiosulphate solution added (A3). Note down the difference between the volume of iodinesolution and sodium thiosulphate as A4(A4=A2 – A3).
Note: Blank titration is necessary to take care of the oxidising or reducing reagents’ impurities.
Observation
Bleaching powder solution × Standard sodium thiosulphate solution (0.025 N)
Trial no. Volume of bleaching powder Burette reading Volume of titrant (mL)solution (mL)
Initial Final

Determination of Available Chlorine in Bleaching Powder 71
Distilled water × Standard sodium thiosulphate solution (0.025 N)
Distilled water × Standard iodine solution (0.025N)
Calculation
mg of Cl2/mL (B) = 1 4(V – A ) or (V+A )×N×35.46mL of bleaching powder solution taken
1000 mL of bleaching powder solution contains 1000 × B mg of Cl2i.e., 1000 mg bleaching powder contains 1000 B mg of Cl2
therefore, 100 mg of bleaching powder contains = 1000×B
10% of chlorine available = .........
Results
Available chlorine in the given bleaching powder is. ………%
Trial no. Volume of distilled water Burette reading Volume of titrant (mL)(mL)
Initial Final
Trial no. Volume of distilled water Burette reading Volume of titrant (mL)(mL)
Initial Final

72 A Comprehensive Laboratory Manual for Environmental Science and Engineering
Discussion
Questions
1. What is disinfection? Differentiate between disinfection and sterilisation?2. Why do we prefer chlorination over other methods of disinfection?3. Discuss the effect of pH of water and organic matter of water on efficiency of disinfection by chlorine.4. What is electro-katadyn process?5. By use of appropriate equilibrium equations show why the addition of chlorine tends to decrease the
pH of water, while hypochlorite tends to increase the pH.

Determination of Available Chlorine in Bleaching Powder 73

74 A Comprehensive Laboratory Manual for Environmental Science and Engineering
A. OTA METHOD
Aim
To determine the amount of free residual chlorine, combined residual chlorine and total residual chlorine present inthe given samples of chlorinated water.
Principle
Orthotolidine (OT) is an aromatic compound that is oxidised in acid solution by chlorine, chloramines and otheroxidising agents to produce a yellow coloured compound, holoquinone at pH less than 1.8, the intensity of colourbeing proportional to the amount present. Orthotolidine-arsenite (OTA) method is based upon the fact that freeresiduals chlorine react instantaneously and chloramines slowly (5 minutes) with orthotolidine. Total residual chlorineis measured with readings after 5 minutes have elapsed. A second test is made in which a reducing agent (sodiumarsenite) is added within 5 seconds after ‘OT’ is added. This allows time for free chlorine to react before thearsenite is added. The arsenite being a much stronger reducing agent than ‘OT’, reduces the chloraminesinstantaneously stopping further action with OT. The yellow colour developed in this case is primarily due to theresidual chlorine. Then,
Total residual chlorine – Free residual chlorine = Combined residual chlorineNote: Nitrates and some other oxidising agents also react with ‘OT’ producing holoquinone. If such materials are present,correction should be applied to account for them.
Apparatus
1. Chloroscope 2. Cuvettes 3. Comparator discs.
Reagents
1. Orthotolidine reagent 2. Arsenite reagent.
TEST FOR RESIDUAL CHLORINE
Experiment No. ___________________ Date ___________________

76 A Comprehensive Laboratory Manual for Environmental Science and Engineering
Procedure
1. Pour the sample into the middle chamber of the cell of the chloroscope. Add 0.5 mL of ‘OT’ and mixwell with the plunger. Fill the outer chambers with chlorine free distilled water. Wait for 5 minutes. Putthe yellow coloured discs in position and compare the colour. Note the reading (A).
2. As in step 1 first add ‘OT’, mix quickly and immediately add arsenite reagent. Note the reading (B).Note: If the colour is not in the range of the given discs, the experiment may be done by diluting the sample with distilled waterand then multiplying the result by the dilution factor.
Observation
Sample no. Trial no. A B C
Calculation
Total residual chlorine = A mg/L = .........Free residual chlorine = B mg/L = .........Combined residual chlorine = (A – B) mg/L = .........
Results
Sample description Total residual chlorine Free residual chlorine Combined residualmg/L mg/L chlorine mg/L

Test for Residual Chlorine 77
B. STARCH IODIDE METHOD
Aim
To determine the amount of total residual chlorine present in the given samples of chlorinated water by starchiodide method.
Principle
Chlorination of water supply is done to destroy or deactivate disease-producing micro-organisms. It will alsoimprove the quality of water by reacting with ammonia, iron, manganese, sulphide and some organic substances.The residual chlorine is maintained in water to promote the primary purpose of chlorination. This method ofdetermination depends upon the oxidising power of free and combined chlorine residuals. Chlorine will liberatefree iodine from potassium iodide solution at pH 8 or less. The liberated iodine is titrated against standard sodiumthiosulphate solution using starch indicator.
Apparatus
1. Burettes 2. Pipettes 3. Erlenmeyer flask.
Reagents
1. Concentrated glacial acetic acid2. Potassium iodide3. Starch indicator4. Iodine solution 0.025N5. Standard sodium thiosulphate solution (0.025 N).
Discussion

78 A Comprehensive Laboratory Manual for Environmental Science and Engineering
Procedure
1. Take 25 mL of sample in an Erlenmeyer flask.2. Add 5 mL acetic acid to bring pH in the range 3–4.3. Add 1g of potassium iodide and mix thoroughly.4. Titrate with 0.025 N sodium thiosulphate solution until a pale yellow colour is obtained.5. Add 1mL of starch solution and titrate until the blue colour disappears. Note down the volume of sodium
thiosulphate solution added (V1).6. Take a volume of distilled water corresponding to the sample used. Add 5 mL acetic acid, 1 g potassium
iodide and 1mL starch solution.7. If blue colour occurs, titrate with 0.025 N sodium thiosulphate solution until the blue colour disappears.
Record the volume of sodium thiosulphate solution added (A1).8. If no blue colour occurs, titrate with 0.025 N iodine solution until the blue colour appears (A2).9. Then titrate with 0.025 N sodium thiosulphate solution till the blue colour disappears. Record the volume
of sodium thiosulphate solution added (A3). Note down the difference between the volume of iodinesolution and sodium thiosulphate as A4.
Note: Blank titration is necessary to take care of the oxidising or reducing reagents’ impurities.
Observation
Chlorinated sample × Standard sodium thiosulphate solution (0.025 N)
Sample no. Trial no. Volume of sample (mL) Burette reading Volume of titrant (mL)
Initial Final

Test for Residual Chlorine 79
Distilled water × Standard sodium thiosulphate solution (0.025 N)
Distilled water × Standard iodine solution (0.025N)
Calculation
Residual chlorine in mg/L = 1 4(V – A ) or (V+A )×N×35.46×1000mL of sample = ........
Sample no. Trial no. Volume of sample (mL) Burette reading Volume of titrant (mL)
Initial Final
Sample no. Trial no. Volume of sample (mL) Burette reading Volume of titrant (mL)
Initial Final

80 A Comprehensive Laboratory Manual for Environmental Science and Engineering
Results
Discussion
Questions
1. What are the different factors that affect the degree of disinfection?2. Differentiate between free residual chlorine and combined residual chlorine.3. The dosage of chlorine should be proper. Why?4. No modification of OTA test is necessary when chloramines are present in water. Why?5. What are the modifications made in the OTA test, if iron, manganese, etc., are present in water?
Sample no. or description Total residual chlorine mg/L

Test for Residual Chlorine 81

82 A Comprehensive Laboratory Manual for Environmental Science and Engineering
Aim
To find the Most Probable Number (MPN) of bacterial density by E.coli test.
Principle
Coliform group comprises of all the aerobic, facultative and anaerobic gram-negative non-spore forming rodshaped bacteria that ferment lactose with gas formation within 48 hours at 35°C. The standard test for this groupmay be carried out either by multiple tube fermentation technique or by membrane filter technique. The E.coli testby multiple tube fermentation technique consists of 3 phases – presumptive, confirmed and completed.
Escherichia coli (E.coli) for the purpose of sanitary examination of water, is defined as a gram-negative, non-spore forming rod which is capable of fermenting lactose with the production of acid and gas at 35°C in less than48 hours, which produces indole peptone water containing tryptophan, which is incapable of utilising sodiumcitrate as its sole source of carbon, which is incapable of producing acetyl methyl carbinol, and which gives apositive methyl red test. The results are expressed in terms of MPN (Most Probable Number), which is based oncertain probability formulae. The estimate may give a value greater than the actual number of coliform present. Theaccuracy of any single test depends on the number of tubes fermented. This method helps in describing the sanitaryquality of water.
The safety of the water is generally judged from the knowledge of sanitary condition and mentioned by thenumber of samples yielding positive or negative results. If more than 95% should yield negative results, the safetyis usually assured. The scheme of the MPN test is given as follows:
Apparatus
1. Fermentation tubes 2. Petri dishes3. Autoclave 4. Incubator5. Test tubes 6. Pipettes7. Measuring jars 8. Inoculating equipments9. Media preparation utensils etc.
TEST FOR COLIFORMS IN WATER
Experiment No. ___________________ Date ___________________

84 A Comprehensive Laboratory Manual for Environmental Science and Engineering
Reagents1. Lactose broth 2. Lauryl tryptose broth3. Brilliant green lactose bile broth 4. Endo agar5. Eosin methylene blue agar etc.
SCHEMATIC OUTLINES FOR THE E.COLI TEST PROCEDURE
1. Presumptive test
Inoculate lactose or lauryl tryptose broth fermentation tubes and incubate at 24 ± 2 hrs at 35 0.5°C±
Gas produced. Positive test. No gas or acid production. Doubtful. Incubate for additional
24 hrs.
Gas produced. Positive test. No gas produced. Negative test.
Schematic outline of presumptive test for coliform detection.
2. Confirmed test
Inoculate lactose or lauryl tryptose brothtubes and incubate 24 ± 2 hrs at 35 ± 0.5°C.
Gas produced. Transfer toconfirmatory brilliant greenlactose bile broth. Incubate48 ± 3 hrs at 35 ± 0.5°C.
No gas or acid production.Doubtful. Incubate for additional
24 hrs (total 48 ± 3 hrs).
Gas produced.Doubtful.
Continue as in (a)
No gas produced. Negativetest. Coliform group absent.
(a) (b)
Gas produced. Coliformgroup confirmed.
No gas produced. Negativetest. Coliform group absent.
Schematic outline for presumptive and confirmed test for coliform detection.

Test for Coliforms in Water 85
3. Completed test
Inoculate lactose or lauryl tryptose broth fermentation tubes and incubate 24 ± 2 hrs at 35 ± 0.5°C.
Gas produced. ransfer to brilliant green lactose bile broth.Incubate 48 ± 3 hrs at 35 ± 5°C.
T confirmatory No gas or acid production.Doubtful. Incubate additional
24 hrs (total 48 ± 3 hrs).
(a) (b)
Gas produced. TransferEndo or EMB plates. Incubate 24 ± 2 hrs
at 35 ± 0.5°C.
No gas produced.Negative test.
Coliform group.absent.
Gas produced.Doubtful.
Continue as in (a)
No gas produced.Negative test.
group absentColiform
.
Typical or atypical coliform colonies.Transfer to agar slant and lauryl tryptose
broth fermentation tube. Incubate agar slant 24 to 48 ± 3 hrs and lauryl tryptose broth
48 ± 3 hrs at 35 ± 0.5°C.
Negative colonies. Negative test.Coliform absent.
1.1 1.2
Gas produced. Gram stainportion of agar slant growth.
No gas produced. Negative test.Coliform group absent.
1.1.1 1.1.2
Gram negative rods present, no sporespresent. Completed test. Coliform group
present. Gram-positive and negative rodsbroth present. Repeat procedure
beginning at 1.1.
Spores or gram positive rods and spores present. Completed test.
Coliform group absent.
1.1.1.1 1.1.1.2
Schematic outline of presumptive, confirmed and completed test fortotal coliform detection.
Procedure
General
Clean and sterilise all the glasswares.

86 A Comprehensive Laboratory Manual for Environmental Science and Engineering
Presumptive Test
1. Inoculate a series of fermentation tubes with appropriate graduated quantities (multiples and sub-multiplesof 10) of the water to be tested. The concentration of nutritive ingredients in the mixture of the mediumshould conform to the specifications. The partitions of the water sample used for inoculating lactose orlauryl tryptose broth fermentation tubes will vary in size and number with the character of the waterunder examination. Usually, decimal multiples and sub-multiples of 1mL of the sample are selected.Inoculate 10 mL portion of each water sample provided into different one of the three large tubescontaining 10 mL of lactose or lauryl tryptose broth which has been prepared with twice the normalconcentration of constituent to allow for dilution. Inoculate 1.0 mL and 0.1 mL of water into small tubes(two sets of three each) of single strength lactose or lauryl tryptose broth.
2. Incubate the inoculated fermentation tubes at 35±0.5°C. At the end of 24±2 hrs shake each tube gentlyand examine and if no gas is formed, repeat this test at the end of 48±3 hrs.
3. Record the presence or absence of gas formation at each examination of the tubes. Formation within48±3 hrs of gas in any amount in the inverted fermentation tubes constitutes a positive presumptive test.Active fermentation may be shown by the continued appearance of small bubbles of gas throughoutthe medium outside the inner vial in the fermentation tubes. Presumptive test without confirmation shouldnot be used routinely except in the analysis of heavily polluted water, sewage or other waste, whichare not suitable for drinking purpose.
Confirmed Test
1. Lactose or lauryl tryptose broth may be used for primary fermentation in presumptive test to avoid falsepositive results.
2. Brilliant green lactose bile broth fermentation tubes are used in confirmed test.3. Submit all primary fermentation tubes showing any amount of gas at the end of 24 hrs incubation to
the confirmed test.4. Gently shake primary fermentation tube showing gas formation and with a sterile metal loop, transfer
one loop full of medium to a fermentation tube containing brilliant green lactose bile broth.5. Incubate the inoculated brilliant green lactose bile broth tube for 48±3 hrs at 35±0.5°C.6. The formation of gas in any amount in the inverted vial of the brilliant green lactose bile broth fermentation
tube at any time within 48±3 hrs constitutes a positive confirmed test.7. If no gas is formed, it is a negative confirmed test and E.coli is absent.
Completed Test
Completed test is the next step following the confirmed test. It is applied to the brilliant green lactose bile brothfermentation tubes showing gas in the confirmed test.
1. Streak one or more endo or Eosin Methylene Blue (EMB) agar plates (taken in Petri dishes) from eachtube of brilliant green lactose bile broth showing gas.
2. While streaking it is essential to ensure the presence of some discrete colonies separated by at least0.5 cm from one another.
3. Insert the end of the streaking needle into the liquid in the tube to a depth of 5 mm.

Test for Coliforms in Water 87
4. Streak the plate by bringing only the curved section of the needle in contact with the agar surface sothat the latter will not be scratched or torn.
5. Incubate the Petri dishes (inverted) at 35 ± 0.5°C for 24 ± 2 hrs.6. The colonies developing on endo or eosin methylene blue agar may be typical (unnucleated, with or
without metallic sheen) atypical (opaque, unnucleated, mucoid, pink after incubation for 24 hrs) ornegative (all others).
7. From each of these plates fish out one or two colonies and transfer to lauryl tryptose broth fermentationtubes and to nutrient agar slants.
8. Incubate the secondary broth tubes and agar slants at 35 ± 0.5°C for 24 ± 2 hrs or 48 ± 3 hrs andif gas is not produced in 24 hrs gram stained preparation from these agar slant cultures are made.
9. The gas formation in the secondary lauryl tryptose broth tubes and the demonstration of gram-negativenon-spore forming rod shaped bacteria in agar culture may be considered a satisfactory positivecompleted test.
10. If after 48 ± 3 hrs gas is produced in the secondary fermentation tubes and no spore of gram positiverod are found on the slant, the test may be considered as positive completed test and this demonstratesthe presence of coliform organisms.
Differentiation of E. coli and A. aerogenes on eosin or EMB agar can be done by referring the following table.
Differentiation of E.coli and A. aerogenes on eosin or EMB agar
Characteristic Escherichia coli Aerobactor aerogenesSize Well isolated colonies are 2–3 mm in Well isolated colonies, are larger than
diameter. those of E. coli usually 4–6 mm indiameter.
Confluence Neighbouring colonies show little Neighbouring colonies run togethertendency to run together. quickly.
Elevation Colonies are slightly raised, surface Colonies are considerably raised andis flat or slightly concave, rarely convex. marked by convex, occasionally centre
drops precipitedly.Appearance by Dark, almost black centre that Centres are deep brown not as dark astransmitted light extend across more than three fourths those of E. coli and smaller in proportion
of the diameter of the colony, internal to the rest of the colony. Striated internalstructure of central dark portion is structure is often observed in youngdifficult to discern. colonies.
Appearance by Colonies are dark, button like, often Much lighter than E. coli, metallic sheenreflected light concentrically ringed with a greenish is not observed except in a depressed
metallic sheen. center.
Gram Staining
Reagents1. Ammonium oxalate-crystal violet (Hucker’s)2. Lugol’s solution

88 A Comprehensive Laboratory Manual for Environmental Science and Engineering
3. Counter stain4. Acetone alcohol.
Procedure
1. Prepare a light emulsion of the bacterial growth on an agar slant in a drop of distilled water on a glassslide.
2. Air-dry or fix by passing the slide through a flame and stain for 1minute with ammonium oxalate-crystalviolet solution.
3. Rinse the slide in tap water and then apply Lugol’s solution for 1minute.4. Rinse the stained slide in tap water.5. Decolorise with acetone alcohol till the stain is just removed.6. Counter-stain with safranin for 15 seconds and then rinse with tap water.7. Blot dry with blotting paper and view through the microscope.8. Cells that decolorise and accept the safranin stain are pink and are defined as gram negative. Cells that
do not decolorise but retain the crystal violet stain (deep blue) are defined as gram positive.Steps in the gram staining is shown in the following table.
Step Procedure ResultsGram + ve Gram – ve
lnitial stain Crystal violet for 30 sec. Stains purple Stains purple
Mordent lodine for 30 sec. Remains purple Remains purple
Decolonisation 95% ethanol for 10-20 sec. Remains purple Becomes colourless
Counter stain Safranin for 20-30 sec. Remains purple Stains pink
Computation of MPN
The number of positive finding of coliform group organisms resulting from the multiple portion decimal dilutionplanting should be computed as the combination of positives and recorded in terms of the Most Probable Number(MPN). The MPN for the variety of planting series are presented in table in Appendix III. The values are at the95% confidence limit for each of the MPN determined. These values are prepared for 10,1 and 0.1mL combination.If the combination is 100, 10, 1mL, the MPN is 0.1 times the value in the table. If on the other hand a combinationcorresponding to 1, 0.1, and 0.01 mL is planted, record MPN as 10 times the value shown in the table.
The MPN for combination not appearing on the table or for other combinations of tubes and dilutions, may beestimated by Thomas’ simple formula:
No. of positive tubes × 100MPN/100 mL=mL sample in negative tubes × mL sample in all tubes

Test for Coliforms in Water 89
Observation
Sample Date and Date and Results after incubation for various volumes ofno. or time of time of samples inoculated (mL) + ve or – ve
description observation incubation10 10 10 1 1 1 0.1 0.1 0.1
Calculation
Case (i)For three each of 10 mL, 1 mL and 0.1 mL sample concentration combinationsMPN from the MPN table (Appendix-III) = .........
Case (ii)
For other combinations and dilutions
��������������� ��������
������� ������������������������ ����������������������� ��
= .........
Result
MPN/100 mL = .........
Test case
Presumptivetest 24 hrs
Presumptivetest 48 hrs
Confirmedtest 48 hrs
Completedtest 24 hrs
Completedtest 48 hrs
Number of + ve tubes
mL of sample in – ve tubes

90 A Comprehensive Laboratory Manual for Environmental Science and Engineering
Discussion
Questions
1. What are E.coli? Are they harmful to human beings? Why is their presence tested in the waters to besupplied for domestic consumption?
2. What is coliform index?3. Define MPN.

Test for Coliforms in Water 91

92 A Comprehensive Laboratory Manual for Environmental Science and Engineering

Aim
To determine the ammonia nitrogen of the given sample of water.
Principle
Colorimetric method, using Nessler’s reagent is sensitive to 20mg/L of ammonia N and may be used up to 5mg/Lof ammonia N. Turbidity, colour and substances precipitated by hydroxyl ion interfere with the determination. Thesample containing ammonia must be analysed immediately after collection; if not 0.8 M conc. H2SO4/L should beadded to the sample stored at 4°C.
Direct Nesslerisation
Direct Nesslerisation is used only for purified water, natural water and highly purified effluents, which have lowammonia concentration. In samples that have been properly clarified by a pretreatment method using zinc sulphateand sodium hydroxide, it is possible to obtain a measure of the amount of ammonia N by treatment with Nessler’sreagent, which is strongly alkaline solution of potassium mercuric iodide (K2HgI4). It combines with NH3 in alkalinesolution to form a yellowish brown colloidal dispersion, whose intensity of colour is directly proportional to theamount of NH3 present. The yellow colour or reddish brown colour typical of ammonia N can be measured in aspectrophotometer in the wavelength of 400–500 nm with a light path of 1cm.
Apparatus1. Spectrophotometer, or Nessler tube tall form (50 mL or 100 mL capacity)2. pH meter
Reagents1. Zinc sulphate solution 2. EDTA reagent as stabiliser3. Nessler’s reagent 4. Stock ammonium solution 1.00 mL = 1.00 mg
AMMONIA NITROGEN
Experiment No. ___________________ Date ___________________

94 A Comprehensive Laboratory Manual for Environmental Science and Engineering
Procedure1. Residual chlorine is removed by means of a dechlorinating agent (one or two drops sodium thiosulphate
solution)2. 100 mL ZnSO4 solution is added to 100 mL sample and to it is added 0.5 mL of NaOH solution to
obtain a pH of 10.5. This is mixed thoroughly.3. The floc formed is allowed to settle and the clear supernatent is taken for Nesslerisation.4. If the sample contain Ca or Mg, EDTA reagent is added to 50 mL of sample.5. To this is added 2 mL of Nessler’s reagent (proportional amount to be added (if the sample volume
is less).6. A blank using distilled ammonia free water is treated with Nessler’s reagent as above. The absorbance
is fixed as zero.7. Then the sample is put in 1cm standard tubes of spectrophotometer and the absorbance noted at 400–
500nm wavelengths.8. A calibration curve is prepared as follows:
With 0, 0.2, 0.4, 0.7, 1.0, 1.4, 1.7, 2.0, 2.5, 3.0, 4.0, 5.0 mL of standard NH4Cl solution in 50 mLdistilled water standard diluted samples are prepared.
9. Each sample is Nesslerised as indicated earlier and the absorbance is noted down.10. A graph with mg of NH3 along x-axis and absorbance along y-axis is plotted and a straight-line graph
is drawn.11. From the absorbance of a solution of unknown concentration, the µg of NH3 present can be read from
the calibration curve.
Calculation
ammonia N in mg/L =A
mL of sample
where, A = µg N found colorimetrically
Observation
The observation is presented in Tables A and B respectively.
Table A: Observation for calibration
Stock ammonia solution in mL Ammonia Absorbance

Ammonia Nitrogen 95
Table B
Results
Discussion
Sample no. Absorbance Ammonia nitrogen in µµµµµg Ammonia nitrogen in mgfrom graph
Sample no. or description Ammonia nitrogen in mg/L

96 A Comprehensive Laboratory Manual for Environmental Science and Engineering
Questions
1. Discuss the significance of ammonia nitrogen in water.2. What is the source of ammonia nitrogen in water?

Ammonia Nitrogen 97

98 A Comprehensive Laboratory Manual for Environmental Science and Engineering

Aim
To determine the nitrate nitrogen of the given sample of water.
Principle
The reaction with the nitrate and brucine produces yellow colour that can be used for the colorimetric estimation ofnitrate. The intensity of colour is measured at 410 nm. The method is recommended only for concentration of 0.1–2.0 mg/L –
3NO —N. All strong oxidising and reducing agent interfere. Sodium arsenite is used to eliminate interferenceby residual chlorine; sulphanilic acid eliminates the interferences by –
2NO —N and chloride interference is maskedby addition of excess NaCl. High concentration of organic matter also may interfere in the determination.
Apparatus
1. Spectrophotometer 2. Water bath3. Reaction tubes 4. Cool water bath
Reagents
1. Stock nitrate solution 2. Standard nitrate solution3. Sodium arsenite solution 4. Brucine-sulphanilic acid solution5. Sulphuric acid solution 6. Sodium chloride solution
Procedure
1. Nitrate standards are prepared in the range 0.1–1.0 mg/LN diluting 1.00, 2.00, 4.00, 7.00 and10.0 mL standard nitrate solution to 10 mL with distilled water.
2. If residual chlorine is present 1 drop of sodium arsenite solution is added for each 0.1 mg Cl2 and mixed.3. Set up a series of reaction tubes in test tube stand. Add 10 mL sample or a portion diluted to 10 mL
to the reaction tubes.4. Place the stand in a cool water bath and add 2 mL NaCl solution and mix well.5. Add 10 mL H2SO4 solution and again mix well and allow cooling.
NITRATE NITROGEN
Experiment No. ___________________ Date ___________________

100 A Comprehensive Laboratory Manual for Environmental Science and Engineering
6. The stand is then placed in a cool water bath and add 0.5 ml brucine-sulphanilic acid reagent. Swirlthe tubes and mix well and place the tubes in boiling water bath at temperature 95°C.
7. After 20 minutes, remove the samples and immerse in cool water bath.8. The sample are then poured into the dry tubes of spectrophotometer and read the standards and sample
against the reagent blank at 410 nm.9. Prepare a standard curve for absorbance value of standards (minus the blank) against the concentration
of –3NO N.
10. Read the concentration of –3NO N in the sample from the known value of absorbance.
Calculation
Nitrate N in mg/L =–3g NO – N
mL sampleµ
NO3 in mg/L = mg/L nitrate N × 4.43.
Observation
The observation are presented in Tables A and B respectively.
Table A: Observation for calibration
Table B
Stock nitrate solution in mL Nitrate Absorbance
Sample no. Absorbance Nitrate nitrogen in µµµµµg from graph Nitrate nitrogen in mg

Nitrate Nitrogen 101
Results
Discussion
Questions
1. In what forms does nitrogen normally occur in natural waters?2. Discuss the significance of nitrate nitrogen analysis in water pollution control.3. Differentiate between nitrite nitrogen and nitrate nitrogen.4. Discuss the application of nitrate nitrogen data.5. What are the various methods available for the determination of nitrate nitrogen?
Sample no. or description Nitrate nitrogen in mg/L

102 A Comprehensive Laboratory Manual for Environmental Science and Engineering

Aim
To determine the nitrite nitrogen of the given sample of water.
Principle
The nitrite concentration is determined through the formation of a reddish-purple azo dye produced at pH 2.0–2.5by the coupling of diazotised sulphanilic acid with N-(1-naphthyl)-ethylenediamine dihydrochloride.
Apparatus
1. Spectrophotometer
Reagents
1. Sulphanilamide reagent2. N-(1-naphthyl)-ethylenediamine dihydrochloride solution3. Hydrochloric acid (1+3)4. Stock nitrite solution5. Standard nitrite solution
Procedure1. To 50 ml clear sample neutralised to pH 7, add 1ml sulphanilamide solution.2. Allow the reagent to react for a period of 2–8 minute.3. Then add 0.1ml of 1-naphthyl ethylenediamine solutions and mix immediately.4. Measure the absorbance of the solution after 10 minute at 543 nm at 1cm light path.5. Prepare standard calibration curve as in any other case.6. By noting the absorbance of an unknown sample, the concentration of nitrate can be determined.
NITRITE NITROGEN
Experiment No. ___________________ Date ___________________

104 A Comprehensive Laboratory Manual for Environmental Science and Engineering
Calculation
Nitrite N in mg/L = mg Nitrite NmL of sample
Observation
The observation is presented in Tables A and B respectively.
Table A: Observation for calibration
Table B
Results
Stock nitrite solution in mL Nitrite Absorbance
Sample no. Absorbance Nitrite nitrogen in µµµµµg from graph Nitrite nitrogen in mg
Sample no. or description Nitrite nitrogen in mg/L

Nitrite Nitrogen 105
Discussion
Questions
1. Explain why sensitive colorimetric methods are needed for the determination of nitrite nitrogen.2. Explain the nitrogen cycle.3. What is the significance of determination of nitrite nitrogen in water?

106 A Comprehensive Laboratory Manual for Environmental Science and Engineering

Aim
To determine the Kjeldahl nitrogen of the given sample of water.
Principle
In the presence of sulphuric acid, potassium sulphate and mercuric sulphate catalyst, the amino nitrogen of manyorganic materials is converted to ammonium sulphate. After the mercury-ammonium complex, the digestible hasbeen decomposed by sodium thiosulphate, the ammonia is distilled from an alkaline medium and absorbed in boricacid. The ammonia is determined colorimetrically or by titration with a standard mineral acid.
Apparatus
1. Digestion apparatus of 800 mL capacity2. Distillation apparatus3. Spectrophotometer
Reagent1. All reagents listed for the determination of ammonia N2. Digestion reagent3. Phenolphthalein indicator4. Sodium hydroxide-sodium thiosulphate reagent5. Borate buffer solution6. Sodium hydroxide 6 N
Procedure
1. Place a measured sample into a digestion flask. Dilute the sample to 300 mL, and neutralise to pH 7.Sample size is determined as follows:
KJELDAHL NITROGEN
Experiment No. ___________________ Date ___________________

108 A Comprehensive Laboratory Manual for Environmental Science and Engineering
Sample size determination
Organic nitrogen in sample (mg/L) Sample size (mL)
0-1 500
1-10 250
10-20 100
20-50 50
50-100 25
2. Add 25 mL borate buffer and 6 N NaOH until pH 9.5 is reached.3. Add a few glass beads and boil off 300 mL.4. Cool and add carefully 50 mL digestion reagent. After mixing heat under a hood until the solution clean
to a pale straw colour.5. Digest for another 30 minute and allow the flask and contents cool.6. Dilute the contents to 300 mL and add 0.5 mL phenolphthalein solution.7. Add sufficient hydroxide-thiosulphate reagent to form an alkaline layer at the bottom of the flask.8. Connect the flashed to the steamed out distillation apparatus and more hydroxide-thiosulphate reagent.
If a red phenolphthalein colour fails to appear at this stage.9. Distilled and collect 200 mL distillate below the surface of boric acid solution. Extend the lip of condenser
well bellow the level of boric acid solution.10. Determine the ammonia as described earlier by taking 50 mL portion of the distillate.11. Carry out a similar procedure for a blank and apply the necessary correction.
Observation
The observation is presented in Tables A and B respectively.
Table A: Observation for calibration
Stock ammonia solution in mL Ammonia Absorbance

Kjeldahl Nitrogen 109
Table B
Calculation
Organic N in mg/L = A×1000 ×
mL of sample B and C
where, A = mg N found colorimetricallyB = mL of total distillate collected including H3BO3
C = mL of distillation taken for Nesslerisation.
Results
Discussion
Questions
1. What is the difference between Kjeldahl nitrogen and albuminoidal nitrogen?2. In which form the organic nitrogen exists in domestic wastewater?
Sample no. Absorbance Ammonia nitrogen in µµµµµg from graph Ammonia nitrogen in mg
Sample no. or description Organic nitrogen in mg/L

110 A Comprehensive Laboratory Manual for Environmental Science and Engineering

Aim
To determine the fluorides present in water.
Principle
Fluorides in excessive quantities and absence of fluorides in water, both create problems. A disfigurement in teethof humans known as mottled enamel or dental fluorosis is occured in those, who consume waters with fluoridecontent in excess of 1.0 mg/L. It has been scientifically established that 0.8–1.0 mg/L of fluorides is essential inpotable water. Thus, absence or low fluoride content may cause dental caries in the consumers.
Fluorides are measured by colorimetric methods. Fluorides are separated out by distillation, if interferingsubstances are present. Fluorides are analysed by a method that involves the bleaching of a performed colour bythe fluoride ion. The performed colour is the result of the action between zirconium ion and alizarin dye. The colourproduced is referred to a lake and the intensity of colour produced is reduced if the amount of zirconium present isdecreased. Fluoride ion combines with zirconium ion to form a stable complex ion ––
6ZrF , and the intensity of thecolour lake decreases accordingly. The reaction is as follows:
Zr_alizarin lake + 6F → alizarin + ––6ZrF
(reddish colour) (yellow)The bleaching action is the function of the fluoride ion concentration and is directly proportional to it. Thus,
Beer’s law is satisfied in and inverse manner.
Apparatus1. Spectrophotometer or colour comparator
Reagents1. Standard fluorides solution 1mL = 10µgF.2. Zirconyl-alizarin reagent.
DETERMINATION OF FLUORIDE IN WATER
Experiment No. ___________________ Date ___________________

112 A Comprehensive Laboratory Manual for Environmental Science and Engineering
3. Mixed acid solution.4. Acid-zirconyl-alizarin reagent.5. Sodium arsenite solution.
Procedure
1. If residual chlorine is present, remove the same by adding one drop of arsenite per 0.1 mg Cl and mix.2. Prepare a series of standard by diluting various volume of standard fluoride solution (1 ml =10 µgf)
to 100 mL in tubes. The range should be such that it is between 0 and 1.4 mg/L.3. To 50 mL of each standard add 10 mL mixed acid-zirconyl-alizarin reagent.4. Set the spectrophotometer to a wavelength of 570 nm.5. Adjust the spectrophotometer to zero absorbance with the reference solution i.e., distilled water with
reagent.6. Plot the concentration along x-axis and absorbance along y-axis and obtain a calibration curve.7. Take 50 mL of the sample and add 10 mL of mixed acid-zirconyl-alizarin reagent and mix well.8. Place the solution in the spectrophotometer and read the absorbance.9. By referring the calibration curve, the concentration for the observed absorbance is read out.
10. Repeat the procedure with dilute samples.
Observation
The observation is presented in Tables A and B respectively.
Table A: Observation for calibration
Stock fluoride solution in mL Fluoride Absorbance

Determination of Fluoride in Water 113
Table B
Calculation
F in mg/L = A×BV×C
where, A = µgF determinedB = sample dilute to this volumeC = portion taken for colour developmentV = mL of sample.
Results
Discussion
Sample no. Absorbance Fluoride in µµµµµg from graph Fluoride in mg
Sample no. or description Fluoride in mg/L

114 A Comprehensive Laboratory Manual for Environmental Science and Engineering
Questions
1. Discuss the significance of high fluorides in water supplies.2. Discuss the significance of low fluorides in water supplies.3. What is meant by fluoridation of water? How this can be done?4. Explain an economical defluoridation method for drinking water supplies.5. What are the various methods for the determination of fluoride in water?6. Discuss the application of fluoride data.

Determination of Fluoride in Water 115

116 A Comprehensive Laboratory Manual for Environmental Science and Engineering

Aim
To determine the acidity of the given sample of water.
Principle
Acidity of water is its quantitative capacity to neutralise a strong base to a designated pH. Strong minerals acids,weak acids such as carbonic and acetic and hydrolysing salts such as ferric and aluminium sulphates may contributeto the measured acidity. According to the method of determination, acidity is important because acid contributes tocorrosiveness and influences certain chemical and biological processes. It is the measure of the amount of baserequired to neutralise a given sample to the specific pH.
Hydrogen ions present in a sample as a result of dissociation or hydrolysis of solutes are neutralised by titrationwith standard alkali. The acidity thus depends upon the end point pH or indicator used. Dissolved CO2 is usuallythe major acidity component of unpolluted surface water. In the sample, containing only carbon dioxide-bicarbonate-carbonate, titration to pH 8.3 at 25°C corresponds to stoichiometric neutralisation of carbonic acid to carbonate.Since the colour change of phenolphthalein indicator is close to pH 8.3, this value is accepted as a standard endpoint for the titration of total acidity. For more complex mixture or buffered solution fixed end point of pH 3.7 andpH 8.3 are used. Thus, for standard determination of acidity of wastewater and natural water, methyl orangeacidity (pH 3.7) and phenolphthalein acidity (pH 8.3) are used.
Thus, in determining the acidity of the sample the volumes of standard alkali required to bring about colourchange at pH 8.3 and at pH 3.7 are determined.
Apparatus1. Burette 2. Pipette3. Erlenmeyer flasks 4. Indicator solutions
Reagents
1. CO2 free water2. Standard NaOH solution 0.02 N
DETERMINATION OF ACIDITY OF WATER
Experiment No. ___________________ Date ___________________

118 A Comprehensive Laboratory Manual for Environmental Science and Engineering
3. Methyl orange indicator solution4. Phenolphthalein indicator solution5. Sodium thiosulphate 0.1 N.
Procedure
1. 25 mL of sample is pipette into Erlenmeyer flask.2. If free residual chlorine is present, 0.05 mL (1 drop) of 0.1 N thiosulphate solution is added.3. 2 drops of methyl orange indicator is added.4. These contents are titrated against 0.02 N hydroxide solution. The end point is noted when colour change
from orange red to yellow.5. Then two drops of phenolphthalein indicator is added and titration continued till a pink colour just
develops. The volumes of the titrant used are noted down.
Observation
0.02 N NaOH × Sample (Methyl orange/phenolphthalein indicator)
Calculation
Acidity in mg/L as CaCO3 = A × B × 50,000V
where, A = mL of NaOH titrantB = normality of NaOHV = mL of the sample.
Description Trial Burette reading Volume ofof sample no. NaOH used A
lnitial Final

Determination of Acidity of Water 119
Results
Discussion
Questions
1. Discuss the source and nature of acidity.2. Discuss the significance of carbon dioxide and mineral acidity.3. Can the pH of a water sample be calculated from a knowledge of its acidity? Why?4. Can the carbon dioxide content of a wastewater sample known to contain significant concentrations
of acetic acid be determined by the titration procedure? Why?
Sample no. Acidity in mg/L as CaCO3

120 A Comprehensive Laboratory Manual for Environmental Science and Engineering

Aim
To determine the Chemical Oxygen Demand (C.O.D.) for given sample.
Principle
Potassium dichromate is a powerful oxidising agent in acidic medium and is obtained in high state of purity.The reaction involved is:
CnHaOb + cCr2O72– + 8cH+ = nCO2 +
����
� H2O + 2cCr3+
where, c = 2/3n + a/6 – b/3C.O.D. results are reported in terms of mg of oxygen. N/8 or 0.125 N solution of oxidising agent is used in the
determination. Normality double the strength is used. This allows the use of larger samples. Thus, each ml of0.25 N solution dichromate is equivalent to 2 mg of oxygen. An excess of oxidising agent is added, the excess isdetermined by another reducing agent such as ferrous ammonium sulphate. An indicator ferroin is used in titratingthe excess dichromate against ferrous ammonium sulphate. Blanks are used also treated and titrated to get thecorrect value of C.O.D.
Apparatus
1. Reflux apparatus 2. Burettes 3. Pipettes
Reagents
1. Standard potassium dichromate solution 0.25 N.2. Sulphuric acid reagent.3. Standard ferrous ammonium sulphate.4. Ferroin indicator solution.5. Mercuric sulphate.6. Sulphuric acid crystals.
DETERMINATION OF C.O.D. IN WATER
Experiment No. ___________________ Date ___________________

122 A Comprehensive Laboratory Manual for Environmental Science and Engineering
Procedure
1. Place 50.0 mL of sample in a 500 mL refluxing flask.2. Add 1g mercuric sulphate and a few glass beads.3. Add sulphuric acid to dissolve the mercuric sulphate and cool.4. Add 25.0 ml 0.25 N potassium dichromate solution and mix well.5. Attach the flask to the condenser and start the cooling water.6. Add the remaining acid reagent (70 mL) through the open end of condenser and mix well.7. Apply heat and reflux for 5 hours.8. Cool and wash down the condenser with distilled water.9. Dilute the mixture to about twice its volume and cool to room temperature.
10. Titrate the excess dichromate with standard ferrous ammonium sulphate using ferroin indicator (2 to 3drops).
11. The colour change from blue green to reddish indicates the end point.12. Reflux in the same manner a blank consisting of distilled water of equal volume as that of the sample.
Observation
Calculation
mg/L C.O.D. = 1 2(V – V ) N × 8000 ,V
where, V1 = mL ferrous ammonium sulphate used for blankV2 = mL ferrous ammonium sulphate used for sampleN = normality of ferrous ammonium sulphateV = volume of sample used.
Burette reading Volume of ferrous ammoniumsulphate
Initial Final
Sample
Blank

Determination of C.O.D. In Water 123
Results
Discussion
Questions
1. Differentiate between B.O.D. and C.O.D.2. Discuss the application of C.O.D. analysis in environmental engineering practice.3. What are the interferences during C.O.D. test? How this can be eliminated?4. Why ferroin is used as indicator in the C.O.D. test?5. Why 0.25 N standard dichromate solution is used in the test?
Sample no. C.O.D. in mg/L

124 A Comprehensive Laboratory Manual for Environmental Science and Engineering

Aim
To determine the quantity of oil and grease present in the given sample of water by partition gravimetric method.
Principle
The oil and grease contents of domestic and certain industrial wastes and the sludge, is of an important considerationin the handling and treatment of these material for ultimate disposal. Knowledge of the quality of the oil and greasepresent is helpful in proper design and operation of wastewater treatment system. The term grease applies to widevariety of organic substance that is extracted from aqueous solution or suspension by hexane. Hydrocarbons,esters, oils, fats, waxes and high molecular weight fatty acids are the major materials dissolved by hexane. All thesematerial have a greasy feel and are associated with the problems in wastewater treatment related to grease.
Three methods by which oil and grease are estimated are (i) the partition-gravimetric method(ii) partition infrared method, and (iii) the solvent extraction method. Though method (i) does not provide neededprecision, it is widely used for routine analysis of samples with high oil and grease contents because of its simplicityand no need of special instrumentation. In method (ii) adequate instrumentation allows for the measurements of aslittle as 0.2 mg oil and grease. Method (iii) is identical to gravimetric method but it is designed for the samples thatmight contain volatile hydrocarbons that otherwise would be lost in the solvent removal operation of gravimetricmethod.
In the Partition-Gravimetric method, dissolved or emulsified oil and grease is extracted from water by intimatecontact with trichlorotrifluoroethane; petroleum ether (40/60) or hexane.
Apparatus
Beaker, separating funnel, distilling flask, desiccators, vacuum pump.
Reagents
HCl, trichlorotrifluosoethane (freon).
DETERMINATION OF OIL AND GREASE
Experiment No. ___________________ Date ___________________

126 A Comprehensive Laboratory Manual for Environmental Science and Engineering
Procedure1. Collect about 1 litre of sample and mark sample level in bottle for latter determination of sample
volume. Acidity to pH 2 or lower; generally, 5 ml HCl is sufficient. Transfer to a separating funnel.Carefully rinse sample bottle with 30 ml trichlorotrifluoroethane and solvent washing to separatingfunnel.
2. Preferably shake vigorously for 2 minute. However, if it is suspected for stable emulsion shakes gently5 to 10 minute.
3. Let layer separate out, drain solvent layer through a funnel containing solvent– moistened filter paperinto a clean, evacuated distilling flask. If a clear solvent layer cannot be obtained, add 1g Na2SO4,if necessary.
4. Extract twice more with 30 ml solvent each time but first rinse sample container with solvent. Combineextracts in evacuated distilling flask and mash filter paper with an additional 10 ml to 20 ml solvent.
5. Distill solvent from distilling flask in a water bath at 70°C. Place flask on water bath at 70°C for15 minute and draw air through it with an applied vacuum for final 1 minute after the solvent hasevaporated. If the residue contains visible water, add 2 ml acetone evaporates on a water bath andrepeat the addition and evaporation until all visible water has been removed. Cool in a desiccatorsfor 30 minute and weigh it.
Precautions
No known solvent will dissolve effectively only oil and grease. Solvent removal results in the loss of short chainhydrocarbon and simple aromatic compound by volatilisation, and heavier residual of some effluents may containsignificant portion of material that are not extracted with the solvent.
Observation
Temperature of measurement =….....°CMass of evacuated flask =…………...gMass of evacuated flask + residue =………gMass of residue =……………mgVolume of sample =……..…mL
Calculation
The amount of oil and grease in the sample can be calculated as,Oil and Grease (mg/L) = (A – B) 1000/volume of the samplewhere, A = mass of evacuated flask and residue (g)
B = mass of evacuated flask (g)
Result
The amount of oil and grease in given water sample = …….. mg/L.

Determination of Oil and Grease 127
Discussion
Questions
1. Why is it important to remove oil and grease from water?2. What are the methods available to remove oil and grease from water?

128 A Comprehensive Laboratory Manual for Environmental Science and Engineering

Aim
To determine the odour of the given sample of water using human olfactory system.
Principle
The extent of odour present in a particular sample of water is measured by a term called odour intensity, which isrelated with the threshold odour. The threshold odour number represents the dilution ratio at which odour is hardlydetectable.
Apparatus
Measuring jar, pipettes etc.
Procedure
1. Take a known volume (A) of odorous water in a measuring jar.2. Gradually add odour free distilled water to the sample. Addition of water is continued till the sample
just lost its odour. Note down the total volume.
Observation and calculation
DETERMINATION OF ODOUR
Experiment No. ___________________ Date ___________________
Sample no. Trial no. Volume of odourous Diluted volume Threshold odourwater (A mL) (B mL) number (B/A)

130 A Comprehensive Laboratory Manual for Environmental Science and Engineering
Results
Sample no. Threshold odour number
Discussion
Questions
1. How odour can be controlled?2. Which instrument is used for odour determination?

Determination of Odour 131

132 A Comprehensive Laboratory Manual for Environmental Science and Engineering

Aim
To determine the colour of given sample of water by direct observation.
Principle
The standard unit of colour is the colour produced by dissolving 1mg of platinum cobalt in 1 litre distilled water.Different standard colour intensities of solutions are prepared by dissolving known amounts of platinum cobalt withdistilled water and the colour of sample is compared with the standard colour solutions.
Apparatus
Nessler tubes, volumetric flask, pipettes etc.
Procedure1. Take 0.1mg of platinum cobalt and dissolve in 100 mL distilled water.2. Take 1 mL, 2 mL, 3 mL etc. of this solution and dilute to 50 mL, such that we get solutions of
concentrations 1/50, 2/50, 3/50, (n/50) mg/L etc. These are the comparator solutions.3. Take the sample and the comparator solutions in the Nessler tubes and compare the colour.4. Note down the dilution of the comparator solution having the same colour as the sample.5. If corresponding colours are not developed, the sample may be diluted to get the corresponding colour.
DETERMINATION OF COLOUR
Experiment No. ___________________ Date ___________________

134 A Comprehensive Laboratory Manual for Environmental Science and Engineering
Results
Sample no. Colour unit in (mg/L)
Discussion
Sample no. Dilution factor of comparator Colour unit (mg/L) (= 50/n)solution (n/50)
Observation and calculation

Determination of Colour 135
Questions
1. Define the standard unit of colour.2. Briefly explain the causes of colour in water.3. Differentiate between “apparent” and “true” colour.4. What is the reason for keeping drinking water standard for colour?

136 A Comprehensive Laboratory Manual for Environmental Science and Engineering

APPENDIX–I. PREPARATION OF REAGENTS AND MEDIA
Reagents for various determinations are prepared as follows:
Alkalinity1. 0.02 N standard sulphuric acid: Prepare stock solution approximately 0.1 N by diluting 2.5 mL
concentrated sulphuric acid to 1 litre. Dilute 200 mL of the 0.1 N stock solution to 1 litre CO2 freedistilled water. Standardise the 0.02 N acid against a 0.02 N sodium carbonate solution which has beenprepared by dissolving 1.06 g anhydrous Na2CO3 and diluting to the mark of a 1 litre volumetric flask.
2. Methyl orange indicator: Dissolve 500 mg methyl orange powder in distilled water and dilute it to1 litre. Keep the solution in dark or in an amber coloured bottle.
3. Phenolphthalein indicator: Dissolve 5 g phenolphthalein in 500mL ethyl alcohol and add 500 mLdistilled water. Then add 0.02 N sodium hydroxide drop-wise until a faint-pink colour appears.
4. Sodium thiosulphate 0.1 N: Dissolve 25 g Na2S2O3.5H2O and dilute to 1 litre.
Hardness5. Ammonia buffer solution: Dissolve 16.9 g ammonium chloride (NH4Cl) in 143 mL concentrated
ammonium hydroxide (NH4OH). Add 1.25 g magnesium salt of EDTA and dilute to 250 mL with distilledwater. Do not store more than a month’s supply. Discard the buffer when 1 or 2 mL added to the samplefails to produce a pH of 10.0 ± 0.1 at the end point of titration. Keep the solution in a plastic or resistantglass container.
6. Eriochrome black T indicator: Mix 0.5 g Eriochrome black T dye with 4.5 g hydroxylaminehydrochloride. Dissolve this mixture in 100 ml of 95% ethyl or isopropyl alcohol.
7. Standard EDTA titrant 0.01 M: Weigh 3.723 g analytical reagent grade EDTA disodium salt(Na2H2C10H12O8N2) and dissolve in distilled water and dilute to 1litre.
Chloride8. Potassium chromate indicator: Dissolve 50 g potassium chromate (K2Cr2O4) in a little distilled water.
Add silver nitrate solution until a definite red precipitate is formed. Let stand for 12 hours, filter anddilute the filtrate to 1 litre with distilled water.
APPENDICES

138 A Comprehensive Laboratory Manual for Environmental Science and Engineering
9. Standard silver nitrate solution 0.0141 N: Dissolve 2.395 g AgNO3 in distilled water and dilute to1 litre. Standardise against 0.0141 N NaCl. Store in a brown bottle; 1 mL = 500 µg Cl2.
10. Standard sodium chloride 0.0141N: Dissolve 824.1 mg NaCl (dried at 140°C) in chloride free waterand dilute to 1 litre. 1mL = 500 µg Cl2 .
11. Aluminium hydroxide suspension: Dissolve 125 g aluminium potassium sulphate in 1 litre water. Warmto 60°C and add 55 mL concentrated NH4OH slowly with stirring. Let stand for 1 hour, transfer themixture to a large bottle. When freshly prepared the suspension occupies a volume of approximately1 litre.
Iron
12. Hydrochloric acid: Concentrated HCl.13. Hydroxylamine solution: Dissolve 10 g hydroxylamine hydrochloride salt (NH2OH.HCl) in 100 mL
distilled water.14. Ammonium acetate buffer solution: Dissolve 250 g ammonium acetate (NH4C2H3O2) in 150 mL
distilled water. Add 700 mL concentrated (glacial) acetic acid.15. Sodium acetate solution: Dissolve 200 g sodium acetate (NaC2H3O2.3H2O) in 800 mL distilled water.16. Phenanthroline solution: Dissolve 100 mg 1, 10-phenanthroline monohydrate (C12H8N2.H2O) in
100 mL distilled water by stirring and heating to 80°C. Do not boil. Discard the solution if it darkens.Heating is unnecessary if 2 drops of concentrated HCl are added to the distilled water. 1 mL of thisreagent is sufficient for no more than 100 µg Fe.
17. Stock iron solution: Add slowly 20 mL concentrated H2SO2 to 50 mL distilled water and dissolve1.404 g ferrous ammonium sulphate [Fe(NH4)2(SO4)2.6H2O]. Add 0.1 N KMnO4 drop wise until afaint-pink colour persists. Dilute to 1litre with iron free distilled water. Each 1 mL of this solution contains200 µg Fe.
18. Standard iron solution: Pipette 50 mL stock solution into 1 litre volumetric flask and dilute to the markwith distilled water. 1 mL = 10 µg Fe.
Manganese19. Special reagent: Dissolve 75 g mercuric sulphate (HgSO4) in 400 mL concentrated nitric acid (HNO3)
and 200 mL distilled water. Add 200 mL 85% phosphoric acid and 35 mg silver nitrate to the abovesolution. Dilute the cooled solution to 1 litre.
20. Ammonium persulphate: (NH4)2S2O3 solid.21. Standard manganese solution: Prepare a 0.1 N potassium permanganate (KMnO4) solution by
dissolving 3.2 g of KMnO4 in distilled water and making it up to 1 litre. Age for several days in sunlightor heat for several hours near the boiling point and then filter through fritted glass filter crucible andstandardise against sodium oxalate. Calculate the volume of this solution necessary to prepare 1 litresolution of such strength that 1mL = 50 µg Mn as follows:
mL KMnO4 =4
4.55Normality of KMnO
To this solution add 2 to 3 mL concentrated H2SO4 and sodium bisulphite solution(10 g NaHSO3 + 100 mL distilled water). Boil to remove excess SO2, cool and dilute to 1000 mL withdistilled water.
Appendices 139
Sulphate22. Conditioning reagent: Mix 50 mL glycerol with a solution containing 30 mL concentrated HCl,
300 mL distilled water, 100 mL 95% ethyl or isopropyl alcohol and 75 g NaCl.23. Barium chloride: Barium chloride crystals.24. Standard sulphate solution: Prepare a standard sulphate solution such that
1 mL = 100 µg SO4. Dissolve 147.9 mg anhydrous Na2SO4 in 500 mL distilled water and dilute to1 litre 1 mL = 100 µg SO4.
Sulphide25. Hydrochloric acid: Prepare a 6 N solution.26. Standard iodine solution 0.025 N: Dissolve 20–25 g potassium iodide in a little water and add
3.2 g iodine. After the iodine has dissolved, dilute to 1 litre and standardise against 0.025 N sodiumthiosulphate using starch as indicator.
27. Standard sodium thiosulphate 0.025 N: Dissolve 6.205 g sodium thiosulphate (Na2S2O3.5H2O) infreshly boiled and cooled distilled water and dilute to 1litre. Preserve by adding 5mL chloroform or0.4 g NaOH/L or 4 g borax and 5–10 mg HgI2/L. Standardise this with 0.025 N potassium dichromatesolution which is prepared by dissolving 1.226 g potassium dichromate in distilled water and dilutedto 1 litre.
28. Starch indicator: Add cold water suspension of 5 g soluble starch to approximately 800 mL boilingwater with stirring. Dilute to 1 litre, allow to boil for a few minutes and let settle overnight. Use supernatantliquor. Preserve with 1.25 g salicylic acid/litre or by the addition of a few drops of toluene.
Dissolved oxygen29. Manganous sulphate solution: Dissolve 480 g MnSO4.4H2O, 400 g MnSO2.2H2O or 364 g
MnSO4.H2O in distilled water, filter and dilute to 1 litre.30. Alkali-iodide-azide reagent: Dissolve 500 g NaOH or 700 g KOH and 135 g NaI or
150 g KI in distilled water and dilute to 1 litre. Add 10 g sodium azide (NaN3) dissolved in 40 mLdistilled water. The reagent should not give colour with starch when diluted and acidified.
31. Sulphuric acid concentrated: 1mL is equivalent to about 3 mL alkali-iodide-azide reagent.32. Standard sodium thiosulphate 0.025 N: Dissolve 6.205 g sodium thiosulphate (Na2S2O3.5H2O) in
freshly boiled and cooled distilled water and dilute to 1 litre. Preserve by adding 5 mL chloroform or0.4 g NaOH/L or 4 g borax and 5–10 mg HgI2/L. Standardise this with 0.025 N potassium dichromatesolution which is prepared by dissolving 1.226 g potassium dichromate in distilled water and diluted to1 litre.
33. Standard potassium dichromate solution 0.025 N: A solution of potassium dichromate equivalentto 0.025 N sodium thiosulphate contains 1.226 g/L K2Cr2O7. Dry K2Cr2O7 at 103°C for 2 hrs beforemaking the solution.
34. Standardisation of 0.025 N sodium thiosulphate solution: Dissolve approximately2 g KI in an Erlenmeyer flask with 100 to 150 mL distilled water. Add 10 mL of H2SO4, followedby exactly 20 mL, 0.1 N potassium dichromate solution. Place in the dark for 5 minutes, dilute toapproximately 400 mL and titrate with 0.025 N sodium thiosulphate solution, adding starch towardsthe end of titration. Exactly 20 ml 0.025 N thiosulphate will be consumed at the end of the titration.Otherwise, the thiosulphate solution should be suitably corrected.

140 A Comprehensive Laboratory Manual for Environmental Science and Engineering
35. Starch Indicator: Add cold water suspension of 5 g soluble starch to approximately 800 mL boilingwater with stirring. Dilute to 1 litre, allow to boil for a few minutes and let settle overnight. Use supernatantliquor. Preserve with 1.25 g salicylic acid/1 litre or by the addition of a few drops of toluene.
BOD36. Phosphate buffer solution: Dissolve 8.5 g potassium dihydrogen phosphate (KH2PO4), 21.75 g
dipotassium hydrogen phosphate (K2HPO4), 33.4 g disodium hydrogen phosphate heptahydrate(Na2HPO4.7H2O) and 1.7 g NH4Cl in about 500 ml distilled water and dilute to 1 litre. The pH ofthis buffer should be 7.2 without further adjustment. Discard the reagent if there is any sign of biologicalgrowth in the stock bottle.
37. Magnesium sulphate solution: Dissolve 22.5 g MgSO4.7H2O in distilled water and dilute to 1 litre.38. Calcium chloride solution: Dissolve 27.5 g anhydrous CaCl2 in distilled water and dilute to 1 litre.39. Ferric chloride solution: Dissolve 0.25 g FeCl3.6H2O in distilled water and dilute to 1 litre.40. Sodium sulphate solution 0.025 N: Dissolve 1.575 g anhydrous Na2SO3 in 1 litre distilled water.
This is to be prepared daily.41. Seeding: The standard seed material is settled domestic wastewater that has been stored at 20°C for
24 to 36 hours. A seed concentration of 1–2 mL/L is usually adopted.
Residual chlorine (OTA)42. Dissolve 1.35 g orthotolidine dihydrochloride in 500 mL distilled water: Add this solution with
constant stirring to a mixture of 350 mL distilled water and 150 mL concentrated hydrochloric acid.Store the solution in brown bottle.Always use an automatic, dropping or safety pipette to measure the necessary volume. Avoid inhalationor exposure to the skin.
Coliform test43. Lactose broth: Beef extract 3 g, peptone 5 g, lactose 5 g and reagent grade distilled water 1 litre.
Add these ingredients to reagent grade distilled water, mix thoroughly and heat to dissolve. pH shouldbe 6.8–7.0 after sterilisation.
44. Lauryl tryptose broth: Tryptose 20 g, lactose 5 g, K2HPO4 2.75 g, KH2PO4 2.75 g, NaCl 5 g,sodium lauryl sulphate 0.1 g, reagent grade distilled water 1 litre, sterilise and use. Add dehydratedingredients to water, mix thoroughly and heat to dissolve. pH should be 6.8 ± 2 after sterilisation.
45. Endo agar: Peptone 10 g, lactose 10 g, K2HPO4 3.5 g, agar 15 g, sodium sulphite 2.5 g, basic fuchsin0.5 g, distilled water 1 litre, pH 7.4 after sterilisation.
46. EMB agar: Peptone 10 g, lactose 10 g, K2HPO4 2 g, agar 15 g, eosin 0.4 g, methylene blue0.065 g, distilled water 1 litre, pH should be 7.1 after sterilisation.
47. Brilliant green lactose bile broth: Peptone 10 g, lactose 10 g, oxgall 20 g, brilliant green 0.0133 g,distilled water 1 litre, pH should be 7.2 after sterilisation and is then ready for use. Store away fromdirect sunlight to extend the reagent stability to 6 months.
Acidity48. NaOH solution 0.02 N: Dissolve 4 g NaOH in 1 litre water. This gives 0.1 N NaOH solution. Take
200 ml of this 0.1 N solution and make it up to 1 litre to obtain 0.02 N NaOH solution.

Appendices 141
49. Methyl orange indicator: Dissolve 500 mg methyl orange powder in distilled water and dilute it to1 litre.
50. Phenolphthalein indicator: Dissolve 5 g phenolphthalein disodium salt in distilled water and dilute to1 litre.
51. Sodium thiosulphate 0.1 N: Dissolve 25 g Na2S2O3.5H2O and dilute to 1 litre distilled water.
COD
52. Standard potassium dichromate solution 0.25 N: Dissolve 12.259 g K2Cr2O7 primary standardgrade previously dried at 103°C for 2 hours and dilute to 1 litre.
53. Sulphuric acid reagent: Concentrated H2SO4 containing 22 g silver sulphate per 4 kg bottle. Dissolve22 g Ag2SO2 in 4 kg bottle and keep it for 2 days. This is the reagent.
54. Standard ferrous ammonium sulphate 0.1 N: Dissolve 39 g Fe(NH4)2(SO4)2.6H2O in distilled water.Add 20 mL conc. H2SO4 and cool and dilute to 1 litre. Standardise this against the standard dichromatesolution. Dilute 10 mL standard K2Cr2O7 solution to about 100 mL. Add 30 mL conc. H2SO4 and cool.Titrate with ferrous ammonium sulphate titrant using 2–3 drops of ferroin indicator.
2 2 7
4 2 4 2
mL K Cr O ×0.25Normality =
mL Fe (NH ) (SO )
Ammonia N
55. Zinc sulphate solution: Dissolve 100 g ZnSO4.7H2O and dilute to 1 litre.56. EDTA reagent (stabiliser): Dissolve 50 g EDTA disodium salt in 60 mL of water containing 10 g
NaOH.57. Nessler’s reagent: Dissolve 100 g HgI2 and 70 g KI in a small quantity of water and add this mixture
slowly with stirring to a cool solution of 160 g NaOH in 500 mL water. Dilute to 1 litre and store inrubber stoppered pyrex glass out of sunlight.
58. Stock ammonia solution: Dissolve 3.811 g anhydrous NH4Cl dried at 100°C in water and dilute to1 litre. 1 mL = 1.00 mg N and 1.22 mg NH3.
Nitrate N59. Stock nitrate solution: Dissolve 721.8 mg anhydrous potassium nitrate and dilute to 1 litre with distilled
water. 1 mL = 0.1 mg N.60. Standard nitrate solution: Dilute 10 mL stock nitrate solution to 1 litre. 1 mL = 1 µg N61. Sodium arsenite solution: Dissolve 5.0 g NaAsO2 and dilute to 1 litre.62. Brucine-sulphanilic acid solution: Dissolve 1 g brucine sulphate and 0.1 g sulphanilic acid in about
70 mL of hot distilled water. Add 3 mL conc. HCl, cool and make up to 100 mL. This is stable forseveral months.
63. Sulphuric acid solution: Carefully add 500 mL conc. H2SO4 to 125 mL distilled water and cool toroom temperature.
64. Sodium chloride solution: Dissolve 300 g NaCl and dilute to 1litre with distilled water.

142 A Comprehensive Laboratory Manual for Environmental Science and Engineering
Nitrite N65. Sulphanilamide reagent: Dissolve 5 g sulphanilamide in a mixture of 50 mL conc. HCl and about
300 mL distilled water. Dilute to 500 mL with distilled water.66. N-(1-naphthyl)-ethylenediamine dihydrochloride solution: Dissolve 500 mg dihydrochloride in
500 mL distilled water. Store in a dark bottle.67. Hydrochloric acid: HCl (1+3)68. Stock nitrite solution: Dissolve 1.232 g NaNO2 in nitrite free water and dilute to 1 litre. Fresh nitrite
from bottle should be taken 1 mL = 250 mg N in the solution. Preserve with 1 mL chloroform.69. Standard nitrite solution: Standardise stock solution. Pipette 50 ml standard 0.05 N KMnO4, 5 mL
conc.H2SO4 and 50 mL stock nitrite solution in a glass stoppered flask. Discharge the permanganatecolour by ferrous ammonium sulphate solution of 0.05 N (19.607 g ferrous ammonium sulphate and20 mL conc.H2SO4 in 1 litre) strength. Carry nitrite free blank through the entire procedure and makenecessary corrections. Calculate the nitrite N content of stock solution by the following equation:
A = [(B × C) – (D × E)] × 7/Fwhere, A = mg/mL nitrite N in stock solution,
B = total mL standard KMnO4 used,C = normality of KMnO4 solution,D = total mL of standard Fe(NH4)2(SO4)2 used,E = normality of standard Fe(NH4)2(SO4)2,F = mL of stock NaNO2 solution taken for titration.
Each 1 mL of 0.05 N KMnO4 consumed by the nitrite corresponds to 1.729 µg NaNO2 or 350 µg N.
Organic Nitrogen (to find Kjeldahl Nitrogen)70. Digestion reagent: Dissolve 134 g K2SO4 in 650 mL ammonia free distilled water and 200 mL
conc.H2SO4. Add with stirring a solution prepared by dissolving 2 g red mercuric oxide (HgO) in 25 mL6N H2SO4. Dilute the combined solution to 1 litre.
71. Sodium hydroxide-sodium thiosulphate reagent: Dissolve 500 g NaOH and 2 g Na2S2O3.5H2Oin ammonia free distilled water and dilute to 1 litre.
72. Borate buffer solution: Add 88 mL 0.1N NaOH solution to 500 mL 0.025 M sodium tetraborate(Na2B4O7) solution (5 g Na2B4O7 in 1 litre) and dilute to 1 litre.
73. Sodium hydroxide 6 N: Dissolve 240 g NaOH in 1 litre ammonia free distilled water.74. Standard iodine 0.1 N: Dissolve 40 g KI in 25 ml distilled water, add 13 g resublimed iodine and
stir until dissolved. Transfer to 1 litre volumetric flask and dilute to the mark.
Fluoride75. Standard fluoride solution: Dissolve 221 mg anhydrous sodium fluoride in distilled water and dilute
to 1 litre. 1 mL = 100 µg F. This is the stock solution. Pipette 100 mL stock solution and make it upto 1 litre with distilled water to obtain standard solution 1ml = 10 µg F.
76. Zirconyl-alizarin reagent: Dissolve 300 mg zirconyl chloride octahydrate (ZrOCl2.8H2O) in 50 mLdistilled water contained in 1 litre glass stoppered volumetric flask. Dissolve 70 mg of 3-alizarin sulphonicacid sodium salt (also called alizarin red S) in 50 mL distilled water and pour slowly into the zirconylsolution while stirring. The resulting solution clears on standing for a few minutes.
77. Mixed acid solution: Dilute 101 mL conc. HCl to approximately 400 mL with distilled water. Addcarefully 33.3 mL conc. H2SO4 to approximately 400 mL distilled water. After cooling, mix the two acids.
78. Acid-zirconyl-alizarin reagent: To the clear zirconyl-alizarin reagent in 1 litre volumetric flask, addthe mixed acid solution and distilled water to the mark and mix. The reagent changes in colour fromred to yellow within an hour.

Appendices 143
APPENDIX–II. STANDARDS FOR DRINKING WATER
Requirements Acceptable Cause for rejection*
Physical1. Turbidity (Turbidity Units) 2.5 102. Colour units on platinum cobalt scale 5 253. Taste and odour Not objectionable
Chemical1. pH 7 to 8.5 Less than 6.5 or
greater than 9.22. Total solids mg/L 500 15003. Total Hardness (as CaCO3) mg/L 200 6004. Calcium (as Ca) mg/L 75 2005. Magnesium (as Mg) mg/L 30 1506. Iron (as Fe) mg/L 0.1 17. Manganese (as Mn) mg/L 0.05 0.58. Copper (as Cu) mg/L 0.05 1.59. Zinc (as Zn) mg/L 5.0 15
10. Chlorides (as Cl) mg/L 200 100011. Sulphates (as SO4) mg/L 200 40012. Phenolic substances (as Phenol) mg/L 0.001 0.00213. Fluorides (as F) mg/L 1.0 2.014. Nitrates (as NO3) mg/L 45 45
Toxic substances1. Arsenic (as As) mg/L 0.05 0.052. Chromium (as hexavalent) mg/L 0.05 0.053. Cyanides (as CN) mg/L 0.05 0.054. Lead (as Pb) mg/L 0.1 0.15. Selenium (as Se) mg/L 0.01 0.01
Ratio activity1. Alpha emitters, µc/mL 10–9 10–9
2. Beta emitters, µc/mL 10–8 10–8
Bacteriological quality1. MPN index of coliform bacteria Should be zero or less 10 per 100 mL **
than 1* Figures in excess of the permissive while not acceptable may still be tolerated in the absence of alternative and better sources, but
up to the limits designated, above which the supply will not be acceptable.** Occasionally, the samples may show an MPN index 3 to 10 per 100 mL provided this does not occur in consecutive samples. When
consecutive samples show an MPN index exceeding 8 per 100 mL additional samples should be collected promptly from the samplingpoint and examined without delay. This should be done daily until the MPN index of samples collected on two successive days iswithin the acceptable limits. If necessary, samples should also be taken from several other points such as the service reservoirs,distribution systems pumping stations and treatment plant and examined for coliforms. In addition, the operation of all treatmentprocess should be checked and remedial measures taken if necessary. When the results obtained over a period of one month areconsidered, not more than 10% of the samples examined during the period should have shown an MPN index of coliforms greaterthan 1 per 100 mL.

144 A Comprehensive Laboratory Manual for Environmental Science and Engineering
APPENDIX–III. MPN TABLE
No. of tubes giving positive reaction out of MPN index 95% confidence limits3 of 10 mL 3 of 1mL 3 of 0.1 mL per 100 mL Lower Upper
each each each
0 0 0 <10 0 1 3 <0.5 90 1 0 3 <0.5 121 0 0 4 <0.5 201 0 1 7 1.0 211 1 0 7 1.0 231 1 1 11 3.0 361 1 0 11 3.0 362 0 0 9 1.0 362 0 1 14 3.0 372 1 0 15 3.0 442 1 1 20 7.0 822 2 0 21 4.0 472 2 1 28 10.0 1503 0 0 23 4.0 1203 0 1 39 7.0 1303 0 2 64 15.0 3803 1 0 43 7.0 2103 1 1 75 14.0 2303 1 2 120 30.0 3803 2 0 93 15.0 3803 2 1 150 30.0 4403 2 2 210 35.0 4703 3 0 240 36.0 13003 3 1 460 71.0 24003 3 2 1100 150.0 4800
3 3 3 >2400
1. If instead of portions of 10, 1 and 0.1 mL, a combination of 100,10 and 1 mL is used then the MPN is recorded as 0.1 times the valuegiven in the table.
2. For 1, 0.1 and 0.01 combination then 10 times the value in the table should be used.3. For 0.1, 0.01 and 0.001 combination, 100 times the value given in the table should be used.