a comprehensive approach to storm water asset management planning · 2016-05-10 · a comprehensive...
TRANSCRIPT

A Comprehensive Approach to Storm
Water Asset Management Planning
Steve McLaughlin, PE
April 2016
City of Virginia Beach – Public Works Operations

Agenda

City of Virginia Beach, VA
• Population: 450,000
• 250 Square Miles
• 1,200 miles Pipe
• 5,000 outfalls (1/2 to Chesapeake Bay)
• 160 miles Off Road Ditches
• 450 miles Roadside Ditches
• 15 Pump Stations
• 776 Lakes to inspect; 491 Lakes to maintain
• 58 Dams/Spillways

FY17 Proposed Revenue
• ERU Daily Fee = $0.433
• ERU Annual Fee = $158.48
• ERU’s (FY 17) = 248,723
• SWU Generates $39,417,213 Annually
ERU = Equivalent
Residential Unit
Stormwater Fee,
$39,417,213
Other, $442,470
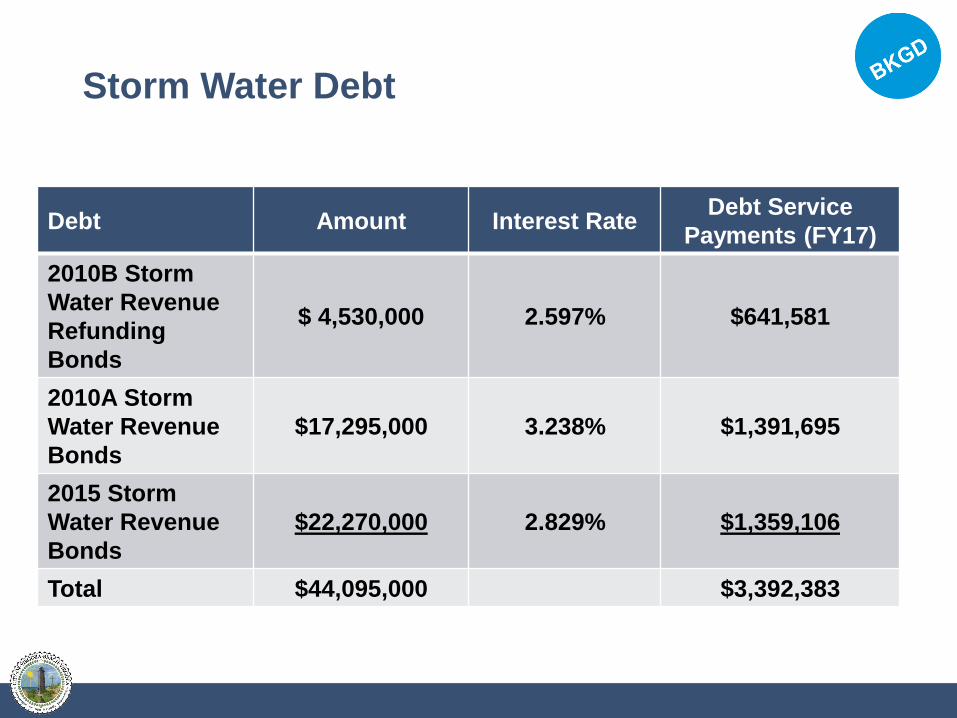
Storm Water Debt
Debt Amount Interest RateDebt Service
Payments (FY17)
2010B Storm
Water Revenue
Refunding
Bonds
$ 4,530,000 2.597% $641,581
2010A Storm
Water Revenue
Bonds
$17,295,000 3.238% $1,391,695
2015 Storm
Water Revenue
Bonds
$22,270,000 2.829% $1,359,106
Total $44,095,000 $3,392,383

Storm Water FY 2017-22 Funding
Operations & Maintenance
$88.6 M65%
Water Quality$18.1 M
13%Flood Control
$29.5 M22%

Storm Water FY 2017-22
Requested Program – O&M
Project CIP FY 2017-22
Total Budget
7416000 SW Infrastructure Rehabilitation & Improvements II 56,172,866 34,300,000
7026000 Residential Drainage Cost Participation Program II 450,000 300,000
7023000 Primary System Infrastructure Improvements II 17,430,000 13,620,000
7411000 Oceanfront Storm Water Facilities Maintenance 5,708,000 4,500,000
7412000 Stormwater Pump Station Modifications 7,416,889 5,000,000
7415000 Lake Management II 47,031,404 29,985,912
7034000 Stormwater Operations Modular Building 890,000 400,000
7200000 Severe Repetitive Loss Grant Program 1,847,009 0
7032000 Flood Mitigation Assistance Grant Program 1,227,144 0
Report Total 138,173,312 88,105,912
GovMax V5 1/12/2016

Program Background

Storm Water CIP Section O&M
7-416 SW Infrastructure Rehabilitation
& Improvements II
Neighborhood Pipe Rehabilitation Accomplishments:
Neighborhood Constr. Cost Phase
Princess Anne Plaza FY13 $5.5M Complete
Aragona FY14 $2.8M Complete
Green Run FY15/16 $2.8M Complete
Glenwood FY16 $1.8M Construction
Pine Ridge/Hunt
Club/Middle
Oaks/Strawbridge
FY17 $1.1M Construction
Kings Grant FY17 $2M Design
Total: $16M
Neighborhood Constr. Cost Est.
Magic Hollow FY17 $2M 1970s
Fairfield FY18 $2M 1970s
Southgate FY18 $1M 1980s
Ocean Lakes FY19 $2M 1980s
Windsor Woods FY19 $2M 1960s
Indian Lakes FY20 $2M 1970s
Salem Woods FY20 $2M 1980s
Salem Lakes FY21 $1M 1980s
Red Mill Farms FY21 $2M 1980s
Lagomar FY21 $1M 1980s
Malibu FY22 $1M 1960s
Foxfire FY22 $1M 1990s
Courthouse
Estates FY22 $2M 1990s
Upcoming Neighborhood Pipe
Rehabilitation Projects:

7-416 SW Infrastructure
Rehabilitation & Improvements II - $5.5M
Current/Completed Major
Neighborhood Rehabs:
Neighborhood Constr. Cost Phase
Princess Anne Plaza FY13 $5.5M Complete
Aragona FY14 $2.8M Complete
Green Run FY15/16 $2.8M Complete
Glenwood FY16 $1.8M Construction
Pine Ridge/Hunt Club/
Middle Oaks/StrawbridgeFY17 $1.1M Construction
Kings Grant FY17 $2.0M Design
Magic Hollow FY17 $2.0M CCTV
Total: $18M
Green Run Pipe Lining
Green Run Pole Grouting

Program Overview
1. Methodology
4. Apply 2. Implement
3. Results
Goals

Pro
babili
ty o
f F
ailu
re
Consequence of Failure
RISK BASED
Methodology

Citizens
Cave-In Notification Methods
City StaffOther Projects
MethodologyPrioritization Score Factors
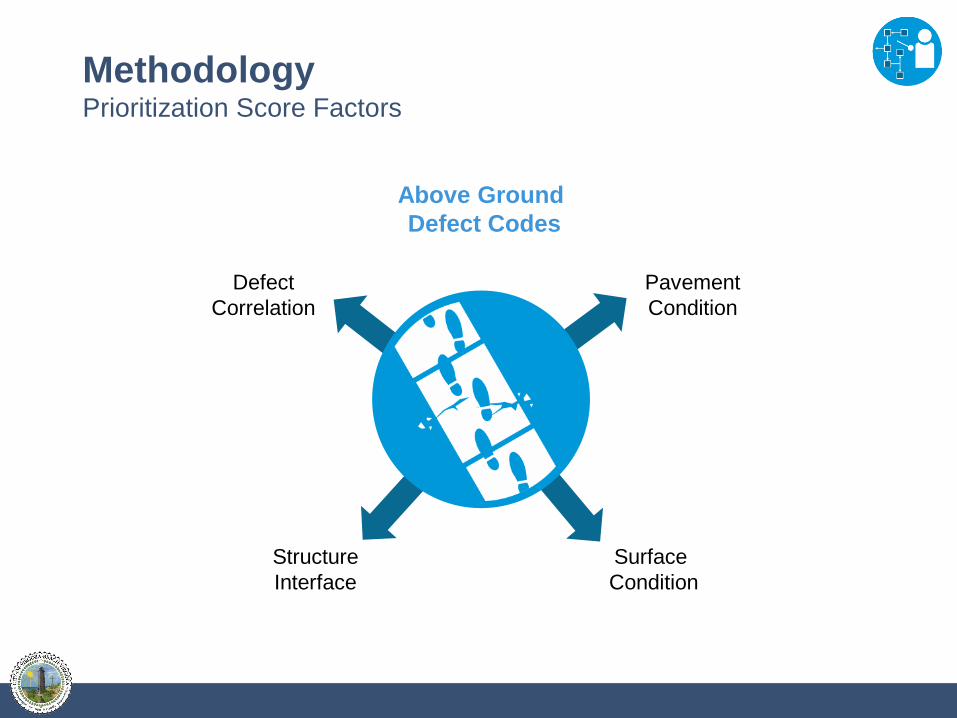
Above Ground
Defect Codes
Pavement
Condition
Surface
Condition
Defect
Correlation
Structure
Interface
MethodologyPrioritization Score Factors

Risk
Modifiers
Roadway
Type
RoadwayType
Pipe
Material
Pipe
Size
Geographic
MethodologyPrioritization Score Factors
Descriptor Modifier Risk Modifier
Roadway
Arterial
Collector
Local
5
4
3
Geographical
Tidal Influence
School
Park
Sidewalk
3
5
5
3
Pipe Diameter
<18”
18” – 48”
>48”
1
3
5
Pipe Material
RCP
CMP
CHDPE
1
5
5
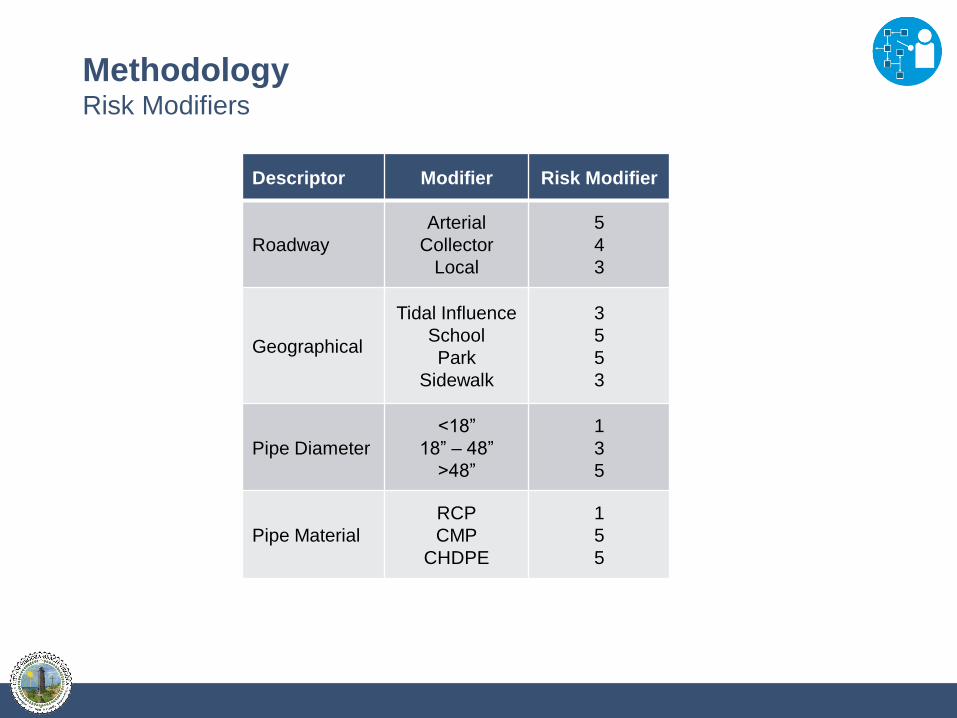
MethodologyRisk Modifiers
Risk Modifier
Descriptor Modifier Risk Modifier
Roadway
Arterial
Collector
Local
5
4
3
Geographical
Tidal Influence
School
Park
Sidewalk
None
3
5
5
3
1
Pipe Diameter
<18”
18” – 48”
>48”
1
3
5
Pipe Material
RCP
CMP
CHDPE
1
5
5
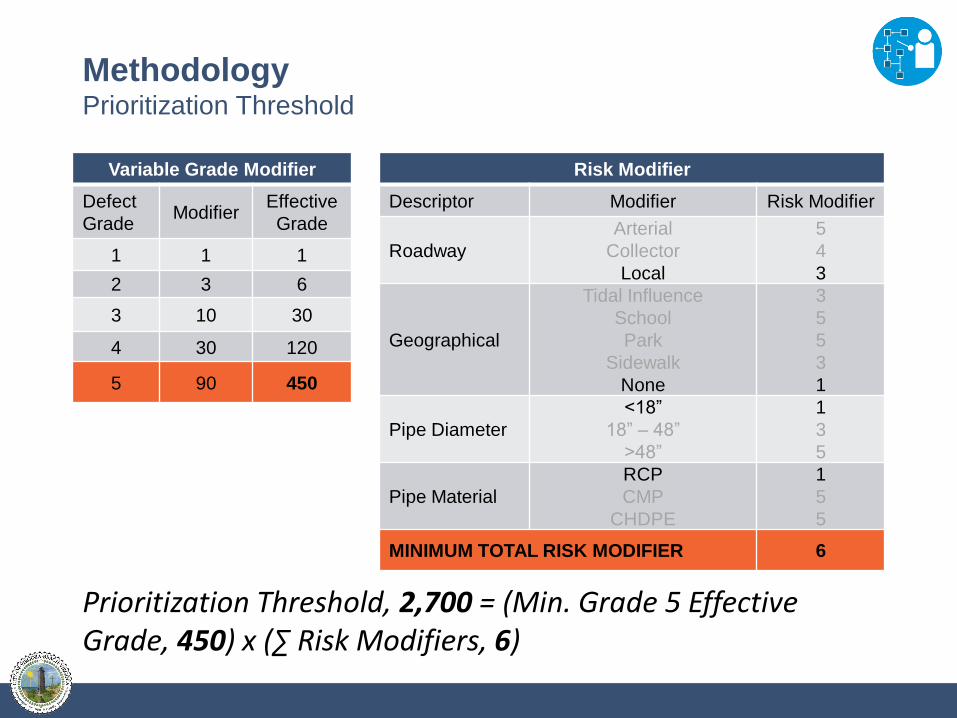
MINIMUM TOTAL RISK MODIFIER 6
MethodologyPrioritization Threshold
Variable Grade Modifier
Defect
GradeModifier
Effective
Grade
1 1 1
2 3 6
3 10 30
4 30 120
5 90 450
Prioritization Threshold, 2,700 = (Min. Grade 5 Effective Grade, 450) x (∑ Risk Modifiers, 6)

Methodology
Quantitative Risk Analysis
Improvement Prioritization
Risk Threshold
Methodology

Green Run
100,000 LFT
Glenwood
105,000 LFT
Pine Ridge
40,000 LFT
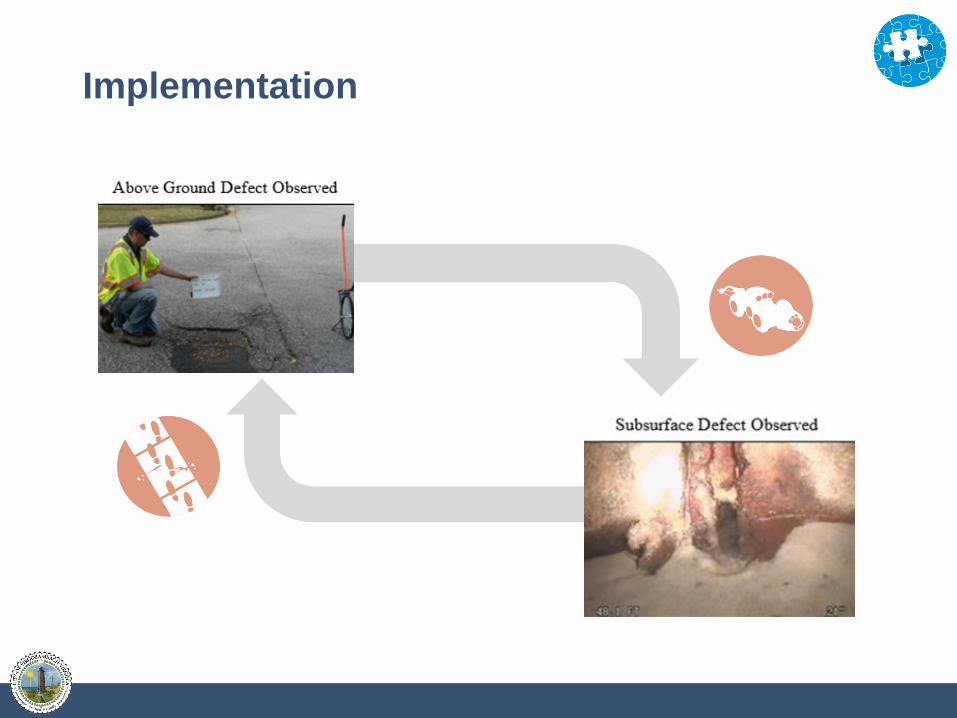
Implementation

Implementation
Above Ground
Defect Codes
Field 2-Person Crew Document
Defects
Immediate
Concerns
Daily
Record

Implementation
Cave-in Failure Factors
Office - CCTV Reviewers In-House
Review Software
Document
Defects
Preliminary
Repair Methods
Implementation

Implementation
Risk
Modifiers
Office/Field GIS Data Field
Observation
Institutional
Knowledge
Preliminary
Repair Methods
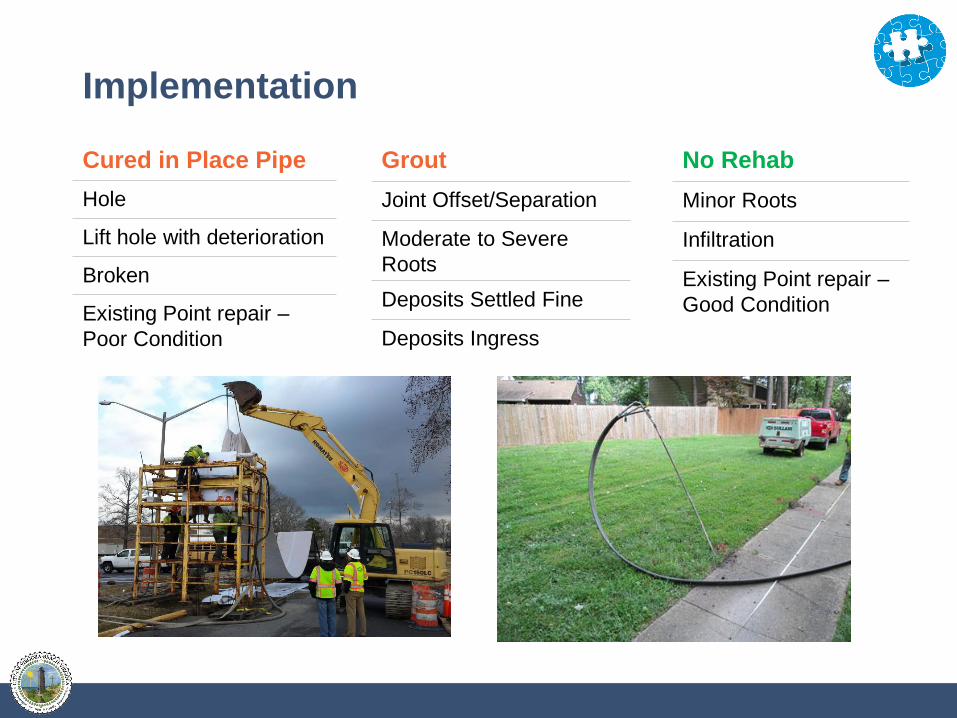
Cured in Place Pipe
Hole
Lift hole with deterioration
Broken
Existing Point repair –
Poor Condition
Implementation
No Rehab
Minor Roots
Infiltration
Existing Point repair –
Good Condition
Grout
Joint Offset/Separation
Moderate to Severe
Roots
Deposits Settled Fine
Deposits Ingress
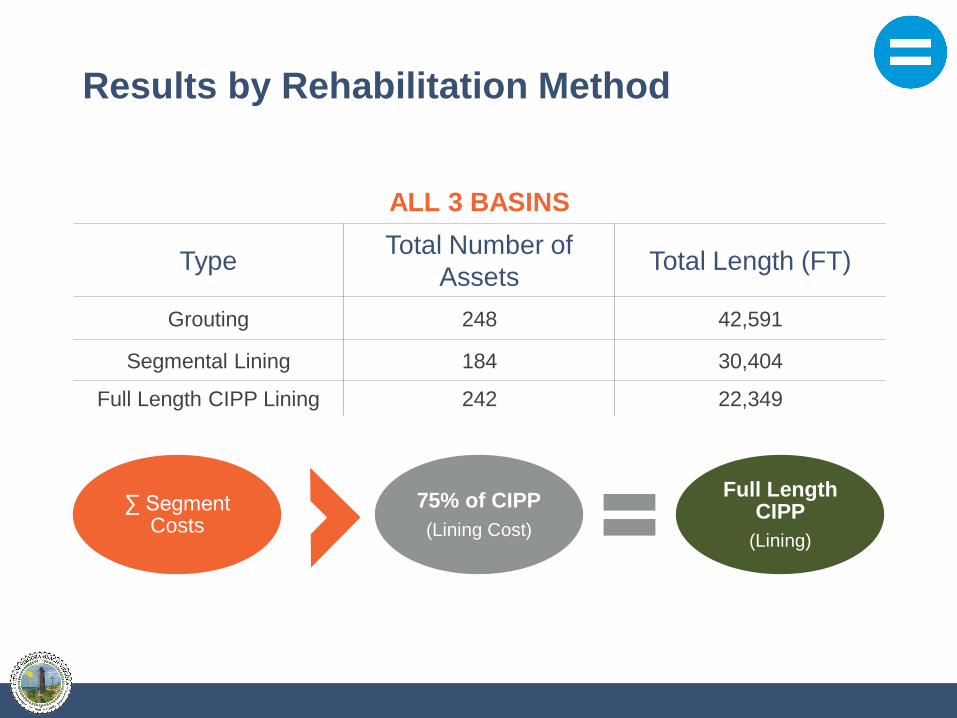
Results by Rehabilitation Method
∑ Segment Costs
75% of CIPP
(Lining Cost)
Full Length CIPP
(Lining)
ALL 3 BASINS
TypeTotal Number of
AssetsTotal Length (FT)
Grouting 248 42,591
Segmental Lining 184 30,404
Full Length CIPP Lining 242 22,349

Results Of Assets By BasinP
robabili
ty o
f F
ailu
re
Consequence of Failure

Results Summary – All 3 Basins

Rehabilitation
Glenwood
29,693 LFT
At Construction
Rehabilitation
Pine Ridge
10,297 LFT
At Construction
Condition AssessmentKings Grant37,000 LFT
At Design
What’s Happening Now?

Benefits Of Program
• Reduce Cave-ins and Improve Safety
• Extend Useful Life of Assets
• Defendable, Analytical Approach
• Efficient Use of Capital Funding to Stretch Public
Funding

THANK YOU…
Steve McLaughlin, PE
City of Virginia Beach – Public Works Stormwater Operations Manager
757.385.1470
QUESTIONS?
