a component u the c new york - comptroller.nyc.gov · new york city school construction authority a...
TRANSCRIPT

NEW YORK CITY SCHOOL
CONSTRUCTION AUTHORITY
A COMPONENT UNIT OF THE CITY OF NEW YORK
Financial Statements(Together with Independent Auditors’ Report)
Years Ended June 30, 2015 and 2014

New York City School Construction Authority
FINANCIAL STATEMENTS(Together with Independent Auditors’ Report)
YEARS ENDED JUNE 30, 2015 AND 2014
CONTENTS
Page
Independent Auditors' Report .........................................................................................................................................1-2
Management’s Discussion and Analysis (Unaudited) ...................................................................................................3-9
Basic Financial Statements as of and for the Years Ended June 30, 2015 and 2014:
Government-wide Financial Statements
Statements of Net Position........................................................................................................................................... 10
Statements of Activities ................................................................................................................................................ 11
Governmental Fund Financial Statements
Governmental Fund Balance Sheets........................................................................................................................... 12 Governmental Fund Statements of Revenues, Expenditures and Changes in Fund Balance................................... 13
Reconciliations of the Governmental Fund Balance Sheets to the Statements of Net Position ................................ 14
Reconciliations of the Governmental Fund Statements of Revenues, Expenditures and Changes in Fund Balance to the Statements of Activities .................................................................................................... 15
Notes to Financial Statements ................................................................................................................................16-35
Required Supplementary Information (Unaudited):
Schedule of Funding Progress for the Other Postemployment Benefits Plan............................................................ 37
Schedule of the Authority’s Proportionate Share of the Net Pension Liability ............................................................ 38
Schedule of Contributions............................................................................................................................................ 39

!"#$% &"'()* ++& ,(- ./#$ 01)2345 6*1#7 89(':( ;"%*1'<)/'= >0,(- ./#$= ,. ?@@?A ,(- B(#%(2& C?CD5@ED44@@ +/'< F%G"'7H C?CDEA@DEA5I ;(%)J*(%)(#---DK"#$%L"'()*DJ/K 0"2K"' F%G"'7%
INDEPENDENT AUDITORS’ REPORT
To the Members of the Board of Trustees of the New York City School Construction Authority
We have audited the accompanying financial statements of the governmental activities of the New York City School Construction Authority (the “Authority”), a component unit of The City of New York, which comprise the government wide statement of net position as of June 30, 2015 and the statement of activities for the year then ended, and the governmental fund balance sheet as of June 30, 2015 and the statement of revenues, expenditures and changes in fund balance for the year then ended, and the related notes to the financial statements.
Management’s Responsibility for the Financial Statements
Management is responsible for the preparation and fair presentation of these financial statements in accordance with accounting principles generally accepted in the United States of America; this includes the design, implementation, and maintenance of internal control relevant to the preparation and fair presentation of financial statements that are free from material misstatement, whether due to fraud or error.
Auditors’ Responsibility
Our responsibility is to express an opinion on these financial statements based on our audit. We conducted our audit in accordance with auditing standards generally accepted in the United States of America. Those standards require that we plan and perform the audit to obtain reasonable assurance about whether the financial statements are free of material misstatement.
An audit involves performing procedures to obtain audit evidence about the amounts and disclosures in the financial statements. The procedures selected depend on the auditor’s judgment, including the assessment of the risks of material misstatement of the financial statements, whether due to fraud or error. In making those risk assessments, the auditor considers internal control relevant to the entity’s preparation and fair presentation of the financial statements in order to design audit procedures that are appropriate in the circumstances, but not for the purpose of expressing an opinion on the effectiveness of the entity’s internal control. Accordingly, we express no such opinion. An audit also includes evaluating the appropriateness of accounting policies used and the reasonableness of significant accounting estimates made by management, as well as evaluating the overall presentation of the financial statements.
We believe that the audit evidence we have obtained is sufficient and appropriate to provide a basis for our audit opinion.
Opinion
In our opinion, the financial statements referred to above present fairly, in all material respects, the respective financial position of the governmental activities of the New York City School Construction Authority as of June 30, 2015, and the respective changes in financial position thereof for the year then ended in accordance with accounting principles generally accepted in the United States of America.

2
Prior Period Financial Statements
The financial statements of the Authority as of and for the year ended June 30, 2014, were audited by other auditors whose report dated October 29, 2014 expressed an unmodified opinion on those statements.
Other Matters
Required Supplementary Information
Accounting principles generally accepted in the United States of America require that the management’s discussion and analysis on pages 3 through 9, the schedule of funding progress for the other postemployment benefits plan on page 37, the schedule of the Authority’s proportionate share of the net pension liability on page 38, and the schedule of contributions on page 39, be presented to supplement the basic financial statements. Such information, although not a part of the basic financial statements, is required by the Governmental Accounting Standards Board, who considers it to be an essential part of financial reporting for placing the basic financial statements in an appropriate operational, economic, or historical context. We have applied certain limited procedures to the required supplementary information in accordance with auditing standards generally accepted in the United States of America, which consisted of inquiries of management about the methods of preparing the information and comparing the information for consistency with management’s responses to our inquiries, the basic financial statements, and other knowledge we obtained during our audit of the basic financial statements. We do not express an opinion or provide any assurance on the information because the limited procedures do not provide us with sufficient evidence to express an opinion or provide any assurance.
New York, NYOctober 20, 2015

New York City School Construction Authority Management’s Discussion and Analysis As of and for the Years Ended June 30, 2015 and 2014 (Unaudited)
3
OVERVIEW OF THE FINANCIAL STATEMENTS The following is a narrative overview and analysis of the financial activities of the New York City School Construction Authority (the “Authority”) as of June 30, 2015 and 2014 and for the years then ended. It should be read in conjunction with the Authority’s government-wide financial statements, governmental fund financial statements and the notes to the financial statements. The financial statements consist of four parts: (1) management’s discussion and analysis (this section); (2) the government-wide financial statements; (3) the governmental fund financial statements; and (4) the notes to the financial statements. The government-wide financial statements, which include the statements of net position and the statements of activities, are presented to display information about the Authority as a whole, in accordance with Governmental Accounting Standards Board (“GASB”) standards. This is to provide the reader with a broad overview of the Authority’s finances. The government-wide financial statements are prepared using the economic resources measurement focus and the accrual basis of accounting. Accordingly, revenue is recognized when earned and expenses are recorded when a liability is incurred, regardless of the timing of cash flows. The Authority’s governmental fund financial statements are presented using the current financial resources measurement focus and the modified accrual basis of accounting. Under the modified accrual basis of accounting, revenues and assets are recognized when measurable and available to finance operations of the current period; expenditures and liabilities are recognized upon receipt of goods and services to the extent that they will be liquidated with expendable available resources.
The reconciliations of the governmental fund balance sheets to the statements of net position and reconciliation of the governmental fund statements of revenues, expenditures and changes in fund balances to the statements of activities are presented to assist the reader in understanding the differences between government-wide and governmental funds financial statements. OVERVIEW OF THE ORGANIZATION The Authority, a public benefit corporation reported as a blended component unit of The City of New York (the “City”), was created by the State of New York Legislature in December 1988. The Authority’s responsibilities as defined in the enabling legislation are the design, construction, reconstruction, improvement, rehabilitation and repair of New York City public schools. The Authority’s capital projects include: new construction; building additions; major modernization and rehabilitation; construction, reconstruction or renovation of athletic fields, playgrounds and pools; and system replacements, including electrical, plumbing, elevators, roofs, security devices and system installation. The Authority is governed by a three member Board of Trustees. The Mayor of the City appointed the School’s Chancellor, to serve as the Chair of the Board of Trustees, and the other two trustees.
The Authority’s operations are funded by appropriations made by the City. All of the Authority’s net position is the property of the City. Appropriations are based on a five-year capital plan, developed by the New York City Department of Education (the “DoE”).
Resource flows between the Authority and the City and DoE, have been reported as revenues and expenses/expenditures in the Authority’s financial statements. Management believes that this presentation is most useful for the intended users of these financial statements, although this treatment is most often used when presenting the activities of a discretely presented component unit. The presentation of these activities as a net fund transfer was deemed to provide less useful information.

New York City School Construction Authority Management’s Discussion and Analysis As of and for the Years Ended June 30, 2015 and 2014 (Unaudited)
4
GOVERNMENT-WIDE FINANCIAL STATEMENTS RESULTS OF OPERATIONS The following chart summarizes the government-wide financial activities in the statement of activities of the Authority as of June 30, 2015, 2014 and 2013 (amounts are in thousand): Revenues
Operating revenues from the City of New York 2,481,238$ 2,001,076$ 1,696,080$ 480,162$ 304,996$
Operating revenues for DoE payments 192,903 189,273 144,081 3,630 45,192
Total Revenues 2,674,141 2,190,349 1,840,161 483,792 350,188
Expenses
Pollution Remediation costs 129,939$ 145,424$ 127,139$ (15,485)$ 18,285$
Transfer of completed contracts to the DoE 2,048,300 2,290,632 2,095,527 (242,332) 195,105
Pension expense - net of payments capitalized (4,181) 1,029 10,618 (5,210) (9,589)
Operating transfers to the DoE 192,903 189,273 144,081 3,630 45,192
Total Expenses 2,366,961 2,626,358 2,377,365 (259,397) 248,993
Other revenues and expenses, net 4,115 25,288 31,681 (21,173) (6,393)
Change in net position 311,295 (410,721) (505,523) 722,016 94,802
Net position - beginning of the year 1,679,939 2,090,660 2,666,698 (410,721) (576,038)
Restatement of beginning net position - - (70,515) - 70,515
Net position - end of the year 1,991,234$ 1,679,939$ 2,090,660$ 311,295$ (410,721)$
The Authority’s revenue consists entirely of capital appropriations made by the City for capital expenditures of the Authority for the fiscal year, including operating and administrative costs. Revenue in fiscal year 2015 was $2,674 million compared to fiscal year 2014 of $2,190 million, an increase of $484 million. For fiscal year 2015, the Authority awarded construction contracts for 38 new schools and additions with a construction value of $488.9 million and 597 capital improvement or renovation projects with a construction value of $1,191.8 million. The Authority completed 52 new schools and additions as of September 2015, which created 14,666 seat openings for the 2015/2016 school year.
For fiscal year 2014, the Authority awarded construction contracts for 17 new schools and additions with a construction value of $603.5 million and 459 capital improvement or renovation projects with a construction value of $752.3 million. The Authority completed 11 new schools and additions as of September 2014, which created 5,062 seat openings for the 2014/2015 school year.
Revenue in fiscal year 2014 was $2,190 million compared to fiscal year 2013 of $1,840 million, an increase of $350 million. The increase in revenue from fiscal year 2013 to fiscal year 2014 was driven by an increase in construction expenditures, DoE pass through expenditures and an increase in insurance costs under the Authority’s Owner Controlled Insurance Program.
The Authority’s expenses in fiscal year 2015 were $2,367 million compared to $2,626 million in fiscal year 2014, a decrease of $259 million. This decrease in expenses primarily resulted from a decrease in completed contracts transferred to the DoE of $242 million and a decrease in pollution remediation expenses of $15 million.

New York City School Construction Authority Management’s Discussion and Analysis As of and for the Years Ended June 30, 2015 and 2014 (Unaudited)
5
Costs related to completed contracts transferred to the DoE decreased from $2,291 million in fiscal year 2014 to $2,048 million in fiscal year 2015. All projects transferred were determined by the Authority’s Project Management Division to be substantially completed or occupied as of June 30, 2015. This transfer of completed contracts allowed for the capitalization of these contracts as fixed assets by the City in the current fiscal year.
The Authority’s expenses increased $249 million from fiscal year 2013 to fiscal year 2014. This increase resulted from an increase in the value of completed contracts transferred to the DoE for capitalization as fixed assets.
In fiscal years 2014 and 2015, the Authority incurred $45 million and $75 million, respectively, of expenditures for the restoration of schools damaged by Superstorm Sandy. The amount of these expenditures determined to be non-capital eligible was $8 million for fiscal years 2014 and 2015, respectively. The Authority is working with the Federal Emergency Management Agency (“FEMA”) to be reimbursed for expenditures incurred due to damage caused by Superstorm Sandy to the City’s public schools.
For fiscal year 2015, the Authority has classified $130 million as expenditures incurred for pollution remediation costs. For fiscal year 2014, the Authority has classified $145 million as expenditures incurred for pollution remediation costs (see Note 11 to the financial statements).
FINANCIAL HIGHLIGHTS In fiscal year 2014, the City and the Authority implemented Governmental Accounting Standards Board Statement No.68 “Accounting and Financial Reporting for Pensions” (“GASB 68”). The primary objective of GASB 68 is to improve accounting and financial reporting by state and local governments for pensions. GASB 68 establishes standards for measuring and recognizing liabilities, deferred outflows of resources, deferred inflows of resources, and expense/expenditures. The Authority has recorded a net pension liability of $53 million and $45 million as of June 30, 2015 and 2014, respectively. The Authority has recorded its proportionate share of pension expenses of $6 million and $11 million for the fiscal years ended June 30, 2015 and 2014, respectively.

New York City School Construction Authority Management’s Discussion and Analysis As of and for the Years Ended June 30, 2015 and 2014 (Unaudited)
6
The following chart summarizes the government-wide financial net position reported in the statements of net position of the Authority as of June 30, 2015, 2014, and 2013 (amounts are in thousands):
2015 2014 2013Changes 2015
vs 2014Changes 2014 vs
2013
AssetsCash and temporary investments 106,251$ 134,132$ 70,612$ (27,881)$ 63,520$ Due from the City of New York 571,450 339,783 382,100 231,667 (42,317) Prepaid expenses and other assets 216,815 161,458 103,000 55,357 58,458 Securities held in lieu of cash retainage 10,519 9,515 8,137 1,004 1,378 Fixed Assets 4,329 3,283 3,666 1,046 (383) Construction in progress 2,037,328 1,801,219 2,248,425 236,109 (447,206)
Total Assets 2,946,692 2,449,390 2,815,940 497,302 (366,550)
LiabilitiesCurrent Liabilities 756,145 563,759 532,634 192,386 31,125 Long-term liabilities 174,046 168,702 175,592 5,344 (6,890)
Total Liabilities 930,191 732,461 708,226 197,730 24,235
Deferred outflows of resources 3,390 - - 3,390 -
Deferred inflows of resources 28,657 36,990 17,054 (8,333) 19,936
Net Position - Restricted 1,991,234$ 1,679,939$ 2,090,660$ 311,295$ (410,721)$
The Authority’s net position in the government-wide financials increased by $311 million from fiscal year 2014 to fiscal year 2015. The increase was primarily due to the increase in funds due from the City and insurance receivables from fiscal year 2014 to fiscal year 2015.
The Authority’s net position in the government-wide financials decreased by $411 million from fiscal year 2013 to fiscal year 2014.
The assets of the Authority exceeded its liabilities at the close of fiscal year 2015 and 2014 by $1,991 million and $1,680 million, respectively. The Authority’s net position primarily represents the investment in capital assets for construction work performed at New York City public schools. These assets are not available for future spending.
Total government-wide assets from fiscal year 2014 to fiscal year 2015 increased by $497 million. This increase in total assets in fiscal year 2015 was primarily due to an increase in construction in progress, due from the City, and insurance receivables. From fiscal year 2014 to fiscal year 2013, total government-wide assets decreased by $367 million.

New York City School Construction Authority Management’s Discussion and Analysis As of and for the Years Ended June 30, 2015 and 2014 (Unaudited)
7
Cash and temporary investments from fiscal year 2014 to fiscal year 2015 decreased by $28 million. The decrease is principally due to the transfer of $14 million received from the Port Authority of NY/NJ to the City, Superstorm Sandy non-capital expenditures of $5 million, and $5 million on other capital work. Cash is secured through JP Morgan Chase with the Federal Reserve of Boston and invested in U.S. Treasury Notes. The cash is held temporarily by the Authority for capital project expenditures.
Cash and temporary investments from fiscal year 2013 to fiscal year 2014 increased by $64 million. The increase is principally due to the receipt of $20 million from Liberty Mutual for the return of insurance-related collateral from the years 2003 and 2004 and the receipt from the DoE of $39 million for the non-capital expenditures incurred for Superstorm Sandy restoration of schools.
The liabilities of the Authority increased by $198 million from fiscal year 2014 to fiscal year 2015. The increase in liabilities is principally due to the accrual for construction expenditures incurred in fiscal year 2015 and paid subsequent to June 30, 2015, and an increase in retainage held on contracts. The liabilities of the Authority from fiscal year 2013 to fiscal year 2014 increased by $24 million.
FUND FINANCIAL STATEMENTS RESULTS OF OPERATIONS The following chart summarizes the capital projects fund activities in the statement of revenues, expenditures and changes in fund balance of the Authority as of June 30, 2015, 2014, and 2013 (amounts are in thousands):
2015 2014 2013Changes 2015 vs
2014Changes 2014 vs
2013RevenuesOperating revenues from the City of New York 2,481,238$ 2,001,076$ 1,696,080$ 480,162$ 304,996$ Operating revenues for DoE payments 192,903 189,273 144,081 3,630 45,192
Total Revenues 2,674,141 2,190,349 1,840,161 483,792 350,188 ExpensesCapital project expenditures 2,284,407$ 1,841,484$ 1,686,866$ 442,923$ 154,618$ Fixed Assets 1,046 1,559 1,768 (513) (209) Pollution remediation expenditures 131,559 133,321 101,648 (1,762) 31,673 Operating transfers to the DoE 192,903 189,273 144,081 3,630 45,192
Total Expenses 2,609,915 2,165,637 1,934,363 444,278 231,274 Other revenues and expenses, net 4,115 25,288 31,681 (21,173) (6,393) Change in fund balance 68,341 50,000 (62,521) 18,341 112,521
Fund balance - beginning of the year 69,360 19,360 81,881 50,000 (62,521) Fund balance - end of the year 137,701$ 69,360$ 19,360$ 68,341$ 50,000$
The Authority’s revenue is entirely funded by capital appropriations made by the City for capital expenditures of the Authority for the fiscal year, including operating and administrative costs. Revenue in fiscal year 2015 was $2,674 million compared to fiscal year 2014 of $2,190 million, an increase of $484 million.
Revenue in fiscal year 2014 was $2,190 million compared to fiscal year 2013 of $1,840 million an increase of $350 million. The increase in revenue from fiscal year 2013 to fiscal year 2014 was driven by an increase in construction expenditures, DoE pass through expenditures and an increase in insurance costs under the Authority’s Owner Controlled Insurance Program.

New York City School Construction Authority Management’s Discussion and Analysis As of and for the Years Ended June 30, 2015 and 2014 (Unaudited)
8
The Authority’s expenditures in fiscal year 2015 were $2,610 million compared to $2,166 million in fiscal year 2014, an increase of $444 million. This increase in expenditures primarily resulted from an increase in construction expenditures.
The Authority’s expenditures increased $231 million from fiscal year 2013 to fiscal year 2014. This increase resulted from an increase in construction expenditures, pollution remediation expenditures and DoE expenditures.
FINANCIAL HIGHLIGHTS The following chart summarizes the capital projects fund balance sheet of the Authority as of June 30, 2015, 2014, and 2013 (amounts are in thousands):
Assets 2015 2014 2013Change 2015 vs
2014Change 2014 vs
2013Cash and temporary investments 106,251$ 134,132$ 70,612$ (27,881)$ 63,520$ Due from the City of New York 540,578 306,119 348,862 234,459 (42,743) Prepaid expenses and other assets 216,816 161,458 103,000 55,358 58,458 Securities held in lieu of cash retainage 10,519 9,515 8,137 1,004 1,378
Total Assets 874,164 611,224 530,611 262,940 80,613
LiabilitiesCurrent Liabilities 731,528 536,952 506,064 194,576 30,888 Long-term liabilities 4,935 4,912 5,187 23 (275)
Total Liabilities 736,463 541,864 511,251 194,599 30,613
Fund balance 137,701$ 69,360$ 19,360$ 68,341$ 50,000$
The Authority’s capital projects fund balance increased by $68 million from fiscal year 2014 to fiscal year 2015. The increase was primarily due to the increase in funds due from the City and insurance receivables from fiscal year 2014 to fiscal year 2015.
Total governmental assets from fiscal year 2014 to fiscal year 2015 increased by $263 million. This increase in total assets in fiscal year 2015 was primarily due to an increase in due from the City of New York. From fiscal year 2014 to fiscal year 2013, total assets increased by $81 million due to an increase in cash of $63 million, an increase in insurance costs of $58 million, and a decrease in funds due from the City of New York of $43 million. The Authority’s capital projects fund balance increased by $50 million from fiscal year 2013 to fiscal year 2014.
The assets of the Authority exceeded its liabilities at the close of fiscal year 2015 and 2014 by $138 million and $69 million, respectively.

New York City School Construction Authority Management’s Discussion and Analysis As of and for the Years Ended June 30, 2015 and 2014 (Unaudited)
9
Cash and temporary investments from fiscal year 2014 to fiscal year 2015 decreased by $28 million. The decrease is principally due to the transfer of $14 million received from the Port Authority of NY/NJ to the City, Superstorm Sandy non capital expenditures of $5 million, and $5 million on other capital work. Cash is secured through JP Morgan Chase with the Federal Reserve of Boston and invested in U.S. Treasury Notes. The cash is held temporarily by the Authority for capital project expenditures.
Cash and temporary investments from fiscal year 2013 to fiscal year 2014 increased by $64 million. The increase is principally due to the receipt of $20 million from Liberty Mutual for the return of insurance-related collateral from the years 2003 and 2004 and the receipt from the DoE of $39 million for the non-capital expenditures incurred for Superstorm Sandy restoration of schools.
The liabilities of the Authority increased by $195 million from fiscal year 2014 to fiscal year 2015. The increase in liabilities is principally due to the accrual for construction expenditures incurred in fiscal year 2015 and paid subsequent to June 30, 2015 and an increase in retainage held on contracts. The liabilities of the Authority from fiscal year 2013 to fiscal year 2014 increased by $31 million.
CONTACTING THE NYC SCHOOL CONSTRUCTION AUTHORITY’S MANAGEMENT This financial report is designed to provide citizens, taxpayers, customers, investors, and creditors with a general overview of the Authority’s finances and to demonstrate the Authority’s accountability for the funds it receives. Requests for additional financial information or inquiries should be addressed to the NYC School Construction Authority’s Comptroller’s Office, 30-30 Thomson Avenue, Long Island City, NY 11101.

NEW YORK CITY SCHOOL CONSTRUCTION AUTHORITY STATEMENTS OF NET POSITION AS OF JUNE 30, 2015 AND 2014 (in thousands)
The accompanying notes are an integral part of these financial statements.
10
2015 2014
ASSETS:
Cash 106,251$ 74,165$ Temporary investments - 59,967 Due from the City of New York 571,450 339,783 Prepaid expenses 113,193 107,779 Due from the Department of Education 16,237 7,721 Other Assets 87,385 45,958 Securities in lieu of cash retainage 10,519 9,515 Fixed assets, net 4,329 3,283 Construction in progress, asset held for
the City of New York 2,037,328 1,801,219
Total assets 2,946,692 2,449,390
DEFERRED OUTFLOWS OF RESOURCES:Deferred outflows from pensions 3,390 -
Total deferred outflows of resources 3,390 -
Total assets and deferred outflows 2,950,082$ 2,449,390$
LIABILITIES:
Accounts payable and accrued expenses 592,720$ 431,333$ Retainage payable 163,425 132,426 Pollution remediation payable 110,140 111,761 Pension liability 52,718 45,172 Accrued annual leave obligation 4,935 4,912 Accrued sick leave obligation 4,028 4,057 Accrued claims and contingencies 2,225 2,800
Total liabilities 930,191 732,461
DEFERRED INFLOWS OF RESOURCES:Deferred inflows from pensions 28,657 36,990
Total deferred inflows of resources 28,657 36,990
NET POSITION:
Total net position - restricted 1,991,234 1,679,939
Total liabilities, deferred inflowsof resources and net position 2,950,082$ 2,449,390$

NEW YORK CITY SCHOOL CONSTRUCTION AUTHORITY STATEMENTS OF ACTIVITIES FOR THE YEARS ENDED JUNE 30, 2015 AND 2014 (in thousands)
The accompanying notes are an integral part of these financial statements.
11
2015 2014
REVENUES:
Operating revenues from or due from the City of New York 2,481,238$ 2,001,076$
Operating revenues for payments made on behalf
of the Department of Education 192,903 189,273
Total revenues 2,674,141 2,190,349
EXPENSES:
Capital projects (10,123) (10,141)
Pollution remediation cost 129,939 145,424
Transfer of completed contracts to the Department of Education 2,048,300 2,290,632
Pension expense 5,942 11,170
Operating transfers on behalf of the Department of Education 192,903 189,273
Total expenses 2,366,961 2,626,358
Net revenues/(expenses) 307,180 (436,009)
Other revenues and expenses, net 4,115 25,288
Net change in net position (deficit) 311,295 (410,721)
NET POSITION - beginning of year 1,679,939 2,090,660
NET POSITION - end of year 1,991,234$ 1,679,939$

NEW YORK CITY SCHOOL CONSTRUCTION AUTHORITY GOVERNMENTAL FUND BALANCE SHEETS AS OF JUNE 30, 2015 AND 2014 (in thousands)
The accompanying notes are an integral part of these financial statements.
12
2015 2014
Capital Projects Fund
Capital Projects Fund
ASSETS:
Cash 106,251$ 74,165$ Temporary investments - 59,967 Due from the City of New York 540,577 306,119 Prepaid expenses 113,193 107,779 Due from the Department of Education 16,237 7,721 Other assets 87,387 45,958 Securities in lieu of cash retainage 10,519 9,515
Total assets 874,164 611,224
LIABILITIES:
Accounts payable and accrued expenses 568,103$ 404,526$ Retainage payable 163,425 132,426 Accrued annual leave obligation 4,935 4,912
Total liabilities 736,463 541,864
FUND BALANCE:
Nonspendable-prepaid expenses 113,193 107,779 Restricted for capital projects 24,508 - Unassigned - (38,419)
Total fund balance 137,701 69,360
Total liabilities, deferred inflowsof resources and fund balance 874,164$ 611,224$

NEW YORK CITY SCHOOL CONSTRUCTION AUTHORITY GOVERNMENTAL FUND STATEMENTS OF REVENUES, EXPENDITURES AND CHANGES IN FUND BALANCE FOR THE YEARS ENDED JUNE 30, 2015 AND 2014 (in thousands)
The accompanying notes are an integral part of these financial statements.
13
2015 2014
Capital Projects Fund
Capital Projects Fund
REVENUES:Operating revenues from or due from the City of New York 2,481,238$ 2,001,076$ Operating revenues for payments made on behalf
of the Department of Education 192,903 189,273
Total revenues 2,674,141 2,190,349
EXPENDITURES:Capital projects 2,284,407 1,841,484 Fixed assets 1,046 1,559 Pollution remediation cost 131,559 133,321 Operating transfers on behalf of the Department of Education 192,903 189,273
Total expenditures 2,609,915 2,165,637
Net revenues/(expenditures) 64,226 24,712
Other revenues and expenses, net 4,115 25,288
Net change in fund balance 68,341 50,000
FUND BALANCE - beginning of year 69,360 19,360
FUND BALANCE - end of year 137,701$ 69,360$

NEW YORK CITY SCHOOL CONSTRUCTION AUTHORITY RECONCILIATION OF THE GOVERNMENTAL FUND BALANCE SHEETS TO THE STATEMENTS OF NET POSITION AS OF JUNE 30, 2015 AND 2014 (in thousands)
The accompanying notes are an integral part of these financial statements.
14
2015 2014
Total fund balance - governmental funds 137,701$ 69,360$
Construction in progress assets are not financial resources andtherefore are not reported in the funds 2,037,328 1,801,219
Capital assets used in governmental activities are not financialresources and therefore are not reported in the funds 4,330 3,283
Other long-term assets which will be used to pay for futureliabilities and accordingly are not reported in the funds 30,872 33,664
Net pension liabilities accrued but not payable in the current periodperiod from financial resources available currenly at year-end are reported as deferred ouflows/inflows of resources in the governmental fund (25,267) (36,990)
accordingly are not reported in the funds. Those liabilitiesconsist of:
OPEB liability (24,619) (26,807) Pollution remediation payable (110,140) (111,761) Pension liability (52,718) (45,172) Sick leave obligation (4,028) (4,057) Contingent liabilities (2,225) (2,800)
Net position of governmental activities 1,991,234$ 1,679,939$
Amounts reported for governmental activities in the statements of net position are different because:
Long-term liabilities not due and payable in the current period and

NEW YORK CITY SCHOOL CONSTRUCTION AUTHORITY RECONCILIATION OF THE GOVERNMENTAL FUND STATEMENTS OF REVENUES, EXPENDITURES AND CHANGES IN FUND BALANCE TO THE STATEMENTS OF ACTIVITIES FOR THE YEAR ENDED JUNE 30, 2015 AND 2014 (in thousands)
The accompanying notes are an integral part of these financial statements.
15
2015 2014
Net change in fund balances - governmental funds 68,341$ 50,000$
Governmental funds financial statements report capital outlays for costsincurred for construction projects as expenditures. However, in thegovernment-wide financial statements, the cost of these assets aretransferred to the City as capital assets upon substantialcompletion of a project 236,106 (449,148)
Governmental funds financial statements report capital outlays asexpenditures. However, in the statement of activities, the cost isallocated over the estimated useful lives and reported asdepreciation expense 1,046 1,559
Liabilities are reported in the statement of activities on the accrual basis. However, expenditures are reported in the governmental fundfinancial statements when the outlay of current financial resourcesis paid:
Pollution remediation 1,621 (12,103) Net pension liability 4,181 (1,029)
Change in net position - governmental activities 311,295$ (410,721)$
(in thousands)
Amounts reported for governmental activities in the statements of activities are different because:
NEW YORK CITY SCHOOL CONSTRUCTION AUTHORITY NOTES TO FINANCIAL STATEMENTS AS OF AND FOR THE YEARS ENDED JUNE 30, 2015 AND 2014 (amounts in thousands, except as noted)
16
1. ORGANIZATION
The New York City School Construction Authority (the “Authority”), a public benefit corporation reported as a blended component unit of The City of New York (the “City”), was created by the State of New York Legislature in December 1988. The Authority’s responsibilities as defined in the enabling legislation are the design, construction, reconstruction, improvement, rehabilitation and repair of New York City public schools. The Authority’s capital projects include: new construction; building additions; major modernization and rehabilitation; construction, reconstruction or renovation of athletic fields, playgrounds and pools; and system replacements, including electrical, plumbing, elevators, roofs, security devices and system installation. The Authority is governed by a three member Board of Trustees. The Mayor of the City appointed the School’s Chancellor, to serve as the Chair of the Board of Trustees, and the other two trustees.
The Authority’s operations are funded by appropriations made by the City. All of the Authority’s net position is the property of the City. Appropriations are based on a five-year capital plan, developed by the New York City Department of Education (the “DoE”). The City’s appropriation for the five-year capital plan for the fiscal years 2015 through 2019 is $13.47 billion and for fiscal years 2010 through 2014 was $11.24 billion.
The Authority also carries out certain projects funded through the City Council and Borough Presidents, pursuant to the City Charter. Appropriations of $98,827 and $136,979 were made in fiscal 2015 and 2014, respectively, by the City Council and Borough Presidents for this purpose.
As the Authority is a pass-through entity, in existence for the sole purpose of construction of capital projects, all costs incurred are capitalized into construction in progress. Upon completion of construction in progress projects, the assets are transferred to the DoE.
2. SUMMARY OF SIGNIFICANT ACCOUNTING POLICIES
Basis of Accounting The financial statements of the Authority have been prepared in conformity with accounting principles generally accepted in the United States of America (“U.S. GAAP”), as prescribed by the Governmental Accounting Standards Board (“GASB”).
The government-wide financial statements are presented on the accrual basis of accounting. Under this method, revenues are recognized when earned and expenses are recognized when incurred, including long-term liabilities such as annual leave, sick leave and claims.
The governmental fund financial statements of the Authority are presented using the modified accrual basis of accounting. Under the modified accrual basis of accounting, revenues and assets are recognized when measurable and available to finance operations of the current period; expenditures and liabilities are recognized upon receipt of goods and services to the extent that they will be liquidated with expendable available resources. Based upon the nature of the operations of the Authority, only a capital projects fund is reported, as all transactions relate to expenditures and resources obtained for the acquisition, construction or improvement of capital facilities.
Fund balances are classified as either: 1) nonspendable, 2) restricted, 3) committed, 4) assigned, or 5) unassigned in accordance with GASB standards. Fund balances that cannot be spent because it is not in spendable form is defined as nonspendable.

NEW YORK CITY SCHOOL CONSTRUCTION AUTHORITY NOTES TO FINANCIAL STATEMENTS AS OF AND FOR THE YEARS ENDED JUNE 30, 2015 AND 2014 (amounts in thousands, except as noted)
17
Resource flows between the Authority and DoE are reported as revenues and expenses/expenditures in the financial statements. Management believes that this presentation is most useful for the intended users of these financial statements, although this treatment is most often used when presenting the activities of a discrete component. The presentation of these activities as a net fund transfer was deemed to provide less useful information.
Budget versus Actual Revenues and Expenditures Appropriations are made by the City for capital expenditures of the Authority, including operating and administrative costs. Such appropriations are based on the DoE five-year capital plan. Budgeted commitments and expenditures generally span more than one year and thus do not provide a meaningful basis for comparison of annual expenditures to budgeted amounts.
Investments Investments are reported at fair value.
Due from the City of New York Due from the City of New York represents amounts expended by the Authority for construction projects pursuant to appropriations made by the City, but not yet paid to the Authority. This amount is related to liabilities, net of certain assets that have been incurred by the Authority for construction activities prior to June 30.
Fixed Assets Fixed assets used by the Authority are stated at cost less accumulated depreciation. Depreciation is calculated on a straight-line basis over the estimated useful lives of the assets applying the half-year convention. Leasehold improvements are amortized over the shorter of their estimated useful lives or the related life of the lease. Upon the disposition of fixed assets, the cost of the asset disposed and the related accumulated depreciation are removed from the accounts, with any resulting gain or loss included in the statement of activities for the period. Fixed assets and leasehold improvements are accounted for and reported in the government-wide financial statements.
Construction in Progress Construction in progress is stated at cost and includes such costs as site acquisition, wrap-up insurance, initial outfitting construction contract costs, construction management fees, architecture and engineering fees, administrative costs of the Authority, and certain allocated DoE costs including salaries, related fringe benefits and overhead costs. These assets are transferred to the DoE upon substantial completion of the associated construction project. Refer to Note 8.
Pollution Remediation Obligations Expenditures for pollution remediation costs are recorded in the fund financial statements in the period in which such expenditures are paid from current financial resources. Pollution remediation obligations which are payable in future subsequent years are recorded as a liability in the government-wide financial statements. Refer to Note 11.
Superstorm Sandy Expenditures The Authority incurred expenditures of $75,258 and $45,013 in fiscal years 2015 and 2014 related to the restoration of New York City public schools damaged during Superstorm Sandy. It was determined that $8,515 and $7,721, respectively, incurred for fiscal years 2015 and 2014, were non-capital eligible. FEMA has reimbursed, for Superstorm Sandy damages, approximately $53 and $27 million in fiscal 2015 and 2014, respectively.

NEW YORK CITY SCHOOL CONSTRUCTION AUTHORITY NOTES TO FINANCIAL STATEMENTS AS OF AND FOR THE YEARS ENDED JUNE 30, 2015 AND 2014 (amounts in thousands, except as noted)
18
Accounting and Financial Reporting for Pensions In fiscal year 2014, the Authority implemented GASB Statement No. 68, Accounting and Financial Reporting for Pensions (“GASB 68”). The primary objective of GASB 68 is to improve accounting and financial reporting by state and local governments for pensions. GASB 68 establishes standards for measuring and recognizing liabilities, deferred outflows of resources, deferred inflows of resources, and expense/expenditures. For defined benefit pensions, GASB 68 identifies the methods and assumptions that should be used to project benefit payments, discount projected benefit payments to their actuarial present value, and attribute that present value to periods of employee service. In addition, prior to implementing GASB 68, employers participating in a cost-sharing plan recognized annual pension expense equal to their contractually required contribution to the plan. Upon the adoption of GASB 68, employers participating in cost-sharing plans will recognize their proportionate share of the collective pension amounts for all benefits provided through the plan based on an allocation methodology. Refer to Note 12.
Annual and Sick Leave The Authority’s full time employees are entitled to annual and sick leave benefits. Annual leave is limited to one year’s worth of accrued benefits with any excess at the end of the calendar year paid out to the employees. Employees with at least ten years of service are eligible, upon separation, for a payout of a portion of sick leave accrued.
Annual and sick leave are recorded as an expenditure in the governmental fund financial statements when it is payable from current financial resources. The estimated value of vacation and sick leave earned by employees, which may be used in subsequent years or paid upon separation, is recorded as a liability in the government-wide financial statements.
Use of Estimates The preparation of financial statements in conformity with U.S. GAAP requires management to make certain estimates and assumptions that affect the reported amounts of assets and liabilities and disclosure of contingent assets and liabilities at the date of the financial statements and the reported amounts of revenues and expenditures during the reporting period. The most significant assumptions and estimates relate to the determination of accrued expenses. Actual results could differ from those estimates.
Recent Accounting Pronouncements As a component unit of the City, the Authority implements new GASB standards in the same fiscal year as they are implemented by the City. The following are standards adopted by the Authority in the current year and standards which may impact the Authority in future years.
In February 2015, GASB issued Statement No. 72, Fair Value Measurement and Application (“GASB 72”). GASB 72 establishes financial reporting standards for measuring fair value and enhances disclosures about fair value measurements. GASB 72 is effective for financial statement periods beginning after June 15, 2015, but was adopted by the Authority in the current fiscal year. The adoption of GASB 72 enhanced transparency through expanded disclosures on the fair value hierarchy and valuation techniques for assets measured at fair value by the Authority. Refer to Note 6.

NEW YORK CITY SCHOOL CONSTRUCTION AUTHORITY NOTES TO FINANCIAL STATEMENTS AS OF AND FOR THE YEARS ENDED JUNE 30, 2015 AND 2014 (amounts in thousands, except as noted)
19
GASB Statement No. 73, Accounting and Financial Reporting for Pensions and Related Assets that are not within the Scope of GASB Statement 68, and Amendments to Certain Provisions of GASB Statements 67 and 68 ("GASB 73") is effective for fiscal years beginning after June 15, 2015, except those provisions that address employers and governmental non-employer contributing entities for pensions that are not within the scope of Statement 68, which are effective for fiscal years beginning after June 15, 2016. GASB 73 establishes requirements that will improve financial reporting by establishing a single framework for the presentation of information about pensions, which will enhance the comparability of pension-related information reported by employers and non-employer contributing entities. The Authority has not completed the process of evaluating the effect of GASB 73 on its financial statements.
GASB Statement No. 74, Financial Reporting for Postemployment Benefit Plans Other than Pensions ("GASB 74") is effective for fiscal years beginning after June 15, 2016. GASB 74 establishes requirements that will improve the usefulness of information about postemployment benefits other than pensions (other postemployment benefits or OPEB) included in the general purpose external financial reports of state and local governmental OPEB plans for making decisions and assessing accountability. The Authority has not completed the process of evaluating the effect of GASB 74 on its financial statements.
GASB Statement No. 75, Accounting and Financial Reporting for Postemployment Benefit Other than Pensions ("GASB 75") is effective for fiscal years beginning after June 15, 2017. GASB 75 requires the liability of employers and non-employer contributing entities to employees for defined benefit OPEB (net OPEB liability) to be measured as the portion of the present value of projected benefit payments to be provided to current active and inactive employees that is attributed to those employees’ past periods of service (total OPEB liability), less the amount of the OPEB plan’s fiduciary net position. The Authority has not completed the process of evaluating the effect of GASB 75 on its financial statements.
In June 2015, GASB issued Statement No. 76, The Hierarchy of Generally Accepted Accounting Principles (“GAAP”) for State and Local Governments (“GASB 76”). The GAAP hierarchy prioritizes guidance state and local governments use when preparing GAAP financial statements. GASB 76 reduces the GAAP hierarchy from four categories to two categories of authoritative GAAP and addresses the use of authoritative and nonauthoritative literature for transactions or events where the source of authoritative GAAP is not specified. GASB 76 is effective for financial statement periods beginning after June 15, 2015, and should be applied retroactively. The adoption of GASB 76 is not anticipated to result in any changes to the Authority’s financial statements.
3. CASH
The Authority maintains cash accounts with a bank which are covered by FDIC insurance up to the maximum allowed by law. At June 30, 2015 and 2014, uninsured cash balances totaled $110,008 and $73,915, respectively. Cash accounts are secured through collateral invested by JP Morgan Chase in U.S. Treasury Notes with the Federal Reserve of Boston. All securities held by the custodian as collateral are registered and are held in the Authority’s name.

NEW YORK CITY SCHOOL CONSTRUCTION AUTHORITY NOTES TO FINANCIAL STATEMENTS AS OF AND FOR THE YEARS ENDED JUNE 30, 2015 AND 2014 (amounts in thousands, except as noted)
20
Additionally, the Authority maintains a zero balance checking account, which is funded by the City. As checks are presented at the bank, funds are transferred from the City into the zero balance account. Negative book balances, representing checks issued but not yet presented for payment, have been classified as accounts payable in the accompanying financial statements and the aggregated amounts are $86,400 and $35,192 as of June 30, 2015 and 2014, respectively.
4. TEMPORARY INVESTMENTS
The Authority invests in obligations in accordance with Section 11 of the General Municipal Law. The Authority’s investments are recorded at fair value. Investments are held in the Authority’s name by a fiduciary institution.
The Authority’s investments consisted of the following at June 30, 2015 and 2014:
Amortized Cost Fair Value
Amortized Cost Fair Value
US Treasury Bills (due on April 30, 2015) -$ -$ 59,963$ 59,967$
Total Investment -$ -$ 59,963$ 59,967$
2015 2014
5. SECURITIES IN LIEU OF CASH RETAINAGE AND RETAINAGE PAYABLE
Securities in Lieu of Cash Retainage – The Authority permits contractors to substitute marketable securities in lieu of cash retainage. Permitted securities include (a) bonds or notes of the State of New York or the United States of America; or (b) bonds of any political subdivision in the State of New York, with a par and market value at least equal to the contract cash retainage amount requested for withdrawal. These securities in lieu of cash retainage are maintained by a custodian on behalf of and in the name of the Authority and are recorded by the Authority at an amount equal to the requested cash retainage withdrawal amount. A corresponding offset is recorded within the retainage payable account. Total securities in lieu of cash retainage totaled $10,519 and $9,515 as of June 30, 2015 and 2014, respectively. The fair value of these securities is $12,920 and $11,860 as of June 30, 2015 and 2014, respectively. Retainage Payable – Retainage payable represents a portion of contractual payments withheld by the Authority which will be released upon substantial completion of the construction project in agreed upon amounts between the contractor and construction management.

NEW YORK CITY SCHOOL CONSTRUCTION AUTHORITY NOTES TO FINANCIAL STATEMENTS AS OF AND FOR THE YEARS ENDED JUNE 30, 2015 AND 2014 (amounts in thousands, except as noted)
21
Retainage payable consisted of the following as of June 30: 2015 2014
Securities retainage payable $ 10,519 $ 9,515
Cash retainage withheld 152,906 122,911
Total retainage payable $ 163,425 $ 132,426
6. FAIR VALUE MEASUREMENTS
The Authority categorizes its assets that are valued at fair value on a recurring basis into a three-level fair value hierarchy. The hierarchy is based on the valuation inputs used to measure the fair value of the asset with the highest priority given to quoted prices in active markets for identical assets (Level 1) and lowest priority to unobservable inputs (Level 3). The categories are as follows:
Level 1 – inputs are based on unadjusted quoted prices for identical assets or liabilities in an active market (examples include active exchange markets, brokered markets, money market mutual funds).
Level 2 – inputs are based on:
Quoted prices for similar assets in active markets
Quoted prices for identical or similar assets in markets that are not active
Inputs other than quoted prices that are observable such as credit spreads, interest rates and yield curves
Market-corroborated inputs
Level 3 – inputs are based on unobservable inputs which may include management’s own assumptions and data.
As of June 30, 2015, the Authority did not hold any investments measured at fair value.
As of June 30, 2014, the Authority maintained an investment in U.S. Treasury Bills of $59,967 valued using quoted market prices (Level 1 inputs).

NEW YORK CITY SCHOOL CONSTRUCTION AUTHORITY NOTES TO FINANCIAL STATEMENTS AS OF AND FOR THE YEARS ENDED JUNE 30, 2015 AND 2014 (amounts in thousands, except as noted)
22
7. FIXED ASSETS
The changes in fixed assets used by the Authority for the year ended June 30, 2015 is as follows:
Estimated Fixed Assets Fixed AssetsAsset Category Useful Lives at June 30, 2014 Additions Dispositions at June 30, 2015
Computer Hardware/Equipment 3 $18,597 $1,062 $19,659Computer Software 3 7,113 788 7,901Leasehold Improvements 12 10,551 223 10,774Furniture & Fixtures 5-7 5,184 5,184Automobiles 5 5,034 662 (317)$ 5,379Office Equipment 3-5 2,513 149 2,662
48,992 2,884 (317) 51,559$
Less: Accumulated Depreciation and amortization (45,709) (1,838) 317 (47,230)Fixed Assets, net $3,283 $1,046 $0 $4,329
The changes in fixed assets used by the Authority for the year ended June 30, 2014 is as follows:
Estimated Fixed Assets Fixed AssetsAsset Category Useful Lives at June 30, 2014 Additions Dispositions at June 30, 2015
Computer Hardware/Equipment 3 $18,040 $557 $18,597Computer Software 3 6,912 201 7,113Leasehold Improvements 12 10,551 10,551Furniture & Fixtures 5-7 5,184 5,184Automobiles 5 4,956 348 (270)$ 5,034Office Equipment 3-5 2,042 471 2,513
47,685 1,577 (270) 48,992$
Less: Accumulated Depreciation and amortization (44,019) (1,942) 252 (45,709)Fixed Assets, net $3,666 ($365) ($18) $3,283
Depreciation totaled $1,838 and $1,942 for fiscal 2015 and 2014, respectively.

NEW YORK CITY SCHOOL CONSTRUCTION AUTHORITY NOTES TO FINANCIAL STATEMENTS AS OF AND FOR THE YEARS ENDED JUNE 30, 2015 AND 2014 (amounts in thousands, except as noted)
23
8. CONSTRUCTION IN PROGRESS
Expenses for construction in progress for fiscal 2015 and 2014 include:
2015 2014
Outside construction costs $2,135,782 $1,711,956
Authority payroll and related fringe benefits 102,867 87,394
Authority general and administrative costs 45,760 44,076
Total Expenses 2,284,409 1,843,426
Construction in progress - beginning of year 1,801,219 2,248,425
Total before transfer to DoE during the year 4,085,628 4,091,851
Costs transferred to the DoE during the year (2,048,300) (2,290,632)
Construction in progress - end of year $2,037,328 $1,801,219
The Authority transferred to the DoE costs associated with substantially completed contracts and administrative costs totaling $2,048,300 and $2,290,632 for fiscal 2015 and 2014, respectively. In addition, the DoE capitalized $44,843 and $41,273 during fiscal 2015 and 2014, respectively, for work performed by the Capital Task Force, a division of the DoE. This resulted in the DoE additions to fixed assets for fiscal 2015 and 2014 of $2,093,143 and $2,331,905, respectively.
9. TRANSACTIONS WITH THE DEPARTMENT OF EDUCATION AND OPERATING TRANSFERS
In addition to construction and renovation of school facilities, the Authority makes payments for certain asset purchases made by the DoE. The title for such purchases are transferred directly to the DoE. For the years ended June 30, 2015 and 2014, pass-through purchases totaled $141,455 and $110,025, respectively, and have been included in operating transfers on behalf of the DoE in the accompanying statements of activities and governmental fund statements of revenues, expenditures and changes in fund balances. Included in these amounts are expenditures for technology enhancements, leasehold alterations and reconstruction.
DoE contractors performed minor capital projects on behalf of the Authority, as shown below:
2015 2014
Skilled trades, minor capital projects
39,919$ 72,090$
Lead Paint Abatement 1,193 864
DoE Admin Staff 10,336 6,294
51,448$ 79,248$
Such costs are also included in operating transfers on behalf of the DoE in the accompanying statements of activities and governmental fund statements of revenues, expenditures and changes in fund balances.

NEW YORK CITY SCHOOL CONSTRUCTION AUTHORITY NOTES TO FINANCIAL STATEMENTS AS OF AND FOR THE YEARS ENDED JUNE 30, 2015 AND 2014 (amounts in thousands, except as noted)
24
10. COMMITMENTS AND CONTINGENCIES
Rent The Authority executed a lease modification agreement effective October 2011 for office space. This lease agreement expires in 2021 with an option for an extension through September 30, 2026. Rental expense totaled $7,370 and $7,425 in fiscal 2015 and 2014, respectively.
The following is a schedule of future minimum rental payments required under operating leases having initial or remaining noncancelable lease terms in excess of one year:
Years ending June 30, Amount
2016 $ 5,891
2017 6,376
2018 6,539
2019 6,539
2020 6,539
2021-2022 8,173
Total $ 40,057
Purchase Orders Purchase orders, contracts and other commitments at June 30, 2015 and 2014 totaled $2,942 and $2,974, respectively, and represent the difference between the value of construction-related contracts and the amount incurred through the end of the year.
Insurance On January 1, 2003, the Authority entered into a contract with Liberty Mutual to provide General Liability (“GL”) and Worker’s Compensation (“WC”) insurance coverage for the Owner Controlled Insurance Program (“OCIP”). The insurance policies covered all contractors and sub-contractors working on construction projects for the Authority from January 1, 2003 through December 31, 2004. This policy coverage was in the form of a large deductible program for GL and a retrospectively rated program for WC. The Authority has recorded an estimated receivable for the policy years 2003 through 2004 of $4,255 and $5,670 as of June 30, 2015 and 2014, respectively, based on the insurance contract’s terms and conditions and an actuarial assessment of OCIP loss activity and are included in other assets.
The Authority’s contract for the OCIP was provided by Liberty Mutual for the insurance coverage period from January 1, 2008 through December 31, 2013. The Authority has recorded an additional liability for the policy years 2008 through 2013 in the amount of $7,180 as of June 30, 2015 and 2014, respectively, which are included in accounts payable and accrued expense.
The Authority’s contract for the OCIP is currently provided by ACE Insurance Company for the insurance coverage period from January 1, 2014 through December 31, 2015 with an option to renew for 2016. The annual insurance premium for this program was $213 million and $223 million for 2015 and 2014, respectively. The Authority has recorded an estimated net receivable of $76,016 and $37,852 as of June 30, 2015 and 2014, respectively, based on the actuarial assessment of OCIP loss activity for the respective periods. The estimated net receivable is comprised of receivables of $82,176 and $37,852 for fiscal 2015 and 2014, respectively, which are included in other assets, and liabilities of $6,160 and $10,000 for fiscal 2015 and 2014, respectively, which are included in accounts payable and accrued expenses.
NEW YORK CITY SCHOOL CONSTRUCTION AUTHORITY NOTES TO FINANCIAL STATEMENTS AS OF AND FOR THE YEARS ENDED JUNE 30, 2015 AND 2014 (amounts in thousands, except as noted)
25
Legal In the normal course of its operations, the Authority has received notices of claims alleging amounts due related to contracts, financial loss, including loss through condemnation, and personal injuries sustained by individuals. After giving effect to available insurance coverage related to such claims, an accrued liability is recorded in the government-wide financial statements. The Authority, with the assistance of the City’s Corporation Counsel, has estimated and recorded a liability of $2,225 and $2,800 at June 30, 2015 and 2014, respectively.
From time to time the Authority is involved in various litigations, claims and assessments. The Authority records those claims which are believed to be probable of settlement based upon the best estimate of such settlements. Disclosure is made for those claims considered to be reasonably possible of settlement along with the range of possible settlements.
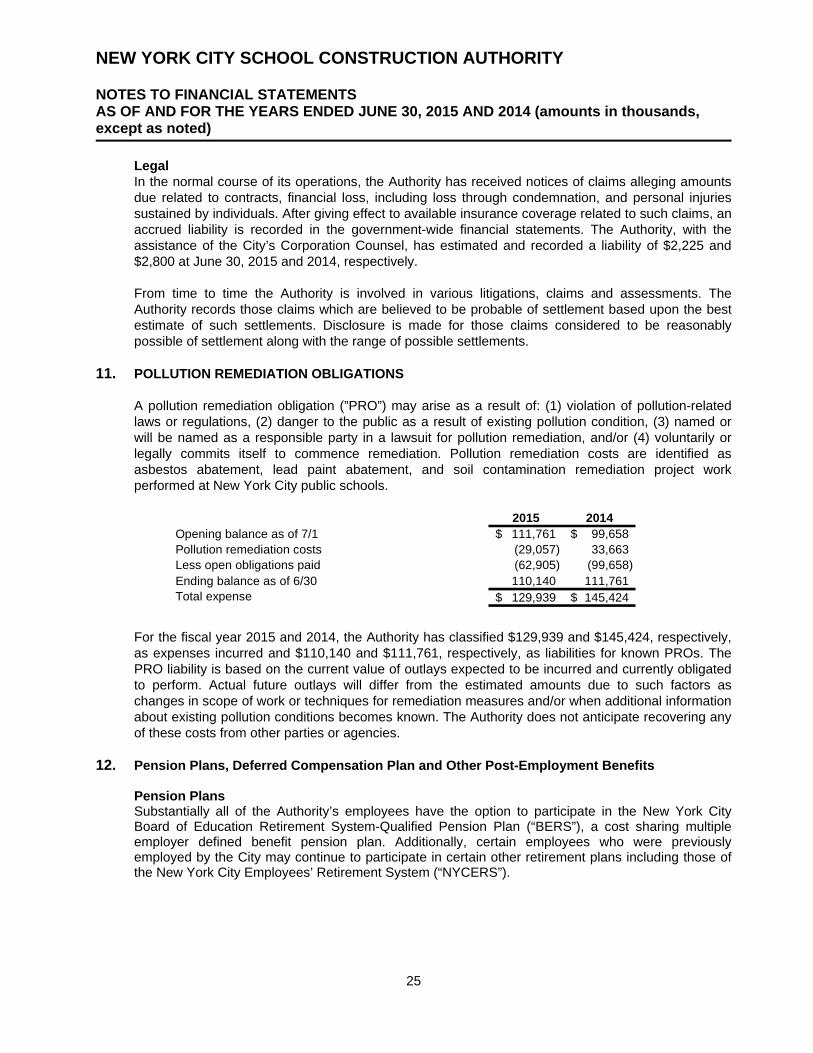
11. POLLUTION REMEDIATION OBLIGATIONS
A pollution remediation obligation (”PRO”) may arise as a result of: (1) violation of pollution-related laws or regulations, (2) danger to the public as a result of existing pollution condition, (3) named or will be named as a responsible party in a lawsuit for pollution remediation, and/or (4) voluntarily or legally commits itself to commence remediation. Pollution remediation costs are identified as asbestos abatement, lead paint abatement, and soil contamination remediation project work performed at New York City public schools.
2015 2014Opening balance as of 7/1 111,761$ 99,658$ Pollution remediation costs (29,057) 33,663 Less open obligations paid (62,905) (99,658) Ending balance as of 6/30 110,140 111,761 Total expense 129,939$ 145,424$
For the fiscal year 2015 and 2014, the Authority has classified $129,939 and $145,424, respectively, as expenses incurred and $110,140 and $111,761, respectively, as liabilities for known PROs. The PRO liability is based on the current value of outlays expected to be incurred and currently obligated to perform. Actual future outlays will differ from the estimated amounts due to such factors as changes in scope of work or techniques for remediation measures and/or when additional information about existing pollution conditions becomes known. The Authority does not anticipate recovering any of these costs from other parties or agencies.
12. Pension Plans, Deferred Compensation Plan and Other Post-Employment Benefits Pension Plans Substantially all of the Authority’s employees have the option to participate in the New York City Board of Education Retirement System-Qualified Pension Plan (“BERS”), a cost sharing multiple employer defined benefit pension plan. Additionally, certain employees who were previously employed by the City may continue to participate in certain other retirement plans including those of the New York City Employees’ Retirement System (“NYCERS”).

NEW YORK CITY SCHOOL CONSTRUCTION AUTHORITY NOTES TO FINANCIAL STATEMENTS AS OF AND FOR THE YEARS ENDED JUNE 30, 2015 AND 2014 (amounts in thousands, except as noted)
26
Contributions to the pension plans are made by the Authority and the employees. Contributions paid or accrued by the Authority under these plans totaled $10,123 and $10,136 for fiscal year 2015 and 2014, respectively. The Authority’s contributions are actuarially determined at rates that are designed to accumulate sufficient assets to pay benefits when due. Member contributions are determined by law and vary by plan. The retirement plans provide pension benefits to retired employees based on salary and length of service. In addition, the pension systems may provide for cost-of-living and other supplemental benefits to qualified retirees and beneficiaries. In the event of disability during employment, participants are entitled to retirement allowances based on satisfaction of certain service requirements and other provisions. The plans also provide death benefits.
The Authority adopted GASB No. 68 as of and for the year ended June 30, 2014. GASB No. 68 establishes standards for measuring and recognizing liabilities, deferred outflows of resources, deferred inflows of resources, and expense/expenditures. For defined benefit pensions, GASB No. 68 identifies the methods and assumptions that should be used to project benefit payments, discount projected benefit payments to their actuarial present value, and attribute that present value to periods of employee service. GASB No. 68 requires the liability of employers to employees for defined benefit plans (net pension liability) to be measured as the portion of the present value of projected benefit payments to be provided through the pension plan to current active and inactive employees that is attributed to those employees’ past periods of service (total pension liability), less the amount of the pension plan’s fiduciary net position. In addition, prior to implementing GASB No. 68, employers participating in a cost-sharing plan recognized annual pension expense equal to their contractually required contribution to the plan. Upon the adoption of GASB No. 68, employers participating in cost-sharing plans will recognize their proportionate share of the collective pension amounts for all benefits provided through the plan based on an allocation methodology.
Accordingly, the Authority began recognizing its proportion of the BERS and NYCERS net pension liability, deferred outflows of resources, deferred inflows of resources and pension expense as of and for the fiscal year ended June 30, 2014 with retroactive application as of and for the year ended June 30, 2013. The total pension liability was determined by actuarial valuations as of June 30, 2012 and rolled forward to the respective measurement dates. The Authority restated its 2012 beginning net position by $70 million for the Authority’s portion of the net pension liability incurred in prior years. The proportion allocation method utilized by BERS and NYCERS was the percentage of each employer’s contribution to the total contributions to the plans.
The Authority’s share of the pension liability of the BERS Plan represents four percent of the total net pension liability. The Authority has recorded a net pension liability of $43 million and $36 million as of June 30, 2015 and 2014, respectively. The Authority has recorded its proportionate share of pension plan expenses of $5 million and $10 million for the years ended June 30, 2015 and 2014, respectively.
The Authority’s share of the pension liability of the NYCERS Plan represents less than one percent of the total net pension liability. The Authority has recorded a net pension liability of $10 million and $9 million as of June 30, 2015 and 2014, respectively. The Authority has recorded its proportionate share of pension plan expenses of $1 million for the years ended June 30, 2015 and 2014.
Actuarial assumptions used in determining employer contributions were as follows:
Rate of return on investments 7% per annum, net investment expenses Salary increases 3% assumed as a general wage increase Inflation 1.5% using long-term CPI assumption of 2.5% per year

NEW YORK CITY SCHOOL CONSTRUCTION AUTHORITY NOTES TO FINANCIAL STATEMENTS AS OF AND FOR THE YEARS ENDED JUNE 30, 2015 AND 2014 (amounts in thousands, except as noted)
27
Mortality rates were based on the tables adopted by the City of New York Office of the Actuary and each plan’s Board of Trustees during fiscal year 2012 based on an experience review. The probabilities of mortality for retirees differ depending upon whether they are receiving service retirement benefits or disability retirement benefits. Pursuant to Section 96 of the New York City Charter, studies of the actuarial assumptions used to value liabilities of the five actuarially-funded New York City Retirement Systems are conducted every two years.
The most recently completed study was published by The Hay Group (“Hay”), dated December 2011, and analyzed experience for fiscal years 2006 through 2009. Hay made recommendations with respect to the actuarial assumptions and methods based on their analysis. Currently, Gabriel, Roeder, Smith & Company (“GRS”) has been retained to study the actuarial assumptions for fiscal years 2010 through 2013.
Expected rate of Return on Investments The long-term expected rate of return on the Plans’ investments was determined using a building-block method in which best-estimate ranges of expected future real rates of return (expected returns, net of Plan investment expense and inflation) are developed for each major assets class. These ranges are combined to produce the long-term expected rate of return by weighting the expected future real rates of return by the target asset allocation percentage and by adding expected inflation. The target allocation and best estimates of arithmetic real rates of return for each major asset class included in Plan’s target asset allocation as of the June 30, 2013 actuarial valuation are summarized in the following table:
BERS
Asset Class Target Allocation Real Return Arithmetic Basis
Long Term Expected Real Rate of Return
U.S. Public Market Equities 35.00% 6.60% 2.31% Int'l Public Market Equities 17.00% 7.00% 1.19% Emerging Public Market Equities 5.00% 7.90% 0.40% Private Market Equities 6.00% 9.90% 0.59% U.S. Fixed Income 30.00% 2.70% 0.81% Alternatives 7.00% 4.00% 0.28% Total 100.00% 5.58%
NYCERS Asset Class Target Allocation Real Return
Arithmetic Basis Long Term
Expected Real Rate of Return
U.S. Public Market Equities 32.60% 6.60% 2.15% Int'l Public Market Equities 10.00% 7.00% 0.70% Emerging Public Market Equities 6.90% 7.90% 0.55% Private Market Equities 7.00% 9.90% 0.69% U.S. Fixed Income 33.50% 2.70% 0.90% Alternatives 10.00% 4.00% 0.40% Total 100.00% 5.39%

NEW YORK CITY SCHOOL CONSTRUCTION AUTHORITY NOTES TO FINANCIAL STATEMENTS AS OF AND FOR THE YEARS ENDED JUNE 30, 2015 AND 2014 (amounts in thousands, except as noted)
28
The Office of the Actuary has determined its expected rate of return on investments to be 7 percent. This is based on expected real rate of return from investments of 5.88 percent for BERS and 5.39 percent for NYCERS and a long-term Consumer Price Inflation assumption of 2.5 percent per year, which is offset by investment related expenses.
Discount Rate
The discount rate used to measure the total pension liability as of June 30, 2015 and June 30, 2014, respectively, was 7.00 percent. The projection of cash flows used to determine the discount rate assumed that employee contributions will be made at the rates applicable to the current Tier for each member and that employee contributions will be made based on rates determined by the Office of the Actuary. Based on those assumptions, the Plan’s fiduciary net position was projected to be available to make all projected future benefit payments of current active and non-active Plan members. Therefore, the long-term expected rate of return on Plan investments was applied to all periods of projected benefit payments to determine the total pension liability.
Sensitivity of the net pension liability to changes in the discount rate.
The following presents the net pension liability of each plan, calculated as of the measurement date of June 30, 2014, using the Discount Rate of 7.0% per annum (the “Current Rate”). The table shows what the net pension liability would be if it were calculated using a discount rate that is 1-percentage-point lower (i.e., 6.0% per annum) or 1-percentage-point-higher (i.e., 8.0% per annum) than the current rate.
SENSITIVITY ANALYSIS
NET PENSION LIABILITY AS OF JUNE 30, 2015
System 1% Decrease (6%)
Current Rate (7%)
1% Increase (8%)
NYCERS $ 11,757 $ 8,501 $ 5,477
BERS $ 54,442 $ 37,530 $ 22,721
Total $ 66,198 $ 46,031 $ 28,197
NEW YORK CITY SCHOOL CONSTRUCTION AUTHORITY NOTES TO FINANCIAL STATEMENTS AS OF AND FOR THE YEARS ENDED JUNE 30, 2015 AND 2014 (amounts in thousands, except as noted)
29
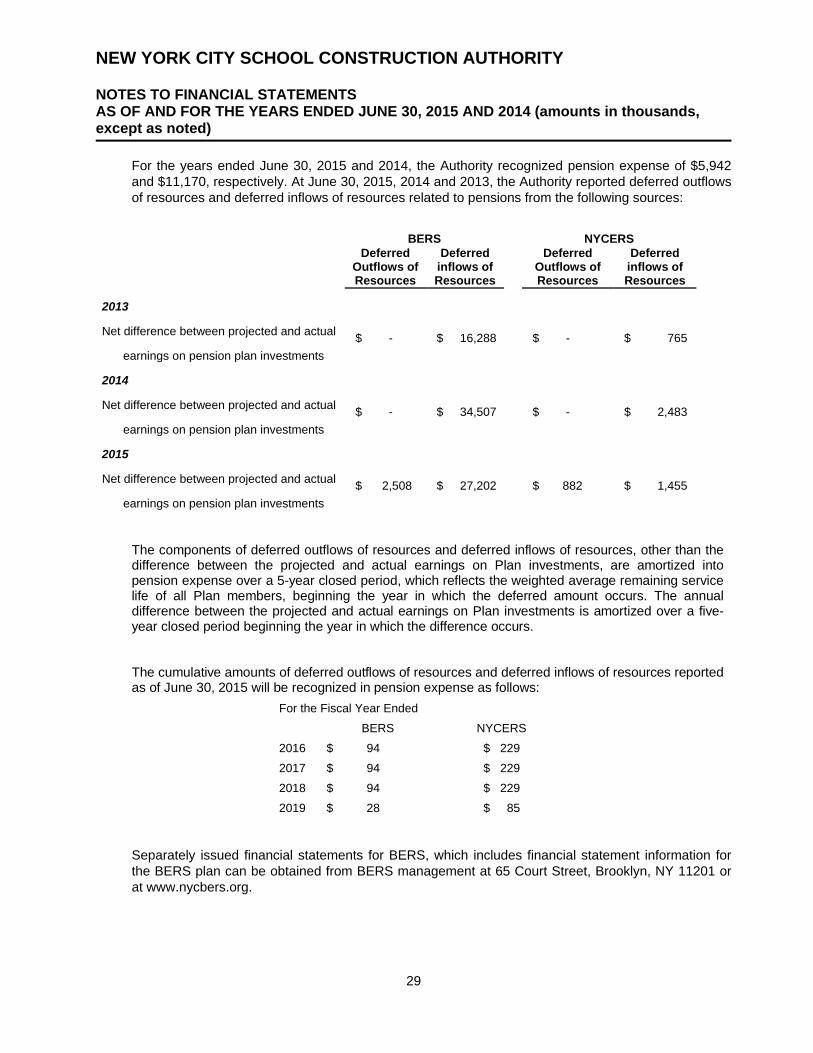
For the years ended June 30, 2015 and 2014, the Authority recognized pension expense of $5,942 and $11,170, respectively. At June 30, 2015, 2014 and 2013, the Authority reported deferred outflows of resources and deferred inflows of resources related to pensions from the following sources:
BERS NYCERS
Deferred Outflows of Resources
Deferred inflows of Resources
Deferred Outflows of Resources
Deferred inflows of Resources
2013
Net difference between projected and actual $ - $ 16,288
$ - $ 765
earnings on pension plan investments
2014
Net difference between projected and actual $ - $ 34,507
$ - $ 2,483
earnings on pension plan investments
2015
Net difference between projected and actual $ 2,508 $ 27,202
$ 882 $ 1,455
earnings on pension plan investments
The components of deferred outflows of resources and deferred inflows of resources, other than the difference between the projected and actual earnings on Plan investments, are amortized into pension expense over a 5-year closed period, which reflects the weighted average remaining service life of all Plan members, beginning the year in which the deferred amount occurs. The annual difference between the projected and actual earnings on Plan investments is amortized over a five-year closed period beginning the year in which the difference occurs. The cumulative amounts of deferred outflows of resources and deferred inflows of resources reported as of June 30, 2015 will be recognized in pension expense as follows:
For the Fiscal Year Ended
BERS NYCERS
2016 $ 94 $ 229
2017 $ 94 $ 229
2018 $ 94 $ 229
2019 $ 28 $ 85
Separately issued financial statements for BERS, which includes financial statement information for the BERS plan can be obtained from BERS management at 65 Court Street, Brooklyn, NY 11201 or at www.nycbers.org.

NEW YORK CITY SCHOOL CONSTRUCTION AUTHORITY NOTES TO FINANCIAL STATEMENTS AS OF AND FOR THE YEARS ENDED JUNE 30, 2015 AND 2014 (amounts in thousands, except as noted)
30
Separately issued financial statements for NYCERS, which includes financial statement information for the NYCERS plan can be obtained from NYCERS management at 338 Adams Street, Brooklyn, NY 11201 or at www.nycers.org.
Deferred Compensation Plan
The employees of the Authority are eligible to participate in a deferred compensation plan administered by the City, in accordance with Internal Revenue Code Section 457 (the “Plan”). The Plan is available to all Authority employees and permits them to defer a portion of their salary until future years. The deferred compensation is not available to employees until termination, retirement, death, or unforeseeable hardship.
Other Post-Employment Benefits Plan Description – The Authority provides certain health and related benefits to eligible retirees of the Authority, which are known as other postemployment benefits (“OPEB”). OPEB is provided under the New York City Health Benefit Program (“Program”), which is a multi-employer defined benefit healthcare plan to eligible retirees and beneficiaries. The Authority’s policy is to follow the eligibility criteria applicable to retirees of the City and to provide benefits substantially the same as those provided to City retirees and eligible beneficiaries/dependents. OPEB benefits include health insurance, Medicare Part B premium reimbursements, and employee welfare fund contributions. The OPEB plan issues a publicly available financial report that includes financial statements and required supplementary information (“RSI”) for funding OPEB and the report can be obtained from NYC Comptroller website at www.comptroller.nyc.gov or upon request to the Office of the Comptroller, Bureau of Accountancy. Funding Policy – The Authority is not required to provide funding for OPEB, other than the pay-as-you-go amount necessary to provide current benefits to retirees and eligible beneficiaries/dependents. For the years ended June 30, 2015 and 2014, the Authority made contributions of $420 and $388, respectively. The Authority pays the full cost of basic coverage for non-Medicare-eligible/Medicare-eligible retiree participants. Members are not required to contribute, however, Program retiree participants who opt for other basic or enhanced coverage must contribute 100% of the incremental costs above the premiums for the benchmark plan. The Program also reimburses covered employees 100% of the Medicare Part B premium rate applicable to a given year and there is no retiree contribution to the Welfare Funds. The Authority pays per capita contributions to the Welfare Funds, the amounts of which are based on negotiated contract provisions. Annual OPEB and Net OPEB Obligation – The Authority’s annual OPEB cost (expense) is calculated based on the actuarial annual required contribution (“ARC”) of the employer, an amount that was actuarially determined by using the Entry Age Actuarial Cost Method. The methodology remains unchanged from the actuarial cost method used in the prior OPEB actual valuation. Under the actuarial cost method, the Actuarial Present Value (“APV”) of Benefits (“APVB”) of each individual included in the actuarial valuation is allocated on a level basis over the earnings of the individual between entry age and assumed exit age(s). The employer portion of this APVB allocated to a valuation year is the Employer Normal Cost. The portion of this APVB not provided for at a valuation date by the APV of Future Employer Normal Costs is the Actuarial Accrued Liability (“AAL”). The excess of the AAL over the Actuarial Asset Value (“AAV”), if any, is the Unfunded Actuarial Accrued Liability (“UAAL”).

NEW YORK CITY SCHOOL CONSTRUCTION AUTHORITY NOTES TO FINANCIAL STATEMENTS AS OF AND FOR THE YEARS ENDED JUNE 30, 2015 AND 2014 (amounts in thousands, except as noted)
31
The following table shows the elements of the Authority’s annual OPEB cost for the year, the amounts contributed, and changes in the Authority’s net OPEB obligation for the fiscal year ended June 30, 2015 and 2014:
2015 2014
Annual requried contribution (ARC) 25,040$ 27,195$
Interest on net OPEB obligation 1,072 1,063
Adjustment to annual required contribution (27,879) (27,633)
Annual OPEB cost (expense) (1,767) 625
Employer Contribution (421) (388)
Increase (decrease) in net OPEB obligation (2,188) 237
Net OPEB Obligation - beginning of year 26,807 26,570
Net OPEB Obligation - end of year 24,619$ 26,807$
The Authority’s annual OPEB cost, the percentage of annual OPEB cost contributed to the Plan, and the net OPEB obligation for the fiscal years ended June 30, 2013 through 2015, were as follows: 6/30/2015 (1,767)$ ND (1) 24,619$
6/30/2014 625 62.1% 26,807
6/30/2013 1,198 29.5% 26,570
(1) Not determined due to the annual OPEB cost being less than zero.
Funded Status and Funding Progress – As of June 30, 2014, the most recent actuarial valuation date, the cost was 0% funded. The AAL for benefits was $16,716, and the actuarial value of plan assets was $0, resulting in an UAAL of $16,716. The covered payroll (annual payroll of active employees covered by the Program) was $60,127, and the ratio of the UAAL to the covered payroll was 27.8%. The Schedule of Funding Progress for the Other Postemployment Benefit Plan, presented in the RSI section immediately following the notes to the financial statements, provides a three-year information trend about whether the actuarial values of assets are increasing or decreasing over time relative to the actuarial accrued liabilities for benefits. Actuarial Methods and Assumptions – Actuarial valuations of an ongoing plan involve estimates of the value of reported amounts and assumptions about the probability of occurrence of events far into the future, such as assumptions about future employment, demographic, salary increase, mortality, and the healthcare cost trend. Amounts determined regarding the funded status of the Plan and the annual required contributions of the Authority are subject to continual revision as actual results are compared with past expectations and new estimates are made about the future. Projections of benefits for financial reporting purposes are based on the types of benefits provided at the time of each valuation and the historical pattern of sharing of benefit costs between the employer and employees to that point. The actuarial methods and assumptions used include techniques that are designed to reduce short-term volatility in actuarial accrued liabilities, consistent with the long-term perspective of the calculations. The OPEB specific actuarial assumption used in June 30, 2014 actuarial valuation are as follows: Valuation Date: June 30, 2014

NEW YORK CITY SCHOOL CONSTRUCTION AUTHORITY NOTES TO FINANCIAL STATEMENTS AS OF AND FOR THE YEARS ENDED JUNE 30, 2015 AND 2014 (amounts in thousands, except as noted)
32
Discount Rate: 4.0% per annum
Actuarial Cost Method: Entry age calculated on an individual basis with the Actuarial Value of Projected Benefits allocated on a level basis over earnings from hire through age of exit.
Per Capita Claim Costs: HIP HMO and GHI/EBCBS benefit costs reflect age adjusted premiums. GHI/EBCBS non-Medicare premiums adjusted for Health Savings Agreement changes. Age adjustments based on assumed average age distribution of covered population used for non-Medicare retirees and HIP HMO Medicare retirees.
Age adjustment based on actual age distribution of the GHI/EBCBS Medicare covered population.
Insured premiums without age adjustment for other basic coverage. Premiums assumed to include administrative costs.
Employers’ premium contribution schedule for the months of July 2014 and January 2015 were reported by the New York City Office of Labor Relations (“OLR”). In most cases, the premium contributions remained the same throughout the year. HIP HMO Medicare rates varied by date and by specific Plan option. These variations are the result of differing Medicare Advantage reimbursements. The various monthly rates were blended by proportion of enrollment. For the other rates, where the January 2015 premium rate was different than the July 2014 premium rate, the valuation assumed that the January 2015 premium rate was more representative of the long-range cost of the arrangement.

NEW YORK CITY SCHOOL CONSTRUCTION AUTHORITY NOTES TO FINANCIAL STATEMENTS AS OF AND FOR THE YEARS ENDED JUNE 30, 2015 AND 2014 (amounts in thousands, except as noted)
33
Initial monthly premium rates used in valuations are shown in the following tables:
Plan 20151 20142
HIP HMONon-Medicare Single $ 586.10 $ 579.04 Non-Medicare Family 1435.95 1418.66Medicare 157.55 149.42
GHI/EBCBSNon-Medicare Single 507.793 459.63Non-Medicare Family 1,319.833 1194.24Medicare 160.86 159.69
OthersNon-Medicare Single 586.10 579.04Non-Medicare Family 1435.95 1418.66Medicare 160.86 159.69
__________________
Monthly Rate
3 For June 30, 2014 valuation, GHI/EBCBS Pre-Medicare premiums decreased 2.05% to reflect 2014 Health Savings agreement change to Care Management program and specialty drug (PICA) changes.
1 Used in June 30, 2014 OPEB actuarial valuation.2 Used in June 30, 2013 OPEB actuarial valuation.
Welfare Funds: For the June 30, 2014 valuation, the Welfare Fund contribution reported for fiscal year 2015, (including any reported retroactive amounts) was used as the per capita cost for valuation purposes. The amount used included the $25 increase effective July 1, 2014 under the 2014 Municipal Labor Committee-NYC (MLC-NYC) Health Savings Agreement, as well as further $25 annual increases effective July 1, 2015, July 1, 2016 and July 1, 2017. It is assumed that all Welfare Funds will ultimately be subject to that agreement.
For the June 30, 2013 valuation, the Welfare Fund contributions reflected a three-year trended average of reported annual contribution amounts for current retirees. A trended average was used instead of a single reported Welfare Fund amount to smooth out negotiated variations. The Welfare Fund rates reported for the previous two valuations were trended to current levels based on a historic increase rate of 1.57% for fiscal year 2014 (used in calculating the impact of the negotiated Welfare Fund change), 1.64% for fiscal year 2013, and 2.33% for fiscal year 2012, approximating overall recent growth of Welfare Fund contributions.
For the June 30, 2013 OPEB actuarial valuation, certain lump-sum amounts had been included in calculating the three-year trended average. Furthermore, retroactive adjustments to Welfare Fund contribution rates were used in the trended average as of the dates they were effective (i.e., using the retroactive date).
Weighted average annual contribution rates used for future retirees are as follows:
2015 2014NYCERS 1,693$ 1,700$ BERS 1,677 1,683
Annual Rate

NEW YORK CITY SCHOOL CONSTRUCTION AUTHORITY NOTES TO FINANCIAL STATEMENTS AS OF AND FOR THE YEARS ENDED JUNE 30, 2015 AND 2014 (amounts in thousands, except as noted)
34
Contributions were assumed to increase by Medicare Plans trend rates.
Medicare Part B Premiums: 2015 Medicare Part B Premium assumed to increase by Medicare Part B trend rates.
Calendar Year
2012 $ 99.90
2013 $ 104.90
2014 $ 104.90
2015 $ 104.90*
* Reflected only in June 30, 2014 OPEB actuarial valuation.
Monthly Premium
Medicare Part B Premium reimbursement amounts have been updated to reflect actual premium rates announced for Calendar Years through 2015. The actual 2016 Medicare Part B Premium was not announced at the time these calculations were prepared and, thus, was not reflected in the valuation. For the June 30, 2013 OPEB actuarial valuation (i.e., fiscal year 2014), the annual premium used (i.e., $1,258.80) equaled 6 months of the calendar year 2013 premium plus 6 months of the calendar year 2014 premium. For the June 30, 2014 OPEB actuarial valuation (i.e., fiscal year 2015), the annual premium used (i.e., $1,258.80) equals 6 months of the calendar year 2014 premium (i.e., $104.90) plus 6 months of the calendar year 2015 premium (i.e., $104.90). Future calendar year Medicare Part B Premium rates are projected from the calendar year 2015 rate of $104.90 using the assumed Medicare Part B Premium trend. Overall Medicare Part B Premium amounts are assumed to increase by the following percentages to reflect the income-related increases in Medicare Part B Premiums for high income individuals. The percentages assumed for the June 30, 2014 OPEB actuarial valuation have been increased to reflect revisions to the income-related Part B Premium provisions as adopted in the Medicare Access and CHIP Reauthorization Act of 2015 (“MACRA”).

NEW YORK CITY SCHOOL CONSTRUCTION AUTHORITY NOTES TO FINANCIAL STATEMENTS AS OF AND FOR THE YEARS ENDED JUNE 30, 2015 AND 2014 (amounts in thousands, except as noted)
35
Fiscal Year June 30, 2014 Valuation June 30, 2013 Valuation2014 NA 3.70%2015 3.80% 3.80%2016 3.90% 3.90%2017 4.00% 4.00%2018 4.50% 4.10%2019 5.00% 4.20%2020 5.20% 4.30%2021 5.30% 4.40%2022 5.40% 4.50%2023 5.50% 4.60%2024 5.60% 4.70%2025 5.80% 4.80%2026 5.90% 4.90%
2027 and later 6.00% 5.00%
Income-Related Medicare Part B increases
Medicare Part B Premium Reimbursement: For the June 30, 2014 OPEB actuarial valuation, 90% of Medicare participants are assumed to claim reimbursement (unchanged from last year). Health Care Cost Trend Rate (“HCCTR”): Covered medical expenses are assumed to increase by the following percentages (unchanged from the last valuation).
Year Ending1 Pre-Medicare Plans Medicare PlansMedicare Part B
Premiums20152 9.0% 5.0% 6.0%20163 8.5% 5.0% 5.5%2017 8.0% 5.0% 5.0%2018 7.5% 5.0% 5.0%2019 7.0% 5.0% 5.0%2020 6.5% 5.0% 5.0%2021 6.0% 5.0% 5.0%2022 5.5% 5.0% 5.0%2023 and later 5.0% 5.0% 5.0%
2 For the June 30, 2014 OPEB actuarial valuation, rates shown for 2015 were not reflected since actual
values for the Fiscal Year 2015 per capita costs, Fiscal Year 2015 Welfare Fund contributions and Calendar Year 2015 Medicare Part B Premium amounts were used.
1 Fiscal Year for Pre-Medicare Plans and Medicare Plans and Calendar Year for Medicare Part B
3 For the June 30, 2014 OPEB actuarial valuation, HIP and HMO Pre-Medicare trend assumed to be
2.89% based on 2014 Health Care Savings Agreement initiatives.
Amortization of Changes to UAAL: All changes in the UAAL as of June 30, 2014 are being amortized over a one-year period for purposes of calculating the ARC except for the amount of change in UAAL attributable to the change in the Actuarial Cost Method, established as of June 30, 2012, which is being amortized over a closed 10-year period using level-dollar amortization. This is the minimum period permitted in cases where there is a significant reduction in the UAAL.
36
REQUIRED SUPPLEMENTARY INFORMATION

New York City School Construction Authority Required Supplementary Information (Unaudited) Schedule of Funding Progress for the Other Postemployment Benefits Plan (Unaudited) June 30, 2015, 2014 and 2013 (amounts in thousands, except as noted)
37
UAAL as a
Actuarial Actuarial Actuarial Unfunded Percentage
Valuation Value of Accrued AAL Funded Covered of Covered
Year Ended Date Assets Liability (AAL) (UAAL) Ratio Payroll Payroll
June 30, 2015 June 30, 2014 -$ 16,716$ 16,716$ 0% 60,127$ 27.8%
June 30, 2014 June 30, 2014 - 17,900 17,900 0% 58,363 30.7%
June 30, 2013 June 30, 2014 - 16,827 16,827 0% 60,121 28.0%

New York City School Construction Authority Required Supplementary Information (Unaudited) Schedule of the Authority’s Proportionate Share of the Net Pension Liability June 30, 2015, 2014, 2013 and 2012 (amounts in thousands, except as noted)
38
Schedule of The Authority's Proportionate Share of the Net Pension Liability (BERS)
For the Fiscal Year Ended 2015 2014 2013 2012
The Authority's proportion of the net pension liability 4% 4% 4% 4%
The Authority's proportionate share of the net pension liability (assets)
$ 43,135 $ 36,523 $ 53,003 $ 58,518
The Authority's covered employee payroll $ 34,406 $ 40,673 $ 40,063 $ 49,318
The Authority's proportionate share of the net pension liability (asset) as a percentage of covered employee
payroll
125.37% 89.80% 126.01% 118.65%
Plan fiduciary net position as a percentage of the total pension liability
75.77% 78.34% 66.85% 41.61%
Schedule of The Authority's Proportionate Share of the Net Pension Liability (NYCERS)
For the Fiscal Year Ended 2015 2014 2013 2012
The Authority's proportion of the net pension liability 0.047% 0.048% 0.048% 0.048%
The Authority's proportionate share of the net pension liability (assets)
$ 9,582 $ 8,649 $ 11,075 $ 11,997
The Authority's covered employee payroll $ 6,705 $ 6,657 $ 6,939 $ 6,657
The Authority's proportionate share of the net pension liability (asset) as a percentage of covered employee
payroll
142.91% 129.92% 159.61% 180.22%
Plan fiduciary net position as a percentage of the total pension liability
73.39% 75.32% 67.18% 63.08%

New York City School Construction Authority Required Supplementary Information (Unaudited) Schedule of the Authority’s Contribution (amounts in thousands, except as noted)
39
Schedule of Employers Contributions (in thousands) for BERS
Fiscal Year Ended June 30 2015 2014 2013 2012 2011 2010 2009 2008 2007 2006
Actuarially Determined Contribution $ 8,803 $ 8,645 $ 7,850 $ 8,546 $ 7,208 $ 5,894 $ 5,369 $ 5,724 $ 5,193 $ 3,634
Contribution in relation to the Actuarially Determined Contribution
$ 8,803 $ 8,645 $ 7,850 $ 8,546 $ 7,208 $ 5,894 $ 5,369 $ 5,724 $ 5,193 $ 3,634
Contribution Deficiency (Excess) $ - - - - - - - - - -
Contribution as a percentage of Covered
Employee Payroll 17.81% 17.41% 16.46% 17.33% 20.46% 17.82% 17.77% 19.63% 18.64% 14.93%
Schedule of Employers Contributions (in thousands) for NYCERS
Fiscal Year Ended June 30 2015 2014 2013 2012 2011 2010 2009 2008 2007 2006
Actuarially Determined Contribution $ 1,675 $ 1,504 $ 1,462 $ 1,448 $ 1,146 $ 1,055 $ 1,032 $ 900 $ 706 $ 492
Contribution in relation to the Actuarially Determined Contribution
1,675 $ 1,504 $ 1,462 $ 1,448 $ 1,146 $ 1,055 $ 1,032 $ 900 $ 706 $ 492
Contribution Deficiency (Excess) $ - - - - - - - - - -
Contribution as a percentage of Covered
Employee Payroll 24.98% 22.46% 21.07% 21.75% 19.99% 19.22% 19.74% 18.25% 14.93% 106.76%