a compilation of the geology and hydrology of the black mountains-bullhead city area, arizona
TRANSCRIPT
A COMPILATION OF THE GEOLOGY AND HYDROLOGY OF THE BLACK MOUNTAINS-BULLHEAD CITY
AREA, ARIZONA
by Raymond C. Harris
Arizona Geological Survey Open-File Report 98-26
December, 1998
Arizona Geological Survey _ 416 W. Congress, Suite #100, Tucson, Arizona 85701
(Includes 40 pages text)
Produced in cooperation with the US Geological Survey
This report is preliminary and has not been edited or reviewed for confonnity with Arizona Geological Survey standards


A COMPILATION OF THE GEOLOGY AND HYDROLOGY OF THE
BLACK MOUNTAINS-BULLHEAD CITY ARE~ ARIZONA
INTRODUCTION
This report presents a compilation of geologic and hydrologic information for the Bullhead City-Black Mountains area of we stem Arizona. The purpose of the project is to determine the significance of mining, geology, and geohydrology in the chemistry of Bullhead City area groundwater. Mining in the Black Mountains has taken place since the 1800s, and the region provides a good opportunity to investigate any links between mining and water quality.
The study encompasses the area from the crest of the Black Mountains on the east, the Colorado River on the west, latitude 350 on the south and the top of township 2IN at the north (Figure 1). Information was compiled from published and unpublished sources including U.S. Bureau of Land Management, U.S. Geological Survey, U.S. Bureau of Mines, U.S. Natural Resources Conservation Service (Department of Agriculture), Arizona Geological Survey, Arizona State Land Department, Arizona Department of Water Resources, and Arizona Department of Environmental Quality.
LAND STATUS AND LAND USE
Land ownership in the Black Mountains-Bullhead City area includes State, Federal, Indian Reservation, and private lands. This information was obtained in digital format from the Arizona State Land Department, through the Arizona Land Resource Information System (ALRIS). (That version ofland status is digitized from 1979 BLM maps, and some changes may have occurred since that time.)
Private land accounts for about 55,3p9 acres in the study area, of which approximately 12,225 acres are in patented mining claims. Federal land comprises 115,960 acres (Bureau of Land Management: 107,365 acres; Lake Mead National Recreation Area: 8,595 acres). Approxirnatelyl5,092 acres are held by the State of Arizona. Tribal land of the Fort Mohave Indian Reservation accounts for approximately 19,340 acres.
Land use in the study area includes developed land (residential, commercial, industrial) at Bullhead City and Oatman, and recreation along the Colorado River and Lake Mohave, part of Lake Mead National Recreation Area. Most of the study area is open desert and hilly range land. This land, consisting of State, Bureau of Land Management, and private land outside developed areas, is used mostly for open space, and intermittent cattle grazing occurs on some portions. Patented mining claims account for approximately 12,225 acres in the study area. Most of the patented land is near Oatman.
1

GEOLOGY
General An index of geologic maps covering the study area is presented in Figure 2. The maps
range from very detailed studies of the Oatman area to general reconnaissance of northwestern Arizona. The index is based on those of Scarborough and Coney (1982) and Harris and others, (1994). Many of the maps cover basically the same area and rather than try to show the exact boundaries covered by each map, those that are similar are combined. The general geology of the Oatman and Katherine areas are shown in Figures 3 and 4, respectively, and the study area on Sheet 1.
Bedrock Basement rocks in the Black Mountains-Bullhead City area consist of Precambrian schist
(1.7 Ga) intruded by granite (1.4 Ga). The granite is an anorogenic megacrystic or porphyritic ("rapakivi") granite, typical of Precambrian granites in the southwestern United States (J.L. Anderson, 1989). It commonly displays a gneissic texture and is generally weathered and crumbly (Lausen, 1931). The granite is composed ofK-feldspar, plagioclase, quartz, biotite, and hornblende.
A thick sequence of mid-Tertiary (30 to 15 Ma) igneous rocks covers and is faulted against Precambrian basement (Figure 3 and 4). Volcanic rocks include tuffs,fiows, and breccias oflatite, andesite, and rhyolite.
At the bottom of the sequence is the Alcyone Formation, consisting of flows, tuffs, and breccias of trachyte and latite. Unconformably overlying the Alcyone are the three units comprising the "middle volcanics" of Thorson (1971). The bottom unit is the Esperanza Quartz Latite, overlain by the Oatman Andesite and Gold Road Dacite of DeWitt and others (1991), formerly known as the Gold Road Latite (Ransome, 1923). Most of the mineralization in the Oatman district is hosted by the Oatman Andesite, and to a lesser extent by the Gold Road Dacite.
An upper volcanic sequence unconformably overlies the middle volcanics. Starting with the oldest, the units of the upper volcanics are the Antelope Rhyolite, Cottonwood Formation, Flag Spring Quartz Latite, and Meadow Creek Quartz Latite. Unconformably capping the "upper volcanics" is a relatively young unit of basalt flows with interbedded rhyolite ash.
The lower and middle volcanics (Alcyone Formation, Oatman Andesite, and Gold Road Dacite) are intruded by the Times Porphyry, an alkali granite laccolith, and the Moss Porphyry, a tonalite-granodiorite stock
Mineralization in the Oatman and Union Pass districts is controlled by faults and fracture sets associated with mid-Tertiary volcanic activity. Dominating the structural setting of the area is the proposed resurgent Alcyone caldera (Thorson, 1971). However, veins do not appear to be spatially or temporally related to the caldera and mineralization occurs only in fractures radial to the caldera (DeWitt and others, 1991).
Basin Fill Fanglomerate: A thick sequence of basin-fill sediments was deposited in the Mohave Valley, in the northern part of which the study area is located. On the Nevada side of the Colorado River, about 5 miles southwest of Bullhead City is an exposure of the oldest basin-fill alluvium in the Mohave Valley, a Miocene(?) fanglomerate (Metzger and Loeltz, 1973). Although no outcrops are found on the Arizona side of the river, this unit presumably underlies much of the study area.
Consisting of angular to subrounded and poorly sorted pebbles cemented in a sandy matrix, the fanglomerate was derived from a nearby source (Metzger and Loeltz, 1973). As in
2

~ A. Mt I Davis .'
MtTipton A.
o ("l{ O· s\ ":0\
!
b'. o '.
.,. Chloride . \ ~ •• t; \~ . ;:.
:::0 • 0
-I~ <. ~ rn· --:::0\ .
\. Katherine T22N .l. ... ~ ... ~ ... ~ .. • • • nrN· iii
Davis Dam' ) >\.,. •
HWY68
:1 , Bullhead
..... City
"'. ..... "
...... "1tt.-- " ';::. , . ~ C·, / ~ "1 '" ~ It> Oatman ""a .......... .
J ~ : ~ r:t /' ) .......... -..........• . . '. '-----... "
'\ .
-• --STUDY ! AREA • •
\
.................................
5 I
MILES
i NORTH
. ............ . .....
...••. ...•.
....
Figure 1. Location of the Black Mountains study area.
3
10 I

.' ~ . A Mt I Davis
r (). O· b\
-;0" >,"\ 0", o " .
l r ... ~ \CI> ,i:,
':tl I' ~ <, ~ m· ~ ':tl\
. . \AZ • "
"'" Topock
~ ~ .,:
Mt Tipton A
o 5 10 ! ! !
MILES
...• Chloride i NORTH
Hwy68
5 I £.
1-41 IE-~
I I I 00 I I ~ I
I
\
Figure 2. Index of geologic maps of the Black Mountains. References are listed on following page.
4

Figure 2 continued. Index of geologic maps of the Black Mountains. References:
1) Longwell, 1963: USGS Professional Paper 374-E, Plate 1, scale 1:125,000.
2) Metzger and Loeltz, 1973: USGS Professional Paper 486-J, Plate 1, scale 1:125,000.
3) Lausen, 1931: AZ Bureau of Mines Bulletin 131, Plate II (p. 21), scale 1:100,000.
Wilson and others, 1934: AZ Bureau of Mines Bulletin 137, Figure 6 (p. 102), scale 1:100,000.
Gardner, 1936: US Bureau of Mines IC 6901, Figure 9, scale 1:100,000.
4) DeWitt, 1987: SEG Guidebook, V.l, p. 29, Figure 1, scale 1: 250,000.
5) Gray and others, 1990a: USGS Bulletin 1737-D, Figure 2, scale 1:80,000.
6) Gray and others, 1990b: USGS Bulletin 1737-F, Plate 1, scale 1:62,500.
Gray and others, 1990c: USGS Open-File Report 90-520, Figure 2, scale 1:163,000.
7) Durning and Buchanan, 1984: AZ Geological Society Digest 15, Figure 2, scale 1:85,00; (detailed figures 5, 6, 7, and 8 are within the area of Figure 2).
Clifton and others, 1980: AIME preprint 80-143, Figure 2,scale 1:80,000
DeWitt and others, 1991:USGS Bulletin 1857-1, Fig. 2, scale 1:100,000; Fig. 9, scale 1:50,000.
Ransome, 1923: USGS Bulletin 743, Plate 1, scale 1:48,000.
Gardner, 1936: US Bureau of Mines IC-6901, Figure 2, scale 1:58,000.
Spencer and Welty, 1989: AGS Digest 17, Figure 3, scale 1:80,000.
Smith, 1984: University of Arizona M.S. Thesis, Figure 2, scale 1:48,000.
Lausen, 1931: AZ Bureau of Mines Bulletin 131, Plate 1, scale 1:48,000.
Wilson and others, 1934: AZ Bureau of Mines Bulletin 137, plate 1, scale 1:48,000.
Marsh and McKeon, 1983: Economic Geology, V78, no. 4, Figure l,scale 1:160,000.
Korzeb, 1988: US Bureau of Mines Open-File Report MLA 48-88, Figure 2, scale 1:24,000
Entire area: - Reynolds, S.J., 1986, Geologic map of Arizona: ABGMT [AZGS] Map 26, scale 1:1,000,000
- Wilson and Moore, 1959: ABM [AZGS], Geologic map of Mohave County, scale 1:375,000
- Anderson and O'Connell, 1993: US Bur Rec Seismotectonic Report 93-4, Figure 2-2, scale 1:500,000.
- Lee, 1908: USGS Bulletin 352, Plate 1, scale 1:1,000,000.
- Schrader, 1909: USGS Bulletin 397, Plate 1, scale 1:250,000.
5


-...l
"'-\0
)-< 7
~ I)
~: III
'"
l 18 17
------.. ' '""u'f'~ I. v.·; .... ... !'III! .:I,p
16
GE.OLOGIC MAP Of THE
KATHERINE DISTRICT MOHAVE COUNTY, ARIZONA.
15
LEGEND
Scale o )000 zooo 3000 "000 sooofc:d
I
May 1:7,)1.
14
36
13
'II) 11/ '" 1\:1(
P~hm T~rI18rtf.. 0!:!!!~r/Vr!/
~ :t)(G
""'hcrlll< 6 .... ,,,'1:
[Z3 "'"'" ~ B. 0 ~Jc:!I~~ !rn",;;>.',/ .. RI"/~JJJ. (,' ..... ·11.
rr~c:h.,h· F/." ... .sl/h'/t.:. iuk.·J
Figure 4. Geologic map of the Katherine District. (from Lausen, 1931)
-rZ2N

other exposures to the south (Metzger and others, 1973), the fanglomerate underlies the Bouse Formation. Where the Bouse is not present, the fanglomerate is virtually indistinguishable from younger, post-Bouse alluvium. The unit is gray where the clasts are predominately igneous and metamorphic, or brown where derived from volcanic or other sedimentary rocks.
The fanglomerate generally dips 2 to 4 degrees toward the basin, and is deposited unconformably on bedrock. This low angle of dip indicates deposition during the latest stages of mid-Tertiary deformation. A Miocene age is inferred from relations between the fanglomerate and rocks containing fossils west of Needles (Metzger and Loeltz, 1973).
Information about the fanglomerate underneath the study area comes from a limited number of water wells. Drillers' logs for two wells are included in Metzger and Loeltz (1973). In the log for well (B-20-22)35dcc [cdd on their map], fanglomerate is encountered at 168 feet. In well (B-20-22)23bcd, no clear-cut contact with the overlying Bouse is discernible fonn the driller's notes. Clay and silt, probably Bouse, extend down to 80 feet. Coarse to fine sand is found to 170 feet; which unit this represents is unclear. Below this sand is gravel to boulders, which is probably the fanglomerate unit.
Bouse Formation: A sharp unconformable contact between the fanglomerate and the overlying Bouse formation records an abrupt change from alluvial deposition to lacustrine conditions. Although only a few small outcrops of the Bouse are exposed in the Mohave Valley, it is encountered in many wells. The formation, included in the 'Chemehuevi Formation' of Longwell (1963), consists oflimestone, marl, clay, silt, sand, and tufa indicative of closed-basin conditions, followed by sand and gravel representing a prograding river delta.
The base of the Bouse is marked by a limestone unit 1 to 26 feet thick. This limestone is white, marly, and to some degree tuffaceous. The insoluble residue (ash?) ranges from 10 to 30 percent (Metzger and Loeltz, 1973). A prominent outcrop of the limestone is found in Silver Creek about nine miles east of Bullhead City in T20N, R21W, sec 25, SW comer, at an elevation of 1700 to 1760 feet. Strontium isotope composition indicates an unmistakable lacustrine, rather than marine, origin for this marl (Spencer and Patchett, 1997).
Above the limestone is an interbedded unit consisting of silt and clay. The clay is a greenish montmorillonite that swells when wetted. The clay beds are extremely fine and sand is completely absent (Metzger and Loeltz, 1973). Tufa is found at the same location as the marl in Silver Creek. The tufa here is light gray, very porous, and always rests on volcanic rocks.
GEOMORPHOLOGY AND SOILS
Landscapes in western Arizona are dominated by large, alluvium-filled basins separated by long, narrow mountain ranges. Two episodes of extensional tectonics are responsible for the present topography. The first of these was the mid-Tertiary extension that produces movement on low-angle nonnal faults, commonly referred to as detachments. Extension was active from 22 to 15 Ma in the Black Mountains area, part of the Whipple tilt-block domain (Spencer and Reynolds, 1989). Detachment faulting produced numerous basins in the tilted fault-blocks that filled with Miocene sediments, such as the fanglomerate basin-fill unit discussed above.
A second major episode of faulting, the Basin and Range disturbance, affected western Arizona starting about 12-15 Ma (Menges and Pearthree, 1989). This faulting produced much of the present topography in the Basin and Range Province. Voluminous volcanism accompanied this later faulting.
During much of the mid- to late-Tertiary, basins in the region were internally drained. Sedimentary units such as the Muddy Creek formation (Longwell, 1963) and Bouse Formation
8

(Metzger and Loeltz, 1973) contain unequivocallacustrine/playa deposits. Although long considered to be of possible marine origin, the Bouse Formation has been shown to be lacustrine on the basis of strontium and carbon isotopes (Spencer and others, 1996, Spencer and Patchett, 1997). Isotope compositions of marls and fossils in the Bouse are identical to Colorado River water and are far removed from the composition of Pliocene seawater.
Integration of drainages into what is now the Colorado River commenced in the study area sometime during or after the deposition of the Muddy Creek and Bouse Formations. The first arrival of Colorado River water into the basins along the present river is recorded by the Bouse Formation (Spencer and Patchett, 1997). A series of prograding deltaic deposits overlie the lacustrine beds (Buising, 1988), marking downcutting through the bedrock highs separating the basins and development of an uninterrupted through-flowing river.
Cycles of downcutting and sedimentation have produced seven geomorphic surfaces between the Black Mountains and the Colorado River (Herriman and Henricks, 1984). Soils developed on the surfaces have been mapped by the Kingman offices of the Bureau of Land Management and Natural Resources Conservation District. (soil maps are available from those offices, and are on file with AZGS) The following summary of these surfaces and their associated soils is from Herriman and Henricks (1984):
Earp (Horseshoe) surface - Lower of the two floodplains, and active slopes of washes; partial abandonment as flood plain less than 500 years ago; subject to flooding. Soils: Carriso, Glenbar, Rositas.
Cimmaron Lake Ongram) surface - Higher of the two floodplans; age 550-3,290 years B.P. Soils: Antho, Torriorthents, Indio.
Arch Creek (Winkle) surface - Oldest surface directly related to present drainages; early Holocene; Age 3,290-12,240 years B.P. Soils: superstition, Indio variant, Havasu series.
Fort Mohave (Senecal) surface - Low fan terraces and stream terraces; Late Pleistocene; desert varnish. Soils: Gunsight, Superstition, Denure.
McHeffv (Dolph) surface - Displaced from Bullhead surface by fault; narrower interfiuves, more eroded vs. Bullhead; Middle Pleistocene. Soils: Chuckwalla.
Bullhead (Dolph) surface - Extensive in region; remnants of alluvial fans; deeply dissected; well-developed desert pavement. Soils: Chuckwalla.
Boundary Cane (Bola) surface - Oldest erosional remnants in region; fan terraces; little or no desert pavement. Soils: Cipriano.
Mountains slopes are actively eroding and no particular age is assignable to them. Soils developed on mountains slopes are Akela, Cellar, Quilotosa, and Laposa.
MINES AND MINERALIZATION
In the early days of mining in the Black Mountains, different authors organized the mines in the study area into various combinations of mining districts including the San Francisco, Katherine, Oatman, Union Pass, Gold Road, Vivian, and Boundary Cone districts. Keith and others (1983) divided ore deposits into two metallic mineral districts, Union Pass at the north edge of the study area, and Oatman, at the south end of the Black Mountains. A summary of mines in the study area is presented in Appendix A.
9

Gold-bearing veins in the Oatman district are associated with northwest-trending fractures and shear zones. Although the fractures and veins cut the entire volcanic sequence, most of the mineralization is in the Oatman Andesite, occupying roughly the middle of the volcanic sequence.
The Union Pass and Oatman metallic mineral districts display pervasive argillic-phyllic alteration and mineralized zones show propylitic, and silicic wall rock alteration associated with veins (Durning and Buchanan, 1984; Marsh and McKeon, 1983). Characteristics of the types of alteration are: • Argillic: alteration of feldspar to kaolinite; rocks are bleached, soft to crumbly; assemblage of
alunite, kaolinite, calcite, quartz. • Phyllic: feldspars altered to kaolinite; rocks are bleached, soft, crumbly; assemblage of calcite,
quartz, kaolinite, illite. • Propylitic: feldspars tinted green; green patches in outcrop; assemblage of chlorite-pyrite
carbonate-montmorillonite-illite ± epidote. • Silicic: silicification of volcanic rocks, development of quartz veins.
Union Pass and Oatman are mid-Tertiary gold districts, with essentially no base metals. Mineralization in the Black Mountains is different from many of Arizona's large mining districts in that the ore contains little or no sulfide minerals (Schrader, 1909; Ransome, 1923). In total, ore in the district contains <2% sulfides (Sillitoe, 1993). Deposits in the area consist of epithermal, goldbearing, quartz-calcite-adularia veins. Gold grades are highest in veins with fine-grained quartz and significant adularia (Smith, 1984; Buchanan, 1981). The district contains an estimated 69 metric tons of gold (Durning and Buchanan, 1984; Sillitoe, 1993). Much of the production from the Union Pass (Katherine) and Oatman districts came before wwn. Total production figures (to 1980) are summarized in Table 1.
Table 1. Production from mining districts in the study area to 1980 •
... !?.!.~!.:.!.q!. ............................ .r..q.l!~ .. gf9.:'~ ..................... 9.gp.P..~.~ .. (J~.~L .............. gq.?q,JqE.L .................... §.~!.y..f!,:. . .cqE.L ............... . Oatman 4,073,000 60,000 1,966,000 1,147,000 Union Pass 704,000 128,000 313,000 Data from Keith and others, 1983
Additional production since 1980 has been sporadic. The Gold Road Mine, currently the only active mine in the study area, was reopened in 1995 by Addwest Minerals, with production of 66,636 ounces of gold from January 1995 through the first quarter of 1997 (Silver, 1997).
Beryllium is reported in mill tailings from several mines in the area (Warner and others, 1959). Samples with 0.03% BeO were taken from the Katherine mill. Ore from the Arabian, Katherine, Frisco, and Tyro mines were processed at the Katherine mill; which mines the beryllium came from was not determined. Tailings from the Gold Road Mine had up to 0.06% BeO, while Tom Reed Mine tails contain 0.001 % BeO. Mines with mill tailings less than 0.001 % BeO include Mossback, United Eastern, Big Jim, Vivian, and Leland.
Volcanic terranes with calderas are considered favorable for uranium mineralization by the US Department of Energy (Files, 1978). The Black Mountains contain an inferred caldera that contains resurgent intrusive rocks (Thorson, 1971; Clifton and others, 1980) and fit the criteria for a favorable environment for uranium mineralization. However, all known mines in Mohave County were examined by the Atomic Energy Commission for uranium and thorium and these elements were found at normal background levels in the Black Mountains (Hart, 1955). In addition, a scintillometer survey was performed along roads, with no U or Th anomalies being discovered.
10

STREAM SEDIMENTS
An evaluation of uranium in stream sediments was perfonned for the US Department of Energy (Qualheim, 1978) as part of the National Uranium Resource Evaluation (NURE) Program. The results of that survey are tabulated in Table 2. Uranium in the stream sediment samples for the entire Kingman Ix 2 degree quadrangle averaged 2.16 ppm, and thorium averaged 13.63 ppm. Stream sediments within the present study area averaged 2.63 ppm U and 18.36 ppm Th. As with the survey of mines, no anomalous levels of uranium or thorium were found in the sediments derived from the Black Mountains.
Stream sediment samples were analyzed as part of surveys of several Bureau of Land Management Wilderness Study Areas (WSAs). Stream sediments were analyzed in a study of the Mount Nutt WSA (Gray and others, 1990a). That study found anomalies for mercury (0.1-0.6 ppm), gold (0.05-0.1 ppm), arsenic (10-18 ppm), lead (up to 200 ppm), zinc (up to 250 ppm), and barium (2000-3000 ppm) in the northwest part of the WSA (Union Pass area). Another anomaly of mercury (8-16 ppm) and molybdenum (up to 15 ppm) was delineated in the southeastern part of the WSA (east and outside of this study). Locations of the samples and anomalies were not given in the report.
A thorough sampling of mines, prospects, and stream sediments was performed for the adjacent Wann Springs WSA, in the southern Black Mountains (Bullock and others, 1990). However, none of these samples are within the present study area.
11

Table 2. Uranium and thorium in stream sediments
SAMPLE LAT LON U ppm error % Th ppm error % 7371 35.1726 -114.4349 4.01 1.37 24.06 2.10 7372 35.0769 -114.4281 2.78 1.46 17.75 1.68 9600 35.1983 -114.4573 1.95 2.09 30.87 2.72 9681 35.1320 -114.5197 2.69 1.49 19.61 1.81 9684 35.2347 -114.5363 2.58 1.6 15.55 2.31
10644 35.1561 -114.4212 4.38 1.4 23.82 2.83 10646 35.1453 -114.4227 2.75 1.53 21.14 1.79 11136 35.0559 -114.4134 2.34 1.51 15.66 1.46 11137 35.0943 -114.4429 2.74 1.46 17.92 1.37 11201 35.1969 -114.4331 1.87 2.19 29.17 2.93 11202 35.1985 -114.4243 1.99 1.93 26.99 2.33 11203 35.1984 -114.4177 1.90 1.88 23.43 2.08 11204 35.1803 -114.4161 3.03 1.83 26.29 3.78 11205 35.1834 -114.4347 2.47 2.01 25.48 3.47 11224 35.0481 -114.4707 2.74 1.56 17.75 2.19 11225 35.0535 -114.4738 2.06 1.68 17.45 1.74 11226 35.0412 -114.4873 2.49 1.52 14.88 1.61 11227 35.0336 -114.4700 1.93 1.69 10.64 1.53 11228 35.0154 -114.4607 2.52 1.58 16.75 2.04 11229 35.0133 -114.4487 2.72 1.51 10.0 1.94 11230 35.0257 -114.4374 2.58 1.49 16.06 1.6 11231 35.0041 -114.3943 2.93 1.55 19.4 2.17 11232 35.0281 -114.4209 2.40 1.75 17.14 2.43 11233 35.0288 -114.0288 2.53 1.52 17.59 1.62 11234 35.0257 -114.3958 2.73 1.48 15.58 1.65 11235 35.0559 -114.4145 2.37 1.61 16.77 1.92 11236 35.0748 -114.4567 2.30 1.72 9.37 2.26 11237 35.0665 -114.4471 2.07 1.72 14.40 2.0 11238 35.0934 -114.4429 2.78 1.46 17.14 1.55 11239 35.1135 -114.4544 2.64 1.85 15.47 3.38 11240 35.1161 -114.4499 2.70 1.70 16.63 2.61 11241 35.0903 -114.4233 2.78 1.46 15.83 1.48 11242 35.0935 -114.4046 3.25 1.46 20.02 1.91 11243 35.1101 -114.3788 3.05 1.48 20.34 1.71 11244 35.1097 -114.4008 2.40 1.67 17.59 2.03 11245 35.1227 -114.4190 2.54 1.57 18.33 1.94 11246 35.0764 -114.4029 2.38 1.67 16.48 2.02 11247 35.0765 -114.3689 2.33 1.74 15.83 2.2 11248 35.0405 -114.3712 3.28 1.47 17.71 1.97 11408 35.2031 -114.5570 3.38 1.35 11.42 1.85
Average 2.63 1.63 18.36 2.10
(Data from Qualheim, 1978)
12

HYDROLOGY
Surface water Surface water is scarce in western Arizona, owing to the arid climate. Average annual
rainfall is about 5 inches. Streams are ephemeral everywhere in the study area, with the exception of the Colorado River. Runoff in the ephemeral streams occurs only during heaviest rains and lasts usually not more than several hours.
Hydrologic conditions in the lower Colorado River region have bee extensively studies by the US Geological Survey. General aspects of water resources in the region are discussed in Hely (1969) and McDonald and Loeltz (1976). Data on precipitation and runoff for the lower Colorado River region are presented in Hely and Peck (1964).
Colorado River water is of good quality for municipal and agricultural use. Weightedaverage annual concentrations ofTDS below Hoover Dam ranged from 599 to 837 mgll for the 1935 to 1965 (Irelan, 1971). Variations in flow rates have decreased since construction of Glen Canyon and Hoover Dams upstream from the study area. TDS is also less variable, but has increased slightly due to evaporation from the lakes. Colorado River water is generally of a calcium-sulfate type, with sodium-chloride found in lesser, but important concentrations.
Groundwater Water from wells along the Colorado River was analyzed by the US Geological Survey
(Metzge( and Loeltz, 1973) and data from that study is summarized in Table 3. Groundwater samples generally came from wells perforated at shallow depths. These wells receive most or all of their water through infiltration of river water through a shallow alluvial aquifer, and many of the wells have water chemistry identical to that of Colorado River water (Metzger and others, 1973). The Colorado River undergoes a net loss of water from infiltration and evapotranspiration (McDonald and Loeltz, 1976). Contributions to the river·by way of subflow from the surrounding valleys is insignificant.
Upon infiltration into the shallow groundwater aquifer, river water is modified by several processes, including bacterial sulfate reduction, concentration by evapotranspiration, and precipitation of calcium and magnesium carbonates (Metzger and Loeltz, 1973). In the deeper wells, TDS is higher and may be influenced by more saline water ~in contact with the Bouse Formation.
A USGS investigation of groundwater quality in the Colorado River drainage area (Kister, 1973) included wells in the study area. Fluoride levels were 5.0 to 10.0 mg/l in a well near Davis Dam. Six other wells in the study area had fluoride less than 1.0 mgll. Fluoride levels in the USGS investigation were correlated to the amount of silicic volcanic rocks or Precambrian schist, both of which are common in the region. Most of the groundwater had TDS of less than 1000 mgll, but an area around Bullhead City and Mohave City had TDS of 1000 to 3000 mgll. High IDS correlates with the presence of lacustrine deposits, such as the Bouse Formation. Wells farther from the river may tap deeper aquifers and have more variable chemistry and higher IDS than wells closer to the river.
Water quality information for a limited number of wells in the study area for the period 1988-1995 is available from the Arizona Department of Environmental Quality. This information includes well location by township, range, and section, water use, and chemical analyses.
Water quality analyses for these wells are tabulated in Table 4(values in mgll). Water quality is highly variable, with TDS ranging from 320 to 3800 mgll. Major cations and anions are similarly variable. Because some labs have different styles of reporting results for different
13

methods and for results below detection limits, some of the entries in table 4 have "nd" for nondetect (i.e., below the detection limit), while others indicate non-detect as "<O.OOX".
Metals are most commonly below the detection limits and the number of analyses above detection limits are too few to provide definitive information of any relationship between mining and water quality. Correlations between metals seem very weak and provides little or no evidence of mining negatively affecting the quality of the groundwater (Figure 5a-j). As expected, some weak general trends of metal content versus pH are noted in the plots. If mining were affecting water quality significantly, one would expect some wells with anomalous levels of several metals, and this is not apparent in the data. For example, not one of the wells with silver -a major component of ore in the region- has copper above the detection limit. Only five wells have both Ag and Cd measured and, if real, the possible weak correlation is negative. Lead is the only metal the shows any hint of a positive correlation with Ag and that is mostly from a single point, hardly a robust argument for mining affecting the water quality to an important degree.
Wells in the Kingman 1°x2° quadrangle were sampled by the U. S. Department of Energy for uranium and thorium (Qualheim, 1978). Average uranium in water samples for the entire quadrangle was 5.01 ppb, with a median value of 4.94 ppb.- Only two of these wells (7371 and 15257) are in the study area, and they ran 14.68 and 2.14 ppb uranium, respectively.
14

....... v.
Well Lat
(B-19-22) 11 bab 35.055
(B-19-22)11bbd 35.0523
(B-19-22)14cca 35.0295
(B-19-22)15abb 35.0403
(B-19-22)15acb 35.0367
(B-19-22)15dad 35.0283
(B-19-22)23ccc 35.0133
(B-19-22)26aab 35.0113
(8-20-22)1 aca
(B-20-22) 1 add
35.15
35.1467
(B-20-22)19ada 35.1038
(B-20-22)25bab 35.095
(B-20-22)26cdb 35.0875
(B-20-22)26dcd 35.0845
(B-20-22)29acc 35.0867
(B-20-22)35cdd 35.07
(8-21-21 )21 ebb 35.1895
Lon
-114.5916
-114.5942
-114.5925
-114.6057
-114.6058
-114.5975
-114.5967
-114.5838
-114.5658
-114.5625
-114.6142
-114.5733
-114.5925
-114.585
-114.6033
-114.5892
-114.5338
Table 3. Groundwater quality in the Bullhead city area
Water Ca-Mg Noncarb Date T.O. Level (ft) Silica Ca Mg Na + K % Na HC03 S04 CI E TOS hard hard conduct Iili
5/2162
4113/67
4113/67
6/3/64
9/18/62
4113167
9/19/62
4111167
4123/68
6/3/64
9118/62
4124168
4124/68
4124168
9118/62
5/7/68
3/7/62
21
230
130
120
150
228
120
249
150
318
150
220
80
490
17.5
19.4
120
70
60
97
92
27
153
288
22 70
24 105
19 82
25 265
34 159
31 348
15 76 22 134
18 79 24 121
18 68 20 152
24 116
21 87
36 121
27 279
18 174 56 200
24 180 50 145
28 92 29 142
37 27 0.6 211
38 73 3.4 212
8 14 2.2 141
24 52 14 73
44 65 10 805
11 11 1.2 156
Data from Metzger and Loeltz, 1973
68
46
70
51
47
57
38
65
40
32
47
87
70
88
46
90
92
256
224
220
200
182
224
236
228
272
154
180
188
152
130
162
128
124
362 190 0 1060
338 148 1.2 921
375 365 1.1 1330
275 87 0.4 709
283 82 0.2 698
183 145 0.5 699
267 161 0.4 843
250 342 1.1 1220
540 222 0.7 1350
400 302 0.5 1180
267 163 0.3 811
100 174 9.5 653
120 282 4.0 808
120 82 1.7 434
95 81 0.4 420
140 1200 4.5 2330
65 57 4.8 518
278
400
332
282
296
250
437
326
665
655
348
70
196
44
188
204
28
68
216
152
118
147
66
224
139
442
528
200
o 72
o 55
99
o
1770 7.3
1530 7.6
2240 7.5
1120 7.2
1080 6.8
1230 7.5
1350 7.1
2050 7.7
2090 7.7
1880 7.2
1270 7.0
1110 8.1
1430 7.4
746 8.2
724 7.2
4430 7.7
763 8.1


Figure 5. Water quality relations in the Black Mountains-Bullhead City area
0.45
0.4
0.35
0.3
0.25 ~ ()
0.2
0.15
0.1
0.05
0 6.5
0.Q35 .
0.03
0.Q25
E 0.02
'" ·s e .c o 0.015
0.01
0.005
a
b
•
•
• 7
Copper vs. pH
•
•
• 7.5
• . ~ . pH
• • ••••
8
Chromium vs pH
• •
.-----.---~----------.-------.
•
• • •
• • • • • • • •
• • • • •
8.5
. .. -. ------------1
•
O~------~_+~~.·.~~~.~.+.~.~I~.~ .. ~.~U ... M.~·+_------r_------~ 6.50 7.00 7.50 8.00 8.50 9.00
pH
18
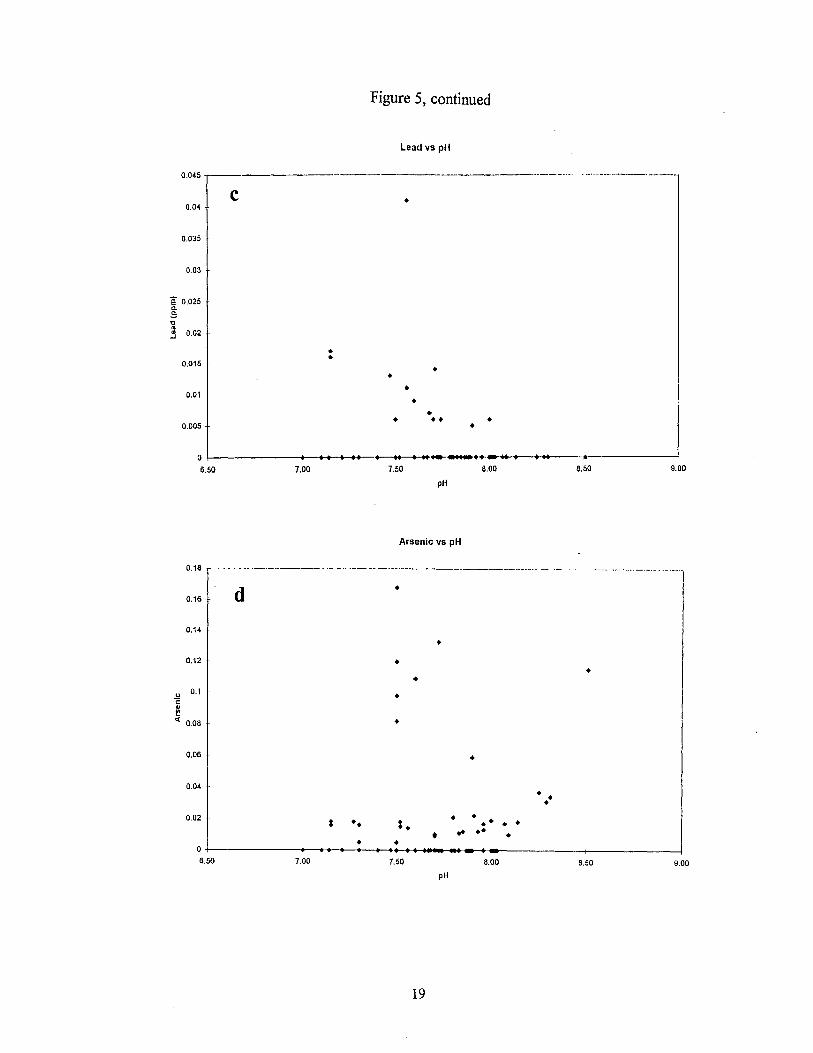
Figure 5, continued
Lead vs pH
0.045 r----------.-.-----------
0.04
0.035
0.03
E 0.025 Q,
.e: 'C
'" " 0.02 ..J
0.015
0.01
0.005
0 6.50
0.18
0.16
0.14
0.12
u' 0.1 C " ~ « 0.08
0.06
0.04
0.02
a 6.50
C
7.00
d
7.00
• •
* •
•• • • • •
•
• • •
•
7.50
•
• ••
pH
• •
8.00
Arsenic vs pH
•
• • . -
• •
•
• • : . •• • .. ••
• " o • ••• . . .....-. 7.50 8.00
pH
19
8.50 9.00
•
• • • • • •
8.50 9.00

Figure 5, continued.
Lead VS. silver
0.045
e • 0.04
0.035
0.03
0.025 .c a.
0.02
• • 0.015 • • 0.01 •
• • • • • • 0.005 •
0
0 10 20 30 40 50 60 70 60 90
Ag
Mercury VS. silver
0.0018
0.0016 f •
• 0.0014
0.0012
0.001 Cl :I: •
0.0008
0.0006 •
0.0004 • • • • •
0.0002 •
0 0 10 20 30 40 50 60 70 80 90
Ag
20

Figure 5, continued
Cu vs. 504
0.45
g • 0.4
• 0.35
0.3
0.25 :::I <..)
0.2
0.15
0.1 • •
0.05 • .+ • • . ,.. \ . 0
0 200 400 600 800 1000 1200 1400 1800
504
Cadmium VS. silver
0.0025 -r-<_------------------:----------------..,
h •
0.002
0.0015
• -c <..)
0.001 • • •
• 0.0005
o 10 20 30 40 50 60 70 80 90
Ag
21

Figure 5, continued
Zn vs. Cu
0.7
• i 0.6
0.5
• 0.4 •
c: N
0.3
• 0.2 .
0.1 • •••
• • • 0
0 10 20 30 ~o 50 60 70 eo 90
Cu
Pbvs. Cu
0.~5
0.04 • . J
0.035
0.03
0.025 .Q 0..
0.02
• 0.015 •
• • 0.01 •
• •
0.005· • • • • •
0 0 10 20 30 40 50 60 70 80 90
Cu
22

LAND USE AND POTENTIAL WATER QUALITY IMPACTS
Mining Mining activities can provide a potential source ofTDS and metals to surface and groundwater. The nature and magnitude of potential water quality impacts associated with mining are controlled by a number offactors (Frisch-Gleason, 1995), including: • type and size of mine • type and volume of waste • hydrology, geology, topography, and climate of mine site • exposure to air and water • extent of mineralization • amount and distribution of sulfide minerals
Sulfides weather naturally by oxidation to form sulfate or sulfuric acid, and metals contained in the minerals may be released. Acid mine drainage is generally considered to be the major environmental impact of mining. In western Arizona, this potential problem is not as severe as in other parts of the country, for several reasons. First, the climate is arid, evaporation rates vastly exceed precipitation, and the drainage areas above the mines are small, so abundant water, the main ingredient in acid mine drainage, is not available. Second, in the Black Mountains, mineralized zones and mines contain little if any sulfide minerals. Third, the presence of carbonates in and around mining areas allows for prevention or rapid neutralization of any potential acid generation (see references on acid mine drainage neutralization in Frisch-Gleason, 1995; also, Jessey and others, 1981; Rosner,1998b). Metal solubility and transport are thus greatly reduced. Carbonates are present in the Black Mountains - Bullhead City area in the following forms: • calcite in gold-bearing veins mined in the Black Mountains (quartz-ca1cite-adularia veins
common) • limestone and dolomite clasts in alluvial basin fill (e.g., Paleozoic carbonates derived from
Colorado Plateau) • soil caliche (pedogenic carbonate) • secondary calcite foimed by normal weathering of igneous rocks • lacustrine limestones and marls in basin:fill (especially Bouse Formation)
Even in areas of western Arizona where large-scale sulfide mineralization occurs, such as in the Wallapai District in the Cerbat Mountains to the east, the environmental hazard from heavy metal runoff associated with milling "remains at a tolerable level" (Rosner, 1998a). The reasons are similar to above in that 1) runoff occurs only during periods of intense rainfall, and so any acid runoff from mining quickly mixes with unpolluted runoff and is thereby diluted to low concentrations; 2) alkaline conditions of soils, surface runoff, and groundwater decrease the solubility of metals and cause their precipitation, and 3) Fe and Mn oxides on surface coatings are effective scavengers of metals.
Although in the immediate vicinity of some mines in the Wallapai district, metal concentrations are relatively high in surface runoff and stream sediments, these levels taper off rapidly to background concentrations. Plants contain high levels of metals only within 500 meters of sites with heavy metal contamination (Rosner, 1998b). These results for a nearby sulfide-mining district indicate that mining in the Black Mountains, where there is a notable lack of sulfides and heavy metals, will likely have significantly less impact on water quality.
23

One area of concern with gold mining is the use of cyanide for leaching. This process was fist described as early as 1793 and has been in widespread commercial use since the 1890s, so its application to extracting gold is extensive and well developed (Hiskey, 1985). Although cyanide is very unstable and so is easily destroyed (Rabb, 1978), it poses a potential threat to water if the cyanide is accidentally released before it can be neutralized.
Several steps are taken in modem gold processes plants to avoid such accidental releases. Tanks and circuits containing cyanide solutions are contained within berms or secondary tanks to prevent escape of the solutions outside the plant area. Ponds containing cyanide solutions are lined to prevent infiltration of that water into the ground. Tailings dams and ponds are designed and built to standards in accordance with operating permits and are monitored to assure their integrity.
Current gold mining operations in the Black Mountains address these concerns with preventative measures. For example, at the Gold Road Mine, cyanide-bearing tailings from the gold processing plant are neutralized with copper sulfate and hydrogen peroxide before disposal in tailings ponds (Silver, 1997). Ironically, copper and sulfate released from these kinds of modem operations comes not from mining itself: but from required environmental protection procedures.
Developed land Bullhead City is the major population center within the project area and is sister to Laughlin,
Nevada, directly across the Colorado River. The population of the Bullhead City-Laughlin vicinity is more than 144,000 people. Tourism is by far the major industry of the area, with gambling and river recreation attracting more than 6 million visitors annually.
Residential growth is certain to be one of the most important changes in land use in the Black Mountains -Bullhead City area. Census figures show a steady increase in the population of Arizona. The Mohave County 1996 population of 127,700 is more than double its 1980 popUlation of 55,865. Bullhead City has nearly tripled in 16 years, growing from 10,719 people in 1980 to 27,370 in 1996 (figures from Arizona Department of Commerce).
Areas where high-density residential development is likely to take place first are around the outskirts of existing towns, where infrastructure is already in place. Lower density development is likely to continue in the surrounding areas. Residential development is limited to private land, or State land, which can be sold by the state for development. Areas prone to development can be predicted by looking at land status maps that show private land, and State land adjacent to developed areas (private land makes up about 55,309 acres of the study area).
As the population along the Colorado River increases, the river is likely to be affected in a number of ways. More people means more municipal wastewater, which is high in TDS, especially nitrates, and sometimes contains heavy metals and other undesirable constituents. Personal use of pesticides, herbicides, and fertilizers in yards, and cleaning products and other toxic chemicals in the home presents the same kinds of potential impact to water quality as those produced and used by industry and agriculture. In residential backyards, fertilizer and pesticides are often applied at a much higher dosage than used by farmers. Chemical use may also high at golf courses and parks.
The acreage of houses, driveways, roads and parking lots will increase with population, leading to increased runoff. Storm runoff from roads and parking lots may carry with it oil, gas, diesel, brake fluid, and radiator fluid dripped from cars and trucks. Production of garbage, which ends up in landfills, will also increase with population.
Grazing Intermittent cattle grazing occurs on some of the study area. Grazing by livestock can
impact water quality, primarily by increasing soil erosion and sedimentation. The importance of rangeland as a source of nonpoint pollution increases as more vegetative cover is removed. Hoof impacts can knock down stream banks and chum soil, increasing erosion and sedimentation. Manure
24
generated by livestock may also contribute nutrients, especially nitrate and phosphate, as well as pathogens to watersheds. These problems occur only where high densities of livestock are found, but the limited number of cattle supported in the study area (BLM, 1993) greatly reduces the potential for this kind of water quality degradation. Factors limiting the number of cattle in the study area include the arid climate, lack offorage, and the presence of large numbers of wild burros.
The impact of cattle grazing on water quality can be controlled by lessening of sediment runoff from grazed watersheds. This reduction of sediment transport could be accomplished through a combination of factors (Molitor, 1997); • Construction of detention dams. • Decrease in the number of cattle per acre. • Rotation of grazed areas to allow recovery of vegetation. • Fencing off of streams and riparian areas. • Dispersion of watering sites.
Currently, some State, BLM, and non-residential private land is used for grazing on three allotments. As more land is developed for residential or mining use, less land will be available for grazing.
25

REFERENCES
Almquist, C.L., 1988, Mineral investigation of a part of the Mount Nutt Wilderness study Area, (AZ-202-024), Mohave County, Arizona: US Bureau of Mines Mineral Land Assessment open File Report MLA 35-88, 20 p.
Anderson, lL., 1989, Proterozoic anorogenic granites of the southwestern United States, in Jenney, J.P., and Reynolds, S.I., Geologic evolution of Arizona: Arizona Geological Society Digest 17, p. 211-238.
Anderson, L.W., and O'Connell, D.R, 1993, Seismotectonic study of the northern portion of the lower Colorado River, Arizona, California and Nevada: US Bureau of Reclamation Seismotectonic Report 93-4.
BLM, 1993, Kingman Resource Area, Proposed Resource management Plan and final Environmental Impact Statement: Bureau of Land Management Report, 606 p.
Buchanan, L.I., 1981, Precious metal deposits associated with volcanic environments in the southwest, in Dickinson, W.R, and Payne, W.D., Relation of tectonics to ore deposits in the southern Cordillera: Arizona Geological Society Digest 14, p. 237-262.
Bullock, J.H., Jr., Welsch, E., Hageman., P., Tippitt, F.W., and Turner, RL., 1990, Analytical results and sample locality map of stream-sediment, heavy mineral concentrate, and rock samples from the Warm Springs Wilderness Study Area (AZ-020-028/029), Mohave County, Arizona: US Geological Survey Open-File Report 90-296, 39 p.
Buising, A.V., 1988, Depositional and tectonic evolution of the northern proto-Gulf of California and Lower Colorado River, as d~umented in the Mio-Pliocene Bouse Formation and bracketing units, southeastern California and western Arizona: University of California, Santa Barbara unpublished Ph.D. Dissertation, 196 p.
Clifton, C.G., Buchanan, L.J., and Durning, W.P., 1980, Exploration procedure and controls of mineralization in the Oatman Mining District, Oatman, Arizona: AIME Preprint 80-143.
DeWitt, E., 1987, Proterozoic ore deposits of the southwestern U.S.: Society of Economic Geologists Guidebook Series, Oct. 22-24, 1987 Field Conference, 189 p.
DeWitt, E., Thorson, J.P., and Smith, RC., 1991, Geology and gold deposits of the Oatman District, northwestern Arizona: US Geological Survey Bulletin 1857-1, p. 1-28.
Durning, W.P., and Buchanan, L.J., 1984, The geology and ore deposits of Oatman, Arizona: Arizona Geological Society Digest 15, p. 141-158.
Elsing, M.l, and Heineman, R.E.S., 1936, Arizona metal production: Arizona Bureau of Mines Bulletin 140, 112 p.
Files, F.G., 1978, Uranium in volcanic environments in the Great Basin: US Department of Energy Report GJBX-98 (78), 20 p.
Frisch-Gleason, R, 1995, Controlling and remediating surface and groundwater pollution from inactive and abandoned mines: A survey of management practices: Arizona Geological Survey Open-File Report 95-13, 79 p.
Gardner, B.D., 1936, Gold mining and milling in the Black Mountains, western Mohave County, Arizona: US Bureau of Mines fufonnation Circular IC-6901, 59 p.
Gray, F., Jachens, RC., Miller, R.I., Turner, RC., Livo, E.K., Knepper, D.H., Jr., Mariano, J., and Almquist, C.L., 1990a, Mineral resources of the Mount Nutt Wilderness Study Area, Mohave County, Arizona: US Geological Survey Bulletin 1737-0, 22 p.
Gray, F., Jachens, R.C., Miller, R.I., Turner, RC., Knepper, D.H., Jr., Pitkin, J.A., Keith, W.I., Mariano, 1, Jones, S.L., and Korzeb, S.L., 1990b, Mineral resources of the Warm Springs Wilderness Study Area, Mohave County, Arizona: US Geological Survey Bulletin 1737-F, 24 p.
26

Gray, F., Jachens, RC., Miller, RJ., Turner, RC., Knepper, D.H., Jr., Pitkin, J.A, Keith, WJ., Mariano, J., Jones, S.L., and Korzeb, S.L., 1990b, Mineral resources of the Wann Springs Wilderness Study Area, Mohave County, Arizona: US Geological Survey Open-File Report 90-520, 37 p.
Harris, RC., Trapp, RA, McGarvin, T.G., and Spencer, J.E., 1994, Index of published geologic maps of Arizona - 1982 to mid-1993: Arizona Geological Survey Map 31, 45 p., 3 sheets, scale 1:1,000,000.
Hart, O.M., 1955, Uranium investigations in Mohave County, Arizona: US Atomic Energy Commission Report RME-2029, 18 p.
Hely, AG., 1969, Lower Colorado River water supply - Its magnitude and distribution: US Geological Survey Professional Paper 486-D, 54 p.
Hely, AG., and Peck, E.L., 1964, Precipitation, runoff, and water loss in the lower Colorado River-Salton Sea area: US Geological Survey Professional Paper 486-B, 16 p.
Herriman, RC., and Hendricks, D.M., 1984, Geomorphic surfaces and soils, Colorado River area, Arizona and California - Guidebook [Soil-Geomorphology Field Conference, Soil Science Society of America 76th annual meeting, Las Vegas, Nevada]: U.S. Department of Agriculture Guidebook, 33p.
Hiskey, J.B., 1985, Gold and silver extraction: the application of heap-leaching cyanidation: Arizona Bureau of Geology and Technology Fieldnotes, v. 15, no. 4, p.1-5.
Irelan, B., 1971, Salinity of surface water in the lower Colorado River-Salton Sea area: US Geological Survey Professional Paper 486-E, 40 p.
Jessey, D.R, Stangl, J.M., Dike, D.H., Brown, G.R, and Schroeder, E.W., 1981, Control of water pollution from surface mining operations: US Bureau of Mines Open-File Report (161-81), 172 p.
Johnson, C.H., 1935, Mining and. milling methods at the Big Jim Mine, Oatman, Arizona: US Bureau of Mines InfonnationCircular IC-6824, l3 p.
Johnson, M.G., 1972, Placer gold deposits of Arizona: US Geological Survey Bulletin 1355, 103 p.
Keith, S.B., Gest, D.E., DeWitt, E., Toll, N.W., and Everson, B.A, 1983, Metallic mineral districts and production in Arizona: Arizona Bureau of Geology and Mineral Technology Bulletin 194, 58 p., scale 1:1,000,000.
Kister, L.R, 1973, Quality of groundwater in the lower Colorado River region, Arizona, Nevada, New Mexico, and Utah: US Geological Survey Hydrologic Investigations Atlas HA-478, 2 sheets, scale 1:1,000,000.
Korzeb, S.L., 1988, Mineral resources of the Wann Springs Wilderness Study Area (AZ-020-028/029), Mohave County, Arizona: US Bureau of Mines Mineral Land Assessment OpenFile Report 48-88,38 p.
Lausen, C., 1931, Geology and ore deposits of the Oatman and Katherine Districts, Arizona: Arizona Bureau of Mines Bulletin 131,126 p.
Lee, W. T., 1908, Geologic recOlmaissance of a part of western Arizona: US Geological Survey Bulletin 352, 96 p.
Longwell, C.R, 1963, Reconnaissance geology between Lake Mead and Davis Dam, ArizonaNevada: US Geological Survey Professional Paper 374-E, 51 p.
Marsh, S.E., and McKeon, J.B., 1983, Integrated analysis of high-resolution field and airborne spectroradiometer data for alteration mapping: Economic Geology, v. 78, no. 4, p. 618-632.
McDonald, C.C., and Loeltz, OJ., 1976, Water resources of the lower Colorado River-Salton Sea area as of 1971, Summary Report: US Geological Survey Professional Paper 486-A, 34 p.
27

Menges, C.M., and Pearthree, P.A., 1989, Late Cenozoic tectonism in Arizona and its impact on regional landscape evolution, in Jenney, lP., and Reynolds, SJ., Geologic evolution of Arizona: Arizona Geological Society Digest 17, p. 649-680.
Metzger, D.G., and Loeltz, OJ., 1973, Geohydrology of the Needles area, Arizona, California, and Nevada: US Geological Survey Professional Paper 486-J, 54 p.
Metzger, D.G., Loeltz, OJ., and Irelan, B., 1973, Geohydrology of the Parker-Blythe-Cibola area, Arizona and California: US Geological Survey Professional Paper 486-G, 130 p.
Molitor, D., 1997, Suspended Sediment Monitoring Project, San Simon watershed, southeast Arizona: U.S. Bureau of Land Management [Safford Office] Report, 69 p., 1 sheet, scale 1:155,000.
Moore, RW., 1928, Mining methods and records at the United Eastern Mine: Transactions of the American Institute of Mining and Metallurgical Engineers, v. 76, p. 56-92.
Qualheim, BJ., 1978, Hydrogeochemical and stream sediment reconnaissance basic data report for Kingman NTMS quadrangle, Arizona, California, and Nevada: University of California Lawrence Livennore Laboratory Report UCRL-52549 [also released as US Department of Energy Report GJBX-122(78), 85 p.
Rabb, D.D., 1978, Safety Comer: Warning-Beware of cyanide: Arizona Bureau of Geology and Mineral Technology Fieldnotes, v. 8, no. 4, p 8.
Ransome, F.L., 1923, Geology of the Oatman Gold District, Arizona: US Geological Survey Bulletin 743, 58 p.
Reynolds, SJ., 1986, Geologic map of Arizona: Arizona Bureau of Geology and Mineral Technology [AZGSJ Map 26, scale 1:1,000,000.
Rosner, Ulrike, 1998a, Heavy metals in surface soils and streambed sediments in the Wallapai Mining District, northwestern Arizona, a historic mining district in a semiarid region: Arizona Geological Survey Contributed Report Colorado River-98-A, 43 p.
Rosner, Ulrike, 1998b, Historical mining and its impact on the vegetation, an example from the Cerbat Mountains, Mohave County, Arizona: Journal of the Arizona-Nevada Academy of Sciences, v. 31, no. 1, p. 37-55.
Scarborough, R.B., and Coney, M.L., 1982, Index of published geologic maps of Arizona, 1903 to 1982: Arizona Bureau of Geology and Mineral Technology Map 17,6 sheets, scale 1:1,000,000.
Schrader, F.C., 1909, Mineral deposits of the Cerbat Range, Black Mountains, and Grand Wash Cliffs, Mohave County, Arizona: US Geological Survey Bulletin 397,226 p.
Si1litoe, RH., 1993, Giant and bonanza gold deposits in the epithermal environment: Assessment of potential genetic factors, in Whiting, B.H., Hodgson, CJ., and Mason, R., editors, Giant ore deposits: Society of Economic Geologists Special Publication 2, p. 125-156.
Silver, D.B., 1997, Gold Road Mine: Anatomy ofa turnaround: Mining Engineering, v. 49, no. 8, p.28-32
Smith, RC., 1984, Mineralogy and fluid inclusion studies of epithermal gold-quartz veins in the Oatman District, northwestern Arizona: University of Arizona unpublished M.S. thesis, 233 p.
Spencer, lE., and Reynolds, S.J., 1989, Middle Tertiary tectonics of Arizona and adjacent areas, in Jeney, lP., and Reynolds, SJ., Geologic evolution of Arizona: Arizona Geological Society Digest 17, p. 539-574.
Spencer, lE., and Welty, J.W., 1989, Mid-Tertiary ore deposits in Arizona: Arizona Geological Society Digest 17, p. 585-607.
Spencer, J.E., Harris, R.C., Dettmen, D., and Patchett, PJ., 1996, Reconnaissance survey of upper Neogene strata in the Bouse Formation, Hualapai Limestone, and lower Gila Trough, Western Arizona and directly adjacent southeastern California: Arizona Geological Survey Open-File Report 96-17, 23 p.
28
Spencer, J.E., and Patchett, PJ., 1997, Sr isotopic evidence for a lacustrine origin for the upper Miocene to Pliocene Bouse Formation, lower Colorado River trough, and implications for timing of Colorado Plateau uplift: Geological Society of America Bulletin, v. 109, no. 6, p. 767-778.
Tenney, J.B., 1930, Second report on the mineral industries of Arizona: Arizona Bureau of Mines Bulletin 130, 108 p.
Thorson, J.P., 1971, Igneous petrology of the Oatman District, Mohave County, Arizona: University of California at Santa Barbara unpublished Ph.D. dissertation, 189 p.
Warner, L.A., Holser, W.T., Wilmarth, V.R., and Cameron, E.N., 1959, Occurrence of nonpegmatitic beryllium in the United States: US Geological Survey Professional Paper 318, 198 p.
Wilson, E.D. 1978, Gold placers and placering in Arizona: Arizona Bureau of Geology and Mineral Technology Bulletin 168, 124p. [Reprint of ABGMT Bulletin 160]
Wilson, E.D., and Moore, R. T., 1959, Geologic map of Mohave County: Arizona Bureau of Mines [AZGS] mapM-3-6, scale 1:375,000.
Wilson, E.D., Cunningham, J.B., and Butler, G.M., 1934, Arizona lode gold mines and gold mining: Arizona Bureau of Mines Bulletin 137, 261 p.
29

APPENDIX A
DESCRIPTION OF MINES IN THE BLACK MOUNTAINS-BULLHEAD CITY AREA


Mines in the Black Mountains Study area
Oatman District
Arizona Gold Star Prospect (La Paz) Location: TI9N, R20W, sec 8 Lat. 35.0475N Lon. 114.4292W Quadrangle: Oatman Geology: Vein along contact of Tertiary andesite and quartz monzonite dike Mineralization: Hematite, MnOx Years of Production: unknown Mineral production: unknown References: AZGS files
Aztec Mine (part of Tom Reed Mine) Location: TI9N, R20W, sec 23, NE/SE Lat. 35.018N Lon. 114.3717W Quadrangle: Mount Nutt Geology: Quartz veins in fault system in Tertiary volcanic rocks (Tom Reed vein) Mineralization: Quartz veins with Au, Ag, Ph, Mo. Aztec mine connects with Big Jim, Bald Eagle, and Grey Eagle workings. Years of Production: Mineral production: (production included in Tom Reed Mine figures) References: Gardner, 1936; Lausen, 1931; Durning and Buchanan, 1984.
Bald Eagle Mine (part of Tom Reed Mine) Location: TI9N, R20W, sec 23 Lat. 35.018N Lon. 114.3731W Quadrangle: Mount Nutt Geology: Quartz veins in fault system in Tertiary volcanic rocks Mineralization: Quartz-adularia veins with gold Years of Production: Mineral production: (production included in Tom Reed Mine figures) References: AZGS mine files
Big Jim Mine Location: TI9N, R20W, sec 23 SE/SW Lat. 35.0197N Lon. 114.3722W Quadrangle: Mount Nutt Geology: Veins in fault zone in Tertiary volcanic rocks Mineralization: quartz veins with calcite, gypsum, wulfenite, chalcopyrite, gold Years of Production: 1915- 1942 Mineral production: 277,000 tons ore, 12,500 oz Au 1917-1942; (220,000 tons ore 1921-1924) References: Johnson, 1935; Gardner, 1936; Lausen, 1931; Buchanan, 1981; Durning and
Buchanan, 1984; AZGS mine files
German-American Mine - see Pioneer
Gold Dust Mine (Victor-Virgin) Location: TI9N, R20W, sec 22, SE Quadrangle: Oatman
Lat. 35.014N Lon. 114.3927W
30
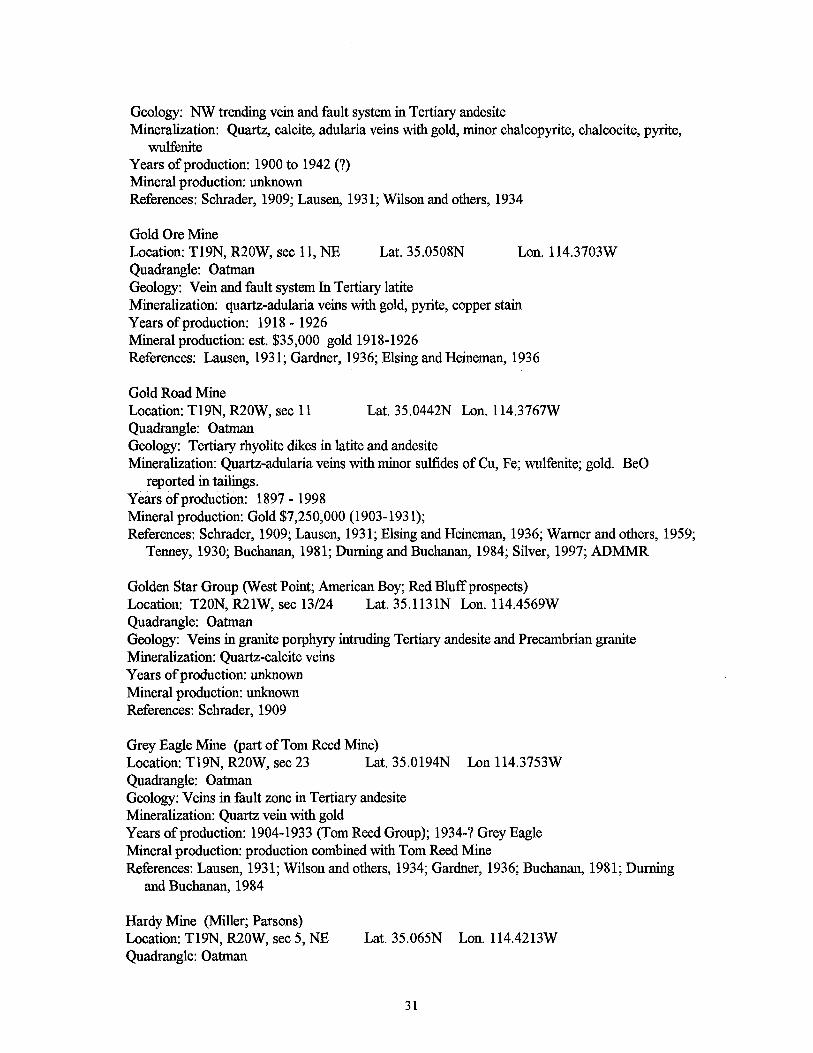
Geology: NW trending vein and fault system in Tertiary andesite Mineralization: Quartz, calcite, adularia veins with gold, minor chalcopyrite, chalcocite, pyrite,
wulfenite Years of production: 1900 to 1942 (?) Mineral production: unknown References: Schrader, 1909; Lausen, 1931; Wilson and others, 1934
Gold Ore Mine Location: TI9N, R20W, sec 11, NE Lat. 35.0508N Lon. 114.3703W Quadrangle: Oatman Geology: Vein and fault system In Tertiary latite Mineralization: quartz-adularia veins with gold, pyrite, copper stain Years of production: 1918 - 1926 Mineral production: est. $35,000 gold 1918-1926 References: Lausen, 1931; Gardner, 1936; Elsing and Heineman, 1936
Gold Road Mine Location: TI9N, R20W, sec 11 Lat. 35.0442N Lon. 114.3767W Quadrangle: Oatman Geology: Tertiary rhyolite dikes in latite and andesite Mineralization: Quartz-adularia veins with minor sulfides of Cu, Fe; wulfenite; gold. BeO
reported in tailings. Years of production: 1897 - 1998 Mineral production: Gold $7,250,000 (1903-1931); References: Schrader, 1909; Lausen, 1931; Elsing and Heineman, 1936; Warner and others, 1959;
Tenney, 1930; Buchanan, 1981; Durning and Buchanan, 1984; Silver, 1997; ADMMR
Golden Star Group (West Point; American Boy; Red Bluff prospects) Location: T20N, R21W, sec 13/24 Lat. 35.1131N Lon. 114.4569W Quadrangle: Oatman Geology: Veins in granite porphyry intruding Tertiary andesite and Precambrian granite Mineralization: Quartz-calcite veins Years of production: unknown Mineral production: unknown References: Schrader, 1909
Grey Eagle Mine (part of Tom Reed Mine) Location: TI9N, R20W, sec 23 Lat. 35.0194N Lon 114.3753W Quadrangle: Oatman Geology: Veins in fault zone in Tertiary andesite Mineralization: Quartz vein with gold Years of production: 1904-1933 (Tom Reed Group); 1934-? Grey Eagle Mineral production: production combined with Tom Reed Mine References: Lausen, 1931; Wilson and others, 1934; Gardner, 1936; Buchanan, 1981; Durning
and Buchanan, 1984
Hardy Mine (Miller; Parsons) Location: TI9N, R20W, sec 5, NE Quadrangle: Oatman
Lat. 35.065N Lon. 114.4213W
31

Geology: Veins in Tertiary granite porphyry Mineralization: Veins of quartz, calcite, fluorite Years of production: 1870-1906 (?) Mineral production: est. $100,000 gold References: Schrader, 1909; Wilson and others, 1934; Elsing and Heineman, 1936
Homestake Prospect Location: TI9N, R20W, sec 5 Lat. 35.0667 Lon. 114.4353 Quadrangle: Oatman Geology: Quartz veins in granite porphyry Mineralization: quartz veins with gold Years of production: none References: Schrader, 1909
Jackpot Prospect Location: TI9N, R20W, sec 5 Lat. 35.0647N Lon. 114.4267W Quadrangle: Oatman Geology: Quartz vein in Tertiary granite porphyry (part of Hardy Vein) Mineralization: quartz with gold Years of production: unknown Mineral production: unknown References: Schrader, 1909
Leland Mine (Mitchell vein) Location: TI9N, R20W, sec 20 Lat. 35.023 Lon. 114.4255 Quadrangle: Oatman Geology: Veins in Tertiary andesite and quartz monzonite porphyry Mineralization: Quartz-adularia-calcite veins with MnO and gold Years of production: 1902 - ? Mineral production: est. 45,000 tons ore at $15 per ton gold References: Schrader, 1909; Lausen, 1931
Lexington Mine Location: TI9N, R20W, sec 26, NW Lat. 35.008N Lon. 114.3833W Quadrangle: Oatman Geology: Vein and fault system in Tertiary andesite, trachyte Mineralization: Quartz-calcite veins with gold Years of production: unknown Mineral production: unknown References: AZGS mine files
Meals Camp Location: T20M, R21 W, sec 13 Lat. 35.1131N Lon. 114.4569W Quadrangle: Oatman Geology: Veins in Tertiary andesite, quartz syenite porphyry, and Precambrian granite Mineralization: Quartz veins with gold Years of production: unknown Mineral production: unknown References: Schrader, 1909
32

Midnight Mine Location: TI9N, R20W, sec 17, NEINE Quadrangle: Oatman Geology: Veins and dikes in Tertiary andesite Mineralization: Quartz veins Years of production: 1900-1907, 1935 Mineral production: 165 tons ore at $17 per ton gold (1935) References: Schrader, 1909; Gardner, 1936
Moss Mine Location: T20N, R20W, sec 19, SW/SE Lat. 35.0997N Lon.114.4467W Quadrangle: Oatman Geology: Veins in Tertiary quartz monzonite porphyry, trachyte Mineralization: Quartz veins with calcite, fluorite, MnO, hematite, gold Years of production: prior to 1909 Mineral production: $250,000 gold by 1909, no other production data References: Schrader, 1909; Ransome, 1923
Mossback Mine Location: T20N, R20W, sec 28, NEINE Lat. 35.0967N Lon. 114.4086W Quadrangle: Oatman Geology: Veins in fault between Tertiary andesite and Quartz monzonite porphyry. Mineralization: Quartz-calcite veins with hematite, gold Years of production: 1933 to 1935 Mineral production: 200 tons ore 1933; 1309 tons ore 1935; $15,000 gold 1934 References: Wilson and others, 1934; Schrader, 1909; Gardner, 1936
Navy Group Location: TI9N, R20W, sec 8 Lat. 35.0417N Lon. 114.4364W Quadrangle: Oatman Geology: Veins in Tertiary granite porphyry and andesite Mineralization: Quartz-calcite-fluorite veins with gold Years of production: unknown Mineral production: unknown References: Schrader, 1909
New York Mine Location: T20N, R20W, sec 20, SE/SE Quadrangle: Oatman
Lat. 35.0983N Lon. 114.4258W
Geology: Veins in Tertiary quartz monzonite Mineralization: Quartz veins with gold Years of production: unknown Mineral production: unknown References: AZGS mine files
Oatman Queen Mine Location: TI9N, R20W, sec 21122 Quadrangle: Oatman
est. Lat. 35.403N est. Lon. 114.023W
33
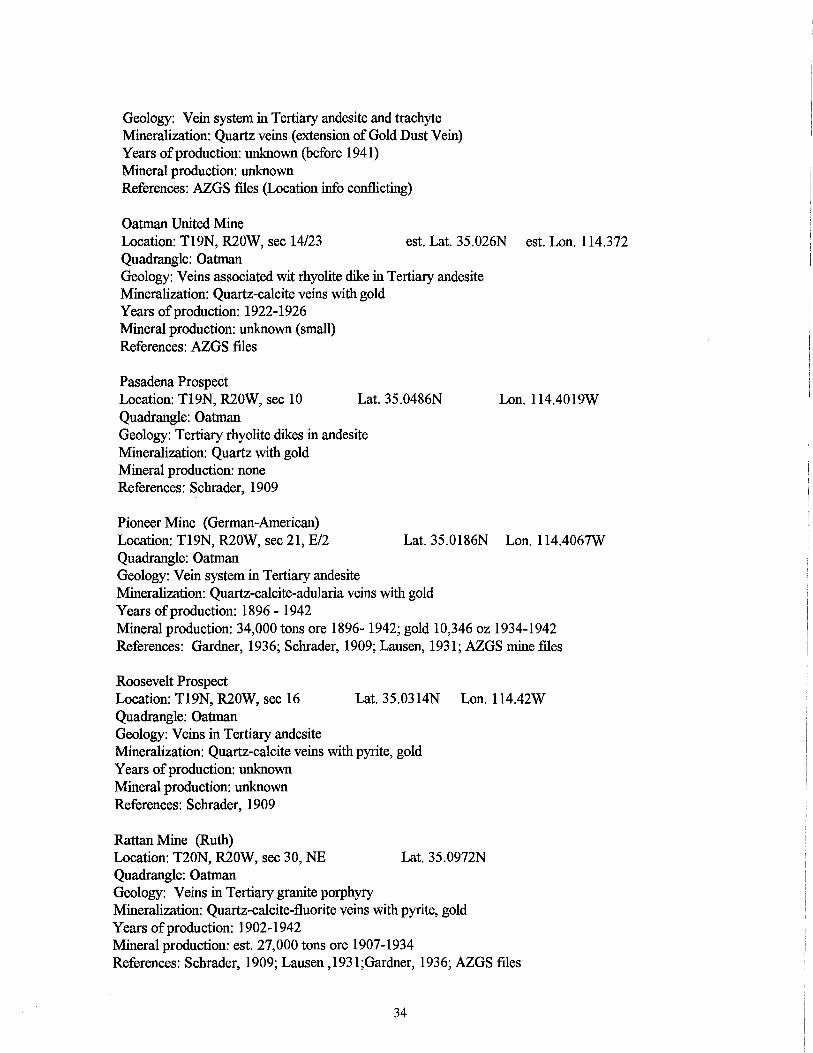
Geology: Vein system in Tertiary andesite and trachyte Mineralization: Quartz veins (extension of Gold Dust Vein) Years of production: unknown (before 1941) Mineral production: unknown References: AZGS files (Location info conflicting)
Oatman United Mine Location: TI9N, R20W, sec 14/23 est. Lat. 35.026N est. Lon. 114.372 Quadrangle: Oatman Geology: Veins associated wit rhyolite dike in Tertiary andesite Mineralization: Quartz-calcite veins with gold Years of production: 1922-1926 Mineral production: unknown (small) References: AZGS files
Pasadena Prospect Location: TI9N, R20W, sec 10 Lat. 35.0486N Quadrangle: Oatman Geology: Tertiary rhyolite dikes in andesite Mineralization: Quartz with gold Mineral production: none References: Schrader, 1909
Pioneer Mine (German-American)
Lon. 114.4019W
Location: TI9N, R20W, sec 21, E/2 Lat. 35.0186N Lon. 114.4067W Quadrangle: Oatman Geology: Vein system in Tertiary andesite Mineralization: Quartz-calcite-adularia veins with gold Years of production: 1896 - 1942 Mineral production: 34,000 tons ore 1896- 1942; gold 10,346 oz 1934-1942 References: Gardner, 1936; Schrader, 1909; Lausen, 1931; AZGS mine files
Roosevelt Prospect Location: TI9N, R20W, sec 16 Lat. 35.0314N Lon. 114.42W Quadrangle: Oatman Geology: Veins in Tertiary andesite Mineralization: Quartz-calcite veins with pyrite, gold Years of production: unknown Mineral production: unknown References: Schrader, 1909
Rattan Mine (Ruth) Location: T20N, R20W, sec 30, NE Lat. 35.0972N Quadrangle: Oatman Geology: Veins in Tertiary granite porphyry Mineralization: Quartz-calcite-fluorite veins with pyrite, gold Years of production: 1902-1942 Mineral production: est. 27,000 tons ore 1907-1934 References: Schrader, 1909; Lausen , 1931;Gardner, 1936; AZGS files
34

Silver Creek Placers Location: T19, 20N, R20W, sec 5,6,21, 19,31,32 Quadrangle: Oatman Geology: Stream gravels in Silver Creek Mineralization: placer gold Years of production: unknown Mineral production: unknown References: Johnson, 1972; Wilson, 1978
Sunnyside Mine Location: TI9N, R20W, sec 24, SE/SW Lat. 35.011N Lon. 114.3635W Quadrangle: Mount Nutt Geology: Vein system in Tertiary andesite Mineralization: Quartz-calcite veins with gold Years of production: 1928-1930 (?) Mineral production: unknown (small) References: Lausen, 1931; Gardner, 1936
Swiss-American Mine Location: TI9N, R20W, sec 21, SW Lat. 35.0189N Lon. 114.4144W Quadrangle: Oatman Geology: Vein system in Tertiary andesite Mineralization: Quartz with gold Years of production: unknown Mineral production: unknown References: Schrader, 1909; Lausen, 1931
Telluride Mine Location: TI9N, R20W, sec 23, SE Lat. 35.0169N Lon. 114.3717W Quadrangle: Mount Nutt Geology: Vein system in Tertiary andesite Mineralization: Quartz-calcite veins Years of production: 1922-1942 Mineral production: est. $200,000 gold 1922-1933 References: Lausen, 1931; Gardner, 1936; Elsing and Heineman, 1936; Durning and Buchanan,
1984.
Tom Reed Mine Location: TI9N, R20W, sec 23, NW Lat. 35.0236N Lon. 114.3797W Quadrangle: Oatman Geology: Vein system in Tertiary volcanic rocks Mineralization: Quartz-calcite-adularia veins with fluorite, gypsum, FeOx, MnOx Years of production: 1905-1939 Mineral production: est. 984,000 tons ore (1911-1934); $13,000,000 gold (1907-1933) References: Schrader, 109; Gamer, 1936; Lausen, 1931; Elsing and Heineman, 1936; Tenney,
1930; Buchanan, 1981; Durning and Buchanan, 1984.
35
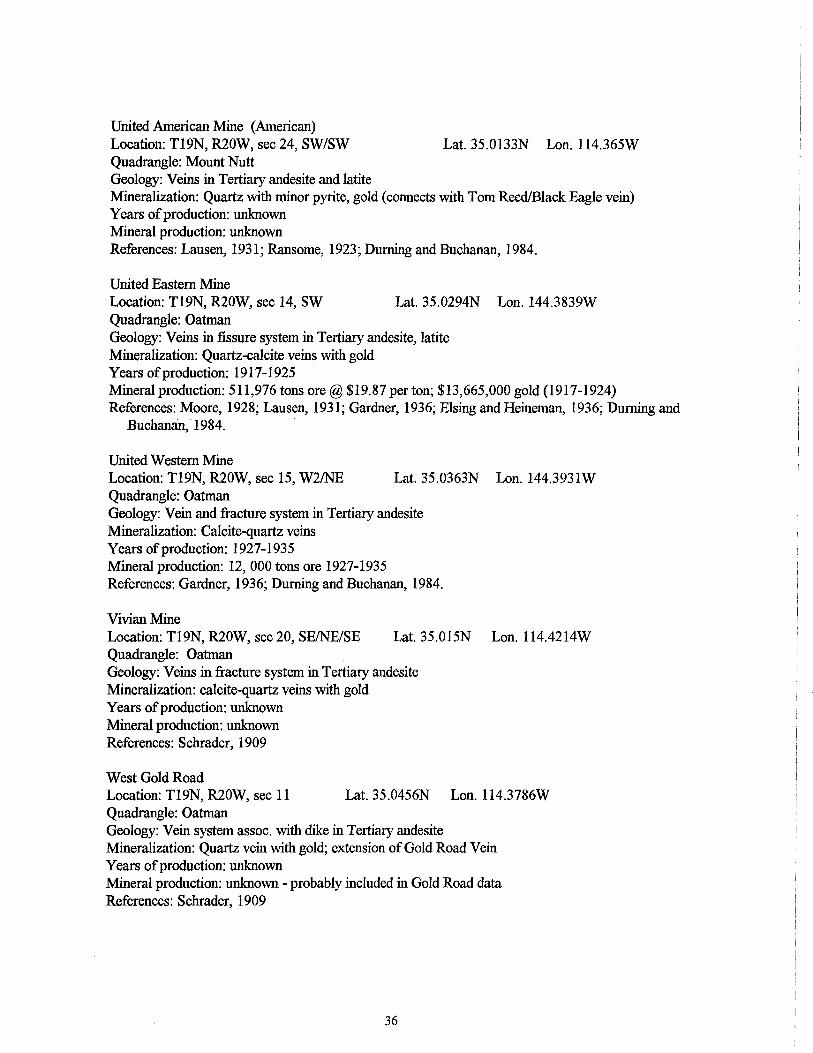
United American Mine (American) Location: T19N, R20W, sec 24, SW/SW Lat. 35.0133N Lon. 114.365W Quadrangle: Mount Nutt Geology: Veins in Tertiary andesite and latite Mineralization: Quartz with minor pyrite, gold (connects with Tom ReedlBlack Eagle vein) Years of production: unknown Mineral production: unknown References: Lausen, 1931; Ransome, 1923; Durning and Buchanan, 1984.
United Eastern Mine Location: T19N, R20W, sec 14, SW Lat. 35.0294N Lon. 144.3839W Quadrangle: Oatman Geology: Veins in fissure system in Tertiary andesite, latite Mineralization: Quartz-calcite veins with gold Years of production: 1917-1925 Mineral production: 511,976 tons ore @ $19.87 per ton; $13,665,000 gold (1917-1924) References: Moore, 1928; Lausen, 1931; Gardner, 1936; Elsing and Heineman, 1936; Durning and
Buchanan, 1984.
United Western Mine Location: TI9N, R20W, sec 15, W2INE Lat. 35.0363N Lon. 144.3931W Quadrangle: Oatman Geology: Vein and fracture system in Tertiary andesite Mineralization: Calcite-quartz veins Years of production: 1927-1935 Mineral production: 12,000 tons ore 1927-1935 References: Gardner, 1936; Durning and Buchanan, 1984.
Vivian Mine Location: TI9N, R20W, sec 20, SEINE/SE Lat. 35.015N Lon. 114.4214W Quadrangle: Oatman Geology: Veins in fracture system in Tertiary andesite Mineralization: calcite-quartz veins with gold Years of production: unknown Mineral production: unknown References: Schrader, 1909
West Gold Road Location: TI9N, R20W, sec 11 Lat. 35.0456N Lon. 114,3786W Quadrangle: Oatman Geology: Vein system assoc. with dike in Tertiary andesite Mineralization: Quartz vein with gold; extension of Gold Road Vein Years of production: unknown Mineral production: unknown - probably included in Gold Road data References: Schrader, 1909
36

Mine names in the Oatman district with no information Adams Alta Bew Comstock Bonanza Bullard Burt Carter Crescent Crown City DelRay Gold Center Gold Crown Mayflower Nancy Lee Orphan Pittsburg Stoney Crane
Mines in the Oatman district outside study area Alcyone Prospect (Guadalupe) Billy Bryan Iowa Prospect Lazy Boy Tin Cup Wrigley Prospect
Union Pass (Katherine) District
Arabian Mine (Arabia Group) Location: T21N, R20W, sec 20, wl2 ofNE; Lat. 35. 186N, Lon 114.4361W Quadrangle: Union Pass Geology: The mined vein occurs in a NE trending Tertiary rhyolite porphyry dike intruding
Precambrian granite. Mineralization: 30-ft wide zone of gold-bearing quartz veins with some calcite, fluorite Years of Production: before 1917 to 1934 Mineral production: 15,000 ton of ore, grade up to 0.5 oziton gold, 3-10 oziton silver. Gold
production $20,000 from 1917-1933; Arabian mine abuts Philadelphia mine to the NE. References: Wilson and others, 1934; Lausen, 1931; Gardner, 1936; AZGS mine files.
Black Dike Group (Princess) Location: T21N, R21W, sec 2, NE/SW Lat. 35.2319N, Lon. 114.4939W Quadrangle: Union Pass Geology: Tertiary rhyolite dike in Precambrian granite. Mineralization: calcite vein and gold-bearing quartz stringers in dike. Years of Production: unknown Mineral production: unknown amount of ore, up to $3 per ton (1931) References: Lausen, 1931; Wilson and others, 1934.
37

Frisco Mine Location: T21N, R20W, sec 16, NEINE Lat. 35.21ON, Lon. 114.4153W Quadrangle: Union Pass Geology: Quartz stringers at contact of Tertiary rhyolite flow and tuff with Precambrian
granite/gneiss. Mineralization: Gold-bearing quartz stringers Years of Production: 1900 to > 1935 Mineral production: 44,000 tons of ore 1894-1916 ($14 Au per ton); total of $400,000 gold 1893-
1933 References: Gardner, 1936; Lausen, 1931
Golden Cycle Mine Location: 2000 feet NW of Pyramid Mine Quadrangle: Davis Dam Geology: Quartz stringers occupying shear zone in coarse-grained granite Mineralization: Gold-bearing quartz Years of Production: unknown Mineral production: unknown amount of ore, grade $1-$14 per ton gold References: Lausen, 1931
Katherine Mine Location: T21N, R21W, sec 5, SW Lat. 35.2336N; Lon. 144.5469W Quadrangle: Davis Dam Geology: Tertiary trachyte and rhyolite flows and dikes against Precambrian gneiss/granite Mineralization: Gold in quartz veins with calcite, adularia, and fluorite. Ore minerals include
silver, hematite, chalcocite. Up to 0.03% BeO in mill tailings Years of Production: 1900-1940 Mineral production: $1,700,000 gold, $100,000 silver (1900-1933) References: Wilson and others, 1934; Warner and others, 1959 (p. 102); Tenney, 1930; Buchanan,
1981.
New Chance Prospect Location: T21N, R20W, sec 35 Lat. 35.l572N; Lon. 114.3861W Quadrangle: Union Pass Geology: Quartz vein in Tertiary rhyolite and andesite in contact with Precambrian granite. Mineralization: Quartz vein with gold, silver; minerals include hematite, MnOx, adularia, fluorite. Years of Production: (no production) Mineral production: (no production); grade up to $64 per ton gold, 2 oz Ag References: Schrader, 1909
OK Group Location: T21N, R20W, sec 4/9 Lat. 35.2261N Lon. 114.4164W Quadrangle: Union Pass Geology: Contact of Tertiary rhyolite with Precambrian granite. Mineralization: Gold, pyrite, and galena in quartz Years of Production: (no production) Mineral production: (no production) Grades of 0.05 to 0.9 oz per ton gold References: Schrader, 1909
38

Pyramid Mine Location: T21N, R21W, sec 6, NW/SE Lat. 35.2306N Lon. 114.5597W Quadrangle: Davis Dam Geology: contacts of Tertiary rhyolite dikes in Precambrian granite Mineralization: Quartz and calcite stringers with gold, silver, hematite. Similar to nearby
Katherine Mine Years of Production: (no production) Mineral production: (no production data) References: Lausen, 1931; Schrader, 1909
Roadside Mine Location: T21N, R21W, sec 11112 Lat. 35.2194N Lon. 114.4808W Quadrangle: Union Pass Geology: Quartz vein in fault contact of Tertiary rhyolite with Precambrian granite Mineralization: Quartz-calcite veins and stringers with gold and silver Years of Production: 1915-1936 Mineral production: 890 oz Au, 1,734 oz Ag (1932-1934) References: Wilson and others, 1934; Gardner, 1936
San Diego Group Location: T21N, R20W, sec 10 Lat. 35.2164N Lon. 114.4031W Quadrangle: Union Pass Geology: Veins in Tertiary rhyolite and diabase intruded into Precambrian granite Mineralization: Quartz-adularia-calcite veinlets and stringers with Au and Ag Years of Production: 1893 to 1906 Mineral production: 1000 Ibs ore @ $56 Au per ton in 1906. No other production data References: Schrader, 1909
Sheeptrail-Boulevard Mine (Minnie) Location: T21N, R20W, sec 7 Lat. 35.2194N Lon. 114.4511W Quadrangle: Union Pass Geology: Vein along contact of Tertiary rhyolite with Precambrian granite Mineralization: Quartz vein and stringers with calcite, hematite, MnOx, Au Years of Production: >1865 to 1982 Mineral production: 15,000 tons of ore by 1906. No other production figures References: Gardner, 1936; Schrader, 1909; Wilson and others, 1934; AZGS mine files
Tragedy Mine Location: T21N, R20W, sec 9, SE Lat. 35.2153N Lon. 114.4156W Quadrangle: Union Pass Geology: Vein at contact of Tertiary rhyolite with Precambrian granite Mineralization: Quartz, iron-stained, with gold Years of Production: 1903 to 1909 Mineral production: several hundred tons of ore by 1909; no other production figures References: Schrader, 1909
39

Tyro Mine Location: T21N, R20W, sec 6, SE/SE Lat. 35.2272N Lon. 114.4497W Quadrangle: Union Pass Geology: Tertiary rhyolite dikes in Precambrian granite Mineralization: Quartz-calcite veins with fluorite, Au Years of Production: 1902-1982(?) Mineral production: (no production data), grade 0.3 to 11 ozlt Au, up to 56 ozlt Ag References: Schrader, 1909; AZGS mine files
Union Pass Mine Location: T21N, R20W, sec 29, NW/SE Lat. 35.l742N Lon. 114.4342W Quadrangle: Union Pass Geology: Fault contact of Tertiary rhyolite with Precambrian granite Mineralization: Quartz veins in fault breccia; contains calcite, adularia, FeOx, MnOx Years of Production: 1886 to (?) Mineral production: small - no production data References: Schrader, 1909
Mines in Union Pass district with no information Expansion Philadelphia Monarch Sunlight Gold Chain Burke Mandalay Bonanza Banner Quail
Mines in Union Pass district outside study area King of Secret Pass
40