a comparison of water quality and hydrodynamic...
TRANSCRIPT
Journal of Coastal Research SI 45 93-109 West Patm Beach, Florida Fall 2004
A Comparison of Water Quality andHydrodynamic Characteristics of theGuana Tolomato Matanzas NationalEstuarine Research Reserve and theIndian River Lagoon of Florida*"Edward J. Phlips'^'t, Natalie Lovev, Susan Badylakt, Phyllis Hansent, Jean Lockwoodt,Chandy V. Johnij:, and Richard GIeeson§
tDepartment of F'iaheries andAquatic Sciences
University of FloridaGainesville, FL 32653,U.S.A.
iSt. Johns River WaterManagement District
Palatka, FL 32177, U.S.A.
§Guana Tolomato MatanzasNational EstuarineResearch Reserve
Marineland, FL 32080,U.S.A.
ABSTRACTI
PHLIPS, E.J,; LOVE, N; BADYLAK, S.; HANSEN. P.; LOCKWOOD, J.; JOHN, C.V.. and GLEESON, R,.2004. A Comparison of Water Quality and Hydrodynainii- Charairteristits nf the Guana TolomaW MatanzasNational Estuarine Research Rfservi? and the Indian River I.agonn of Florida. Journal nfConslat Research,.SI(45t. 93-109. West Palm Beach (Klorida). ISSN 0749-U20H.
The lagoons that border the evmt coast of the Florida peninxuia pmvide an opportunity to study waU'rchemiBtry and phytoplanktiin oharacteristioB over a wide range of water residence and nutrient load con-ditions. This article include.'! the results of a 2-year study of eight study sites. The northern half of theHampling range included four saniplinR Bites within the newly estahlished Guana Tiil'imatu Matania.'' Na-tional EHtuarine Research Reserve. The southern half of the sampling range consisted of four study sitesdistrihuted in ecologically disUntt -Suh-hasins of the Indian River Lagoim. The Guana Tolomato MatanzasNational Kwtuarine Keaearch Reserve and Indian Kiver La joon include estuaries with water residence timesranging from days to months and watersheds with widely differing nutrient load characteristics. The resultsof this study revealed wide temporal and spatial variability of physical and chemical characteristics. Meansalinities for the study period ranged from 9.7 to 'il.b'h over the eight sites. Mean orthophosphate andtotal phnuphiiruti rancentrations ranged from 0.26 tji 1.5, \M and 1.45 to 3.00 |iM, respectively. Meandissolved inorganic nitrogen and total nitrogen concentrations ranged from 3.14 to 9.77 [iM and 26.43 to71,14 [iM, respectively. Individual phytojjlankton standing crops, in terms of chlorophyll a concentrations,ranged from less than 1 |ig L ' to more than 60 p.g L '. Comparisons of tht relationships between nutrientand phytDplHnktim .standing trops at the eight study sites indicated that water residence times and nutrientloads provided impiirtant insights into the hasis for oheerved temporal and spatial patterns of variability.Indices for water residence time and nutrient liiad were determined for each Hit*. A combination of thecharacter of watershed inputs and residence time was most useful in interpreting patterns of nutrientconcentrations, whereas water re.sidence time appeared to he the pre-eminent factor dictating phytoplank-tiin standing crop potential among the eight study sites.
ADDITIONAI. INDEX WORDS: Tdiimatn Hiivr. Guana ffiirr,nilmgen, phyloptanktiin. umter residence lime, nutrient load.
Ill, chlorophyll ii. phosphorun.
INTRODUCTION
During the last century, concerns about the im-pacts of human activity on the integrity and sus-tainability of coastal ecosystems have become in-
* Corresponding author: E-mnil: [email protected]* This research was supported by the Florida Agricultural
Experiment Station and grants from the St. Johns Riiier Wa-ter Management District, tlie Guana Tohniato MatanzasNational Estuarine Research Reserve, and tlie Florida Wild-life ami Conservation Commission. This paper was approivd.for publication as Journal Series No. R-10484, part of the.Florida Agricultural Experiment Station.
creasingly acute (SMAYDA, 1989; HALLEGRAEFF,
1993; NIXON, 1995; RICHARDBON and JORGKNSEN,
1996; CLOERN, 2001). These concerns have focusedattention on the need to develop the capability toforecast or predict the effects of environmentalchange on the structure and function of aquaticecosystems. In freshwater environments, signifi-cant progress has been made in modeling the re-lationships between key factors, such as nutrientload and biological responses, including algal bio-masK (Voi.i-KNWKiDER, 1976). Defining these re-lationships in marine ecosystems has proven to be

94 Phlips et al.
more elusive ICLOERN, 2001), One of the challeng-es facing marine researchers in modeling efforts isthe highly dynamic nature of biogeophysical con-(iitions in estuaries. The ability to predict the out-come of environmental change depends on theability to define key driving factors in individualecosystems, such as water residence times, water-shed inputs, and the sensitivities of biological com-munities to change. The National Estuarine Re-search Reserve and Florida's Surface Water Im-provement and Management programs serve asplatforms from which to investigate these drivingfactors within the context of the broad range ofconditions represented by the participating orga-nizations.
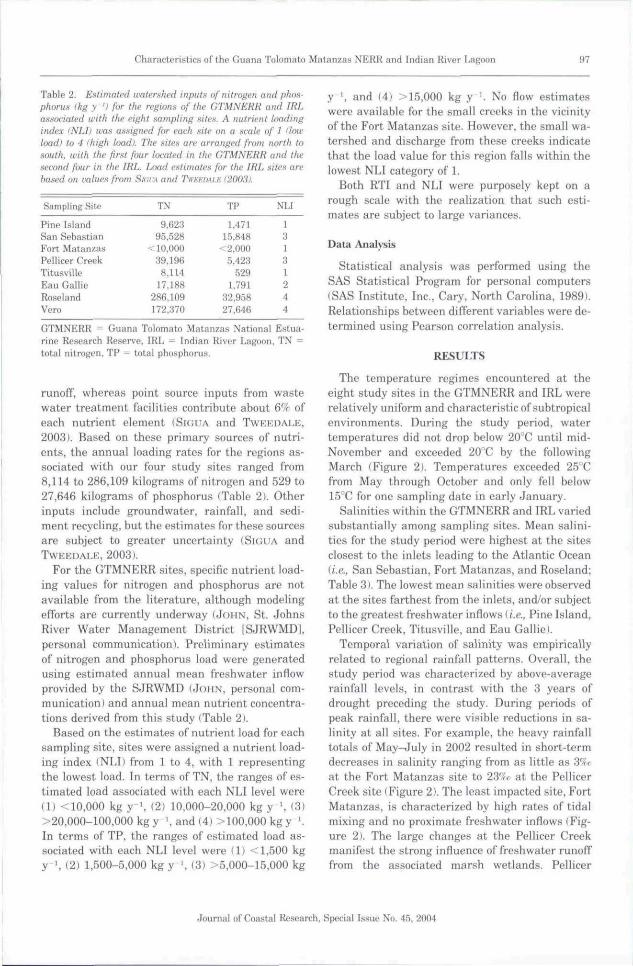
The lagoonal estuaries that border the east coastof the Florida peninsula provide an opportunity toexamine water column characteristics over a widerange of hydrodynamic conditions and watershedinputs of freshwater and nutrients. The Floridapeninsula is also of biogeographical interest be-cause it lies within the transition from the tropicalenvironment of the Florida Keys to the warm tem-perate habitats of the Carolina coast. In this study,we compared the temporal and spatial patterns ofmacronutrient concentrations and phytoplanktonstanding crop at eight study sites located along thenorth and north-central east coast of Florida (Fig-ure 1). The northern half of the sampling rangeincluded four study sites within the newly estab-lished Guana Tolomato Matanzas National Estu-arine Research Reserve (GTMNERR). The south-em half of the sampling range consisted of fourstudy sites distributed in ecologically distinct sub-basins within the Indian River Lagoon IIRL), TheGTMNERR and IRL include estuaries with waterresidence times ranging from less than a day tomore than a year and watersheds with differingnutrient load characteristics (SIGL'A and TWEE-DALE, 20031, The central objective of this studywas to determine the responsiveness of phyto-plankton standing crops to temporal changes andregional differences in nutrient load within thecontext of key hydrodynamic considerations, in-cluding water residence time and meteorologicaltrends.
METHODS
Study Site Descriptions
The GTMNERR is located along the northeast-ern coast of Florida and within the barrier islandsthat define the associated estuaries. The reserve
extends from near the city of Marineland, north tothe Tolomato River, beyond the city of St. Augus-tine (Figure 1). The northern-most sampling sitewas at Pine Island within a region fed by a marshwatershed. The next site to the south was locatedat the mouth of the San Sebastian River just southof the city of St. Augustine and is within 2 kilo-meters of the St. Augustine Inlet, leading to theAtlantic Ocean. The third site was located within2 kilometers of the Matanzas Inlet, just north ofthe city of Marineland. The final site was locatedwithin the marsh-fed Pellicer Creek that feeds intothe coastal lagoon near Marineland,
The IRL is located along the central east coastof Florida and extends from Jupiter Inlet in southFlorida to Titusville in central Florida. The lagoonis characterized by a number of ecologically dis-tinct basins that differ considerably in terms of hy-drodynamic, chemical, and biological characteris-tics IKLEPPEL, 1996; SHENG, PKENE, and Lui,1990; SMITH, 1993). Based largely on hydrody-namic considerations, the IRL has been subdividedinto distinct regions (KI-KPPKI., 1996), which weused to select the locations of the four study sites(Figure II. These four sites represent a range ofwater residence time characteristics, from an areawith water residence times of up to a year at thenorthern-most site near the city of Titusville, toresidence times on the order of days at the sitenear the city of Roseland less than 2 kilometersfrom the Sebastian Inlet. The third site was locat-ed in the north-central region of the IRL just northof Melbourne, and the fourth site was located inthe south-centra! region near the city of Vero,
Field Procedures
Water was collected at the eight sampling siteson a monthly basis within 3 hours of slack low tide.The study period was from May 2002 through Au-gust 2003. Dissolved oxygen (in milligrams liter '),salinity, and temperature (in degrees centigrade)were measured with a Hydrolab Quanta Environ-mental Multi-Probe (Hydrolab Corporation, Aus-tin, TX). Water samples were collected with a wa-ter column integrating tube that captures waterfrom the surface to within 0.1 meters of the bot-tom, Aliquots of sampled water were split off fordetermination of chlorophyll a, color, total phos-phorus (TP), soluble reactive phosphorus, total ni-trogen (TN), nitrate, nitrite, and ammonium. Sam-ples for chlorophyll a analysis were filtered on site(Gelman A/E glass fiber filters. Fisher Scientific,
Journal of Coastal Research, Special Issue No, 45, 2004
Characteristics of the Cuana Tolnmato Matanzaa NERR and Indian River Lagoon
GTMNERR
Florida
Pine Island
4 St.Cit>'of J^-^, Augustine
St. Augustiire' Inlet
San Sebastian'ii'Atlantic
Ocean
Fort Matanzas
Pellicer Creek T '
Matanzas Inlet
IRL
1 .
(
City
/{
'"> \
u Hi ^ \
tJm Roselan
Vs
AtlanticOcean
Eau Gallie
Sebastian Inlet
Figure 1. Study sites (diamond wymbulsi in the GTMNERR and IRL.
Journal of Coastal Research, Special Issue No, 45, 2004

96 Phlips et al.
Suwanee, GAl and frozen prior to analysis. Sam-ples for TP and TN were kept frozen prior to anal-ysis. Samples for color, soluble reactive phospho-rus, nitrate, nitrite, and ammonium analyses werefiltered on site with Gelman A/E glass fiber filtersand stored at 4°C prior to analysis within 48 hoursof sampling.
Monthly 24-hour sampling of water was carriedout using an ISCO Instruments Autosampler(ISCO, Inc., Lincoln, NE). The ISCO unit wasplaced at the Pelhcer Creek site in the GTMNERRat the end of a dock extending into the creek. Sam-ples were withdrawn by pumping at 2- to 2.5-hourintervals from a depth of 0.5 meters from the sur-face. The sample storage container was packedwith ice to maintain low temperature. At the endof a 24-hour period, the samples were extractedfrom the unit and processed for subsequent anal-ysis of salinity, chlorophyll a, color, TP, soluble re-active phosphorus, TN, nitrate, nitrite, and am-monium according to the same guidelines de-scribed above.
Laboratory Procedures
Inorganic nitrogen concentrations (nitrite, ni-trate, and ammonium) were determined colori-metrically with a Bran-Luebhe, Inc., BuffaloGrove, IL AutoAnalyzer (APHA. 1989; PARSONS,
MAITA, and LALI,I, 19841 from filtered aliquots.Soluble reactive phosphorus concentrations (ortho-phosphate [PO '' ]) were determined colorimetri-cally with a Hitachi U2000 dual-beam spectropho-tometer (www.digilabglohal.coml (APHA, 1989;PARSONS, MAITA, and LALLI, 1984) from filtered(Gelman A/E) aliquots. Total nitrogen and TP weredetermined using the persulfate digestion method(APHA, 19891. Concentrations of nitrogen were de-termined colorimetrically with a TechniconAutoAnalyzer (APHA. 1989; PARSONS, MAITA, andLAI,1,1, 1984). Concentrations of phosphorus weredetermined coiorimetrically with a dual-beamspectrophotometer (APHA, 1989; PARSONS, MAI-TA. and LALI.T, 1984).
Water color was determined from filtered (Gel-man A/E] water. Samples were analyzed usingplatinum cobalt standards from protocols de-scribed in Standard Methods (APHA, 1989) on aHitachi U2000 dual-beam spectrophotometer.
Chlorophyll a was determined from filtered wa-ter samples extracted with 95% ethanol at elevat-ed temperature (SARTORY and GKOBBHLAAR,
Tahle \. The estimated influence of tidefi. freshwater inflows,wind, and other factors on the magnitude of water flushing,shown on a scn/e ofO (negligible impact) to 4 (strong impact!.The combined influences of these factors were used to calculatea water residence time index (RTI), presented on a scale of 1(short residence time) to 4 (long residence time). The sites arearranged from north to south, with the first four located inthe GTMNERR and the second four in the IRL
Sampling Kit*
Pine IslandSan SebastianFort MatanzasPellicer CreekTitusvilleEau GallieRoseiandVero
Tides
4.03.63.2LI0.00.40.70.4
FWInflows
2.03.52.54.00.4L74.03.8
Wind
3.83,93.02.01.31.94.03.8
Other
2.03.04.02.02.02.03.52,5
RTI
21124312
GTMNERR = Guana Tolomato Matanzas National Estua-rine Research Reserve, IRL = Indian River Lagoon, FW =freshwater.
1984). Chlorophyll a concentrations were deter-mined with a dual-beam spectrophotometer.
Water Residence Time and Nutrient InputEstimations
Given that the factors affecting the residencetime vary between sites, we formulated a simpli-fied residence time index (RTI) that combined theeffects of a number of key factors. The RTI is aqualitative index of residence time derived by firstassigning the study sites numerical ratings andweights for the relative magnitude of water fiush-ing associated with key factors that affect resi-dence time, including tidal excursion, freshwaterinflow, wind, and a combination of several otherfactors (e.g.. tidal null zones, stratification, andwater depth!. The ratings for the flushing impactof tidal excursion, freshwater infiow, wind, andother factors are described in Table 1. They werecalculated using hydrodynamic and constituenttransport models (CHRISTIAN, SUCSY, and CART-ER, 2004; JOHN, 2003, 2004; JOHN and MORRIS,1999). The RTI values were adjusted to a relativescale of 1-4, with 1 representing the shortest res-idence times, i.e., highest total flushing influence.
Nutrient loads for the eight sites in the studywere estimated from a recent publication dealingwith tbe IRL (SiGUA and Tvv-KEUALE, 2003) andunpublished information obtained from the St,Johns River Water Management District, Palatka,Florida. In the IRL, 79% of the nitrogen load and74% of phosphorus load is from agricultural/urban
•Journal ni' Coastal Research, Special Issue No. 45, 2004
Characteristics of the Guana Tolomato Matanzas NERR and Indian River Lagoon 97
Table 2. Estimated watershed inputs of nitrogen and phd.-!-phorus (kg y ') for the regions of the GTMNERR and IRLassociated with thr eight sampling sites. A nutrient loadingindex <NLI) was assigned fur each nite on a scale of 1 Howload) to 4 (high load). The sites are arranged from north tomuth, with the first four located in the GTMNERR and thesecond four in the IRL. Load estimates for the IRL sites arebased on values from SIGUA and TWF.EHAI.K (20031.
Sampling Site
Pine IslandSan SebastianFort MatanzasPellicer CreekTitu.svilleEau GallieRoselandVero
TN
9.fi2:!95.528
< 10,00039,196
8,11417.188
286.109172,370
TP
1,47115.848
<2,0005,423
5291,791
-•32,95827,646
NLI
13131244
GTMNERR - Guana Tnlomato Matanzas National Estua-rinp Research Reserve, IRL = Indian RIVLT Laffmin. TN =total nitrogen, TP = tolal phosphorus.
runoff, whereas point source inputs from wastewater treatment facilities contribute about &'/(• ofeach nutrient element (SuiUA and TWKKDAI.E,
2003). Based on these primary sources of nutri-ents, the annual loading rates for tbe regions as-sociated witb our four study sites ranged from8,114 to 286,109 kilograms of nitrogen and 529 to27,646 kilograms of phosphorus (Table 2). Otherinputs include groundwater, rainfall, and sedi-ment recycling, but tbe estimates for tbese sourcesare subject to greater uncertainty (SKHIA and
TWEEDALK, 2003).For the GTMNERR sites, specific nutrient load-
ing values for nitrogen and phosphorus are notavailable from the literature, although modelingefforts are currently underway (JOHN, St. JohnsRiver Water Management District ISJRWMD],personal communication). Preliminary estimatesof nitrogen and phosphorus load were generatedusing estimated annual mean freshwater inflowprovided by the SJRWMD (Jt>HN, personal com-munication) and annual mean nutrient concentra-tions derived from this study (Table 2).
Based on the estimates of nutrient load for eachsampling site, sites were assigned a nutrient load-ing index (NLI) from 1 to 4, with 1 representingthe lowest load. In terms of TN, the ranges of es-timated load associated with each NLI level were(1) <10,000 kg y-', (2) 10,000-20,000 kg y ', (3>>20,000-100,000kgy ', and (4) >100,000 kgy '.In terms of TP, the ranges of estimated load as-sociated witb each NLI level were (1) <l,500 kgy-\ (2) 1,500-5,000 kg y ', {3) >5,000-15,000 kg
y ', and (4) >15,000 kg y '. No flow estimateswere available for the small creeks in the vicinityof tbe Fort Matanzas site. However, tbe small wa-tershed and discharge from these creeks indicatethat the load value for this region falls witbin tbelowest NLI category of 1.
Both RTI and NLI were purposely kept on arough scale with the realization that such esti-mates are subject to large variances.
Data Analysis
Statistical analysis was performed using tbeSAS Statistical Program for personal computers(SAS Institute, Inc., Cary, North Carolina, 1989).Relationsbips between different variables were de-termined using Pearson correlation analysis.
RESULTS
Tbe temperature regimes encountered at tbeeight study sites in the GTMNERR and IRL wererelatively uniform and characteristic of subtropicalenvironments. During tbe study period, watertemperatures did not drop below 20°C until mid-November and exceeded 2O''C by the followingMarcb (Figure 2). Temperatures exceeded 25''Cfrom May tbrough October and only fell below15°C for one sampling date in early January.
Salinities witbin tbe GTMNERR and IRL variedsubstantially among sampling sites. Mean salini-ties for tbe study period were bigbest at the sitesclosest to the inlets leading to the Atlantic Ocean(i.e., San Sebastian, Fort Matanzas, and Roseland;Table 3). Tbe lowest mean salinities were observedat tbe sites fartbest from the inlets, and/or subjectto the greatest freshwater inflows (i.e.. Pine Island,Peilicer Creek, Titusville, and Eau Gallie).
Temporal variation of salinity was empiricallyrelated to regional rainfall patterns. Overall, thestudy period was characterized by above-averagerainfall levels, in contrast witb tbe 3 years ofdrougbt preceding the study. During periods ofpeak rainfall, there were visible reductions in sa-linity at all sites. For example, tbe heavy rainfalltotals of May-July in 2002 resulted in short-termdecreases in salinity ranging from as little as Z''icat the Fort Matanzas site to 23%t. at the PellicerCreek site (Figure 2). Tbe least impacted site. FortMatanzas, is cbaracterized by bigb rates of tidalmixing and no proximate freshwater inflows (Fig-ure 2). Tbe large cbanges at tbe Pellicer Creekmanifest the strong influence of freshwater runofffrom tbe associated marsb wetlands. Pellicer
Journal of Coastal Research, Special Issue No. 45, 2004

Phlips et al.
3530
20151050
Pine Isiand San Sebastian35302520151050
0)
3 >•CO . t ;
Q. -^E </}01
35302520151050
o o o oO O O O
A
3530 „25 320 215 I10 V5 -0
O O O O O O O O OO O O O O O O O O
Saiinity - • - Temperature
Fort IMatanzas
•<• • Salinity -Temperature
Titusviile
K /
•-•-•
35302520 2
10 «
Salinity -•-Temperature
Peiiicer Creek
o<>
V /
'ft." 'o.<
1/1 to I-- CO
Salinity ' Temperature
3530
>,25I 20"S 15"" 10
Eau Gailie
35302520151050
o o o o o o o o o oo o o o o o o o o o
3530
«20 2
o15 I10 »5
^ ^ o oo o o o o o o o o o o o o o o o
Salinity Temperature
30 -
20
1510 -5 -n -
yZr' >«/"
&'
Roseiand
\ v / •
o
4/24
30
o o o
5/24
6/23
7/23
8/22
o o
9/21
0/21
30
1/20
30
2/20
o
1/19
oCO
EO
3/20
o o
4/19
5/19
o
6/18
CO
7/18
o
8/17
<• • Salinity -"—Temperature
3530252015 I10 *5
m a
353025201510
5
M.
-o -
•
CM PsI f - l CMO O O O•« V rCM CM C
« in t
-o .
Saiinity -•—
Vero
- ' " \ .
o o o o o <=fN ^ T- O O ^CN 0^ fN P^ C** **00 O> O * " Cst T"
Salinity - • -
Temperature
- / - o'
/
o o o o o o00 o ^ 01 CO ra
CM c ^ m <D r-
Temperature
o
EO
17
CO
Figure 2. Temperature (°C) and salinity ippt) at the eight study sites.
35302520151050
Journal of CoaHtal Research, Special Issue No. 45, 2004

Characteristics of the Guana Toloniato Matanzas NERR and Indian River Lagoon 99
Table 3. Mean valui'K and standard deviations tin parpnihi'si'sl iwvr t/w study period for eight paraniflers: salinity (Sail, solublereactive phoaphnrua IP(),I. total phosphorus iTPl. ammonium lNH,i. nitrate (NO-,1. nitrite 'NOj. total nitrogen fTN), and chlo-rophyll a iChtl.
Site
Pine Island
San Sebastian
Fort Matanzas
Pellicer Creek
Titusville
Eau Gallie
Roseland
Vero
Sal(ppt)
24.8(7.1130.312.4131.5(1.719.7
(7.0124.9(3.9120.5(3.0)28.4(3.5)26.1(5.9)
PO,i|j.M)
0.87(0.48)0.77
(0.32)0.42
(0.26)1.32
(0.58)0.26
(0.26)0.39
(0.5210,74
(0.52)1.55
(1,001
TPi|j.M)
2.6511.23)2.19
(0,71)1.61
(0.65)3.00
(1.2311.45
(0.90)1.52
(0.65)2.03
(0.9012.74
(1.39)
NH,(jiM)
5.42(4.57)5.57
(3.6413.36
(2.00)4.50
(2.14)6.00
(6.6415.79
(6.29)2.50
(1.64)4.00
13.57)
NO,(jiM)
3.14(5.43)1.86
(1.50)0.79
(0.79)1.07
(0.71)1.21
(1.71)0.50
(0.50)0.43
(0.64)0.86
(0.86)
NO,i|i.M)
2.21(4.21)0.50
(0.43)0.21
(0.21)0.43
(0.36)0.57
(0.71)0.21
(0.36)0.21
10.14)0.29
(0.21)
TN(jiM)
42.29(10.21)32.00(9.93)26.43
(15.43)50.43
(15.50)71.14
(17.71)64.43
(11.79)36.71(6.86)39.50(9.93)
Chi(UgL ')
8.9(4.3)5.7
(1.7)4.8
(2.9)7.8
14.1)11.5
(14.9)13.0
(10.4)6.2
(3.6)6.3
(5.3)
1 2 3 4 5 6 7 8 9 10 11 12
l-o-Saiinity -*-Coior l
1 2 3 4 5 6 7 9 10 11
• Salinity -*—Coior
Figure 3. Diurnal pattern of salinity and color at the Pel-licer Croek .site. Samples wero collected every 2 h. The re-sults of two 24-h sampling periods are shown: (al from Oc-tober 7, 2002, to October 8, 2002 (top) and (b) from June 24,2003, to June 25. 2003 (bottom).
Creek also exhibited considerable diurnal shifts insalinity (Figure 3). For example, the high rainfalllevels in the fall of 2002 yielded high outflows fromthe creek and low salinities. The impacts of theseoutflows are apparent in the large shifts in salinityfrom outgoing to incoming tides, as well as corre-sponding changes in water color associated withmarsh tannins (Figure 3a). In contrast, periods oflow rainfall, as in June 2003, exhibited high andless variable salinity, as well as low color levels(Fi^re 3b).
Mean soluble reactive phosphorus (P04'' ) con-centrations for the study period were lowest in thenorthern region of the IRL (Titusville and EauGallie sites! and the Fort Matanzas site in theGTMNERR (Table 3). The highest mean PO.,' lev-els were at the Pellicer Creek site in theGTMNERR and the Vero site in the IRL. Both ofthe latter two sites had numerous individual val-ues exceeding 1 |xM of P as PO4'' (Figure 41.
Total phosphorus concentrations exhibited asimilar pattern as that of PO4'", although themagnitude of the differences in mean values be-tween sites was somewhat less pronounced (Table3). From a temporal perspective, both PO/ andTP were lowest during the winter (Figure 4).There were also interannual differences in PO,,''"and TP levels in the GTMNERR and IRL. In thelatter region, concentrations tended to be higherin 2002, whereas in the former region, concentra-tions were somewhat higher in 2003 (Figure 4).
Mean dissolved inorganic nitrogen (DIN) con-
Journal nf Coastal Research, Special Issue No. 45, 2004

100 PhHps et QI.
Pine Island
I I I 11 1 1 1 Ir l 1 rJfi IfJrllllmri Ir
11o o o o o o o
Oo ^ a
o o o o o o
i2! s < 5 T -
Figure 4. Total phosphorus (TF', solid bar) and soluble reactive phosphorus (PO.," , grey barl concentrations ((j.M L ') at theeight sampling sites. N indicates dates not sampled.
Journal of Coastal Research, Special Issue No. 45, 2004

Characteristics of the Guana Tolomato Matanzas NERR and Indian River Lagoon 101
centrations for the study period ranged from 3.5 to10 |xM. The highest concentrations were at thePine Island site, and the lowest v -ere at the Ro-seland site (Figure 5). There were no consistentseasonal trends in DIN concentration (Figure 5).Among the three major components of DIN, am-monium was generally the most abundant, withmean concentrations ranging from 2.50 to 6.00 jiM(Table 3). Mean ammonium concentrations werehighest at Pine Island and San Sebastian in theGTMNERR and Titusville and Eau Gallie in theIRL. Nitrate was the next most abundant form ofDIN, with concentrations ranging from 0.43 to3.14 |j.M (Table 3). Nitrate concentrations weresubstantially higher at Pine Island than any of theother sites. A similar pattern was observed formean nitrite concentrations, which were generallybelow 0.5 |JLM, except at Pine Island where themean concentration for the study period was 2 ^LM.The high mean concentration at Pine Island wasin large part attributable to exceptionally high ni-trite values in September and October 2002.
Mean TN concentrations in the study regionmged from 26.43 to 71.14 |xM (Table 3). The twosites in the northern IRL exhibited the highestmean TN concentrations, near 70 |iM. As in thecase of DIN, TN concentrations in the GTMNERRdid not show any definitive seasonal trends (Fig-ure 5). In the IRL, the Titusville and Vero sitesshowed the highest TN concentrations in the sum-mer.
Chlorophyll a concentrations were used as theprincipal surrogate for phytoplankton standingcrop. Mean chlorophyll o concentrations for thestudy period were highest at the Titusville andEau Gallie sites in the northern IRL, 11.5 and 13,0|jLg L ', respectively (Table 3). These two sites alsoexhibited the largest variability, reflecting the oc-currence of periodic algal blooms (Figure 6). Thelargest blooms occurred in the summer of 2002(Figure 61. The latter blooms were dominated bythe potentially toxic dinoflagellate Pyrodinium ba-hamense (PHLIPB et at, 2004). The lowest meanchlorophyll a concentrations and standard devia-tions were observed at the San Sebastian and FortMatanzas sites in the GTMNERR, with a meanvalue of approximately 5 |j.g L ' and standard de-viation of approximately 2 (i.g L ' (Table 3).
The eight study sites were categorized accordingto RTI and NLI (Figure 7l. On the RTI axis thesites with the least residence time (lowest RTI val-ue! were the three sites nearest to inlets to theAtlantic Ocean: Fort Matanzas, San Sebastian,
and Roseland. On the other extreme of the RTIscale was Titusville. In terms of the relative mag-nitude of nutrient load (NLI), the regions with theinput were Vero and Roseland (SIGUA and TWEE-DAi,E, 2003). The Fort Matanzas site was placedon the other extreme of the NLI scale. Two mea-sures of phytoplankton standing crop potentialwere determined for each sampling site: peak chlo-rophyll a and mean of the top 25'7( of chlorophylla values. Both values were plotted simultaneouslyagainst RTI and NLI (Figures 7, top and bottom,respectively!, showing a visible relationship be-tween RTI and chlorophyll a.
The results of Pearson correlation analysesshowed that the relationships between chlorophylla concentration and five key physical and chemicalfactors were different between the IRL andGTMNERR (Table 4). At the four IRL sites chlo-rophyll a was correlated to TN and in some casesTP at the 0.05 level of significance. In contrast,chlorophyll a was not correlated to either TN orTP at the GTMNERR sites. The; GTMNERR sitesdid show a positive correlation between chloro-phyll a and temperature, which was not observedat the IRL sites.
DISCUSSION
The results of this comparative study of theGTMNERR and the IRL provide insight into howfundamental differences in hydrodynamic and wa-tershed characteristics influence physical, chemi-cal, and biological properties of subtropical la-goons. The eight regions within the GTMNERRand IRL selected for this study represent differentcombinations of two important characteristics ofestuaries: water residence time and watershed in-puts of freshwater and associated macronutrients.
Water residence time in estuaries is influencedby many factors that affect water movement, in-cluding tides, freshwater inflows, wind, rainfall,stratification, and estuarine bathymetry (KNOP-PFRS, K-JERFVE, and CARMOUZK, 1991; MONBKT.1992). Despite the fact that many of the aforemen-tioned factors contributed to the variability of wa-ter residence times observed at the eight sites inthis study, the distance from inlets was a majorcontributor to the determination of RTI. Strongtidal mixing was a major contributor to the lowRTI that characterized the three sampling sitesnear inlets: San Sebastian, Fort Matanzas, andRoseland. Residence times in shallow, relativelylow-volume estuaries, such as the GTMNERR and
Journal of Coastal Research, Special IKHUO NO. 45, 2004

102 Ph!ipsf( al.
100 100
100
80
60
40
20
o
100
80
Fort Matanzas
tccrto M
San Sebastian
1 1 1 1 1 1 1 IIJJJrIrJnJjJjJjr [Iji l l
O O OCMO
D)3
<
CMO
a.Oi
tn
CN
o
O
CMO
>
0
z
oua
COO
cre
- )
CO
oA9)U.
CO
oi!.
re
E
no
<
CO
o>re
E
Eau Gallie
l lIfJi f
1tJ11
o o o o o o o o o o o o o o o o3 «< CO
> oo «z o
a< 3<
100
Figure 5. Total nitrogen ITN, solid barl and dissolved inorganic nitrogen (DIN. grey bar) concentrations (jiM/L) at the eightaampHng sites, DIN is equal to the sum of ammonium, nitrate, and nitrite coneentrationH. N indicates dates not sampled.
Journal of Coastal Research, Special Issue No. 45, 2004

Characteristics of the Guana Toloinato Matanzas NERR and Indian River Lagoon
Pine Island San Sebastian
Titusville Eau Gallie
Figure 6, Chlorophyll o concentrations ijj-g/L) at the eight study sites.
Journal of Coastal Research, Special Ls.' ue No. 45, 2004

104 Phhps et al.
Figure 7. Relationship between peak chlorophyll a concen-tration itLg/L, topi, mean of the top 25'^ of chlorophyll a val-ues over the study period IhottJiml, residence time index(RTI), and nutrient load index iNLIl for the eight samplingsites in this study. The sites are numbered from north tosouth; the GTMNERR sites are 1. Pine Island; 2, Han Se-hastian; 3, Fort Matanzas; 4, PelHcer Creek; the IRL sitesare 5, Titusvilte; 6. Eau Gallie: 7. Roseland; and 8, Vero.
IRL, are also sensitive to freshwater inflow. Re-gions subject to large freshwater inflows, such asthe Vero site in the IRL and the Pellicer Creek sitein the GTMNERR, can experience reduced resi-dence times during periods of high rainfall {SMITH,1993). Temporal variability of freshwater inflowscan also result in rapid shifts in salinity that in-fluence the chemical and biological character ofimpacted regions, including the abundance andcomposition of phytoplankton (SMAYDA, 19891.
Overall, many of the lagoonal habitats of theGTMNERR are more tidally driven than many re-gions within the IRL, with the obvious exceptionof the Roseland site near the Sebastian Inlet. Con-
versely, parts of the IRL are subject to larger wa-tershed inputs of nitrogen and phosphorus thanmany areas in the GTMNERR, with the possibleexception of the San Sebastian site. It is useful tocompare the spatial and temporal trends in thephysical, chemical, and biological characteristics ofeach region within the context of differences inRTI and NLI, particularly as it relates to the re-sponsiveness of phytoplankton standing crops toregional and temporal differences in nutrient load.
Regional Differences in Ph)«ical and ChemicalCharacteristics
In the GTMNKRR, two of the study sites, SanSebastian and Fort Matanzas, are located withinthe relatively narrow (<0.5 kilometers) reaches ofthe intracoastal lagoons near inlets to the AtlanticOcean and are subject to daily exchange of waterwith the Atlantic Ocean. The high degree of tidalmixing at these two sites is reflected in the rela-tively high mean salinities observed at the sites,30.3%r at the San Sebastian site and 31.5%c at theFort Matanzas site. The San Sebastian site iswithin 2 kilometers of the St. Augustine Inlet andunder the direct influence of the San SebastianRiver, with a watershed that includes the city ofSt. Augustine. Similarly, the Fort Matanzas site iswithin 2 kilometers of an inlet, the Matanzas In-let, hut in contrast is not under the proximate in-fluence of major watershed inflows. The northern-most of the GTMNERR sites at Pine Island is 10kilometers from the nearest inlet at St. Augustineand is under the influence of inputs from a wet-land watershed characterized by moderate levelsof human development.
In terms of water cbemistry, TN, DIN, ortho-phosphate, and TP concentrations at Pine Islandwere all higher than at the San Sebastian site, de-spite the fact that the NLI at the latter site wassubstantially higher. The observed differences innutrient concentrations can be viewed in the con-text of the interaction between the distance of thesites from inlets to the Atlantic Ocean and theproximity of major watershed inflows. The highvalues at Pine Island reflect the relatively largedistance from the St. Augustine Inlet and the nu-trient inputs from the watershed. Conversely, thelow values at the Fort Matanzas site are attrib-utable to the nearness of the Matanzas Inlet andthe lack of major local watershed inputs. The SanSebastian site is subject to opposing influences,with relatively large nutrient inputs from the ur-
Joumal of Coastal Research, Special Issue No. 45, 2004

Characteristics of the Guana Tolomato Matanzas NERR and Indian River Lagoon 105
Table 4. Correlation hetween phytoplankton abundance, in terms of chlorophyll a concentration, and selected phy.iical andchemical parameters: total nitrogen fTNl total phosphorus iTPl, silica 'SD, temperature (TEMPl. and salinity iRALl Pearsoncorrelation caefficientfi are shown along with significance levels in parfinthenes. Coefficients in hold wcrr significant at the 0.05thre.ffhold.
Sampling Site
GTMNERR
Pine Island
San Sebastian
Fort Matanzas
Pellicer Creek
IRLTitusville
Eau Gallie
Roseland
Vern
TN
0.0710.7963)0.40
(0.1262)0.03
(0.9227}0.08
(0.7774)
0.57(0.02«2)0.68
(0.0038)0.50
(0.04«:-{)0.76
(0.0006)
TP
-0.07(0.7952)0.18
(0.4958)0.19
(0.4743)0.10
(0.7123)
0.68(0.0051)0.20
(0.4816)-0.17
(0.054)0.61
(0.0123)
SI
-0.19(0.4719)0.08
(0.7717)-0.06(0.8319)0.14
(0.6115)
0.49(0.0645)0.32
(0.2521)-0.02(0.9479)0.55
(0.0258)
TEMP
0.62(0.0130)0.75
(0.0014)0.65
(0.0059)0.59
(0.0162)
0.40(0.I761I
-0.40(0.1451)
-0.11(0.6787)
0.44(0.0856)
SAL
0.65(0.0085)0.43
(0.1065)0.32
(0.2994)0.41
(0.1126)
-0.16(0.5863)
-0.19(0.4894)
-0.34(0.1994)
-0.67(0.0043)
GTMNERR - Guana Tolomato Matanzas National Estuarine Kesearcb Reserve, IRL = Indian River Lagoon.
banized watershed of St. Augustine, but alsostrong tidal mixing and low residence time, yield-ing intermediate nutrient levels.
The fourth sampling site in the GTMNERR, Pel-licer Creek, is located within a tidal creek that leadsinto the Intracoastal Waterway. The low mean sa-linity and bigb color values for the Pellicer Creeksite reflect tbe direct influence of the marsh water-shed that feeds the creek, particularly during peri-ods of high rainfall and creek discharge. The bighvariability in salinity is indicative of the dynamicinteractions between tidal amplitude and freshwa-ter inflow from the watershed. Salinity in the creekfluctuates diurnally, as well as on longer timescales. The latter variahility can be dramatic and isinfluenced by sbifts in regional rainfall patterns.During flood periods, salinities at the Pellicer sitecan decrease below V'/'i. Chemically, tbe PellicerCreek site was characterized by bigh mean TP andPO,, concentration during tbe study period, simi-lar to tbe Vero site in tbe IRL, wbich is subject tolarge watershed nutrient inputs.
Tbe IRL provides a useful contrast to theGTMNERR because of its close geographical prox-imity, but distinct bydrodynamic characteristics.The northern portion of tbe lagoon, represented bytbe Titusville and Eau Gallie sites, is a severelyflow-restricted region. Water residence times can
exceed a year at the former site (SUKNC:, PERNE,and Lui, 1990; SMITH, 1993). Mean DIN and TNvalues at these two sites were high by comparisonwith other regions of the GTMNERR or IRL. Attbe same time, mean TP and PO, * concentrationsat these two sites were tbe lowest among all tbesites. Tbe relatively high TN : TP ratios at the Ti-tusville and Eau Gallie sites are at least, in part,attributable to the low loading rates of phosphorusrelative to nitrogen in tbe northern IKL, comparedwith tbe central IRL (SIGUA and TWEEDALE,2003).
Within the IRL, the site most similar to tbeGTMNERR, at least in terms of salinity regimeand RTI, is tbe Roseland site, located witbin 2 ki-lometers of tbe Sebastian Inlet. Despite tbe factthat the Roseland site is located near one of tbelargest watershed inputs of phosphorus in the la-goon, mean TP values for the site were within tbemiddle of the range for tbe eight sites in tbe study,indicative of tbe influence of tidal mixing with At-lantic Ocean water. In contrast, tbe other site inthe IRL subject to high pbospborus loading rates,but longer residence time, the Vero site, exhibited509i higher mean TP concentrations and twice asbigh mean SRP concentrations as the Roseiandsite (Table 1). Similarly, tbe two sampling sites intbe GTMNERR with the least tidal influence. Pine
Journal of Coastal Research, Special Issue No. 45, 2004

106 Phlips cf al.
Table 5. Categorization of the eight studyCi^tiniated magnitude of nutrient loads (NLL
RTINLI
1234
^ 1I
Fort Matanzas
San SebastianRoseland
sites according to estimatedon a ticale of 1^1 Sampling
2
Pine Island
Pellicer CreekVero
water.'iites in
residence times iRTL onthe IRL are underlined.
3
Eau Gallie
a scale of /—i
4
Titusville
<•) and
Island and Pellicor Creok, had higher mean TPconcentrations than the two sites near inlets, SanSebastian and Matanzas, despite the fact that thelatter site (San Sebastian) is subject to high NLI.
Another important consideration in evaluatingregional disparities in RTI is the difference in theresponse of the different regions to temporalchanges in rainfall. The sampling period includedin this study ii.e., 2002 and 2003) was character-ized by high rainfall. In contrast, the 3 years pre-ceding this period, 1999 to 2001, were droughtyears. Within the phosphorus-rich watershedsfeeding the central region of the IRL, the highrainfall encountered in 2002 coincided with excep-tionally high summer TP concentrations (Figure4). The most dramatic difference was observed atthe flow-restricted Vero site, whereas a more mod-est difference was observed at the Roseland site,despite the fact that both regions are subject tohigh levels of phosphorus loading (SJGUA andTWEEDLE, 2003).
In the GTMNERR, rainfall inputs to the water-shed were higher in the spring and summer of2003 than 2002. This temporal difference is man-ifested in the elevated TP levels in 2003 at PineIsland and Pellicer Creek (Figure 4). As in the IRL,the interannual differences are less evident at thetwo sites in the GTMNERK near inlets, San Se-bastian and Matanzas, showing the buffering ef-fect of tidal mixing on both the level and variabil-ity of nutrient concentrations.
Regional Differences in Phytoplankton Abundance
Two aspects of phytoplankton abundance in theGTMNERR and IRL are noteworthy witbin thecontext of this study: spatial distribution and tem-poral variability. The highest average pbytoplank-ton standing crops, in terms of mean chlorophyll aconcentration, were observed at tbe two sites inthe northern IRL, Titusville and Eau Gallie. Theywere also the two sites with the greatest temporalvariability in chlorophyll a, with dramatically
higher concentrations in the summer and fall of2002 than tbe remainder of the sampling period.The next highest mean chlorophyll a concentra-tions occurred at the Pine Island and PellicerCreek sites in the GTMNERR, Both of tbe lattersites exhibited less variability than the sites in thenorthern IRL, and cblorophyll a maxima were sim-ilar in 2002 and 2003. In contrast, the three siteslocated close to inlets (i.e.. San Sebastian, Fort Ma-tanzas, and Roseland) exhibited the lowest meanchlorophyll a concentrations and temporal vari-ability.
The basis for the differences in phytoplanktonstanding crop observed at the eight sites in thestudy can be viewed within the context of the com-bined influences of water residence times (RTI)and nutrient loading characteristics (NLII (Table5). The importance of these two factors in regulat-ing phytoplankton standing crops in estuarine en-vironments is well established (BOYNTON, KEMP,
and Ki'iEP'K, 1982; KENNISH, 1986; KNOPPERS,K-JERFVE, and CARMOLJZE, 1991; MONBET, 1992;VERITY et al., 1998). The eight sites in this studyrepresent different combinations of these two de-fining characteristics. Tbe combined influence ofthese factors on phytoplankton standing crops wasevaluated by plotting peak mean high chlorophylla concentrations against RTI and NLI (Figure 71.The resulting pattern indicates that regions withshort water residence times have lower peak phy-toplankton standing crops than regions of long res-idence times, despite differences in nutrient loadindex, at least under normal to high rainfall con-ditions. However, there are indications that thisrelationship may not hold for all sites duringdrought conditions. The results of a recent studyof the IRL during tbe drought of 1999-2001 sug-gest that in regions where RTI is strongly influ-enced by large freshwater inflows, such as the Ro-seland site, drought conditions can enhance phy-toplankton standing crops by significantly increas-ing RTI (PHLIPS, BADYLAK, and LYN(:H, 2002).
Journal of Coastal Research. Special Issue No. 45, 2004

Characteristics of the Guana Tolomato Matanzas NERR and Indian River Lagoon 107
Another disparity between regions is the differ-ence in the relationship between nutrient concen-tration and phytoplankton standing crop amongthe eight sampling sites. In the GTMNERR, thorewere no significant correlations between chloro-phyll a and any of the nutrient parameters includ-ed in the study iTable 21. The strongest relation-ship in the GTMNERR was between chlorophyll aand temperature, reflecting the elevated chloro-phyll levels in the late spring, summer, and earlyfall. The absence of well-defined relationships be-tween nutrient concentrations and phytoplanktonhiomass ii.e.. chlorophyll o) is not unusual for es-tuarine ecosystems, even those subject to substan-tial eutrophication (BORUM, 1996; CLOERN, 2001).Short water residence times (KNOPPKRS, K-JK-RFVE, and CAHMOUZE, 1991; MONUET, 19921 andthe impacts of active benthic or planktonic grazingactivity (CI-OKRN, 1982; OFFICER, SMAYDA, andMANN, 1982), particularly in shallow environ-ments, are among the factors that can buffer theresponse of phytoplankton standing crop to chang-es in nutrient load. All of the sites in theGTMNERR are subject to relatively high rates oftidal water exchange, at least in comparison withthe northern IRL, and all are shallow. It is alsorelevant to note that among the four GTMNERRsites, the two with the lowest mean chlorophyll aconcentrations. Fort Matanzas and San Sebastian,were also those closest to inlets, suggesting thatdifferences in residence time can influence phyto-plankton standing crops. The importance of waterresidence time to phytoplankton standing crop po-tential is further exemplified by the high NLI val-ues of the San Sebastian site.
In contrast to the GTMNERR, all four sites inthe TRL showed significant correlations betweenchlorophyll a and TN and/or TP (Table 41. In thecase of the Titusville site, chlorophyll a was sig-nificantly correlated to both TP and TN, with theformer relationship being stronger. At the Verosite, both nutrients were also correlated to chlo-rophyll, but the strongest correlation was with TN.The weakest correlation between chlorophyll andnutrients was at the Roseland site, located nearthe Sebastian Inlet.
Differences in the relationships between chlo-rophyll a and nutrients between the GTMNERRsites and the IRL sites suggest that phytoplanktonstanding crops are more sensitive to changes innutrient availability in the latter region. Estua-rine ecosystems with low rates of tidal water ex-change (i.e., microtidal ecosystems), such as the
northern IRL, are often characterized by higherphytoplankton standing crops than macrotidal eco-systems subject to similar levels of nutrient avail-ability, due in large part to the extended waterresidence times (KNOPI'KRS, K,IERFVE, and CAI*-MouzE, 1991; MoNBET, 1992; PHI.IPK, BADYLAK,and LYNCH, 1999). By extension, phytoplanktonstanding crops in the latter ecosystems are alsomore sensitive to changes in nutrient load relatedto short-term and long-term trends in rainfall andwatershed use (VERITY, 2002). This enhanced sen-sitivity is apparent when comparing the responseof phytoplankton standing crop to temporal chang-es in nutrient load for areas in the GTMNERR andIRL with high and low levels of tidal water ex-change. The 16 months of sampling included inthis study fell within a period of above-averagerainfall, following the prolonged drought of 1999-2001. In the IRL, the elevated levels of freshwaterrunoff in the spring of 2002 coincided with highphosphorus concentrations. At the two sites in thenorthern portion of the lagoon subject to high RTI,elevated TP levels in 2002 coincided with dramat-ically higher chlorophyll concentrations in 2002than 2003 (Figure 6). The results of a previousstudy of phytoplankton standing crops and nutri-ent levels in the IRL during drought conditionssupport the sensitivity of phytoplankton standingcrops in the northern region to reduced nutrientload (PHLIPS, BADYLAK, and GKOSSKOI-F, 20021.In contrast to the IRL, sites within the GTMNERRsubject to high tidal water exchange rates (San Se-bastian and Fort Matanzas) exhibited more mod-erate or no apparent responses to the elevatedphosphorus and nitrogen loading associated withperiods of elevated watershed inflows.
In addition to water residence times and water-shed characteristics, nutrient-limiting status ofthe phytoplankton community can influence theresponse of primary production to changes in nu-trient load (BLEDSOE and PHLIPS, 2000; BLEDSOE('/ a/.. 2004). In the northern IRL, the magnitudeof the response to increased phosphorus inputs in2002 was likely enhanced by the fact that phyto-plankton production in the region appears to besubject to periods of phosphorus limitationI PHLIPS, BADYLAK, and GROSSK^PF, 2002).Therefore, pulses of bioavailable phosphorus intothe region would be expected to have a positiveimpact on phytoplankton production. This poten-tial is reflected in the algal blooms observed in thenorthern IRL during the summer of 2002 (BADY-LAK and PHLIPK, 2004; PHLIPS et ai, 2004)
Journal of Coastal Research, Special Issue No. 45, 2004

108 Phlips ei al.
Conversely, the strong spikes in phosphorus con-centration associated with flood periods in the cen-tral IRL yielded less response in phytoplanktonbiomass, probably in part due to the predominanceof nitrogen limitation of phytoplankton growth inthe region {PHLIPH, BADYLAK, and GROSSKOPF,
2002), as well as the lower residence time associ-ated with flood periods in the central IRL (SMITH,
1993). The nitrogen-hmiting conditions prevalentin the central IRL are in turn a consequence of thehigh loading rates of phosphorus that characterizethe watersheds feeding the central IRL (SIGUA
and TwKEDAi.p:, 2003). As in the central IRL. thesites in the GTMNERR had high TP and PO, 'concentrations relative to TN and DIN, indicatingthat phytoplankton production at these sites mayalso he subject to nitrogen limitation.
Determining the relative impact of different en-vironmental factors on phytoplankton ahundancein the GTMNERR and IRL is complicated by themany gaps in our knowledge of the ecology of theseregions. However, the results of this study suggestthat spatial and temporal trends in phytoplanktonstanding crop in much of the GTMNERR and IRLare closely tied to water exchange characteristicsand the nutrient-limiting status of the community.It is clear that forecasting the response of estua-rine ecosystems to changes in nutrient load re-quires an understanding of associated hydrody-namic, chemical, and hiological processes.
ACKNOWLEDGMENTS
We thank the following people for their invalu-able assistance in the field and with laboratoryanalyses: Jean Lockwood, Jessica Frost-Fajans,Erin Bledsoe, Karen Donnelly, and Christina Jett.
LITERATURE CITED
APHA, 1989. Standard Method.^ for the Analy.Kiii of Waterand Wasteivater. 17th edition. Washing^ton, D.C.:American Public Health A.Hsociation, pp. 1067-1074.
BADYI-AK. S. and PHI.II'S, E.J.. 2004. Spatial and tem-poral patterns of phytoplankton abundance and com-position in a subtropical coastal lagoon, tbe IndianRiver Lagoon, Florida. USA. -Journal of Plankton Re-search. 26,1229-1247.
BLKDSOE. E.L. and PHI.II'S, E.J., 2000. Correlation ofphytoplankton .standing crop in the Suwannee Riverand estuary to physical and chemical gradients, Es-tuaries. 23,458-473.
BLKDSOK, E.L.; PHUI'S, E.J.; JETT, C.E., and DoNNKl.-LY, K.A.. 2004. Tbe relationship between phytoplank-ton biomass, nutrient loading, and hydrodynamics inan inner-shelf e.stuary. Ophelia, 58, 29--47.
BoRUM, J., 1996. Shallow waters and land/sea hound-
aries. In: JORGENSEN, B.B. and RIC;HAKD.SON. K.leds.l, Eutrophication in Coastal Marine Ecosystems.Washington, D.C.: American Geophysical Union, pp.179-203.
BoYNTdN, W.R.; KEMI', V.M.. and KEEFE, C.W.. 1982.A comparative analysis of nutrients and other factorsinfluencing estuarine phytoplankton production. In:Kj-;NNEnY. V. led.), Estuarine Comparimns. New York:Academic Press, pp. 69-98.
CHKISTIAN. D.; Si'CSY, P., and CAli'rEit, E., 2004. Sim-ulating the response of total suspended solids to wind,tide, and watershed loads in the Indian River Lagoon.Florida. Proceedings SEERS Conference. HarborBranch Oceanographic Institute, Ft. Pierce, Florida,April 15-17, 2004.
CLOEitN, J.E., 1982. Does tbe benthos control pbyto-plankton biomass in south San Francisco Bay? MarineEcology Progress Series, 9, 191-202.
CuJKKN, J.E., 1991. Tidal stirring and phytoplanktonbloom dynamics in an estuary. Journal of Marine Re-search. 49, 203-221.
HAI.I,KC;RAEFP', G.M., 1993. A review of harmful algalblooms and tbcir apparent global rise. Phycologia. 32,79-99.
JOHN. CM., 2003. Application of EFDC model to Halifaxand Matanzas Rivers in Northeast Florida. In: 7th In-ternational Conference on Near.fhore and Estuarine Co-hesive Sediment Transport Processes. October 1-4,2003. Gloucester Point, Virginia: Virginia Institute ofMarine Science.
JOHN, C.V. and MORRIS, F.. 1999. 2-D finite element hy-drodynamic and transport model application to Tolom-ato and Guana Rivers. In: The 2nd Northern CoastalBasin Estuary Workshop. October 7 and 8, 1999, Pa-latka, Florida.
JOHN. C.V., 2004. Hydrodynamics and constituent trans-port in Tolomato and Guana Rivers. Division of En-gineering. Department of Water Resources, TecbnicalMemorandom TBD. Patatka, Florida: SJRWMD.llOp.
KlCNNlHli, M.J., 1986. Ecology of Estuaries, Volume II.Boca Raton, Florida: CRG Press.
Ki.EFi'EL, G.S., 1996. Tbe State of Florida's estuariesand future needs in estuarine research. Florida SeaGrant College Program. Technical Paper, 85, 43-51.Gainesville. Florida: Florida Sea Grant College Pro-gram, University of Florida.
KNOI'FERS, B.; K-JEKKVE, B., and CARMOUZE, J.P., 1991.Tropbic state and water turn-over time in six cbokedcoastal lagoons in Brazil. Blogeochemistry. 14. 147-166.
MoNHET, Y., 1992. Control of pbytoplankton biomass inestuaries: a comparative analysis of microtidal andmacrotidal estuaries. Estuaries, 15, 563-571.
NIXON, S.W., 1995. Coastal marine eutropbication: a def-inition, social consequences, and future concerns.Ophelia, 41, 199-220.
OFFICER, C.B.; SMAYDA, T.J., and MANN, R., 1982. Ben-tbic filter feeding: a natural eutropbication control.Marine Ecology F/-ogress Series, 9, 203-210.
PARHUNS, T.R.; MAITA, Y.. and LAI.LI, CM., 1984. AManual of Chemical and Biological Methods for Sea-water Analysis, New York: Perj amon Press. 173p.
PiiLiFS, E.J.; BADYLAK, S., and LYNCH, T.L., 1999.
Journal of Coastal Research, Special Issue No. 45, 2004

Characteristics of the Guana Tolomato Matanzas NERR and Indian River Lagoon 109
Blooms of the picoplanktonic cyanobacterium Syne-chocoecu.t in Florida Bay. Limnology and Oceanogra-phy, U, 1166-1175.
PHLIPS, E.J.; BADYLAK, S., and GHOSSKOPF, T., 2002.Factors affecting the abundance of pbytoplankton in arestricted subtropical lagoon, the Indian River La-goon, Florida, USA. Estuarine. Coastal and Shelf Sci-ence. 55, 385-402.
PHLIPK, E.J.; BAIJYLAK, S.; YOUN, S., and KELLEV, K.,2004. The occurrence of potentially toxic dinofiagel-lates and diatoms in a subtropical lagoon, tbe IndianRiver Lagoon, Florida, USA. Harmful Alf^ae, 3. 39-49.
RicHARUwoN, K. and JoRfJENSKN, B.B,, 1996. Eutropbi-cation, definition, bistory and effects. //;: Jorgensen.B.B. and Ricbardson, K. (eds.l, Eutrophication inCoastal Marine Ecosystems. Wasbington, D.C.: Amer-ican Geophysical Union, pp. 1-20.
SAS, 1989. SAS/STAT User's Guide. Version 6. 3rd edi-tion. Cary, North Carolina: SAS Institute.
SARTORY. D.P. and GROBBELAAR, J.U., 1984. Extractionof cbloropbyll a from fresbwater pbytoplankton forspectrophotometric analysis. Hydrobiologia. 114, 177-187.
SHEN(!, Y.P.; PEKNE, S., and Lui. Y.M., 1990. Numericalmodeling of tidal hydrodynamics and salinity trans-
port in the Indian River Lagoon. Florida Scientist, 50,49-61.
SiGUA, G.C and TWKKDALK, W.A., 2003. Watersbedscale assessment of nitrogen and pbospborus loadingsin the Indian River Lagoon basin, Florida. Journal ofEnvironmental Management, 67, 363-372.
SMAYDA, T.J., 1989. Primary production and tbe globalepidemic of pbytoplankton blooms in the sea: a link-age? In: CosFER, E.M., Bricelj. V.M.. and CARI'ENTKR,E.J. (eds.). Novel Phytoplankton Blooms. New York:Springer-Verlag, pp. 449-484.
SMITH, N.P., 1993. Tidal and non-tidal fiushing of Flor-ida's Indian River Lagoon. Estuaries, 16. 739-746.
VERITY, P.G., 2002. A decade of change in the SkidawayRiver Estuary. 1. Hydrography and nutrients. Estu-aries. 25, 944-960.
VERITY. P.G.; BLANTON, J.O.; AMFT, J.; BARANS, C ;KNO'n', D.; STENDER, B., and WFNNKR, E., 1998. In-fluences of physical oceanographic processes on chlo-rophyll distributions in coastal aod estuarine water.sof tbe Soutb Atlantic Bigbt. Journal Marine Research,56,681-711.
VoLLENWEiDER, R.A.. 1976. Advances in defining criti-cal loading levels of pbospborus in lake eutropbica-tion. Memorie detl'Istituto Italiano di Idrobiotogia, 33,53-83.
Journal of Coastal Research, Special Issue No. 45, 2004