a comparison of two methods op teaching the …/67531/metadc164553/m2/1/high... · a comparison of...
TRANSCRIPT

A COMPARISON OF TWO METHODS OP TEACHING THE
MANIPULATIVE SKILLS OP OFFICE MACHINES
APPROVED
Graduate Committee:
c v j P / ""J
Major Professor
Minor Professor
mittee Membe
Commljttee Member V-
Dean of the School of Education
Dean of thd Graduate School

McKenzie, Jimmy C., A Comparison of Two Methods of
Teaching the Manipulative Skills of Office Machines. Doctor
of Education (College Teaching), May, 1972, 103 pp.j 18
tables, 1 illustration, bibliography, 42 titles.
The problem with which this investigation is concerned
is that of comparing a learning systems approach to a lecture-
demonstration-rotation approach of teaching the manipulative
skills of office machines. Achievement, student use hours,
and attitude are the variables.
The study has four purposes: 1. to determine the
effectiveness of a learning systems approach as compared
to the effectiveness of a lecture-demonstration-rotation
approach to teaching the manipulative skills of office
machines on achievement of those skills; 2. to determine
the effectiveness of a learning systems approach as compared
to the effectiveness of a lecture-demonstration-rotation
approach on the attitude toward a course in office machines;
3. to analyze the difference in student use time for a
learning systems approach as compared to student use time
for a lecture-demonstration-rotation approach; and, 4.
to determine whether instructional exemption, or pretesting,
should be an element of a learning systems approach for
office machines.'
Data was gathered from the office machines classes on
two community college campuses. The experimental group
¥
1

consisted of four classes on one campus with a final
enrollment of sixty-seven. The control group consisted
of three classes on one campus with a final enrollment
of sixty-two.
The Otis Quick Scoring Mental Ability Test, Gamma
series, and a questionnaire were administered to the two
groups. The scores and information obtained from these
two sources were used to determine the similarity of the
two groups and for sub-grouping the two groups.
A t test was used to determine whether significant
differences existed between group and sub-group achievement
and student use time. A _z test was used to determine
whether significant differences existed between correlations
of attitude and achievement and between attitude and student
use time.
The findings of this study tended to support the
hypothesis and sub-hypotheses that the learning systems
approach will produce a significantly higher level of
achievement on office machines. The group using the
learning systems approach used significantly less time
for completion of the course, than did the group using the
lecture-demonstration-rotation approach. The findings
failed to support the hypothesis and sub-hypotheses that
the correlation between attitude and achievement scores
would be significantly higher for the group using the

learning systems approach. There was no significant
difference in student achievement for those with previous
training or experience on office machines and those with
no previous training or experience on office machines.
The following conclusions were drawn:
1. Achievement on office machines, especially for
the lower ability student, is significantly affected
favorably through the use of the learning systems approach
to instruction.
2. The self-pacing aspect of the learning systems
approach permits students to complete course requirements
in significantly less time without achievement being
adversely affected.
3. Previous training or experience on office machines
does not necessarily enable a student to achieve at a higher
level than a student with no previous training or experience
on office machines.
Recommendations for further studies and operating the
learning systems approach were also included.

A COMPARISON OP TWO METHODS OP TEACHING THE
MANIPULATIVE SKILLS OF OFFICE MACHINES
DISSERTATION
Presented to the Graduate Council of the
North Texas State University in Partial
Fulfillment of the Requirements
For the Degree of
DOCTOR OF EDUCATION
By
Jimmy C. McKenzie, B. S., M. Ed,
Denton, Texas
May, 1972

TABLE OP CONTENTS
Page
LIST OF TABLES V
LIST OF ILLUSTRATIONS viii
Chapter
I. INTRODUCTION 1 Statement of the Problem Purposes of the Study Hypotheses Significance of the Study Definition of Terms Delimitations Basic Assumptions
II. RELATED LITERATURE 12
Review of Related Research Review of Related Literature
III. PROCEDURES FOR COLLECTING AND TREATING DATA . 31
Setting of the Experiment Population of the Experiment Instructional Procedures Testing Procedures Analysis Procedures
IV. PRESENTATION AND ANALYSIS OF DATA . . . . . . 50
Equality of the Two Groups Achievement Classroom Use Time Attitude
V. SUMMARY, CONCLUSIONS, AND RECOMMENDATIONS . . 75
APPENDIX A 84
APPENDIX B 86
iii *

Page APPENDIX C 91
APPENDIX D 93
iv

LIST OF TABLES
Table
I.
II.
III.
IV.
V.
VI.
VII.
Response of Seven Panel Members Regarding Validity of Measuring Instruments . ,
Statistical Measures Relating to Group A and Group B Equality Based on Intelligence Test Scores ,
Statistical Measures Relating to Group A and Group B Achievement Test Scores
Statistical Measures Relating to Group A and Group B Achievement Test Scores when Sub-Grouped at or Above the Sixty-Seventh Percentile
Statistical Measures Relating to Group A and Group B Achievement Test Scores when Sub-Grouped Between the Thirty-Third and Sixty-Seventh Percentile
Statistical Measures Relating to Group A and Group B Achievement Test Scores when Sub-Grouped at or Below the Thirty-Third Percentile
Statistical Measures Relating to Group A and Group B Achievement Scores when Sub-Grouped into Those Who Had Previous Training or Experience on Office Machines
VIII. Statistical Measures Relating to Group A and Group B Achievement Scores when Sub-Grouped into Those Who Had No Previous Training or Experience on Office Machines
Page
42
51
53
5^
55
56
57
58

Table Page
IX. Statistical Measures Relating to Achievement Scores for Subjects Sub-Grouped According to Previous Training or Experience on Office Machines and No Previous Training or Experience on Office Machines 59
X. Statistical Measures Relating to Group A and Group B Total Classroom Use Hours . . 61
XI. Statistical Measures Relating to Group A and Group B Attitude and Achievement Test Score Correlations 64
XII. Statistical Measures Relating to Group A and Group B Attitude and Achievement Test Score Correlations when Sub-Grouped at or Above the Sixty-Seventh Percentile 66
XIII. Statistical Measures Relating to Group A and Group B Attitude and Achievement Test Score Correlations when Sub-Grouped Between the Sixty-Seventh Percentile and the Thirty-Third Percentile 67
XIV. Statistical Measures Relating to Group A and Group B Attitude and Achievement Test Score Correlations when Sub-Grouped at or Below the Thirty-Third Percentile 68
XV. Statistical Measures Relating to Group A and Group B Attitude and Achievement Test Score Correlations when Sub-Grouped into Those Who Had Previous Training or Experience on Office Machines 70
XVI. Statistical Measures Relating to Group A and Group B Attitude and Achievement Test Score Correlations when Sub-Grouped into Those Who Had No Previous Training or Experience on Office Machines 71
vi

Table Page
XVII. Statistical Measures Relating to Group A and Group B Attitude and Total Classroom Use Hours Correlations . . . . 73
XVIII. Statistical Measures Relating to Attitude and Achievement Score Correlations for Subjects Grouped According to Previous Training or Experience on Office Machines and No Previous Training or Experience on Office Machines 7^
vii

LIST OP ILLUSTRATIONS
Figure Page
1. Systems Model for Office Machines 34
viii

CHAPTER I
INTRODUCTION
A community junior college, by operating with an "open
door" philosophy, is faced with an immense task of meeting
the needs of students who have varied backgrounds and
different levels of achievement. The acceptance of this
responsibility, coupled with technological advances and
continually rising costs of operation, has resulted in
many innovative ideas, concepts, machines, and approaches
to instruction, contributed by both education and industry.
The instructor in the community college, as well as other
institutions, must analyze the new innovations and
approaches and use the best of them in the classroom. The
success and progress of the student is contingent upon how
correctly and imaginatively the instructor is able to ana-
lyze and apply the innovations and approaches.
One method currently receiving considerable emphasis
in education is a learning systems approach that enables
students to work individually and progress at their own
rates. Described by Place"'" as many components coordinated
^Irene Place, "Systems and Procedures Research in the Office," The Delta Pi Epsilon Journal, XII (November. 1969), 19. .

to enable a student or a group of students to orderly
achieve a goal or set of goals, a learning systems approach
appears to have wide applicability to many areas of
instruction.
Office and business education have utilized a systems
approach in a major curriculum study called New Office and
Business Education Learning System (NOBELS).^ The
influence of the NOBELS study, acceptance of the responsi-
bility for individualizing instruction, and availability
of materials and resources are resulting in attempts to
implement the systems approach into various business
education classrooms.
One of the basic necessities of a systems approach is
an efficient and effective method of presenting materials
when, and as often as, a student requires them. In a study
conducted by Edwards,^ filmloops were used to successfully
teach the skills of office machines. The removal of the
materials presentation barrier allowed the implementation
of the systems approach into the office machines classroom.
^Frank W. Lanham, A Planning Study to Determine the Feasibility of Developing a New Business and Office Education Curriculum, Moonshot—an Office Occupation Curriculum (Columbus, 1968).
^Ronald Kenneth Edwards, "An Experimental Study in the Teaching of Business Machines Utilizing an Audio-Visual-Tutorial Laboratory Approach with Continuous-Loop Sound Films," unpublished doctoral dissertation, College of Education, Michigan State University, 1969-

Statement of the Problem
The problem of this study was a comparison of a
learning systems approach to a lecture-demonstration-
rotation approach to teaching the manipulative skills of
office machines.
Purposes
A primary purpose of this study was to determine the
effectiveness of a learning systems approach as compared
to the effectiveness of a lecture-demonstration-rotation
approach to teaching the manipulative skills of office
machines on achievement of those skills as measured by
published office machines tests. A second purpose of this
study was to determine the effectiveness of a learning
systems approach as compared to the effectiveness of a
lecture-demonstration-rotation approach on the attitude
toward a course in office machines as measured by a semantic
differential. A third purpose was to analyze the difference
in student use time for a learning systems approach as
compared to student use time for a lecture-demonstration-
rotation approach. Another purpose was to determine whether
instructional exemption, or pretesting, should be an element
of the learning systems approach for office machines.
Hypotheses
The following hypotheses were tested in this study:
1. The meafi score on the achievement tests for the group

taught by the learning systems approach, hereafter referred
to as Group A, will be significantly higher than for the
group taught by the lecture-demonstration-rotation approach,
hereafter referred to as Group B.
2. The correlation between attitude and achievement test
scores will be significantly higher for Group A than for
Group B.
3. Sub-groups based on intelligence test scores will show
significant differences as follows:
(a) The mean score on the achievement tests for
Group A whose intelligence test scores are at or
above the sixty-seventh percentile will be signi-
ficantly higher than for Group B whose intelligence
test scores are at or above the sixty-seventh
percentile.
(b) The mean score on the achievement tests for
Group A whose intelligence test scores are between
the thirty-third and the sixty-seventh percentiles
will be significantly higher than for Group B whose
intelligence test scores are between the thirty-third
and the sixty-seventh percentiles.
(c) The mean score on the achievement tests for
Group A whose intelligence test scores are at or
below the thirty-third percentile will be signi-
cantly higher than for Group B whose intelligence

test scores are at or below the thirty-third
percentile.
(d) The correlation between attitude and achieve-
ment scores will be significantly higher for those
in Group A whose intelligence test scores are at
or above the sixty-seventh percentile than for
those in Group B whose intelligence test scores
are at or above the sixty-seventh percentile.
(e) The correlation between attitude and achieve-
ment scores will be significantly higher for those
in Group A whose intelligence test scores fall
between the thirty-third and the sixty-seventh
percentiles than for those in Group B whose intelli-
gence test scores fall between the thirty-third
and the sixty-seventh percentiles.
(f) The correlation between attitude and achieve-
ment scores will be significantly higher for those
in Group A whose Intelligence test scores are at
or below the thirty-third percentile than for those
in Group B whose intelligence" test scores are at
or below the thirty-third percentile.
Sub-groups based on previous training or experience and
no previous training or experience will show significant
differences as follows:

(a) The mean score on the achievement tests for
students in Group A who have had previous training
or experience will be significantly higher than
for students in Group B who have had previous
training or experience.
(b) The mean score on the achievement tests for
students in Group A who have had no previous training
or experience will be significantly higher than for
students in Group B who have had no previous training
or experience.
(c) The correlation between attitude and achieve-
ment scores will be significantly higher for those
in Group A who have had previous training or experi-
ence than for those in Group B who have had previous
training or experience.
(d) The correlation between attitude and achieve-
ment scores will be significantly higher for those
in Group A who have had no previous training or
experience than for those in Group B who have had
no previous training or experience.
5. The average hours of use time per student in Group A
will be significantly less than the average hours of use
time per student in Group B.
6. The correlation between attitude score and average hours
of use time per student will be an inverse relation and will
be significantly higher for Group A than for Group B.

7. The mean score on the achievement tests for students who
have had previous training or experience on office machines
will be significantly higher than for students who have had
no previous training or experience on office machines.
8. The correlation between attitude and achievement scores
will be significantly higher for students who have had
previous training or experience on office machines than
for students who have had no previous training or experi-
ence on office machines.
If there was not a minimum of twenty subjects in a
group or sub-group, that particular hypothesis was not
tested.
Significance of the Study
The "information explosion" has confronted the class-
room instructor with the problem of teaching more content
in less time. To effectively initiate this teaching, new
techniques are being developed and examined while past and
present methods and techniques are being re-examined.
The effectiveness of the traditional lecture-
demonstration-rotation approach to office machines
instruction has been questioned repeatedly. None of the
studies in office machines that compared the lecture-
demonstration-rotation approach to another approach have
found a significant difference favoring the lecture-
demonstration-rotation approach. The lock-step limitation

8
inherent in rotation precludes the allowance for individual
rates of learning. The limited mode of materials presen-
tation, lecture and demonstration, reduces time and freedom
for individual instruction as well as handicaps students
with differing styles of learning. In defense of the
lecture-demonstration-rotation approach, it is easy to
operate and does not require a large amount of time and
money to install.
Any approach that departs from tradition must receive
careful study and evaluation. This is the only way new
methodology can be successfully analyzed and revised so
that it may be used to improve the present teaching situa-
tion, not just maintain it.
One promising new approach to office machines instruction
is the learning systems approach. Study and evaluation must
be conducted to determine whether this approach effects a
higher level of achievement. There is no need to substitute
one partially successful approach for another. In addition,
there is a need to determine whether the learning rate and
materials presentation limitations peculiar to the lecture-
demonstration-rotation approach can be eliminated. There
is also a need for determining whether the classroom
instructor is able to function more efficiently in the
classroom.

Student attitude toward learning has long been recog-
nized as a major contributing factor to student success.
Study and evaluation need to be conducted to determine
whether either the lecture-demonstration-rotation approach
or the learning systems approach affects student attitude
more significantly than the other.
The questionable effectiveness of the traditional
lecture-demonstration-rotation approach, the potential
promise of the systems approach, and the necessity for
investigating student attitude toward both approaches
point out the need for a research study comparing the
two approaches.
Definition of Terms
Achievement refers to the composite raw score obtained
from three office machines achievement tests.
Attitude refers to the evaluative factor score obtained
by the semantic differential technique for the concept
"Office Machines."
Exemption Evaluation refers to the instructor's
assessment of the learner's readiness for a learning
activity.
Experience refers to the situation in which a student
has used daily or was currently using daily one or more of
the office machines included in this study on the job.

10
Formal Evaluation refers to the Instructor's assessment
of the learner's mastery of a learning activity.
In-Depth Study refers to optional activities that allow
the learner to apply learned skills to a problem-solving
situation.
Laboratory Use Time refers to the total amount of time
a student spent working in the classroom during classtime
and/or in the machines laboratory.
Learning Systems Approach refers to a combination of
components arranged so as to facilitate learning for an
individual.
Lecture-Demonstration-Rotation Approach refers to
instruction that is conveyed by lecture and demonstration.
The student progresses through required activities on a
fixed time basis.
Objectives refers to statements that present exactly
the conditions, outcomes, and skills needed to satisfac-
torily fulfill achievement requirements.
Optional Activities refers to diversified activities
that permit the learner to approach learning by an approach
different from the original one used.
Previous Training refers to the situation in which a
student was taught to use one or more of the machines
included in this study in a previous course in school.

11
Required Activities refers to specific activities
presented in a variety of ways in order to facilitate
learning.
Self Evaluation refers to the learner's assessment of
his own achievement of a learning activity.
Sub-Groups refers to the smaller groups resulting when
Group A and Group B were divided on the basis of intelligence
test scores and on the basis of previous or no previous
training or experience on office machines.
Support refers to contributions to the learning
situation that were made by media, software, and learning
packages.
Delimitations
This study included those students enrolled in office
machines classes on two community college campuses in the
Port Worth-Dallas metropolitan area during the fall semester,
1971. This delimitation provided control of related topics
studied by students in the respective classes.
Basic Assumptions
1. It was assumed that the students would respond
honestly and carefully to the instruments used for
measurement purposes.
2. It was assumed that the students would accurately
maintain laboratory use time records.

CHAPTER II
RELATED LITERATURE
Introduction
Research in office machines has been limited. While
most of the studies conducted have involved surveys of
businesses to determine what machines are used, a few
have investigated various approaches and techniques in
office machines instruction. Brief summaries of the
studies with factors similar to the factors in the present
study are given here.
Review of Related Research
The Corgan study.—A study was conducted by Corgan1
comparing the differences between the similar-processes
method and the rotation method of office machines
instruction. The prerequisites of the sample were advanced
typewriting and sophomore standing. The variables used in
the investigation were arithmetic diagnostic test scores,
grade-point average, and time. Achievement was measured
by a proficiency test.
^Virginia E. Corgan, "A Comparison of the Differences Between the Similar-Processes Method and the Rotation Method of Teaching Business Machines," unpublished doctoral dissertation, School of Business, The University of Nebraska, 1966. „ .
12

13
Although Corgan found no significant difference between
the two groups involved, the existing difference favored the
group using the traditional rotation approach. Corgan
concluded that, although the results were somewhat incon-
clusive, better results on proficiency tests could be
expected by using the rotation approach. She additionally
concluded that the best elements of the rotation and
similar-processes approach might produce the most effective
learning and teaching environment.
The study by Corgan was the only one reported that
indicated an advantage for the group using the rotation
approach. It leaves unanswered the question of whether
the traditional approach or some other approach is
superior. The combining of the best elements of the
two approaches represents one of the basic concepts of a
learning systems approach. Even though the present study
does not include the best elements of the similar-processes
method, it does include some of the best elements from
other approaches to office machines instruction.
The Walters study.—A study was conducted by Walters^
comparing the achievement between a group using audio-tape
instruction and a group using the traditional rotation
^George Kaufmann Walters, "The Effect of Taped Instruction in College Office Machines," unpublished doctoral dissertation, School of Education, Colorado State College, 1969.

11
approach. Walters planned and produced the audio-tapes
to present all machine instruction to the group in the
experimental situation. The control group proceeded
through the material in the traditional rotation approach.
He found no significant statistical difference at the
.05 level in achievement between the control group and the
experimental group. He did state that the experimental
group had a higher mean score or three of the four criterion
measures administered.
An informal questionnaire was used to determine the
attitude of the students toward the method. The response
was favorable. Self-pacing was the prominent reason given
for the preference of the experimental approach over the
control approach. He recommended that a teacher should
be available to give individual help and encouragement even
though instruction may be taped. He also recommended that
the students be allowed to move ahead at their own pace.
The study by Walters presented several factors similar
to the present study. Instruction from a source other than
the teacher was introduced. Interest in student attitude
was reported. Self-pacing was recommended as a possibility
for office machines. The teacher was also recognized as
contributing more to the office machines classroom than just
instruction. Although these factors were included in

15
Walters' study, there are still many unanswered questions.
Even though instruction was provided by a source other than
the teacher, results of achievement comparison between the
two groups were inconclusive. There are still many areas
of student attitude remaining to be explored. The recom-
mendations for using self-pacing and for keeping the
teacher in the classroom must be tried. All of these
factors are included in the present study.
The Edwards study .—The successful use of media in
teaching the operation of office machines has been reported
by Edwards.3 He utilized an audio-visual-tutorial approach,
with all instruction by eight-millimeter filmloop. An
experimental group worked at its own rate, using twenty-
two filmloops produced by Edwards. An assignment sheet
was given to each student at the time he received his film-
loop. The classroom and laboratory assistants were
available any time between 8 a.m. and 5 p.m. unless a
control class using the traditional approach was in session.
There were two control groups which met for fifty minutes
on Monday, Wednesday, and Friday of each week.
At the end of the semester, a test was given to each
group. The experimental group was found to have achieved
^Ronald K. Edwards, "An Experimental Study in the Teaching of Business Machines Utilizing an Audio-Visual-Tutorial Laboratory Approach with Continuous-Loop Sound Film," unpublished doctoral dissertation, College of Education, Michigan State University, 1969. .

16
at a significantly higher level (.025) than the control
group. The majority of the experimental group indicated
by informal questionnaire that they had a favorable
attitude toward the approach they used. Edwards did not
report the attitude of the control group. Edwards recom-
mended that an instructor should be available to confer
with the students during the day if problems should occur.
Many factors found in Edwards' study make it similar
to the present study. One of the major hindrances to
installing a learning systems approach is finding a
successful approach to materials presentation. The study
by Edwards has apparently provided a solution to the
materials presentation problem in office machines. There
are still many factors that remain to be explored. There
is a need to verify that the filmloop mode of materials
presentation functions satisfactorily in the learning
systems approach. There is a need to investigate other
areas of student attitude. Since both Walters and Edwards
recommended that the teacher remain in the classroom, an
instructional approach other than the traditional approach
should be tried, with a teacher present in the classroom.
Other studies.—Most of the remaining research surveyed
in office machines instruction compared achievement results

17
of instruction provided by some form or forms of media and
instruction provided by the teacher. Most of the studies
were at the master's level of work. Prominent among these
studies were those conducted by Beard1* and Colbert.^
Colbert built a slide-tape series to present office
machines not usually found in the classroom. The purpose
of the series was not to instruct her students in the
operation of various machines but to acquaint them with
the machines they would find in business.
Beard utilized taped instruction in teaching the
operations of a specific calculator. She found no signi-
ficant difference in achievement between the groups
involved.
The possibility of using slide-tape series in office
machines instruction was raised by the study conducted by
Colbert. The question of whether the use of slide-tape
series for purposes other than those in Colbert's study
should be answered. Materials presentation was
successful in that the experimental group attained as
^Brenda Beard, "Development and Evaluation of Taped Programmed Instruction in Seven Basic Operations of the Marchant Automatic Rotary Calculator," unpublished master's thesis, School of Business, University of Tennessee, 1965.
^Bette J. Colbert, "The Development of an Audio-Visual Presentation of Office Machines for Use in Classroom Instruction in Office Education," unpublished master's thesis, School of Business, University of Wisconsin, 1967.

18
well as the control group. The question of materials
presentation is still unanswered.
A review of related research illustrates the relevancy
of the learning systems approach to office machines
instruction. Previous office machines studies have provided
the basic groundwork for implementing a study of a learning
systems approach to office machines instruction. There
remains the need of investigating the effectiveness of the
learning systems approach in the office machines classroom.
Review of Related Literature
Described as a process for focusing on the totality of
a problem and the interrelationships of the parts as they
f)
relate to the whole, the operation of the systems approach
has been demonstrated by military, business, and government
while education has just begun to recognize its applica-
bility. As early as 1917, Erlang? used a form of the
systems approach to analyze complex problems connected
with an intricate telephone exchange system. The emer-
gence of the systems approach as it is recognized today
is more readily related to the military and the period
^Lloyd D. Doney, "A Systems Approach to Curriculum Development," Collegiate News and Views, XXIII (May, i970), 5. '
"^Thomas L. Seaty, Mathematics Methods of Operation Research (New York, 1959).

19
of time during and after World War II than to any other O
period of time. The systems approach, popularized by the
military, was developed by "professional teachers
/biologists, mathematicians, and physicists mobilized
from the classroom/ for professional fighters.
Churchman^ sites British anti-submarine warfare efforts
while Banathy"'""'" discusses planning and development of
combat aircraft as examples of the systems approach devel-
oped during World War II. Among the more emphatic demon-
strations of the successful application of the systems
approach is the development of the atomic bomb and the
aerospace projects being conducted by the National 12
Aeronautic and Space Administration.
Recognizing the success of the systems approach and
the existence of systems outside the realm of military,
industry was quick to apply the systems approach, then O C. West Churchman, The Systems Approach (New York,
1968), p. ix.
^John Pfeiffer, New Look at Education (New York, 1968), p. 16.
10 Churchman, o£. ci_t., p. vii.
11 Bela H. Banathy, Instructional Objectives (California
1968), p. 3.
•^Paul Saettler, A History of Instructional Technology (New York, 1968), p. 269.

20
known as operations research,^3 to various situations and
problems in which they had experienced difficulty. First
applications were connected with rather insignificant
problems concerning production, marketing, finance, and
transportation.^ With the advent of the computer and
the realization that enormous amounts of material could
be processed, the application of the systems approach
acquired a new use in industry. This is illustrated by
Bower and others^ when they contend that a successful
business information system contributes better services,
management, and provides a favorable environment for the
accomplishment of the goals and attitudes of the business.
Pfeiffer1^ adds to this by stating that the systems approach
in industry has rapidly evolved into a method of viewing
situations involving greater uncertainties, more complex
mixes, and objectives more difficult to define.
Possibly one of the most prominent exponents of the
systems approach in business, as well as in government,
is former Secretary of Defense, Robert McNamara. It was
^churchman, o£. cit., p. ix.
-*-̂ Ibid. , p. ix.
•^James B. Bower, Robert E. Schlosser, and Charles T. Zlatkovich, Financial Information Systems (Boston, 1969), p. 5.
•^Pfeiffer, o£. cit., p. 18.

21
during his administration that the application of the
systems approach filtered from the realm of industry to
the realm of government. In I960 the phase of a systems
approach known as program budgeting was used in making a
decision not to manufacture additional B-52 bombers and not
to produce a nuclear-powered B-70 bomber. The success of
the program budgeting phase and other subsequent procedures
involved in a systems approach has been so striking that
in 1965 the systems approach was established as a matter
of national policy.^
The evolvement of the systems approach into the realm
of education can be traced to the administrative area of
the school. In an attempt to interpret situations that
arise from the complexities of the world and to cope with
1 R
change,xo school administrators began utilizing the program
budgeting approach (commonly referred to as PPBS) of the
systems approach. With the advent of different methods of
teaching, a rising flood of innovation, the involvement
of big business in education, and a stronger demand for
economy, pressure of selection at both the administrative
and the classroom level has forced the administrator and
the classroom teacher to resort to an orderly way of viewing
•^Ibid. , pp. 18-26.
13 Banathy, ojd. cit., p. iii.

22
a s i t u a t i o n . A t present, the most promising approach
appears to be the systems approach. The procedure devel-
oped by "professional teachers for professional fighters"
has traveled a complete cycle and is now ready to be
applied to the classroom of its originator.
Basically, there are two types of systems recognized.
The algorithmic system is a precise, exact analysis in
operation.2® Careful planning and concrete decisions in
all phases concerning components are made before the system
is put into operation. There is no modification except
for an emergency. An example of the algorithmic system
is the space flight experiments currently being conducted.
The heuristic system is also carefully planned but is
based on a hunch about how to achieve a goal.2-'- It is
designed so that components may be inserted, withdrawn,
or modified at anytime during the operation of the system.
An example of the heuristic system is a learning system
as it is applied to the classroom.
Most learning systems in the classroom are comprised
of many components. The student, the teacher, and
19pfelffer, ojd. cit., pp. 10-12.
20Ibid., p. 33-
^Donald W. Meals, "Heuristic Models for Systems Planning," Phi Delta Kappan, XLVIII (January, 1967), 199-200.

23 pp
instructional materials are identified by Knirk and Childs
as the principal components of a learning system. Banathy2^
expands the component list by including the counselor,
facilities, and financial means. The foregoing does not
include a complete list of components but does provide
an idea of many components involved in systems planning.
In discussing the structure of a learning system,
p!|
Banathy states that four functions should be accomplished.
They are: selecting and assigning content, selecting and
organizing the learning activities, managing the learners,
and evaluating the learning while operating the system. 25
Popham and Baker have structured an empirical instruc-
tional model that specifies objectives, pre-assesses,
presents learning activities, and evaluates. Banathy2^
specifies that the structure of an educational system
should contain parts that formulate specific learning
objectives, measure the degree of prior attainment, identify
what is to be learned, select alternate learning activities,
22prederick G. Knirk and John W. Childs, Instructional Technology (New York, 1968), p. 43.
23Banathy, op_. cit. , p. 87.
2i}Ibid. , p. 56.
25w. James Popham and Eva L. Baker, Establishing Instructional Goals (New Jersey, 1970), p. 20.
2^Banathy, o£. cit. , pp. 29-30.

24
install the system, and evaluate the system. Most system
structures investigated tended to follow these suggestions
but did reflect the individual design of the person devising
the system. Knirk and Childs27 affirm this idea when they
state that ten different systems could be structured by
ten different teachers using only their voices and a
chalkboard.
In discussing the structure of a system, Banathy2®
emphasizes that specific objectives are selected according
to the purpose of a learning system being designed and
that the purpose of a learning system is learning.
According to Mager,29 a statement of objectives should
specify what task the learner is expected to be able to
do, how well he should be able to do it, and under what
conditions he should be able to do it.
The measurement of prior attainment is that part in
which the instructor determines what the students are
already capable of doing or already know. This is usually
determined by testing the students and then interpreting
the results.
27Knirk and Childs, 0£. cit., p. 43.
2^Banathy, o£. cit., p. 24.
29Robert F. Mager, Preparing Instructional Objectives (California, 1962), p. 10.
^Stuart Johnson and Rita B. Johnson, Developing Individualized Instructional Material (California. 1970). P- 29. *

25
In the selection of learning activities, the instructor
is responsible for organizing and providing selected alter-
natives in the presentation of the material to the
students.31 This is also correct in the arrangement and
utilization of media.3^> 33
If the students are unable to achieve the objectives
that have been specified, the system has not achieved its
purpose. This fact, along with the constant feedback
capabilities built into the systems approach, aids in the
evaluation and adjustment of the system.J
The systems approach is being recognized more and more
as an effective tool for instruction in the classroom.
Prominent among those who pioneered this approach is
Postlethwait.35 jn an effort to provide an opportunity
for his biology students to learn missed work, he developed
an audio-tutorial approach that emphasized learning and
placed responsibility on the students. He states that the
31Mager, ojd. cit., p. 10.
3^Arthur M. Cohen, "Multi-Media Instructional Program," UCLA Junior College Research Review, Vol. Ill (Jan., 1969).
33Robert M. Gagne, The Conditions of Learning (New York, 1965).
3^Banathy, 0£. cit., p. 24.
35s. N. Postlethwait, et_. al_. , An Integrated Experience Approach to Learning (Minneapolis, 1964). '

26
approach has evolved into a multi-faceted, multi-sensory
system that exposes the student to logically sequenced
material.
Office and business education utilized a systems
approach in 1966 in a national curriculum revision feasi-
bility study. The study was entitled New Office and
Business Education Learning System. Among the purposes
of the project were determining the need and feasibility
of a major curriculum revision, developing behaviorally
stated goals that are relevant to the office worker, and
developing a functional structure or model for curriculum
r e v i s i o n . T h e preliminary work of the study has now
been concluded and enactment of the findings and recom-
mendations are beginning to infiltrate the business
curriculum.
Lanham^? states that some of the immediate uses of
the implications are a re-examination and re-evaluation of
existing programs, behaviorally oriented material is now
available for business teacher preparation, and classroom
3^Calfrey C. Calhoun and Bobbye J. Wilson, "New Office and Business Education Learning System," Contributions of Research to Business Education, Ninth yearbook of the National Business Education Association, (Washington, D. C., 1971), p. 261.
W. Lanham, Development of Performance Goals for a New Office and Business Education Learning System "(Washington, D. C., 1970), pp. 53-54.

27
instructors have basic information for developing and
testing behaviorally oriented subject matter. Many of the
current research topics in office and business education
emphasize the acceptance and application of these impli-
cations .
The area currently demanding the most attention is
investigation and development of behaviorally oriented
objectives. In a task analysis study, Kelly3^ sought to
analyze the tasks performed by semiprofessional accountants.
Among the results was a rank-order list of accounting-
related tasks. Task analyses of this type represent the
basic step to be taken in formulating behavioral objectives.
In a similar study in accounting, Petro^ investigated the
derivation of learning hierarchies and instructional
objectives. Implications for developing instructional
systems were developed from his findings.
^Richard L. Kelly, "A Job Analysis of the Tasks of Selected Semiprofessional Accountants in New York State," unpublished doctoral dissertation, College of Education, The Pennsylvania State University, University Park, 1970.
^Peter k. Petro, "The Derivation of Learning Hier-archies and Instructional Objectives in Accounting with Implications for Developing Instructional Systems for Post-High School Programs," unpublished doctoral disser-tation, College of Education, Michigan State University, 1970.

28
Nelson*^ investigated the effect that specifically
stated objectives have on the achievement of students
registered in undergraduate economics. The students in
the experimental classes were provided with specific
objectives (the primary variable) at the beginning of each
week. He found that the students in the experimental group
achieved a significant statistical difference. In the
area of business teacher preparation, Weber**-'- developed
performance objectives for teacher coordinators in
occupational training programs.
To relate behavioral objective research with the
systems approach, Calhoun states that
the systems approach provides for consistent and continuing analyses and corrections as succeeding demonstrations provide measurable output in office occupational behavior of individuals involved in learning.^2
Kopstein points out in agreement that "in an instructional
^Dennis L. Nelson, "The Effect of Specifically Stated Instructional Objectives on the Achievement of Collegiate Undergraduate Economics Students," unpub-lished doctoral dissertation, College of Education, University of Minnesota, 1970.
^•Edwin J. Weber, "The Development of Performance Objectives for Teacher-Coordinators of Cooperative Occupational Training Programs," unpublished doctoral dissertation, College of Education, The University of Michigan, 1970.
h 7 Calfrey C. Calhoun, "The Emerging New Business
Education (Introduction)," National Business Education Quarterly, XXXVI (Spring, 1968), 5-6.

29
system, the sole matter of relevance is the . . . specific
performance capabilities of a student."^3
Even though current research topics are concerned with
the basic elements of learning systems design (task
analysis, behavioral objectives) and considerable previous
research, as well as current research, has been conducted
involving various components of a learning systems approach
(media, instructor, student), very little research exists
that involves a complete learning systems approach. The
lack of current research involving the systems approach
in the area of business education does not mean its
importance has been overlooked. Calhoun1*^ states that
the systems approach is peculiarly relevant to business
education.
Johnston1^ analyzed data related to instructional
practices in collegiate schools of business. He proposed
to use this analysis in the development of an instruc-
tional system for collegiate business education. Team
^Felix P. Kopstein, "Product or System Research as Applied to Education for Business," National Business Education Quarterly, XXXVII (Spring, 1969), 11-12.
44 Calhoun, ojd. cit., p. 46.
^Russell A. Johnston, "Selected Instructional Practices in Collegiate Schools of Business and Their Use in a Proposed Systems Approach," independent research study, Department of Business Administration and Management, Virginia Commonwealth University, 1967.

30
teaching, student grouping, teacher assistants, programmed
instruction, television, mul^iple-channel-listening
equipment, and simulation were investigated. He concluded
that substantial use was being made of the selected
instructional practices, but little thought was being
given to each of their functions as a component in a
systems approach. He further concluded that the class-
room and classroom activities would differ in that there
would not be the traditional lecture by the instructor
other than when it was considered the best component.
He also emphasized that the systems approach must be
based upon the needs of the student, content, and curri-
cula; not space, arrangement, and facilities.
The remaining research surveyed in business education
dealing with a systems approach was not concerned with
the instructional level.

CHAPTER III
PROCEDURES FOR COLLECTING AND TREATING THE DATA
This experiment was designed to compare the achievement
results for subjects who were using a learning systems
approach and subjects who were using the traditional
lecture-demonstration-rotation approach. It is essential
that the design of the study be understood so that the
procedures, findings, and conclusions can be correctly
interpreted.
Setting of the Experiment
The study was conducted in the day office machines
classes (7 a.m. to 5 p.m.) on two community college campuses
in the Fort Worth-Dallas, Texas, metropolitan area during
the fall semester, 1971. The two campuses selected are
referred to as Campus A and Campus B. Campus A was selected
because the administration granted permission to develop
and install the learning systems approach in the office
machines course taught on Campus A. Support of the project
(release time from class instruction, paying for the
development of software, purchasing of hardware) was also
provided by the administration of Campus A. Campus B
was selected because the lecture-demonstration-rotation
¥
31

32
approach was utilized at that campus. Other factors
influencing the selection of Campus B were similarities
to Campus A in philosophy of student admission, simi-
larities in related topics studied and materials used
in office machines, similarities in types of machines
taught in office machines, and similarities in the amount
of time required in the office machines classroom.
Population of the Experiment
The population of the experiment consisted of those
students enrolled in the office machines courses taught on
Campus A and Campus B during the fall semester, 1971. All
students enrolled in office machines on Campus A used the
learning systems approach and were placed in Group A.
There were four classes assigned to two instructors with a
total enrollment of sixty-two students. All students
enrolled in office machines on Campus B used the lecture-
demonstration-rotation approach and were placed in Group B.
There were three classes assigned to one instructor with
a total enrollment of sixty-seven students. Instructors
for all class sections were appointed in the customary
manner by the chairmen of the departments involved.
Instructional Procedures
The office machines courses on Campus A and Campus B
required instruction on the ten-key adding machine, the

33
ten-key printing calculator, and the ten-key electronic
calculator. The two groups used the same textbook for
classroom practice. The tests coordinated with the text-
book were used for evaluation of achievement.
Learning Systems Approach
Building materials.—The primary purpose of an office
machines course is to develop a marketable skill on office
machines. The learning system for Group A (see Figure 1,
page 3*0 was designed and organized around this purpose.
Learning packages, one for each machine, were the basic
means of guiding instruction. Within each package, small
instructional segments specified objectives, listed required
activities, reinforced learning, and provided opportunities
for self evaluation.
Slide-tape series, one for each machine, were developed
to supplement the learning packages in areas such as machine
introduction. Machine parts and their uses were especially
emphasized in these series.
Eight-millimeter filmloops, four for each machine,
were developed to demonstrate machine manipulation and
correct psycho-motor movement. The cartridges containing
the filmloops limited instructional time for each cartridge
to five minutes. Each filmloop was coordinated with a
particular segment from one of the packages.

Exemption
Evaluation
and/or
No atisfactor
Yes
No Satisfactor
Yes In-Depth j
Study | Or
Instructor
Evaluation
Formal
Activities
Optional
Evaluation
Self
Support
Purpose
Obj ectives
Activities
Required
34
Pig. 1"*-The systems model for Office Machines

35
Practice problems designed to enable a student to
develop speed and accuracy were taken from the textbook,
Office Machines Course,-*- which was a required textbook
for the course on both campuses. All ten lessons for
each machine were worked by both groups.
The two office machines instructors on Campus A
designed and produced the filmloops utilized in this
experiment. The following steps were involved in the
development of these filmloops. The instructors discussed
and decided which concepts should be placed on the film-
loops. They then determined how many filmloops would be
needed to present the concepts. By analyzing the concepts
to be presented by filmloop, they determined that sixteen
filmloops would be needed to present the instruction
necessary to complete the packages. Eight filmloops were
needed for the ten-key printing calculator because of the
wide variation in operational controls on the two brands
of machines on Campus A.
The next step was to design and write the scripts for
each filmloop. For this step, the instructors divided the
script responsibilities. Each instructor planned what was
to be placed on each filmloop and then prepared the preli-
minary script. After each script was written, both
•^Nicholas J. Cornelia, William R. Pasewark, and Peter L. Agnew, Office Machines Course, *Jth ed. (Cincinnati, 1971).

36
instructors studied the script and made any changes they
agreed would be better. Since instructional time was
limited to five minutes for each filmloop, the instructors
made a final review of each portion of the script for each
filmloop. They made any additional changes necessary to
keep all filmloops within the five minute time limit.
The script was then typed in final form and prepared
for filming. The Media Department of the Learning Resources
Center on Campus A became involved in the project at this
point. A professional photographer employed by Campus A
filmed the instructors at the office machine for each
portion of the planned script. Sixteen-millimeter film
was used. After the film was developed, the photographer
carefully cut and spliced it so that the exact number of
seconds needed for each portion was contained in the film.
After a final review by the instructors, the film was sent
to a company selected to produce the black and white working
copy.
When the working copy was returned, the audio portion
was recorded for the film. In recording the audio portion,
the instructors used a soundproof booth on Campus A. While
the working copy was being shown, one of the instructors
would read the script and a recording of the audio portion
was made so that it could be synchronized with its portion
of the filmloop. The film and audio tape were placed on a ¥

37
Siemens projector. Each portion of the film was shown and
marked as each portion of the audio tape was played and
marked. Final editing and syncing of the picture and
sound track was made.
Both of the copies were then sent to the company
selected to cartridge the filmloops. The films were
reduced from sixteen-millimeter to eight-millimeter; the
sound stripe was attached; and, the final filmloop was
inserted into the cartridge.
Orientation and teaching.—Orientation, including
familiarization with the learning packages, operation
and care of the multi-media and software, and explanation
of the model for the systems approach to be used in this
study, was accomplished during the first week of the
semester. During the orientation, the students were told
that the classroom would be open a minimum of eight hours
a day. They were also told that an instructor would be
available for two hours a day to help with special diffi-
culties and evaluation. A paraprofessional would be
available the remainder of the time. The students were not
required to meet a specified class session beyond the first
week but were required to spend a minimum of three hours a
week in the machines room until course requirements were
finished. A record of attendance and time spent working
in the classroom was maintained by the student.

38
The first section of the package described the purpose
of the packages. The students were given specific objectives
for each segment in the learning package. They were aiso
given specific instructions and problems to work in the
required activities segment. A self-check was written
into the material in the textbook. As each student
completed the required activities, he was given an oppor-
tunity to take a self-evaluation post-test that had been
written into the package. This was different from the
self-check in the textbook. The post-test provided an
opportunity for the student to evaluate his progress in
a particular segment. If his progress did not meet the
standards that had been specified in the objectives, he
conferred with the instructor and was then directed to
repeat portions of the required activities.
When the student had completed all segments of the
learning package, he and the instructor set a time for
the student to take an examination covering the material
in the package. This examination was the one used for
measurement of achievement in this study.
The proposed segment entitled Exemption Evaluation
was not a part of the system for this study. This compo-
nent will be included or deleted from the model on the
basis of the findings connected with the hypotheses
concerning the achievement of students with previous

39
training or experience and students with no previous
training or experience.
The In-Depth segment will eventually become a part
of the system, but was not a part during the semester
this study was conducted.
Lecture-Demonstration-Rotation
In the approach used on Campus B, instruction was
conducted in large group demonstrations, in small group
demonstrations, and by individual demonstrations. Students
were assigned the same practice problems from the textbook
required for the course, which was the same as the textbook
used on Campus A. A self-check was written into the
textbook material. The students were to complete the jobs
in the time allowed them in a fixed rotation cycle. There
was equal time alloted in the rotation cycle for each
machine. Class attendance was compulsory. Students could
make up class absences, but were not required to. A
record of class attendance was maintained by the instructor;
therefore, the students on Campus B were required to
record only laboratory use time outside the regular class
time. The instructor's record of attendance and the
student's record of laboratory use time were combined
for total use time.
Upon completion of a cycle on each machine, the
student took an examination covering the material studied.

40
This examination was the one used for measurement of
achievement m^tiiis study.
1 Testing Procedures
Achievement
The instruments used for measurement of achievement i
were three tests}, one for each machine, that were coordi-
nated with the t
to use the tests
Course, Fourth E
was requested an
extbook used on both campuses. Permission
accompanying the book, Office Machines
dition, by Cornelia, Pasewark, and Agnew,
d granted (see Appendix A). Correspon-
dence with the authors determined that neither validity
nor reliability had been established for the tests;
however, there were established norms and suggested
grading scales.
In order to establish reliability for the tests, all
three tests were administered to thirty students on Campus A
during the spring semester, 1970. Two weeks later, the
tests were readministered to the same students. Pearson
Product-Moment Correlation Coefficients were determined for
each of the three tests. The correlation coefficient for
the Ten-Key Adding Machine, Test 2, was .78; for the Ten-
Key Printing Calculator, Test 4, the correlation coeffi-
cient was .95; and for the Ten-Key Electronic Calculator,
Test 5, the correlation coefficient was .84.

41
To establish validity, the tests were submitted to
a panel of seven judges composed of the following: two
senior high school teachers, three community college
instructors, and two university professors. All seven
were business education teachers with teaching experience
ranging from at least five years to more than forty years.
All held a minimum of a master's level degree and all
were members of Delta Pi Epsilon, an honorary business
education fraternity.
Each of the panel members was sent an explanatory
letter and response forms (see Appendix B), a copy of
all three tests, and a return envelope. They were asked
to check whether they thought the tests could adequately
determine whether a student could perform machine manipu-
lations involving addition, subtraction, multiplication,
and division on a particular machine. Room was also
provided for additional comment although comment was not
asked for. The tests were to be accepted as valid
instruments if five of the seven panel members responded
in the affirmative.
All seven panel members returned the response forms
after the first mailing. Their responses are summarized
in Table I.
Since each of the three tests received more than the
designated five votes necessary, each test was accepted
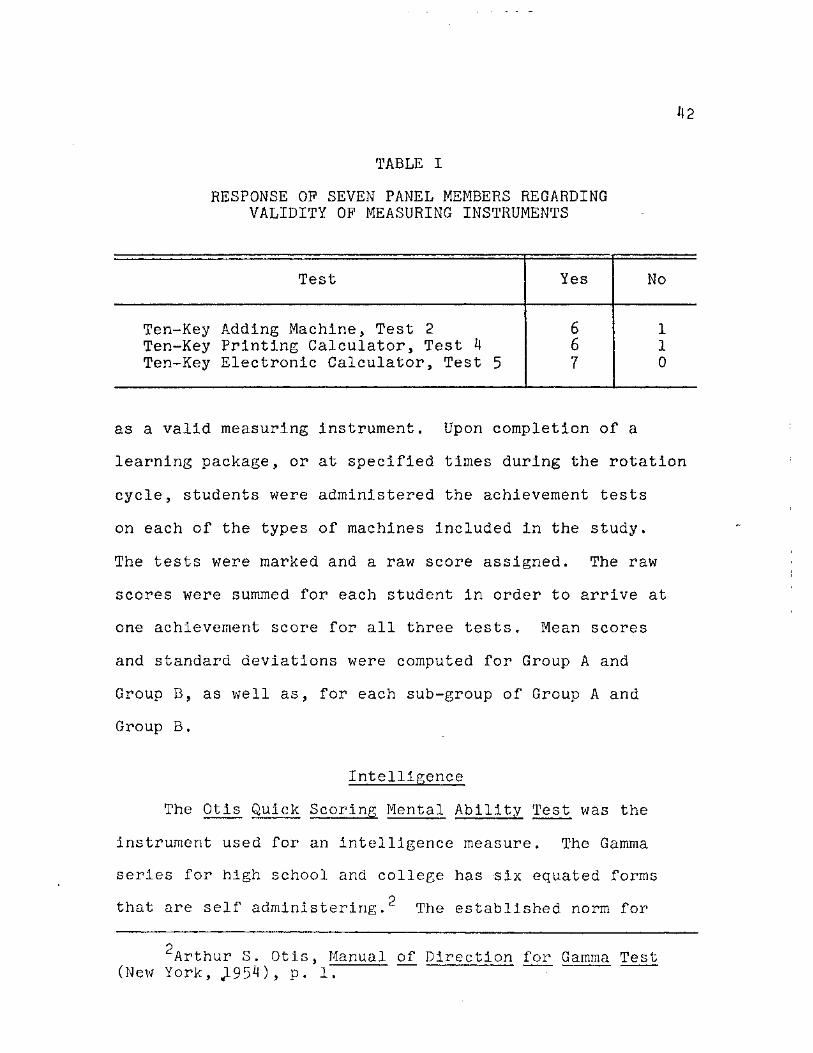
TABLE I
RESPONSE OP SEVEN PANEL MEMBERS REGARDING VALIDITY OP MEASURING INSTRUMENTS
42
Test Yes No
Ten--Key Adding Machine, Test 2 6 1 Ten--Key Printing Calculator, Test 4 6 1 Ten--Key Electronic Calculator, Test 5 7 0
as a valid measuring instrument. Upon completion of a
learning package, or at specified times during the rotation
cycle, students were administered the achievement tests
on each of the types of machines included in the study.
The tests were marked and a raw score assigned. The raw
scores were summed for each student in order to arrive at
one achievement score for all three tests. Mean scores
and standard deviations were computed for Group A and
Group B, as well as, for each sub-group of Group A and
Group B.
Intelligence
The Otis Quick Scoring Mental Ability Test was the
instrument used for an intelligence measure. The Gamma
series for high .school and college has six equated forms
that are self administering.2 The established norm for
Arthur S. Otis, Manual of Direction for Gamma Test (New York, JL954), p. l".

^3
adults Is a score of H2.3 Established reliability coeffi-
cients ranging from .88 to .92 have been obtained on the
ii
various forms. The mean validity index of the test items
in each form is approximately .50. One of the suggested
applications of the test is to obtain two or more groups
of equal mental ability for research purposes.
To elicit further information required by the
hypotheses, the Otis Quick Scoring Mental Ability Test,
Gamma series, was administered during the week of the
twelfth class day. The scores obtained from the Otis
Quick Scoring Mental Ability Test were subjected to a
;t test to check the equality of the two groups involved
in the study. Additionally, the scores were used to
sub-group the students for further analysis.
Attitude
The instrument used to measure attitude toward office
machines was Osgood's Form II format of the semantic
differential technique.^ Osgood developed the semantic
^Ibid., p. 4.
^Ibid., pp. 5-6.
^Ibid., p. 6.
^Ibid. , p. 6.
"̂ Charles E. Osgood, George J. Suci, and Percy H. Tannenbaum, The Measurement of Meaning (Urbana, Illinois, 1957).

differential technique to objectively measure connotative
meanings of concepts. Each semantic scale is defined by
a pair of polar adjectives that are separated by seven
points. The ratings of the subjects are projected as
points into what Osgood calls "semantic space." A sample
of these spaces is assumed to represent a multi-dimensional
8
space.
In this study, there were twenty scales for each
concept. Fourteen were evaluative, three potency, and
three active. No standard scales or concepts have been
developed for the semantic differential; therefore, they
are selected according to the purpose of the research.9
Osgood states that "an instrument is valid to the
extent that scores on it correlate with scores on some
criterion of that which is supposed to be measured.
He adds that the semantic differential is an instrument
that purportedly measures meaning. Since no commonly
accepted independent criterion of meaning is known, validity
of the semantic differential has to be based on face
validity or those concepts that people would probably
cluster together upon administration of the instrument.
8Ibid., p. 25.
9Ibid. , p. 25.
10Ibid. , p. 140.
n I b i d v p. lHO-Hll.

^5
The concepts judged were "Course," "Instruction,"
and "Usefulness" as they were related to "Office Machines."
The scales and polarity of the adjectives were randomly
placed in an effort to counteract bias tendencies (see
Appendix D).
The reproducibility of scores through a test-retest
procedure is considered the proper approach to establish
reliability.'1-2 Therefore, to establish reliability, the
semantic differential form used in this study was admin-
istered to thirty students registered in the day classes
of office machines on Campus A during the spring semester,
1971. A week later, the instrument, with the order of
concepts, scales, and descriptive adjectives randomly
changed, was readministered. A Pearson Product-Moment
Correlation Coefficient of .80 was computed. Average
difference between scale positions was obtained for the
two test administrations. The adjective pairs with the
highest average difference were "low-high" for the concept
"Course" and "lenient-severe" on the concept "Usefulness."
The average difference for those two adjective pairs was
1.27 scale positions. The adjective pair with the lowest
average difference was "meaningful-meaningless" as it
relates to "Usefulness." The average difference was
.^3 scale positions.
12Ibid., p. 127.

46
Attitude scores for this study were determined from
results of the semantic differential in the following
manner:
1. Each scale position of the semantic differential form
was assigned a value of "1" for the unfavorable pole to
"7" for the most favorable position. A neutral attitude
was assigned a value of "4."
2. For use in the computer, raw scores for each scale
were converted to z_ scores.
3. A Pearson Product-Moment Correlation Coefficient for
£ scores was calculated, yielding a correlation matrix
for every scale with every other scale.
4. The intercorrelation matrix was subjected to a principle
axis factor analysis followed by a varimax rotation.
5. Scores of the fourteen evaluative scales were recog-
nized as measures of attitude.
6. A factor score was derived with multiple regression
techniques using evaluative scores as the criterion.
7. The mean and standard deviation was computed for each
adjective pair loaded on the evaluative factor.
Analysis Procedures
The research design utilized for this study was the
Postest-Only Control Group Design illustrated by Campbell

47
and Stanley-^ as
R X
R 02.
This design is purported to control history,
maturation, testing, instrumentation, regression,
selection, mortality, and interaction. The involvement
of two separate campuses, two different teaching methods,
and different instructors made it impossible to meet
all requirements for the above seven factors which resulted
in variations from the "pure" design as presented by
Campbell and Stanley.
Intrasession history was affected since more than
one instructor, one time of day, and one combination of
days of the week were involved. Maturation and testing
were somewhat affected because of the variation in time,
since self-pacing was used in Group A and a fixed rotation
schedule was used in Group B. The alteration in intra-
session history did not affect instrumentation since fixed
instruments were used for measurement. The remainder of
the seven factors did not appear to be altered by the
special circumstances involved in this study.
In this study, the null hypotheses were rejected at
the .05 level of significance. The following statistical
•^Donald T. Campbell and Julian C. Stanley Experimental and Quasi-Experimental Designs for Research (Chicago, 196377 p. lF.

J48
methods were used to analyze the data:
1. The t_ test was used to determine the significance
of the difference in measurement of achievement and time
(Hypotheses 1, 3a, 3b, 3c, 4a, 4b, 5, and 7).
2. The relationship of attitude and achievement (Hypotheses
2, 3d, 3e, 3f, 4c, 4d, and 8) and of attitude and average
hours (Hypothesis 6) was determined in the following
manner:
(a) Pearson Product-Moment Correlation Coefficients were
calculated for the relationships between attitude and
achievement and attitude and average hours. Correlation
coefficients were calculated separately for Group A,
Group B, and the sub-groups.
(b) The significance of the difference between Group A
and Group B or between sub-group subjects for the correlation
coefficients was determined by using the z test for finding
the significance of the difference between correlation
coefficients. The r's were changed into Fisher's z
1 M
function by the use of the appropriate table.
The standard error of the difference between the two
z/s was determined by the following procedure:
l^Henry E. Garrett, Statistics in Psychology and Education (New York, 1967), p. 4o6.

49
1 1 SEz = / +
Ni~3 N2-3 •
The value of z was then determined by the following
equation:
Z1 " z 2 £ = SE
z
The significance of z_ was determined by consulting
the appropriate table.
The results of the statistical treatment are reported
in detail in Chapter IV.

CHAPTER IV
PRESENTATION AND ANALYSIS OF DATA
Introduction
The analysis which was employed in this study was
divided into four major parts. The first part dealt with
the degree of equality between the two groups involved.
The second part dealt with a comparison of achievement
between the two groups and various sub-groups. The third
part dealt with a comparison of classroom use time between
the two groups. The fourth part dealt with a comparison
of correlations between student attitude and achievement;
between student attitude and total use time. All
hypotheses were tested in the null form.
Equality of the Two Groups
Two criteria were used to determine how equal or
similar Group A and Group B subjects were at the beginning
of the experimental procedure. These criteria were intelli-
gence test scores and a numerical comparison of subjects
in each group who had previous training or experience
on office machines.
During the week of the twelfth class day of the fall
semester, 1971, the two groups were administered the Otis
50

51
Quick Scoring Mental Ability Test. A t_ test comparison
was performed on the scores obtained from the adminis-
tration to determine the degree of equality between the
two groups. Statistical measures relating to the Otis
Quick Scoring Mental Ability Test scores are presented
in Table II.
TABLE II
STATISTICAL MEASURES RELATING TO GROUP A AND GROUP B EQUALITY BASED ON INTELLIGENCE TEST SCORES
Group Mean SD N t LS
A 44.66 9.42 62 .88 NS
B 43.07 10.91 67
The obtained t_ of .88 between the means of the two
groups was found not to be significant at the .05 level;
therefore, the groups were considered to be not signifi-
cantly different on the intelligence test criterion.
At the same class meeting in which the intelligence
test was administered, a student questionnaire (see Appendix
C) was also administered. The data obtained from this
questionnaire were used to determine which of the subjects
within each group had previous training or experience and
which had no previous training or experience on office
machines.

52
A preselected tolerance of four between Group A and
Group B subjects who had previous training or experience
on office machines had been designated as the acceptable
limits. Group A had twenty-five subjects with previous
training or experience on office machines while Group B
had twenty-three subjects. The variation of two was
within the prescribed limits; therefore, the groups were
considered to be similar on the previous training or
experience criterion.
Achievement
It was hypothesized that the mean of Group A achievement
scores would be significantly higher than that of Group B
achievement scores. The instruments used for measurement
of achievement were three office machines tests, one for
each machine used in this study. The tests were coordinated
with the textbook used by both groups. Reliability and
validity of the three instruments had been determined as
a part of this study. Upon completion of a learning
package, or at specified times during a rotation cycle,
students were administered the achievement test on the
machine they were working with. The tests were marked
and the correct number of answers determined. One final
achievement score for each student was obtained by summing
the raw scores on the tests. A mean score and a standard

53
deviation were computed for each of the groups. A t test
was used to determine whether a significant difference
between the two groups existed on this variable. Statistical
measures relating to achievement test scores for Group A
and Group B are presented in Table III.
TABLE III
STATISTICAL MEASURES RELATING TO GROUP A AND GROUP B ACHIEVEMENT TEST SCORES
Group Mean SD N t LS
A 75.53 4.18 62 k.ho >.001
B 67.94 12.02 67 >.001
An examination of the information presented in Table III
indicates that the t_ of 4.40 between the means of the groups
is significant at greater than the .001 level. The
indicated difference was in favor of Group A. Based upon
this evidencej the null hypothesis was rejected and research
hypothesis 1 was accepted.
The intelligence test scores obtained from the Otis
Quick Scoring Mental Ability Test were used to sub-group
Group A and Group B subjects for further analysis. It was
hypothesized that Group A sub-group achievement scores
would be significantly higher than Group B sub-group
achievement scores. The sub-groups were based on the

5^
following divisions. Those subjects whose intelligence
test scores were at or above the sixty-seventh percentile
were placed in one sub-group. The subjects whose scores
were between the sixty-seventh and the thirty-third
percentile were placed in another sub-group. The last
sub-group was those subjects whose scores were at or
below the thirty-third percentile. A mean score and a
standard deviation were computed for each of the sub-
groups. A t test was used to determine whether a signi-
ficant difference existed between the Group A sub-groups
and the Group B sub-groups on this variable.
Statistical measures relating to achievement test
scores for Group A and Group B sub-group subjects whose
intelligence test scores were at or above the sixty-seventh
percentile are presented in Table IV.
TABLE IV
STATISTICAL MEASURES RELATING TO GROUP A AND GROUP B ACHIEVEMENT TEST SCORES WHEN SUB-GROUPED AT
OR ABOVE THE SIXTY-SEVENTH PERCENTILE
Group Mean SD N t LS
A 77.15 2.66 20 1.72 NS
B 74.27 7.03 22

55
An examination of the information presented in Table IV
indicates that the t of 1.72 between the means of the sub-
groups is not significant at the .05 level. Based upon
this evidence, the null hypothesis was retained and research
hypothesis 4a was rejected.
Statistical measures relating to achievement test
scores for Group A and Group B sub-group subjects whose
intelligence test scores were between the sixty-seventh
percentile and the thirty-third percentile are presented
in Table V.
TABLE V '
STATISTICAL MEASURES RELATING TO GROUP A AND GROUP B ACHIEVEMENT TEST SCORES WHEN SUB-GROUPED BETWEEN
THE THIRTY-THIRD AND SIXTY-SEVENTH PERCENTILE
Group Mean SD N t LS
A 75.10 4.91 21 1.72 NS
B 71.50 8.15 22
An examination of the information presented in Table V
indicates that the t of 1.72 between the means of the sub-
groups is not significant at the .05 level. Based on this
result, the null hypothesis was retained and research
hypothesis 4b was rejected.

56
Statistical measures relating to achievement test
scores for Group A and Group B sub-group subjects whose
intelligence test scores were at or below the thirty-
third percentile are presented in Table VI.
TABLE VI
STATISTICAL MEASURES RELATING TO GROUP A AND GROUP B ACHIEVEMENT TEST SCORES WHEN SUB-GROUPED AT OR
BELOW THE THIRTY-THIRD PERCENTILE
Group Mean SD N t LS
A 74. ̂ 3 4.27 21 5.28 >.001
B 58.43 13.24 23 >.001
An examination of the information presented in Table VI
indicates that the t. of 5.28 between the means of the sub-
groups is significant at greater than the .001 level. The
indicated difference was in favor of Group A. Based upon
this evidence, the null hypothesis was rejected and research
hypothesis 4c was accepted.
An additional sub-group analysis of achievement
scores was conducted. Information obtained from the
student questionnaire administered at the same time as
the Otis Quick Scoring Mental Ability Test was used in
identifying those subjects who had previous training or
experience on office machines and those subjects who had

57
no previous training or experience on office machines.
Group A and Group B subjects were then sub-grouped into
the two catagories. It was hypothesized that the Group A
sub-group subjects would achieve at a significantly higher
level than the Group B sub-group subjects. Again, a t
test was used to determine whether a significant difference
existed between the Group A sub-groups and the Group B
sub-groups on this variable.
Statistical measures relating to achievement scores
for Group A and Group B sub-group subjects who had previous
training or experience on office machines are presented in
Table VII.
TABLE VII
STATISTICAL MEASURES RELATING TO GROUP A AND GROUP B ACHIEVEMENT SCORES WHEN SUB-GROUPED INTO THOSE
WHO HAD PREVIOUS TRAINING OR EXPERIENCE ON OFFICE MACHINES
Group Mean SD N t LS
A 76.68 3.06 25 3.01 >.01
B 70.04 10.55 23
The t_ of 3.01 between the means of the sub-groups is
significant at greater than the .01 level. The indicated
difference was in favor of Group A. Based on this result,

58
the null hypothesis was rejected and research hypothesis
4a was accepted.
Statistical measures relating to achievement scores
for Group A and Group B sub-group subjects who had no
previous training or experience on office machines are
presented in Table VIII.
TABLE VIII
STATISTICAL MEASURES RELATING TO GROUP A AND GROUP B ACHIEVEMENT SCORES WHEN SUB-GROUPED INTO THOSE
WHO HAD NO PREVIOUS TRAINING OR EXPERIENCE ON OFFICE MACHINES
Group Mean SD N t LS
A 7^.76 4.66 37 3.59 >.01
B 66.84
,
12.70 44 >.01
The obtained t of 3.59 is significant at greater than
the .01 level. Again, the indicated difference favored
Group A. The null hypothesis was, therefore, rejected and
research hypothesis 4b was accepted.
The final analysis of achievement scores did not
include the approach to instruction as a factor of division,
The subjects were grouped into those who had previous
training or experience and those who had no previous
training or experience. Information resulting from this
comparison was used in determining whether to include the

59
Exemption Evaluation, or pretest, phase as a part of the
systems approach in office machines. It was hypothesized
that the achievement scores for the group who had previous
training or experience on office machines would be signi-
ficantly higher than the achievement scores for the group
who had no previous training or experience on office
machines. A t_ test was used to determine whether a signi-
ficant difference existed between the two groups.
Statistical measures relating to achievement scores
for those who had previous training or experience on
office machines and those who had no previous training or
experience on office machines are presented in Table IX.
TABLE IX
STATISTICAL MEASURES RELATING TO ACHIEVEMENT SCORES FOR SUBJECTS SUB-GROUPED ACCORDING TO PREVIOUS TRAINING OR EXPERIENCE ON OFFICE MACHINES AND NO PREVIOUS
TRAINING OR EXPERIENCE ON OFFICE MACHINES
Group Mean SD N t LS
Previous 73.50 10.59 48 1.71 NS
No Previous 70.46 8.25 81
The t of 1.71 Indicates no significant difference
between the two groups at the .05 level. Based on this
result, the null hypothesis was retained and research
hypothesis JJ was rejected.

60
Classroom Use Time
It was hypothesized that the student use time for
Group A would be significantly less than the student use
time for Group B. To obtain data to test this hypothesis,
a laboratory use notebook was designed for each campus.
There was a separate section within each notebook for
each of the classes involved on each campus in the
experiment. Each student had a time sheet that was placed
in alphabetical order in his respective class section.
Campus A used self-pacing; therefore, it was necessary
for each student to maintain a record of all the time spent
in the classroom. At the end of each week, the time each
student spent in the classroom was recorded to the nearest
one-fourth hour on a master time card. As the student
completed course requirements, the time he spent working
in the classroom was totaled. To conform to actual school
hours, the time was rounded to the nearest hour.
Campus B used a rotation cycle which made class
attendance compulsory. A record of class attendance was
maintained by the instructor; therefore, the students on
Campus B were required to maintain use time only for the
time spent in the classroom other than at the regular
class hour. If a student finished the requirements for
the rotation cycle before the scheduled completion date,
he was excused from class. These excused classes were

6l
deducted from the total hours the same as class absences
when total classroom use time was determined. To obtain
total classroom use time, the record maintained by the
student was combined with the teacher's attendance record.
The total was then rounded to the nearest hour to conform
to actual school hours. Mean hours and standard deviations
were computed for each group. A t test was used to
determine whether a significant difference existed between
Group A and Group B subjects.
Statistical measures relating to Group A and Group B
total classroom use hours are presented in Table X.
TABLE X
STATISTICAL MEASURES RELATING TO GROUP A AND GROUP B TOTAL CLASSROOM USE HOURS
Group Mean SD N t LS
A 39.02 8.59 62 -4.40 >.001
B 44.27 4.50 67 >.001
A t_ of -4.40 indicates a significant difference at
greater than the .001 level. Group A required fewer hours
for course requirement completion than did Group B. Based
on this result, the null hypothesis was rejected and
research hypothesis 5 was accepted.

62
Attitude
It was hypothesized that the correlation between
attitude and achievement test scores would be signifi-
cantly higher for Group A than for Group B. The instrument
used to measure attitude toward office machines was Osgood's
semantic differential technique. The semantic differential
is composed of semantic scales, pairs of polar adjectives
separated by seven points, that are designed to measure
connotative meanings of concepts. In this study, the
concepts to be judged were 1. "Course," 2. "Instruction,"
and 3. "Usefulness" as they were related to "Office
Machines." Twenty scales were used for each concept.
Fourteen of these scales were evaluative; three, potency;
and three, active.
On Campus A, the subjects were administered the
semantic differential as they completed course requirements.
Approximately two weeks before the end of the semester,
the subjects on Campus B were administered the semantic
differential. Attitude scores were determined from the
results of the semantic differential in the following
manner:
1. Each scale position of the semantic differential form
was assigned a value of "1" for the unfavorable pole to "7"
for the most favorable position. A neutral attitude was
assigned a value of "4,"

63
2. For use in the computer, raw scores for each scale were
converted to z, scores.
3. A Pearson Product-Moment Correlation Coefficient for
z scores was calculated, yielding a correlation matrix for
every scale with every other scale.
b. The intercorrelation matrix was subjected to a principle
axis factor analysis followed by a varimax rotation.
5. Scores of the fourteen evaluative scales were recognized
as measures of attitude.
6. A factor score was derived with multiple regression
techniques using evaluative scores as the criterion.
7. The mean and standard deviation was computed for each
adjective pair loaded on the evaluative factor.
The relationship of attitude and achievement was
determined in the following manner. A Pearson Product-
Moment Correlation Coefficient was calculated for the
relationship between the attitude score of each concept
and achievement. Correlation coefficients were calculated
separately for Group A and Group B. The significance of
the difference between Group A and Group B correlations
was determined by the z_ test for finding the significance
of the difference between correlations. The r's for
each concept were changed into the z function by the use
of the appropriate table.1 In the table used, the r and
^Garrett, 0£. cit_. , p. 406.

6k
z_ at or below .25 were equal. A standard error of
difference was computed and the z test applied. Finally,
the 55 scores for each concept were averaged and the z
test reapplied to the averaged z scores.
Statistical measures relating to correlations between
attitude and achievement scores for Group A and Group B
are presented in Table XI.
TABLE XI
STATISTICAL MEASURES RELATING TO GROUP A AND GROUP B ATTITUDE AND ACHIEVEMENT TEST SCORE CORRELATIONS
Concept Group r z N z LS
1 A
B
-.18
.15
-.18
.15
62
67 -1.84 NS
2 A
B
-.12
.10
-.12
.10
62
67 -1.20 NS
3 A
B
-.11
.19
-.11
.19
62
67 -1.67 NS
Average A
B
-.14
.15
62
67 -1.57 NS
The value of the z's obtained for each of the three
concepts, as well as the average, failed to exceed the

6 5
required .05 level of significance of 1.96. Based upon
these results, the null hypothesis was retained and research
hypothesis 2 was rejected.
The intelligence test scores obtained from the Otis
Quick Scoring Mental Ability Test were used to sub-group
Group A and Group B subjects for further analysis. It was
hypothesized that the correlation between attitude and
achievement scores for Group A sub-groups would be signifi-
cantly higher than for Group B sub-groups. The sub-groups
were based on the following divisions. Those subjects
whose intelligence test scores were at or above the sixty-
seventh percentile were placed in the first sub-group. The
second sub-group consisted of those subjects whose intelli-
gence test scores were between the sixty-seventh and the
thirty-third percentile. The last sub-group consisted of
those subjects whose intelligence test scores were at or
below the thirty-third percentile. The procedures used
for determining the sub-group correlations and z function
were the same as those used for the Group A and Group B
analysis. The z_ test was again used for each of the sub-
group comparisons to determine whether a significant
difference existed between the correlations for each
concept and the average.
Statistical measures relating to correlations between
attitude and achievement for Group A and Group B sub-groups

66
whose intelligence test scores were at or above the sixty-
seventh percentile are presented in Table XII.
TABLE XII
STATISTICAL MEASURES RELATING TO GROUP A AND GROUP B ATTITUDE AND ACHIEVEMENT TEST SCORE CORRELATIONS WHEN SUB-GROUPED
AT OR ABOVE THE SIXTY-SEVENTH PERCENTILE
Concept Group r Z_ N LS
A -.15 -.15 20 1 .49 NS
B -.31 -.32 22
A .14 .14 20 2 .12 NS
B .10 .10 22
A .19 .19 20 3 .17 NS
B .13 .13 22
Average A
B
. 06
-.03
20
22 .27 NS
The value of the z/s obtained for each of the three
concepts, as well as the average, failed to exceed the
required .05 level of significance of 1.96. Based upon
these results, the null hypothesis was .retained and research
hypothesis 3d was rejected.

67
Statistical measures relating to correlation
coefficients for Group A and Group B sub-groups whose
intelligence test scores were between the sixty-seventh
percentile and the thirty-third percentile are presented
in Table XIII.
TABLE XIII
STATISTICAL MEASURES RELATING TO GROUP A AND GROUP B ATTITUDE AND ACHIEVEMENT TEST SCORE CORRELATIONS WHEN SUB-GROUPED
BETWEEN THE SIXTY-SEVENTH PERCENTILE AND THE THIRTY-THIRD PERCENTILE
Concept Group r zf N z LS
A -.00 -.00 21 1 - .67 NS
B .22 .22 22
A -.12 -.12 21 2 -1.19 NS
B
vo CM • .27 22
A -.11 -.11 21 3 -1.35 NS
B .32 .33 22
A r 0
CD
21 Average -1.07 NS
B .27 22
Again, the value of the z/s obtained for each of the
three concepts and the average failed to exceed the required
.05 level of significance of I.96. Based upon these

68
results, the null hypothesis was retained and research
hypothesis 3e was rejected.
Statistical measures relating to correlation
coefficients for Group A and Group B sub-groups whose
intelligence test scores were at or below the thirty-
third percentile are presented in Table XIV.
TABLE XIV
STATISTICAL MEASURES RELATING TO GROUP A AND GROUP B ATTITUDE AND ACHIEVEMENT TEST SCORE CORRELATIONS WHEN SUB-GROUPED
AT OR BELOW THE THIRTY-THIRD PERCENTILE
Concept Group r z N z LS
A -.33 -.34 21 1 1 • O
NS B -.01 -.01 23
A -.22 -.22 21 2 - .22 NS
B -J5 -.15 23
A -.21 -.21 21 3 -1.04 NS
B .13 .13 23
Average A
B
-. 26
-.01
21
23 - .76 NS
The value of the £'s obtained for each of the three
concepts and the average failed to exceed the required .05

69
level of significance of 1.96. Based upon these results,
the null hypothesis was retained and research hypothesis
3f was rejected.
An additional sub-group analysis of the correlation
between attitude and achievement was conducted. Information
obtained from the student questionnaire administered at the
same time as the Otis Quick Scoring Mental Ability Test was
used in identifying those subjects who had previous training
or experience on office machines and those who had no
previous training or experience on office machines. Group A
and Group B subjects were then sub-grouped into the two
catagories. It was hypothesized that the correlation
between attitude and achievement for Group A sub-groups
would be significantly higher than for Group B sub-groups.
The procedures used for determining the sub-group corre-
lations and £ function were the same as those used for
the Group A and Group B analysis. The z_ technique to
determine the significant difference between correlations
was used.
Statistical measures relating to correlations between
attitude and achievement for the Group A and Group B sub-
groups who had previous training or experience on office
machines are presented in Table XV.
The z values obtained for each of the concepts and the
average failed to exceed the required .05 level of

70
TABLE XV
STATISTICAL MEASURES RELATING TO GROUP A AND GROUP B ATTITUDE AND ACHIEVEMENT TEST SCORE CORRELATIONS WHEN SUB-GROUPED
INTO THOSE WHO HAD PREVIOUS TRAINING OR EXPERIENCE ON OFFICE MACHINES
Concept Group r z N z LS
A -.02 -.02 23 1 -1.36 NS
B .38 .40 25
A .07 .07 23 2 .28 NS
B -.02 -.02 25
A -.17 -.17 23 3 - .97 NS
B .14 .14 25
Average A
B
-.04
.17
23
25 - .69 NS
significance of 1.96. The null hypothesis was retained and
research hypothesis 4c was rejected.
Statistical measures relating to correlations between
attitude and achievement for the Group A sub-group and
Group B sub-group subjects who had no previous training
or experience on office machines are presented in Table XVI.
The z_ values obtained for each of the concepts and the
average in Table XVI were, again, short of the required .05

71
TABLE XVI
STATISTICAL MEASURES RELATING TO GROUP A AND GROUP B ATTITUDE AND ACHIEVEMENT TEST SCORE CORRELATIONS WHEN SUB-GROUPED
INTO THOSE WHO HAD NO PREVIOUS TRAINING OR EXPERIENCE ON OFFICE MACHINES
Concept Group r £ N z LS
A -.25 -.26 37 1 -1.36 NS
B .06 .06 44
A -.16 -.16 37 2 -1.37 NS
B .16 .16 44
A
CO
o •
i -.08 37 3 -1.25 NS
B .21
<—1
C\J • 44
A -.17 37 Average -1.33 NS
B .14 44
level of significance of 1.96. The null hypothesis was
retained and research hypothesis 4d was rejected.
A further analysis was conducted involving the
correlation between attitude and student use time. It
was hypothesized that the correlation between attitude
and average hours of use time per student would be an
inverse relation and would be significantly higher for
Group A than for Group B.

72
The relationship of attitude and average use hours
per student was determined in the following manner. A
Pearson Product-Moment Correlation Coefficient was calcu-
lated for the relationship between the attitude score of
each concept and average use hours per student. The
determination of the average use hours per student is
explained in the achievement section. The significance
of the difference between Group A and Group B correlations
was determined by the z test for finding the significance
of the difference between correlations.
Statistical measures relating to correlations between
attitude and average use hours per student for Group A and
Group B are presented in Table XVII.
The values obtained failed to exceed the required
.05 level of significance of 1 . 9 6 . Therefore, the null
hypothesis was retained and research hypothesis 6 was
rejected.
A final analysis was concerned with the correlation
between attitude and achievement scores when the subjects
were grouped into those who had previous training or
experience on office machines and those who had no previous
training or experience on office machines. The approach
to instruction used was not a factor in this particular
division. Information resulting from this comparison

73
TABLE XVII
STATISTICAL MEASURES RELATING TO GROUP A AND GROUP B ATTITUDE AND TOTAL CLASSROOM USE HOURS CORRELATIONS
Concept Group r z N z LS
A .06 .06 62 1 .15 NS
B .03 .03 67
A .12 .12 62 2 .54 NS
B .03 .03 67
A -.04 -.04 62 3 .08 NS
B -.05 -.05 67
Average A
B
.05
.00
62
67 .26 NS
was used in determining whether to include the instructional
exemption, or pretest, phase as a part of the systems
approach in office machines. It was hypothesized that
the correlation between attitude and achievement scores
would be significantly higher for Group A than for Group B.
The z test for determining the significance of the
difference between correlations was used.
Statistical measures relating to the correlation
between attitude and achievement for the previous and

74
no previous training and experience on office machines are
presented in Table XVIII.
TABLE XVIII
STATISTICAL MEASURES RELATING TO ATTITUDE AND ACHIEVEMENT SCORE CORRELATIONS FOR SUBJECTS GROUPED ACCORDING TO PREVIOUS TRAINING OR EXPERIENCE ON OFFICE MACHINES
AND NO PREVIOUS TRAINING OR EXPERIENCE ON OFFICE MACHINES
Concept Group r z N z LS
Previous -.01 -.01 48 1 -1.66 NS
No Previous .29 .30 81
Previous .09 .09 48 2 .02 NS
No Previous • o CO
OO
o • 81
Previous .13 .13 48 3 .45 NS
No Previous .05 •
o VJl 81
Previous .07 48 Average - .39 NS
No Previous .14 81
The z values obtained for this comparison also failed
to indicate a significant difference at the .05 level.
Therefore, the null hypothesis was retained and research
hypothesis 8 was rejected.

CHAPTER V
SUMMARY, CONCLUSIONS, AND RECOMMENDATIONS
Summary
The problem of this study was a comparison of two
approaches to teaching office machines. The two approaches
compared were the learning systems approach and the lecture-
demonstration-rotation approach.
The purposes of this study were
1. To determine the effectiveness of a learning systems
approach as compared to the effectiveness of a lecture-
demonstration-rotation approach to teaching the manipulative
skills of office machines on achievement of those skills.
2. To determine the effectiveness of a learning systems
approach as compared to the effectiveness of a lecture-
demonstration-rotation approach on the attitude of students
toward a course in office machines.
3. To analyze student use time for a learning systems
approach as compared to student use time for a lecture-
demonstration-rotation approach.
4. To determine whether instructional.exemption, or
pretesting, should be an element of the learning systems
approach for office machines.
75

76
This study was conducted in the day office machines
classes (7 a.m. to 5 p.m.) on two community college campuses
in the Port Worth-Dallas, Texas, metropolitan area during
the fall semester, 1971. The learning systems approach was
used on Campus A. There were four classes of office
machines with a final total enrollment of sixty-two subjects
taught by two instructors. The lecture-demonstration-
rotation approach was used on Campus B. There were three
classes of office machines with a final total enrollment
of sixty-seven subjects taught by one instructor.
Two criteria, intelligence test scores and a
numerical comparison of those who had previous training
or experience on office machines, were used to determine
how equal the groups were at the beginning of the experiment.
No significant difference was found between the two groups
on the intelligence test scores. The number of subjects
with previous training or experience on office machines
within the two groups were also within the predetermined
numerical limitations.
The learning systems approach used on Campus A was
designed and organized to enable the students to use self-
pacing and self-instruction. Learning packages, slide-tape
series, and eight-millimeter filmloops developed and
produced by the two instructors on Campus A were the
principal sources of instruction. During the semester,

77
the classroom was open a minimum of eight hours a day. The
instructors were in the classroom to assist the students
two hours a day. Students were required to work in the lab
a minimum of three hours a week until course requirements
were completed. They did not have to meet their regularly
scheduled class time except to take a formal test. The
learning package provided students with an opportunity for
self-evaluation and practicing material again. A record
of attendance and time spent working was maintained by the
student in an attendance record in the classroom. When the
students completed a learning package, they took a formal
examination to determine their achievement of that particular
material.
The lecture-demonstration-rotation approach used on
Campus B was designed and organized so that students moved
through the course in a fixed rotation cycle. Class
attendance was compulsory while lab attendance was not.
Upon completion of a cycle on one machine, the student
took an examination to determine his achievement on that
particular portion of material.
The instruments used for measurement of achievement
were three tests, one for each machine, that were coordi-
nated with the textbook used on both campuses. Reliability
and validity were determined for each of the three tests.
Upon completion of the learning package, or at specified

78
times during the rotation cycle, students were administered
the achievement tests. The tests were checked and raw
scores assigned. The raw scores were summed to obtain
one achievement score for each student.
The instrument used to measure attitude toward office
machines was Osgood's semantic differential. The concepts
judged were 1. "Course," 2. "Instruction," and 3.
"Usefulness" as they were related to "Office Machines."
The attitude score was obtained by a factor analysis.
Various group and sub-group comparisons were made on
achievement, attitude, previous or no previous training
or experience, and classroom use time. The intelligence
test scores and a student questionnaire provided the
requisite information for sub-grouping.
The findings of this study tended to support the
hypothesis and sub-hypotheses (1, 3a, 3b, 3c, 4a, and 4b)
that the learning systems approach will produce a signifi-
cantly higher level of achievement on office machines
than will the lecture-demonstration-rotation approach.
Group A, which used the learning systems approach to
instruction, achieved at a significantly higher level
(greater than .001) than did Group B, which used the
lecture-demonstration-rotation approach. However, when
Group A and Group B were sub-grouped on the basis of
their intelligence test score, no significant difference

79
was found for the two sub-groups whose scores were at or
above the sixty-seventh percentile or for the two sub-
groups whose scores were between the thirty-third
percentile and the sixty-seventh percentile. There was a
significant difference (greater than the .001 level),
favoring Group A, between the Group A and Group B sub-
groups whose scores were at or below the thirty-third
percentile. When Group A and Group B were sub-grouped
into those who had previous experience or training on
office machines, a significant difference (greater than
the .01 level), favoring Group A, was found for each of
the comparisons.
The findings of this study supported the hypothesis
(5) that the average hours of use time per student in
Group A will be significantly less than for the average
hours of use time per student in Group B. Group A, using
the learning systems approach, used significantly less
time (greater than the .001 level) than did Group B,
using the lecture-demonstration-rotation approach.
The findings of this study failed to support the
hypothesis (7) that those who had previous training or
experience on office machines will achieve at a significantly
higher level than those who had no training or experience
on office machines. When the subjects were divided into

80
the two catagories, with teaching approach not a factor,
no significant difference was found.
The findings of this study failed to support the
hypothesis and sub-hypotheses (2, 3d, 3e, 3f> ^c, and 'Id)
that the correlation between attitude and achievement
scores would be significantly higher for Group A or
Group A sub-groups than for Group B or Group B sub-groups.
There was no significant difference for any of the three
concepts or the average of the three concepts between
Group A and Group B, between Group A and Group B sub-groups
based on intelligence test scores, or between Group A and
Group B sub-groups based on those who had previous training
or experience and those who had no previous training or
experience on office machines.
The hypothesis (6) that the correlation between
attitude scores and average use hours per student would
be an inverse relation and significantly higher for Group A
than for Group B was also not supported by the findings of
this study. No significant differences were found for
any of the concepts or the average of the three concepts.
The hypothesis (8) that the correlation between
attitude and achievement scores will be significantly
higher for students who have had previous training or
experience on office machines than for students who have
had no previous training or experience on office machines

81
was not supported by the findings of this study. Approach
to instruction was not a factor in this comparison.
Conclusions
The following conclusions are based upon the findings
of this study:
1. Achievement on office machines, especially for
the lower ability student, is significantly affected
favorably through the use of the learning systems approach
to instruction.
2. The self-pacing aspect of the learning systems
approach permits students to complete course requirements
in significantly less time without achievement being
adversely affected.
3. Previous training or experience on office machines
does not necessarily enable a student to achieve at a
higher level than a student with no previous training or
experience on office machines.
Recommendations
As a result of this study, the following recommen-
dations are made:
1. Studies should be conducted to determine the
effectiveness of the learning systems approach in other
skill and non-skill areas.

82
2. A study should be conducted in office machines
using combinations of components different from those in
this study.
3. A study should be conducted in which a combination
of the learning systems approach and management by
objectives is used as one approach.
Additional research should be conducted using the
semantic differential as an instrument for measuring change
of attitude toward course, instruction, and usefulness.
5. A study should be conducted to determine the
difference in final achievement when those who have had
previous training or experience on office machines are
given pretests and instruction exemption and when those
who have had no previous training or experience are required
to do all assigned work.
The following recommendations are made for operating
the learning systems approach.
1. The learning system must be considered as a whole.
The individual components may not be as successful when
used separately from the combination of components in the
learning system.
2. The role of the instructor in the classroom in
which the learning systems approach is used will be to
manage learning, to advise, and to help in evaluation of

83
progress. The conveying of information is just one
component and is no longer the instructor's principal
responsibility.
3. The Exemption Evaluation, or pretest, should be
included as a phase of the learning systems approach.
It is essential that an instructor be available
to help students with problems or formal evaluation at a
specific time daily if self-pacing is used. During the
remaining portion of the class day, a laboratory
assistant should be available.
5. Media (and the software accompanying it) should
be considered as a partner with specific responsibilities.
There should not be a duplication of effort by having
information conveyed by media and then the instructor
presenting the same material again. The instructor would
be responsible for elaborating, explaining, or interpreting
the material presented by media.

APPENDIX A
Appendix A presents a copy of the letter from South-
western Publishing Company granting permission to use
Office Machines Course, Fourth Edition, and the accom-
panying tests.
84

85
C O P Y
May 28, 1971
Mr. Jimmy McKenzie Tarrant County Junior College Northeast Campus 828 Harwood Road Hurst, TX 76053
Dear Mr. McKenzie
In response to your letter of May 12, 1971, we are glad to grant permission for you to use OFFICE MACHINES COURSE, Fourth Edition, and the tests accompanying that item for experimental purposes. It is understood that there shall be no sale of the materials developed in the experiment and if distribution beyond your experimental call should develop you would need to seek further permission.
We wish you well in your study and want you to know that we would be interested in learning of the results.
Sincerely yours
/s/
John L. Pineault Editor in Chief
ab

APPENDIX B
Appendix B presents the explanatory letter and response
forms sent the seven panel members asked to evaluate Ten-Key
Adding Machine, Test 2; Ten-Key Printing Calculator, Test
and Ten-Key Electronic Calculator, Test 5. A description of
the seven panel members and their individual responses are
also included.
86

87
During the Pall Semester, 1971 > I will be conducting research in the area of office machines.
In order to conduct my study, I have found it necessary to indicate validity for the attached tests. To indicate validity, a panel of seven judges will be asked to evaluate the following tests:
Ten-Key Adding Machine, Test 2, Ten-Key Printing Calculator, Test k, Ten-Key Electronic Calculator, Test 5.
Would you serve as a member of this panel? If so, please examine each test and indicate whether you think, or do not think, the test will adequately determine whether a student can perform machine manipulations involving addition, subtraction, multiplication, and division. It is important that you indicate Yes or No for each test, not just one.
The names of the seven panel members will not be released. So that I may assure you of anonymity, please do not sign the evaluation sheets. A prompt return of these instruments and your evaluation will certainly be appreciated. If you prefer not to serve as a member of this panel, please check below and return the material to me promptly so that I might select another panel member.
Sincerely,
Jimmy McKenzie
Enclosures
I prefer not to serve as a panel member.

88
Will this test adequately determine whether a student can perform machine manipulations involving addition, subtraction, multiplication, and division on the Ten-Key Adding Machine?
Yes No
Will this test adequately determine" whether a student can perform machine manipulations involving addition, subtraction, multiplication, and division on the Ten-Key Printing Calculator?
Yes No
Will this test adequately determine whether a student can perform machine manipulations involving addition, subtraction, multiplication, and division on the Ten-Key Electronic Calculator?
Yes No
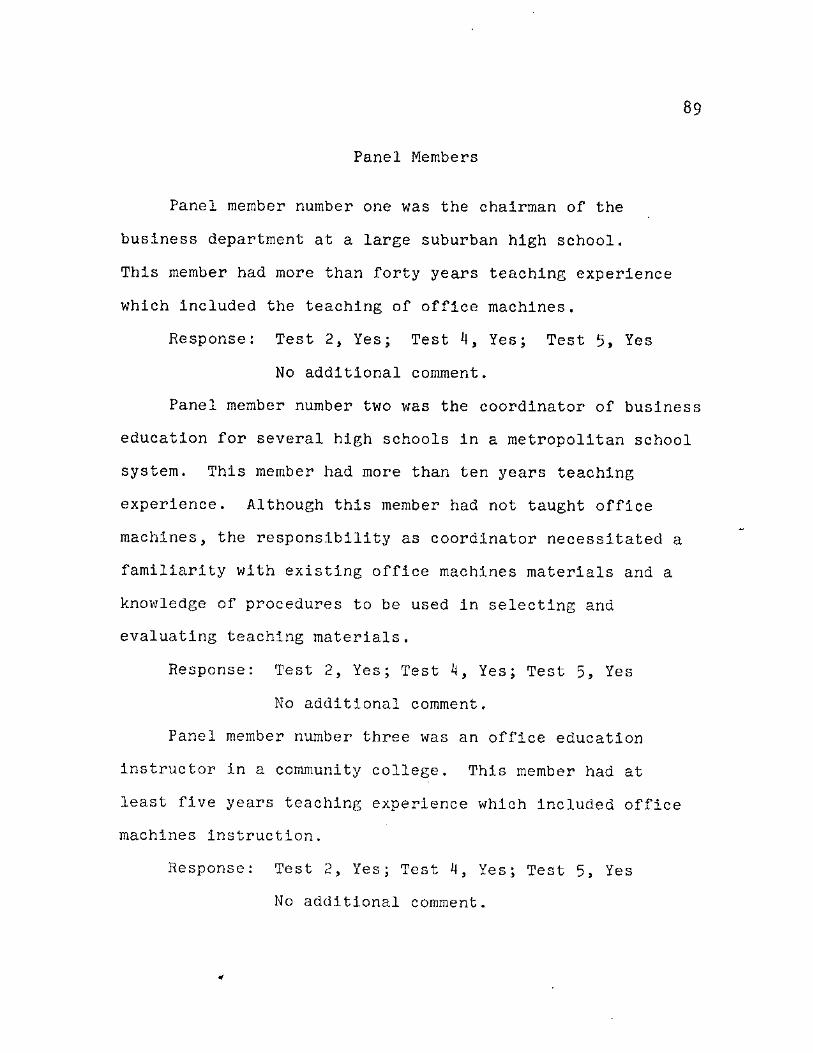
89
Panel Members
Panel member number one was the chairman of the
business department at a large suburban high school.
This member had more than forty years teaching experience
which included the teaching of office machines.
Response: Test 2, Yes; Test kt Yes; Test 5, Yes
No additional comment.
Panel member number two was the coordinator of business
education for several high schools in a metropolitan school
system. This member had more than ten years teaching
experience. Although this member had not taught office
machines, the responsibility as coordinator necessitated a
familiarity with existing office machines materials and a
knowledge of procedures to be used in selecting and
evaluating teaching materials.
Response: Test 2, Yes; Test 4, Yes; Test 5, Yes
No additional comment.
Panel member number three was an office education
instructor in a community college. This member had at
least five years teaching experience which included office
machines instruction.
Response: Test 2, Yes; Test H, Yes; Test 5, Yes
No additional comment.

90
Panel member number four was a business administration
instructor in a junior college. This member had more than
fifteen years teaching experience which included office
machines instruction.
Response: Test 2, Yes; Test Yes; Test 5, Yes
No additional comment.
Panel member number five was a business education
instructor at a community college. This member had at
least five years teaching experience which included office
machines instruction.
Response: Test 2, No; Test 4, No; Test 5, Yes
No additional comment.
Panel member number six was a business education
professor at a university. This membe had more than
fifteen years teaching experience which included office
machines instruction and methods classes that involved
studying the teaching of office machines.
Response: Test 2, Yes; Test *1, Yes; Test 5, Yes
No additional comment.
Panel member number seven was also a business education
professor at a university. This member had more than ten
years teaching experience which included a methods class
which exclusively studied the teaching of office machines.
Response: Test 2, Yes; Test 4, Yes; Test 5, Yes
No additional comment.

APPENDIX C
Appendix C presents the student questionnaire
administered during the week of the twelfth class day
to solicit information pertaining to previous training
or experience on office machines.
91

92
STUDENT QUESTIONNAIRE
PLEASE PROVIDE THE FOLLOWING INFORMATION AS ACCURATELY AS YOU CAN
1. Name .
2. Sex Male Female
3. Marital Status Single Married
U. Social Security Number - -
5. Class in college Freshman Sophomore
6. Have you been taught to use office machines in a previous course
in high school or college? Yes No
7. Check any of the following machines included in this instruction.
a. Ten Key adding machine
b. Printing calculator c. Electronic calculator d. None of these
8. Have you worked on a job in which you have used an office machine daily?
Yes No
9. Are you currently working on a Job in which you use an office machine
daily? Yes No
10. Check any of the following machines you have used or are currently
using daily on the job.
a. Ten Key adding machine
b. Printing calculator c. Electronic calculator d. None of these

APPENDIX D
Appendix D presents the semantic differential
administered to the students to solicit information
pertaining to attitude toward office machines.
93

9*»
SEMANTIC DIFFERENTIAL
INSTRUCTIONS
The purpose of this instrument is to measure the meanings of certain things to various people by having them judge them against a series of descriptive scales. In taking this test, please make your Judg-ments on the basis of what these things mean to you. On each page of this booklet you will find a different concept to be Judged and beneath it a set of scales. You are to rate the concept on each of these scales in order.
Here is how you are to use these scales:
If you feel that the concept at the top of the page is very closely related to one end of the scale, you should place your check-mark as follows:
fair X : : : : : : unfair
or
fair : : : : : X unfair
If you feel that the concept is quite closely related to one or the other end of the scale (but not extremely), you should place your check-mark as follows:
fair : : : : : X : unfair
or
fair : X : : : : unfair
If the concept seems only slightly related to one side as opposed to the other (but is not neutral), then you should check as follows:
fair : : X : : : unfair
or
fair : : : : X : : unfair
The direction toward which you check, of course, depends upon which of the two ends of the scale seem most characteristic of the thing you're judging.

95
If you consider the concept to be neutral on the scale, both sides of the scale equally associated with the concept, or if the scale is completely irrelevant, unrelated to the concept, then you should place your check-mark in the middle space:
fair : : : X : : : unfair
IMPORTANT: (l) Place your check-marks in the middle of spaces, not on the boundries:
THIS NOT THIS fair : : : X : : X unfair
Sometimes you may feel as though you've had the same item before on the test. This will not be the case, so do not look back and forth through the items. Do not try to remember how you checked similar items earlier in the test. Make each item a separate and independent Judgment. Work at fairly high speed through this test. Do not worry or puzzle over individual items. It is your first impressions, the immediate "feelings" about the items, that we want. On the other hand, please do not be careless, because we want your true impressions.

OFFICE MACHINES COURSE
96
lenient_
meaningless_
progressive_
important_
complete_
wise_
hard
low_
graceful_
free_
dirty_
bad_
passive_
painful_
simple_
sociable_
false_
dark_
beautiful_
cold
severe
jneaningful
jregressive
_un import ant
JLncomplete
_fooliBh
_soft
_high
jawkward
_constrained
_clean
_good
_active
_pleasurable
_complex
jinsociable
_true
_light
_ugly
hot

OFFICE MACHINES INSTRUCTION
97
lenient_
meaningless_
progressive_
import an t_
complete_
wise_
hard_
low_
graceful_
free_
dirty_
bad_
passive_
painful_
Bimple_
sociable_
false_
dark_
beautiful
cold
severe
^meaningful
jregressive
_un import ant
JLncomplete
_foolish
_soft
_high
_awkward
__constrained
_clean
_good
_active
jpleasurable
_complex
_unsociable
_true
_light
_ugly
hot

OFFICE MACHINES USEFULNESS
98
lenient_
meaningless_
progressive_
important_
complete_
wise
hard
low_
graceful_
free_
dirty_
bad_
passive_
painful_
simple_
sociable_
false_
dark_
beaut iful_
cold
severe
meaningful
regressive
unimportant
incomplete
foolish
soft
high
awkward
constrained
clean
good
active
_pleasurable
complex
unsociable
true
light
ugly
hot

BIBLIOGRAPHY
Books
Banathy, Bela H., Instructional Objectives, Palo Alto, California, Fearon Publishers, 1968.
Bower, James B., Robert E. Schlosser, and Charles T. Zlatkovich, Financial Information Systems, Boston, Allyn and Bacon, Inc., 1969.
Campbell, Donald T. and Julian C. Stanley, Experimental and Quasi-Experimental Designs for Research, Chicago Rand, McNally, lWT<
Churchman, C. West, The Systems Approach, New York, Delacorte Press, 1968.
Cornelia, Nicholas J., William R. Pasewark, and Peter L. Agnew, Office Machines Course, Cincinnati, South-western Publishing Company, Inc., 1971.
Pry, E. B., Teaching Machines and Programmed Instruction, New York, McGraw-Hill Book Co., 1963.
Gagne, Robert M., The Conditions of Learning, New York, Holt, Rinehart and Winston, Inc~ 19^5^
Garrett, Henry E., Statistics in Psychology and Education, New York, David McKay Company, Inc., 196?.
Johnson, Stuart R. and Rita B. Johnson, Developing Individualized Instructional Material, Palo Alto, California, Fearon Publishers, 1970.
Knirk, Frederick G. and John W. Childs, Instructional Technology, New York, Holt, Rinehart and Winston, Inc., 1965.
Mager, Robert F., Preparing Instructional Objectives, Palo Alto, California, Fearon Publishers, 1962.
99

100
Osgood, Charles E., George J. Sucl, and Percy H. Tannenbaum, The Measurement of Meaning, Urbana, Illinois, University of Illinois Press, 1957.
Otis, Arthur S., Manual of Direction for Gamma Test, New York, Harcourt, Brace & World, Inc., 195*1.
Pfeiffer, John, New Look at Education, New York, The Odyssey Press, 1968.
Popham, James and Eva L. Baker, Establishing Instructional Goals, New Jersey, Prentice-Hall, Inc., 1970.
Postlethwait, S. N., et. al., An Integrated Experience Approach to Learning, Minneapolis, Burgers, 1964.
Saettler, Paul, A History of Instructional Technology New York, McGraw-Hill Book Company, 1968.
Seaty, Thomas L., Mathematics Methods of Operation Research, New York, McGraw-Hill Book Company, 1959.
Articles
Calhoun, Calfrey C., "The Emerging New Business Education (Introduction)," National Business Education Quarterly, XXXVI (Spring, 1968), 5-6.
Cohen, Arthur M., "Multi-Media Instructional Program," UCLA Junior College Research Review, 3 (January, 1959), 24.
Doney, Lloyd D., "A Systems Approach to Curriculum Devel-opment," Collegiate News and Views, XXIII (May, 1970), 5.
Kopstein, Felix P., "Product or System Research as Applied to Education for Business," National Business Education Quarterly, XXXVII (Spring, 1969), 11-12.
Meals, Donald W., "Heuristic Models for Systems Planning," Phi Delta Kappan, XLVIII (Bloomington, Indiana, 1967), 199-200.
Place, Irene, "Systems and Procedures Research in the Office," The Delta Pi Epsilon Journal, XII (November, 1969)> 19.

101
Schultheis, Robert A., "Research Priorities for Business Education," The Delta Pi Epsilon Journal, XIII (February, 1971), 12.
West, Leonard J., "Individualization of Instruction," Business Education Forum, XXV (May, 1971), 20.
Reports
Lanham, Frank W., A Planning Study to Determine the Feasi-bility of Developing a New Business and Office Education Curriculum, Moonshot—an Office Occupation Curriculum, Columbus, the Center for Vocational and Technical Education, Ohio State University, 1968.
Lanham, F. W., Development of Performance Goals for a New Office and Business Education Learning System, Washington, D. C., United States Office of Education, 1970.
Publications of Learned Organizations
Calhoun, Calfrey C. and Bobbye J. Wilson, "New Office and Business Education Learning System," Contributions of Research to Business Education, Ninth Yearbook, Washington, D. C., National Business Education Association, 1971.
Heimerl, Beatrice B. and Marvin H. Halldorson, "Data-Gathering Techniques," Contributions of Research to Business Education, Ninth Yearbook, Washington, D. C., National Business Education Association, 1971.
Long, R. Charles, "Identification of Needed Research to Business Education," Contributions of Research to Business Education, Ninth Yearbook, Washington, D. C., National Business Education Association, 1971.
Page, Charles W., and Dorothy Lee, "The Teaching of Office Machines," Contributions of Research to Business Education, Ninth Yearbook, Washington, D. C., National Business Education Association, 1971.

102
Unpublished Materials
Beard, Brenda, "Development and Evaluation of Taped Programmed Instruction in Seven Basic Operations of the Marchant Automatic Rotary Calculator," unpublished master's thesis, School of Business, University of Tennessee, 1965.
Colbert, Bette J., "The Development of an Audio-Visual Presentation of Office Machines for Use in Classroom Instruction in Office Education," unpublished master's thesis, School of Business, University of Wisconsin, 1967.
Corgan, Virginia E., "A Comparison of the Differences Between the Similar-Processes Method and the Rotation Method of Teaching Business Machines," unpublished doctoral dissertation, School of Business, The University of Nebraska, 1966.
Edwards, Ronald K., "An Experimental Study in the Teaching of Business Machines Utilizing an Audio-Visual-Tutorial Laboratory Approach with Continuous-Loop Sound Film," unpublished doctoral dissertation, College of Education, Michigan State University, 1969.
Johnston, Russell A., "Selected Instructional Practices in Collegiate Schools of Business and Their Use in a Proposed Systems Approach," independent research study, Department of Business Administration and Management, Virginia Commonwealth University, 1967.
Kelly, Richard L., "A Job Analysis of the Tasks of Selected Semiprofessional Accountants in New York State," unpublished doctoral dissertation, College of Education, The Pennsylvania State University, University Park, 1970.
Nelson, Dennis L., "The Effect of Specifically Stated Instructional Objectives on the Achievement of Collegiate Undergraduate Economics Students," unpublished doctoral dissertation, College of Education, University of Minnesota, 1970.
Petro, Peter K., "The Derivation of Learning Hierarchies and Instructional Objectives in Accounting with Implications for Developing Instructional Systems for Post-High School Programs," unpublished doctoral dissertation, College of Education, Michigan State University, 1970.

103
Walters, George Kaufmann, "The Effect of Taped Instruction in College Office Machines," unpublished doctoral dissertation, School of Education, Colorado State College, 1969.
Weber, Edwin J., "The Development of Performance Objectives for Teacher-Coordinators of Cooperative Occupational Training Programs," unpublished doctoral dissertation College of Education, The University of Michigan, 1970