a comparison of techniques for size measurement of
TRANSCRIPT

AnalyticalMethods
PAPER
Ope
n A
cces
s A
rtic
le. P
ublis
hed
on 0
8 Ju
ne 2
016.
Dow
nloa
ded
on 1
2/17
/202
1 6:
30:3
3 PM
. T
his
artic
le is
lice
nsed
und
er a
Cre
ativ
e C
omm
ons
Attr
ibut
ion
3.0
Unp
orte
d L
icen
ce.
View Article OnlineView Journal | View Issue
A comparison of
aPhysikalisch-Technische Bundesanstalt (P
Germany. E-mail: [email protected] Ltd., Queens Road, Teddington, TW11cInstitute for Reference Materials and Meas
(JRC), European Commission, Retieseweg 11dAnalytical Sciences, National Physical LaboeBiological Nanochemistry Research Group,
Chemistry, Research Centre for Natural Sc
Magyar tudosok korutja 2, 1117 Budapest, H
† Electronic supplementary informa10.139/c6ay00419a
‡ CG and MK performed and evaluatedresults and draed the manuscript. DBTEM measurements. HGI conceived tNanoChOp project. VK, CM, YR, and ASmeasurements, including a detailed unproduction of the test materials. MP anplain silica particles. All authors read and
Cite this: Anal. Methods, 2016, 8, 5272
Received 10th February 2016Accepted 7th June 2016
DOI: 10.1039/c6ay00419a
www.rsc.org/methods
5272 | Anal. Methods, 2016, 8, 5272–52
techniques for size measurementof nanoparticles in cell culture medium†
Christian Gollwitzer,*a Dorota Bartczak,b Heidi Goenaga-Infante,b Vikram Kestens,c
Michael Krumrey,a Caterina Minelli,d Marcell Palmai,e Yannic Ramaye,c
Gert Roebben,c Aneta Sikorad and Zoltan Varga‡e
Plain and aminated silica nanoparticles dispersed in purified water, in 50 mM Tris–HCl buffer and in cell
culture medium were measured using dynamic light scattering (DLS), centrifugal liquid sedimentation
(CLS), small-angle X-ray scattering (SAXS), and particle tracking analysis (PTA). The test samples were
measured by all methods immediately after dispersion and after incubation at room temperature for
24 h. The effect of the biological dispersion medium on the modal value of the particle size distribution
was compared for each method taking into account the estimated uncertainty. For the methods based
on light scattering, DLS and PTA, the size distributions obtained were significantly altered due to the
formation of a protein corona and induced agglomeration effects. With SAXS and CLS, the measured size
of the primary particles was mostly unchanged. While SAXS offers excellent precision and traceability to
the SI unit system if the model fitting approach is used for data analysis, CLS provides detailed size
distributions from which additional information on the agglomeration state can be deduced.
1 Introduction
Due to the ubiquitous use of nanoparticles in food andconsumer products,1,2 human exposure to engineered nano-particles (ENPs) has recently become an important issue in theeld of health and environmental science.3 The potential risksassociated with this exposure4 are driving research into thebasic physical chemistry of ENPs as well as their interactionwith biological materials.5 The effect of ENPs on biological cells,the environment and human health, are under active researchand not yet fully understood,6 which also implies regulatoryproblems.7 Some of these difficulties are related to the
TB), Abbestr. 2-12, D-10587 Berlin,
de
0LY, UK
urements (IRMM), Joint Research Centre
1, 2440 Geel, Belgium
ratory, Teddington, TW11 0LW, UK
Institute of Materials and Environmental
iences, Hungarian Academy of Sciences,
ungary
tion (ESI) available. See DOI:
the SAXS measurements, collected theperformed and evaluated the PTA andhe study in the framework of theperformed and evaluated DLS and CLScertainty analysis. GR organized thed ZV performed the amination of theapproved the nal manuscript.
82
limitations of the current size determination techniques used inthe eld.
One of the dening properties of nanomaterials is the meannanoparticle size, which can be determined with high accuracyby selected techniques for suitable materials.8 For nanoparticlesdispersed in plain aqueous media, these techniques canproduce results where the reported size is related to the de-nition of the unit metre in the International System of Units (SI)via an unbroken chain of comparisons, each having a stateduncertainty (SI-traceable results). In complex biological media,however, the determination of the size is challenging not onlybecause the commonly used sizing techniques are less suitablefor testing multi-component systems, but also because of thepossible interactions between ENPs and the constituents of thebiological matrix.9
If ENPs are in contact with biological material, differentproteins and other organic molecules can adhere to theirsurfaces, forming a so-called protein corona. The properties ofthe corona highly depend on the surface characteristics of theENPs as well as on the type of the biological matrix.10 Theformation of the protein corona determines the biological fateof the ENPs11 and increases the overall size, but usually leavesthe size of the solid, dense core intact.12 Measuring the size ina biological medium is therefore more difficult and less well-dened than in plain aqueous media.13 The size determinationof ENPs in a biological medium is not only important forhuman and environmental risk assessment and regulation, butalso for the elds of drug delivery, biomedical imaging andtoxicology.14
This journal is © The Royal Society of Chemistry 2016

Fig. 1 TEM picture of the silica particles NP-plain (a). The scale barrepresents a length of 500 nm. The PSD obtained from 250 particles inthis image is shown in (b). Only particles with a diameter above 60 nmwere counted. The volume-weighted size distribution obtained by CLSis shown in (c) for NP-plain (red line) and NP–NH2 before ampouling(blue line).
Paper Analytical Methods
Ope
n A
cces
s A
rtic
le. P
ublis
hed
on 0
8 Ju
ne 2
016.
Dow
nloa
ded
on 1
2/17
/202
1 6:
30:3
3 PM
. T
his
artic
le is
lice
nsed
und
er a
Cre
ativ
e C
omm
ons
Attr
ibut
ion
3.0
Unp
orte
d L
icen
ce.
View Article Online
Silica nanoparticles are one of the most frequently usedENPs in consumer products.15 In this study, two well-charac-terized representative test materials16 (RTMs) based on SiO2
nanoparticles with different surface functionalization, butotherwise very similar properties, were analysed using fourcommon particle size analysis techniques aer dispersion inpuried water, in a Tris–HCl buffer at a physiological pH, and ina cell culture medium containing 10% fetal bovine serum (FBS).The applied techniques include dynamic light scattering (DLS),centrifugal liquid sedimentation (CLS), small-angle X-ray scat-tering (SAXS), and particle tracking analysis (PTA). Themeasurements were complemented by uncertainty analyses, inorder to evaluate the signicance of the resulting changes insize.
In the next section, a brief description of the preparation ofthe test materials is followed by the experimental details andthe presentation of the results obtained. Different methods arethen compared regarding their ability to characterize theparticle size distribution (PSD) of the studied ENPs in differentmedia, and nally the advantages and drawbacks of eachmethod are discussed.
2 Materials
The nanomaterials used in this comparison are derived froma commercially available aqueous suspension of plain silicananoparticles (Klebosol 30R50, 300 g kg�1), supplied by AZElectronic Materials France SAS (Trosly Breuil, FR).17 One batchwas functionalized with amino groups and diluted in puriedwater (resistivity 18.2 MU cm at 25 �C) to a target concentrationof 2.5 g kg�1, the other batch was diluted to the same concen-tration without amination.
Throughout the whole processing, the suspensions werekept sterile. This was a precautionary measure, in order tosuppress unwanted growth of bacterial contamination, whenthe nanomaterials come into contact with the cell culturemedium.18 An overview of the preparation of NP–NH2 and NP-plain is given in the next paragraph; an in-depth description ofthe preparation and characterization of these materials (deno-ted as NanoChOp-06 and NanoChOp-05, respectively) can befound in a separate article.19
For the preparation of the rst material (NP–NH2), the basesuspension was initially ltered through a Whatman celluloselter. The amination was carried out using aminopropyl-diethoxy-methylsilane (APDEMS) in an excess amount aerchanging the solvent to ethanol using dialysis. Finally, the solwas dialysed with a cellulose membrane tubing (D9402 Sigma-Aldrich, Ø 76 mm, nominal molecular weight cut-off 12 kDa)under sterile conditions against autoclaved puried watercontaining 30 mmol L�1 acetic acid at a pH value of 3 to stop thereaction.
The amination was performed in four batches, which weresubsequently mixed and diluted to a nal concentration of2.5 g kg�1. The resulting 1.25 L of NP–NH2 were nally lledinto ame-sealed amber glass ampoules with a volume of 2 mLand stored at 4 �C. The secondmaterial (NP-plain) was preparedin a similar way, by diluting the initial suspension to the target
This journal is © The Royal Society of Chemistry 2016
concentration, but skipping the amination step, and then lledinto 9 mL ampoules. These ampoules were stored at 18 �C.
Fig. 1 displays a transmission electron microscopy (TEM)micrograph of NP-plain. The main population of particles hasa very low polydispersity with a mean size (area equivalent circlediameter) of around 80 nm (Fig. 1b). A very small number ofparticles with a mean size of around 40 nm could also be foundin the TEM image and in the volume-weighted PSD obtained byCLS (c), which indicates that the particles in this fraction makeup about 3% of the total volume of particles. Other basicproperties are detailed in Table 1.
Both RTMs were checked for homogeneity (variationbetween different ampoules) and stability (changes over time).For NP-plain, the standard deviation of the modal sizemeasured with DLS and CLS was less than 1% between samples
Anal. Methods, 2016, 8, 5272–5282 | 5273

Table 1 Initial properties of the RTMs
Property NP–NH2 NP-plain Unit
Surface chemistry –NH2 –OH —Effective particle densitya 2.0 � 0.1 2.0 � 0.1 g cm�3
Particle refractive indexb 1.46 + 0i 1.46 + 0i lSi mass fractionc 1121 � 6 1108 � 7 mg kg�1
z-Potentiald +9 �48 mVpH 3.2 � 0.5 8.4 � 0.5 1NP concentratione 5 � 1012 5 � 1012 mL�1
a Obtained with isopycnic sedimentation on the same base colloidalsilica. b Tabulated value for SiO2.
c Determined by isotope dilutionmass spectroscopy. d Obtained with electrophoretic light scattering.19e Estimated from density, Si mass fraction and mean particle size.
Fig. 2 DLS results in glass cells. Typical volume-weighted PSDs forNP–NH2 obtained in Lab 2 immediately after dispersion. Water and Trisbuffer yield repeatable and very similar PSDs (black and red lines).Dispersions in cell culture medium yield non-repeatable results (bluelines). Some results show the peak of the primary particles similar tothe simpler media (solid line), some PSDs are completely different,even for repeated measurements on a single aliquot (dashed line anddash-dotted line).
Analytical Methods Paper
Ope
n A
cces
s A
rtic
le. P
ublis
hed
on 0
8 Ju
ne 2
016.
Dow
nloa
ded
on 1
2/17
/202
1 6:
30:3
3 PM
. T
his
artic
le is
lice
nsed
und
er a
Cre
ativ
e C
omm
ons
Attr
ibut
ion
3.0
Unp
orte
d L
icen
ce.
View Article Online
and with time, when stored at 18 �C. Thus, NP-plain is suitableas a reference material for particle size. For NP–NH2, the modalsize measured with SAXS, CLS and DLS varied less than 0.3%.However, whereas the equivalent diameter measured with SAXSwas stable within 0.1% over 36 months, the intensity weightedmean diameter obtained by DLS increased slowly with time. Tominimize these changes, the NP–NH2 samples were stored at4 �C.19 These results give the NP–NH2 material the status ofa referencematerial for the equivalent diameters measured withCLS and SAXS, but not for DLS, because of the signicantchange over time. The measurements reported in this articlewere performed 4 years aer the ampouling of NP-plain andbetween 6 and 9 months aer preparation of NP–NH2.
For the measurements, these two materials were furtherdiluted to a concentration of 1 g kg�1 in puried water, in50 mM Tris–HCl buffer at a physiological pH, and in a cellculture medium composed of Eagle's Minimum EssentialMedium (EMEM, ATCC, Teddington, UK) supplemented with10% FBS (PAA Laboratories, Dartmouth, USA). Since themeasurements were carried out at physically different locations,the FBS was aliquotted from a single batch and distributed todifferent institutes in frozen form. The dilution of the twomaterials was performed at each institute following a xed,written protocol. All measurements were performed immedi-ately aer dispersion and aer 24 h incubation at roomtemperature. Thus, in total six different samples were analysedat two points in time, by each method.
3 Measurements3.1 Dynamic light scattering
The principle of size measurements by DLS is based onmeasuring light scattering intensity uctuations.20 These uc-tuations, which are time-related and which occur arounda mean intensity value, are caused by the particles that aremoving in the suspension under the inuence of Brownianmotion. The intensity uctuation recorded is temporallycorrelated with a delayed value of itself. The result is a decayingintensity autocorrelation function from which the translationaldiffusion coefficient can be determined. For the computation ofa PSD, a non-negative least-squares (NNLS) algorithm21 can beused, which is typically implemented in the vendor's soware of
5274 | Anal. Methods, 2016, 8, 5272–5282
the DLS instrument and widely applied for the purpose ofanalysing DLS data. This algorithm attempts to deduce anintensity-weighted PSD from the raw intensity autocorrelationfunction by means of an inverse Laplace transform. With theoptical properties of the particles, equivalent volume- andnumber-weighted distributions of a hydrodynamic equivalentspherical diameter are obtained via Mie theory light scatteringcalculations.
As DLS is a widely appliedmethod, two identical instruments(Malvern Zetasizer Nano ZS, Malvern Instruments Ltd., Wor-cestershire, UK) available at two different laboratories of theauthors have been included in this study. This apparatus isequipped with a red light-emitting He–Ne laser (max. 4 mWpower and 632.8 nm wavelength) and the scattered light iscollected by an avalanche photodiode detector which is locatedat a backward scattering angle of 173�. To ensure laser stability,the instruments were turned on at least 30 min before eachseries of measurements.
The measurements were performed in disposable poly-carbonate folded capillary cells with gold-plated beryllium-copper electrodes (Malvern DTS1070) in the rst laboratory (Lab1), while the second laboratory (Lab 2) used high-quality glasscells.
3.1.1 Data evaluation. The autocorrelation data was pro-cessed using the proprietary NNLS General Purpose settingprovided in the soware of the device manufacturer. Thedefault value of 70 size classes (bins) which span a logarithmicinterval from 0.4 nm to 10 000 nm was used. Because the mainfraction of particles of the used materials has a very narrow sizedistribution (see Fig. 1), the peak of the PSDs is composed ofonly a very limited number of size classes. In order to determinethe mode value with a better resolution than the spacing of thebins, which is around 13 nm near the peak, a parabola was ttedthrough three datapoints closest to the peak.
3.1.2 Results. Fig. 2 displays PSDs as obtained by DLS forNP–NH2. For both NP–NH2 and NP-plain materials dispersed inpuried water and the Tris–HCl buffer, monomodal PSDs were
This journal is © The Royal Society of Chemistry 2016
Paper Analytical Methods
Ope
n A
cces
s A
rtic
le. P
ublis
hed
on 0
8 Ju
ne 2
016.
Dow
nloa
ded
on 1
2/17
/202
1 6:
30:3
3 PM
. T
his
artic
le is
lice
nsed
und
er a
Cre
ativ
e C
omm
ons
Attr
ibut
ion
3.0
Unp
orte
d L
icen
ce.
View Article Online
obtained without an obvious indication of agglomerates or theminor fraction of smaller particles which are present in bothNP–NH2 and NP-plain. Since the intensity of the scattered lightis to a rst approximation proportional to the square of theparticle volume, the contribution of this fraction of smallerparticles to the total scattering intensity is too small comparedto the main fraction of particles, which are both stronger scat-terers and more concentrated.
In contrast to the simpler dispersion media, the results incell culture medium were not reproducible. While some of thePSDs are similar to the dispersions in water and the Tris–HClbuffer, others show multiple modes. Even for repeatedmeasurements performed on a single aliquot in sequence, theresults can be completely different (broken lines in Fig. 2).
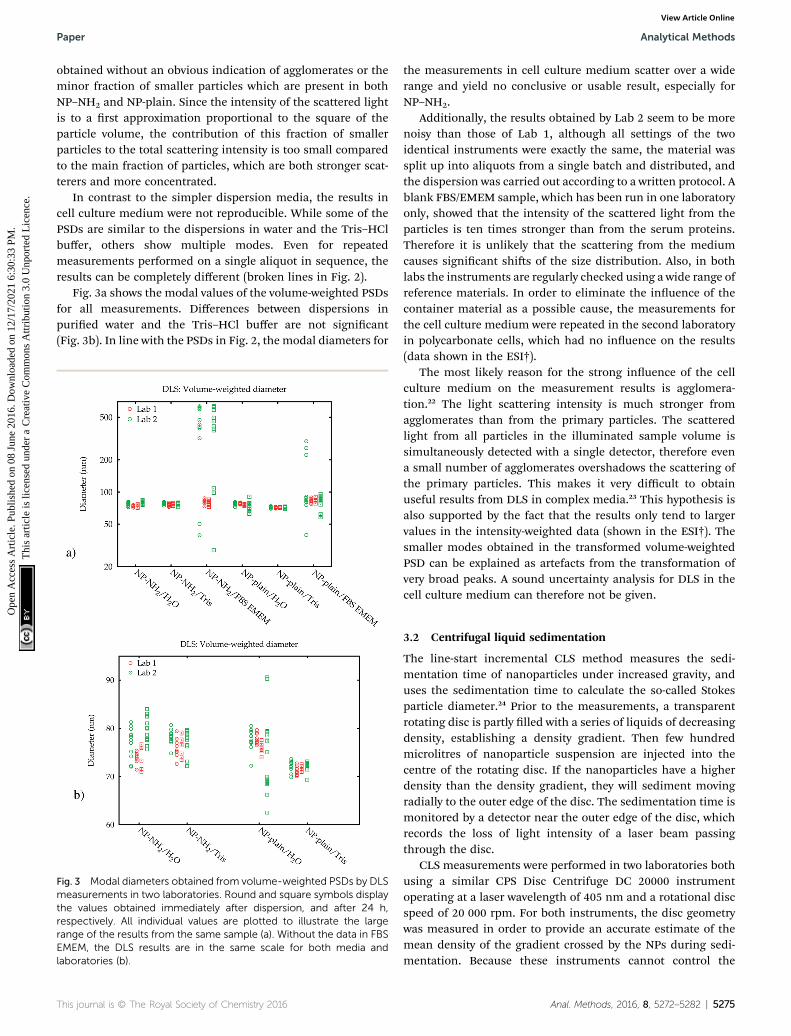
Fig. 3a shows the modal values of the volume-weighted PSDsfor all measurements. Differences between dispersions inpuried water and the Tris–HCl buffer are not signicant(Fig. 3b). In line with the PSDs in Fig. 2, the modal diameters for
Fig. 3 Modal diameters obtained from volume-weighted PSDs by DLSmeasurements in two laboratories. Round and square symbols displaythe values obtained immediately after dispersion, and after 24 h,respectively. All individual values are plotted to illustrate the largerange of the results from the same sample (a). Without the data in FBSEMEM, the DLS results are in the same scale for both media andlaboratories (b).
This journal is © The Royal Society of Chemistry 2016
the measurements in cell culture medium scatter over a widerange and yield no conclusive or usable result, especially forNP–NH2.
Additionally, the results obtained by Lab 2 seem to be morenoisy than those of Lab 1, although all settings of the twoidentical instruments were exactly the same, the material wassplit up into aliquots from a single batch and distributed, andthe dispersion was carried out according to a written protocol. Ablank FBS/EMEM sample, which has been run in one laboratoryonly, showed that the intensity of the scattered light from theparticles is ten times stronger than from the serum proteins.Therefore it is unlikely that the scattering from the mediumcauses signicant shis of the size distribution. Also, in bothlabs the instruments are regularly checked using a wide range ofreference materials. In order to eliminate the inuence of thecontainer material as a possible cause, the measurements forthe cell culture medium were repeated in the second laboratoryin polycarbonate cells, which had no inuence on the results(data shown in the ESI†).
The most likely reason for the strong inuence of the cellculture medium on the measurement results is agglomera-tion.22 The light scattering intensity is much stronger fromagglomerates than from the primary particles. The scatteredlight from all particles in the illuminated sample volume issimultaneously detected with a single detector, therefore evena small number of agglomerates overshadows the scattering ofthe primary particles. This makes it very difficult to obtainuseful results from DLS in complex media.23 This hypothesis isalso supported by the fact that the results only tend to largervalues in the intensity-weighted data (shown in the ESI†). Thesmaller modes obtained in the transformed volume-weightedPSD can be explained as artefacts from the transformation ofvery broad peaks. A sound uncertainty analysis for DLS in thecell culture medium can therefore not be given.
3.2 Centrifugal liquid sedimentation
The line-start incremental CLS method measures the sedi-mentation time of nanoparticles under increased gravity, anduses the sedimentation time to calculate the so-called Stokesparticle diameter.24 Prior to the measurements, a transparentrotating disc is partly lled with a series of liquids of decreasingdensity, establishing a density gradient. Then few hundredmicrolitres of nanoparticle suspension are injected into thecentre of the rotating disc. If the nanoparticles have a higherdensity than the density gradient, they will sediment movingradially to the outer edge of the disc. The sedimentation time ismonitored by a detector near the outer edge of the disc, whichrecords the loss of light intensity of a laser beam passingthrough the disc.
CLS measurements were performed in two laboratories bothusing a similar CPS Disc Centrifuge DC 20000 instrumentoperating at a laser wavelength of 405 nm and a rotational discspeed of 20 000 rpm. For both instruments, the disc geometrywas measured in order to provide an accurate estimate of themean density of the gradient crossed by the NPs during sedi-mentation. Because these instruments cannot control the
Anal. Methods, 2016, 8, 5272–5282 | 5275
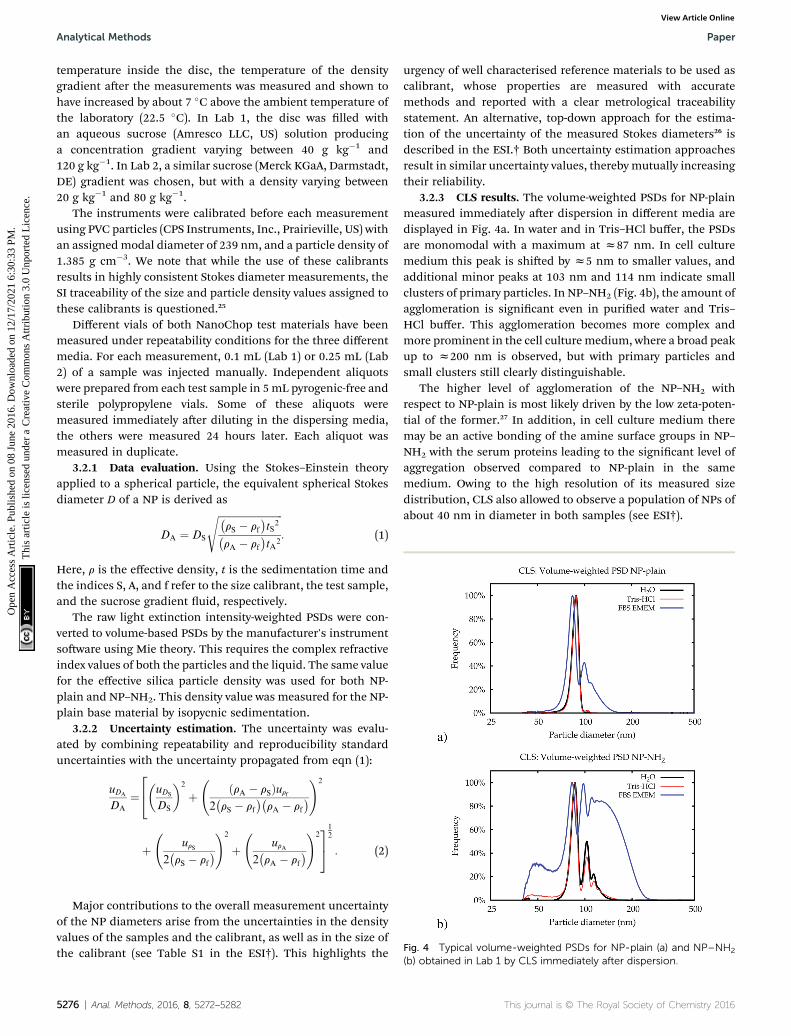
Fig. 4 Typical volume-weighted PSDs for NP-plain (a) and NP–NH2
Analytical Methods Paper
Ope
n A
cces
s A
rtic
le. P
ublis
hed
on 0
8 Ju
ne 2
016.
Dow
nloa
ded
on 1
2/17
/202
1 6:
30:3
3 PM
. T
his
artic
le is
lice
nsed
und
er a
Cre
ativ
e C
omm
ons
Attr
ibut
ion
3.0
Unp
orte
d L
icen
ce.
View Article Online
temperature inside the disc, the temperature of the densitygradient aer the measurements was measured and shown tohave increased by about 7 �C above the ambient temperature ofthe laboratory (22.5 �C). In Lab 1, the disc was lled withan aqueous sucrose (Amresco LLC, US) solution producinga concentration gradient varying between 40 g kg�1 and120 g kg�1. In Lab 2, a similar sucrose (Merck KGaA, Darmstadt,DE) gradient was chosen, but with a density varying between20 g kg�1 and 80 g kg�1.
The instruments were calibrated before each measurementusing PVC particles (CPS Instruments, Inc., Prairieville, US) withan assignedmodal diameter of 239 nm, and a particle density of1.385 g cm�3. We note that while the use of these calibrantsresults in highly consistent Stokes diameter measurements, theSI traceability of the size and particle density values assigned tothese calibrants is questioned.25
Different vials of both NanoChop test materials have beenmeasured under repeatability conditions for the three differentmedia. For each measurement, 0.1 mL (Lab 1) or 0.25 mL (Lab2) of a sample was injected manually. Independent aliquotswere prepared from each test sample in 5mL pyrogenic-free andsterile polypropylene vials. Some of these aliquots weremeasured immediately aer diluting in the dispersing media,the others were measured 24 hours later. Each aliquot wasmeasured in duplicate.
3.2.1 Data evaluation. Using the Stokes–Einstein theoryapplied to a spherical particle, the equivalent spherical Stokesdiameter D of a NP is derived as
DA ¼ DS
ffiffiffiffiffiffiffiffiffiffiffiffiffiffiffiffiffiffiffiffiffiffiffiffiffiffi�rS � rf
�tS
2�rA � rf
�tA2
s: (1)
Here, r is the effective density, t is the sedimentation time andthe indices S, A, and f refer to the size calibrant, the test sample,and the sucrose gradient uid, respectively.
The raw light extinction intensity-weighted PSDs were con-verted to volume-based PSDs by the manufacturer's instrumentsoware using Mie theory. This requires the complex refractiveindex values of both the particles and the liquid. The same valuefor the effective silica particle density was used for both NP-plain and NP–NH2. This density value was measured for the NP-plain base material by isopycnic sedimentation.
3.2.2 Uncertainty estimation. The uncertainty was evalu-ated by combining repeatability and reproducibility standarduncertainties with the uncertainty propagated from eqn (1):
uDA
DA
¼24�uDS
DS
�2
þ
ðrA � rSÞurf2�rS � rf
��rA � rf
�!2
þ
urS2�rS � rf
�!2
þ
urA2�rA � rf
�!235
12
: (2)
Major contributions to the overall measurement uncertaintyof the NP diameters arise from the uncertainties in the densityvalues of the samples and the calibrant, as well as in the size ofthe calibrant (see Table S1 in the ESI†). This highlights the
5276 | Anal. Methods, 2016, 8, 5272–5282
urgency of well characterised reference materials to be used ascalibrant, whose properties are measured with accuratemethods and reported with a clear metrological traceabilitystatement. An alternative, top-down approach for the estima-tion of the uncertainty of the measured Stokes diameters26 isdescribed in the ESI.† Both uncertainty estimation approachesresult in similar uncertainty values, thereby mutually increasingtheir reliability.
3.2.3 CLS results. The volume-weighted PSDs for NP-plainmeasured immediately aer dispersion in different media aredisplayed in Fig. 4a. In water and in Tris–HCl buffer, the PSDsare monomodal with a maximum at z87 nm. In cell culturemedium this peak is shied by z5 nm to smaller values, andadditional minor peaks at 103 nm and 114 nm indicate smallclusters of primary particles. In NP–NH2 (Fig. 4b), the amount ofagglomeration is signicant even in puried water and Tris–HCl buffer. This agglomeration becomes more complex andmore prominent in the cell culture medium, where a broad peakup to z200 nm is observed, but with primary particles andsmall clusters still clearly distinguishable.
The higher level of agglomeration of the NP–NH2 withrespect to NP-plain is most likely driven by the low zeta-poten-tial of the former.27 In addition, in cell culture medium theremay be an active bonding of the amine surface groups in NP–NH2 with the serum proteins leading to the signicant level ofaggregation observed compared to NP-plain in the samemedium. Owing to the high resolution of its measured sizedistribution, CLS also allowed to observe a population of NPs ofabout 40 nm in diameter in both samples (see ESI†).
(b) obtained in Lab 1 by CLS immediately after dispersion.
This journal is © The Royal Society of Chemistry 2016

Paper Analytical Methods
Ope
n A
cces
s A
rtic
le. P
ublis
hed
on 0
8 Ju
ne 2
016.
Dow
nloa
ded
on 1
2/17
/202
1 6:
30:3
3 PM
. T
his
artic
le is
lice
nsed
und
er a
Cre
ativ
e C
omm
ons
Attr
ibut
ion
3.0
Unp
orte
d L
icen
ce.
View Article Online
The modal values for the peak corresponding to the primaryparticles are displayed in Fig. 5. Within 24 h, no signicantchange of the measured Stokes diameters was observed. Whenmeasured in the cell culture medium, however, a signicantdecrease of the Stokes diameter of about 7 nm was observed forNP-plain and NP–NH2 compared with water and the Tris–HClbuffer. This may be explained by the inuence of the proteincorona on the sedimentation time of the particles. On the onehand the effective particle density decreases due to the lowdensity of the proteins, which increases the sedimentationtime, while on the other hand the particle diameter increases,which decreases the sedimentation time. Due to the oppositeeffects of both mechanisms, the interpretation of the Stokesdiameter derived from the sedimentation time is not straight-forward. Additional assumptions about the protein densitywould be required to convert the sedimentation time into a corediameter and shell thickness.28–30
3.3 Small-angle X-ray scattering
Small-angle X-ray scattering (SAXS) is a method which evaluatesthe angular distribution of an X-ray beam scattered off thesuspended particles in the forward direction under smallangles.31 The scattering contrast is caused by electron densitydifferences in the sample. The scattering data is given by thescattering intensity I(q) as a function of the momentum transfer
qðqÞ ¼ 4p
lsin q; (3)
where l is the wavelength of the X-ray beam and q is half of thescattering angle. For sufficiently monodisperse particlesuspensions, the scattering curve I(q) shows pronounced oscil-lations, which depend on the particle diameter and can beevaluated by tting the scattered intensity with a model.
Fig. 5 Comparison of the volume-weighted modal diameters of theprimary peak from the CLS measurements in Lab 1. The error barsrepresent the combined standard uncertainty limited to the contri-butions relevant for comparing between CLS results. The data fromLab 2 can be found in the ESI.†
This journal is © The Royal Society of Chemistry 2016
The SAXS experiments were performed at the four-crystalmonochromator (FCM) beamline of PTB at BESSY II.32 Thesamples in suspension were lled into disposable borosilicateglass capillaries with an inner diameter of 1 mm and a wallthickness of 10 mm. The capillaries were closed by welding theupper end in the ame of a propane/oxygen torch. A sampleholder containing these capillaries was placed into a vacuumchamber equipped with a six-axes manipulator for samplemovement. The synchrotron radiation was collimated usingpinholes to a size smaller than 0.5 � 0.5 mm2 and focused onthe sample. The incident photon ux was measured usinga transparent photodiode located in front of the sample beforethe guard pinhole. A removable, calibrated diode behind thesample was used to measure the transmission of the sample.The scattered radiation was collected by a PILATUS 1 M detectorwith a pixel size of p ¼ (172.1 � 0.2) mm at an adjustabledistance between 2 m and 4.5 m behind the sample.33
The measurements were performed at a photon energy of(8000.0 � 0.8) eV. Each sample was recorded for an integrationtime of at least 300 s. In addition to the samples, the corre-sponding dispersion media were measured as a blank.The distance between the sample and the detector was set to(4540.2 � 0.5) mm.
3.3.1 Data evaluation. The scattering curves were normal-ized by incident ux, exposure time and sample transmission.The scattering of the corresponding blanks was then subtractedfrom the scattering of the dispersions. A model equationdescribing polydisperse solid spherical particles witha Gaussian size distribution was tted to the data using least-squares adjustment. An additive background comprisinga constant intensity and another population of smaller sphereswith a Gaussian size distribution was assumed. This t and thecorresponding PSD are displayed in Fig. 6.
3.3.2 Uncertainty estimation. The particle diameter isderived from the intensity I(q) as a function of the momentumtransfer
qðxÞ ¼ 4pE
hcsin�tan�1 px
2L
�z
2pE
hc
px
L; (4)
where x is the distance from the centre of the beam in pixels, p isthe pixel size of the detector, E is the photon energy of the X-raybeam, and L is the distance from the sample to the detector. Theresulting mean particle diameter is inversely proportional to q,and thus the relative uncertainties of E, p, and L are combinedto the relative uncertainty of the measured mean diameter. Thewavelength l, and thus the photon energy E, can be traced backto the SI unit metre via back-reection from a silicon crystal forwhich the lattice constant is known.32
The uncertainty contribution of the model tting to thenumber-weighted mean particle diameter was estimated fromthe residual sum of squares c2 of this t by nding the deviationfrom the best t diameter at which c2 exceeds 2cmin
2.34
3.3.3 SAXS results. Fig. 7 displays the modal diametersextracted from the data for all measurements. All results agreewithin their stated standard uncertainties. The uncertaintiesare mostly dominated by the mathematical model which wasimposed on the X-ray scattering curve. However, the precision of
Anal. Methods, 2016, 8, 5272–5282 | 5277

Fig. 6 SAXS curve for NP–NH2 in cell culture medium immediatelyafter dispersion (symbols) and model fit (solid red line). The insetdisplays the resulting PSD for number- and volume-weighting (red andblue line, respectively).
Fig. 7 Comparison of the volume-weighted modal diameters fromthe SAXSmeasurements. The error bars denote standard uncertainties.
Analytical Methods Paper
Ope
n A
cces
s A
rtic
le. P
ublis
hed
on 0
8 Ju
ne 2
016.
Dow
nloa
ded
on 1
2/17
/202
1 6:
30:3
3 PM
. T
his
artic
le is
lice
nsed
und
er a
Cre
ativ
e C
omm
ons
Attr
ibut
ion
3.0
Unp
orte
d L
icen
ce.
View Article Online
the measurement results is only a small part of the total accu-racy, as also evidenced by the very close agreement (better than0.1 nm) of the measurement results immediately aer prepa-ration and aer 24 hours. Since the core particles of thesuspensions prepared from NP–NH2 and NP-plain are assumedto be identical, and since the measurements were all obtainedunder identical experimental conditions, a relative comparisoncan be carried out within this precision. The mean diameter ofNP–NH2 was about 1 nm larger compared to NP-plain, and inthe cell culture medium a very slight increase of the diameter byless than 1 nm was also observed.
The fraction of smaller particles in the 40 nm size rangeappeared in the background contribution. Even though thelarger primary particles are much stronger scatterers and alsomore concentrated, this size fraction could be resolved because
5278 | Anal. Methods, 2016, 8, 5272–5282
of the large disparity in size of the two fractions, which causesscattering into different angles. Still, the results were notconsistent across the different samples, caused by the vastlydifferent total scattering intensity. Therefore, this fraction wastreated as part of the background only and not quantitativelyevaluated.
3.4 Particle tracking analysis
Particle tracking analysis (PTA), also known as nanoparticletracking analysis or NTA, is a method which tracks individualnanoparticles in suspension that are moving under Brownianmotion. The sample is illuminated by a laser and a video of thelight scattered by the particles is recorded by a light-sensitivecamera through a magnifying objective. The Brownian motionof the particles is reconstructed from this video, and thetranslational diffusion constant and nally the size is inferredfrom the particle tracks. In order to distinguish the individualparticles, the sample must be dilute so that the mean particledistance is larger than the diffraction limit of the microscope.Consequently, the measurements were performed at a muchhigher dilution (z1500�) than with the other methods, and, incase of the cell culture medium, a higher concentration of theprotein molecules relative to the number of particles.
The PTA measurements were carried out with an NS500instrument, manufactured by NanoSight, Malvern InstrumentsLtd. This instrument was equipped with a 405 nm continuous-wave diode laser with a maximum power output of 60 mW. Thetemperature was set and maintained at (25 � 1) �C throughoutthe measurements. The performance of the instrument waschecked daily with NIST RM 8013 (Au nanoparticles, nominalmean diameter of 60 nm) diluted z 50� with puried waterwhich was additionally passed through a membrane lter witha nominal pore size of 0.1 mm. Aliquots were taken from thesamples with an automatic pipette using a new sterile plasticpipette tip for each aliquot. Prior to analysis, the material wasdiluted gravimetrically 1500� in the corresponding dispersionmedium and vortexed for 15 s. The measurements were per-formed immediately aer sample dispersion (0 h) and followinga 24 h incubation at (25 � 1) �C.
Movies were recorded over 160 s, with 30 s equilibration timeprior to each measurement. Camera levels were set to 9. Nouorescence long-pass lters were used.
3.4.1 Data evaluation. The NTA 3.0 soware was used toprocess and analyse the recorded videos. NTA 2.2 was also triedon the dataset, but the results of this older soware versionwere very noisy, especially in the cell culture medium, and weretherefore not considered. The following parameters were xed:the viscosity was set to 0.8905 mPa s, the detection thresholdwas set to 25, and the minimum particle size was set to 30 nm,the blur and minimum track length were set to automatic. Aminimum of 700 completed tracks were recorded permeasurement. The values reported are the mean of 9measurements of each sample with the corresponding standarduncertainty.
3.4.2 Uncertainty estimation. The measurement uncer-tainty was evaluated by combining the repeatability component,
This journal is © The Royal Society of Chemistry 2016

Fig. 8 PSDs obtained by PTA for NP–NH2 immediately afterdispersion.
Paper Analytical Methods
Ope
n A
cces
s A
rtic
le. P
ublis
hed
on 0
8 Ju
ne 2
016.
Dow
nloa
ded
on 1
2/17
/202
1 6:
30:3
3 PM
. T
his
artic
le is
lice
nsed
und
er a
Cre
ativ
e C
omm
ons
Attr
ibut
ion
3.0
Unp
orte
d L
icen
ce.
View Article Online
calculated from n ¼ 3 measurements performed on one daywith the reproducibility contribution, taken as intermediateprecision between n ¼ 3 different days. A trueness contributioncould not be evaluated for the silica NPs due to the lack of like-for-like certied reference materials available, therefore notadded to the overall uncertainty. Daily measurements of a goldnanoparticle reference material (NIST RM 8013) showed nosignicant difference between the PTA measurement result andthe DLS value assigned to the RM. However, when the number-weighted PTA PSD was converted into a volume-weighted PSD,a considerable bias was observed between the PTA results andthe DLS assigned value. For this reason, only number-weighteddistributions are considered for this technique.
3.4.3 PTA results. The PSDs for NP–NH2 are displayed inFig. 8. All PSDs were found to be essentially monomodal. Themodal values determined from the number-weighted PSDs forall dispersions are shown in Fig. 9. The apparent mean diameterof the particles which belong to the main size fraction increased
Fig. 9 Comparison of the number-weighted modal diameters ob-tained by PTA with standard uncertainties.
This journal is © The Royal Society of Chemistry 2016
signicantly from z80 nm in the Tris–HCl buffer up to z105nm in the cell culture medium. No signicant difference wasfound between both points in time or between water and theTris–HCl buffer. The smaller fraction of particles is below thedetection limit of the instrument and could not be found in thesamples.
4 Results and discussion
The data which were obtained with the different methods aresummarized in Fig. 10. The modal values for the suspensions inwater and the Tris–HCl buffer are displayed in number- andvolume-weight in Fig. 10a and b, respectively. In numberweighting, PTA, CLS and SAXS agree within their expanded(k ¼ 2) uncertainties, whereas DLS gives consistently lowerresults. Volume-weighted PSDs for PTA are not available, butthe other three methods agree on the volume-weighted data,with the exception of NP-plain in the Tris–HCl buffer, whereDLS reports a slightly smaller value.
As an example of the behaviour of the particle size analysismethods in the cell culture medium, the PSDs for NP–NH2
immediately aer dispersion are shown in number- andvolume-weight in Fig. 10e and f, respectively. Both SAXS andCLS show a sharp maximum around 80 nm and a broader peakbelow 50 nm. The CLS volume-weighted distribution containsan additional broader peak between 100 nm and 200 nm, withdistinct peaks at 100 nm and 110 nm of the same widthapproximately as the primary peak, but with a smaller height.
The DLS results in cell culture medium are inconsistent anddiffer signicantly from the other methods. This can be mostprobably attributed to agglomeration induced by the medium,which can easily distort DLS due to the high sensitivity to largerparticles. This effect is amplied by the subsequent conversionto a volume-weighted size distribution (see Fig. 3). Thus, DLS isuseful to monitor changes in a sample and to detect agglom-eration, but the size results are then completely dominated bythe agglomerates. DLS is therefore not considered in thecomparison of modal values in Fig. 10c and d.
Like DLS, PTA is based on the detection of Brownian motionand can provide critically important information for assessingthe impact of biological systems on the change in the hydro-dynamic diameter of the particles and, therefore, also about thethickness of the organic corona upon suspension in serumcontaining medium.35 Unlike DLS, PTA measurements did notsuffer from a severe degradation when applied to the disper-sions in the cell culture medium. However, these results couldonly be obtained using the NTA 3.0 soware version. Olderalgorithms were disturbed by measurements in cell culturemedia. Only number-weighted PSDs were directly obtainedusing this method. Volume-weighted PSD data can becomputed by the soware, but are not shown here, because theywere already systematically shied for reference particles, andno suitable certied matrix reference materials were available,that could be used as calibrants for bias correction.
Due to the physical principle of PTA, it is also not possible tomeasure the same high concentration of nanoparticles as withthe other methods. This means that for the measurements in
Anal. Methods, 2016, 8, 5272–5282 | 5279

Fig. 10 Comparison of the results. Themodal diameters determined for the dilution in water and Tris–HCl, directly after dispersion, are shown in(a) for number-weighted PSDs and in (b) for volume-weighted PSDs. The error bars denote expanded (k ¼ 2) uncertainties. In case of PTA theseare underestimated because the trueness contribution is not included. Themodal diameters measured in cell culturemedium are displayed in (c)and (d), respectively. Here, the error bars for PTA and CLS do not include the additional unknown uncertainty contribution for measurements incomplex media. Representative PSDs for the dispersion of NP–NH2 in cell culture medium are shown in (e) and (f). The two results for DLSobtained from two consecutive runs of the same aliquot (dashed and dash-dotted green line) illustrate the repeatability issues of DLS in complexmedia.
Analytical Methods Paper
Ope
n A
cces
s A
rtic
le. P
ublis
hed
on 0
8 Ju
ne 2
016.
Dow
nloa
ded
on 1
2/17
/202
1 6:
30:3
3 PM
. T
his
artic
le is
lice
nsed
und
er a
Cre
ativ
e C
omm
ons
Attr
ibut
ion
3.0
Unp
orte
d L
icen
ce.
View Article Online
the cell culture medium, the ratio of the serum proteins to thenumber of particles is much larger than with the othermethods. The serum protein molecules outnumber the nano-particles also in the dispersions used for the other methods bya factor of 5 � 103, therefore this option was more comparablethan the alternative of diluting the incubated particles in puri-ed water.
5280 | Anal. Methods, 2016, 8, 5272–5282
The modal diameters obtained for NP–NH2 and NP-plain incell culture medium at both points in time are compared inFig. 10c and d. Due to the very different physical principlesbehind the methods, the measured modal diameter is inu-enced differently by the changes in the samples effected by thecell culture medium.36 Meaningful PTA values are only availablefor the number-weighted distribution. Here, an increase in size
This journal is © The Royal Society of Chemistry 2016

Paper Analytical Methods
Ope
n A
cces
s A
rtic
le. P
ublis
hed
on 0
8 Ju
ne 2
016.
Dow
nloa
ded
on 1
2/17
/202
1 6:
30:3
3 PM
. T
his
artic
le is
lice
nsed
und
er a
Cre
ativ
e C
omm
ons
Attr
ibut
ion
3.0
Unp
orte
d L
icen
ce.
View Article Online
was observed which is signicant compared to the standard(but not expanded) uncertainty. Since the particle size is infer-red from the diffusion constant of the Brownian motion,a protein coating, probably with a rough surface, will lead toa decreased diffusion constant and an increased measured size.Though this increase has a large absolute value, it is notsignicant within a condence level of about 95% due to thelarge uncertainty of the value.
The size of the core of the primary particle fraction is bestresolved in the SAXS measurements, which show almost noindication of other fractions (agglomerates and smaller parti-cles). The SAXS technique is sensitive to the electron density ofthe particles. Since the primary particles are composed of densesilica material, the SAXS results are not affected by or sensitiveto the functional amino-groups on NP–NH2 and only minimallyby the (light) protein corona on the surface of the particles incell culture medium. Consequently, all SAXS measurementsagree within the standard uncertainties.
The CLS data allow the resolution of different fractions likeprimary particles and different levels of agglomeration. Theinterpretation of the measured modal size values, is, however,not straightforward, due to the opposite effects on sedimenta-tion time of the developing protein corona, which changessimultaneously the size and the average density of the parti-cles.22,30 Nevertheless, the size obtained for the primary particlefraction is consistent with the SAXS results within the expandeduncertainties.
5 Conclusion
Plain and amino-functionalized silica nanoparticles weremeasured using four size characterization techniques based ondifferent physical principles in three different suspendingmedia of increasing complexity, namely water, a Tris–HClbuffer, and a cell culture medium. Using a detailed uncertaintyanalysis for each method, the values for the main mode of thesize distribution could be compared between methods. It wasfound that there is agreement for simple media (water and Trisbuffer). The agglomeration of the nanoparticles induced by thecell culture medium had a signicant inuence on the DLSmeasurements, rendering the numerical results unusable, andled to a signicant size increase in PTA, whereas the primaryparticle size remained unchanged for SAXS and CLS measure-ments. The latter technique can additionally be used to distin-guish between agglomerates of different sizes.
Acknowledgements
This work was partly funded through a contract with theEuropean Metrology Research Programme (EMRP project NEW03 NanoChOp). The EMRP is jointly funded by the EMRPparticipating countries within EURAMET and the EuropeanUnion. The authors thank Daniel Geißler from Bundesanstaltfur Materialforschung und -prufung (BAM) for carrying outsupporting DLS measurements and for help with samplehandling.
This journal is © The Royal Society of Chemistry 2016
References
1 R. Peters, E. Kramer, A. G. Oomen, Z. E. Herrera Rivera,G. Oegema, P. C. Tromp, R. Fokkink, A. Rietveld,H. J. P. Marvin, S. Weigel, A. A. C. M. Peijnenburg andH. Bouwmeester, ACS Nano, 2012, 6, 2441–2451.
2 A. Weir, P. Westerhoff, L. Fabricius, K. Hristovski and N. vonGoetz, Environ. Sci. Technol., 2012, 46, 2242–2250.
3 L. Calzolai, D. Gilliland and F. Rossi, Food Addit. Contam.,Part A, 2012, 29, 1183–1193.
4 S. Dekkers, P. Krystek, R. J. B. Peters, D. P. K. Lankveld,B. G. H. Bokkers, P. H. van Hoeven-Arentzen,H. Bouwmeester and A. G. Oomen, Nanotoxicology, 2010, 5,393–405.
5 A. E. Nel, L. Madler, D. Velegol, T. Xia, E. M. V. Hoek,P. Somasundaran, F. Klaessig, V. Castranova andM. Thompson, Nat. Mater., 2009, 8, 543–557.
6 Compendium of Projects in the European NanoSafetyCluster, 2015, http://www.nanosafetycluster.eu/home/european-nanosafety-cluster-compendium.html.
7 European Commission, Recommendation of 18/10/2011(2011/696/EU), 2011, http://eur-lex.europa.eu/legal-content/EN/TXT/?uri¼CELEX:32011H0696.
8 F. Meli, T. Klein, E. Buhr, C. G. Frase, G. Gleber, M. Krumrey,A. Duta, S. Duta, V. Korpelainen, R. Bellotti, G. B. Picotto,R. D. Boyd and A. Cuenat, Meas. Sci. Technol., 2012, 23,125005.
9 M. P. Monopoli, C. Aberg, A. Salvati and K. A. Dawson, Nat.Nanotechnol., 2012, 7, 779–786.
10 M. Lundqvist, J. Stigler, G. Elia, I. Lynch, T. Cedervall andK. A. Dawson, PNAS, 2008, 105, 14265–14270.
11 F. Wang, L. Yu, M. P. Monopoli, P. Sandin, E. Mahon,A. Salvati and K. A. Dawson, Nanomedicine, 2013, 9, 1159–1168.
12 U. Hansen and A. F. Thunemann, Langmuir, 2015, 31, 6842–6852.
13 K. Braeckmans, K. Buyens, W. Bouquet, C. Vervaet, P. Joye,F. D. Vos, L. Plawinski, L. Doeuvre, E. Angles-Cano,N. N. Sanders, J. Demeester and S. C. D. Smedt, Nano Lett.,2010, 10, 4435–4442.
14 G. Orts-Gil, K. Natte and W. Osterle, RSC Adv., 2013, 3,18202–18215.
15 Y.-X. Yang, Z.-M. Song, B. Cheng, K. Xiang, X.-X. Chen,J.-H. Liu, A. Cao, Y. Wang, Y. Liu and H. Wang, J. Appl.Toxicol., 2014, 34, 424–435.
16 G. Roebben, K. Rasmussen, V. Kestens, T. P. J. Linsinger,H. Rauscher, H. Emons and H. Stamm, J. Nanopart. Res.,2013, 15, 1–13.
17 Colloidal Silica Products Klebosol, Colloidal silica ParticleSize, Silica Content & Stabiliser Type.
18 J. S. Gray, J. M. Birmingham and J. I. Fenton, Biologicals,2010, 38, 273–277.
19 G. Roebben, V. Kestens, Z. Varga, J. Charoud-Got, Y. Ramaye,C. Gollwitzer, D. Bartczak, D. Geißler, J. Noble, S. Mazoua,N. Meeus, P. Corbisier, M. Palmai, J. Mihaly, M. Krumrey,
Anal. Methods, 2016, 8, 5272–5282 | 5281

Analytical Methods Paper
Ope
n A
cces
s A
rtic
le. P
ublis
hed
on 0
8 Ju
ne 2
016.
Dow
nloa
ded
on 1
2/17
/202
1 6:
30:3
3 PM
. T
his
artic
le is
lice
nsed
und
er a
Cre
ativ
e C
omm
ons
Attr
ibut
ion
3.0
Unp
orte
d L
icen
ce.
View Article Online
J. Davies, U. Resch-Genger, N. Kumarswami, C. Minelli,A. Sikora and H. Goenaga-Infante, Front. Chem., 2015, 56.
20 ISO, Particle Size Analysis – Dynamic Light Scattering (DLS),International Organization for Standardization, ISO 22412,2008.
21 S. W. Provencher, Comput. Phys. Commun., 1982, 27, 213–227.
22 N. Hondow, R. Brydson, P. Wang, M. D. Holton, M. R. Brown,P. Rees, H. D. Summers and A. Brown, J. Nanopart. Res.,2012, 14, 1–15.
23 G. Orts-Gil, K. Natte, D. Drescher, H. Bresch, A. Mantion,J. Kneipp and W. Osterle, J. Nanopart. Res., 2010, 13, 1593–1604.
24 ISO, Determination of Particle Size Distribution by CentrifugalLiquid Sedimentation Methods – Part 2: PhotocentrifugeMethod, International Organization for Standardization,ISO 13318-2, 2007.
25 V. Kestens and G. Roebben, The Certication of the EquivalentSpherical Diameters of Silica Nanoparticles in AqueousSolution, ERM®- FD102, 2014.
26 A. Braun, O. Couteau, K. Franks, V. Kestens, G. Roebben,A. Lamberty and T. P. J. Linsinger, Adv. Powder Technol.,2011, 22, 766–770.
5282 | Anal. Methods, 2016, 8, 5272–5282
27 A. Sikora, D. Bartczak, D. Geißler, V. Kestens, G. Roebben,Y. Ramaye, Z. Varga, M. Palmai, A. G. Shard, H. Goenaga-Infante and C. Minelli, Anal. Methods, 2015, 7, 9835–9843.
28 M. P. Monopoli, D. Walczyk, A. Campbell, G. Elia, I. Lynch,F. Baldelli Bombelli and K. A. Dawson, J. Am. Chem. Soc.,2011, 133, 2525–2534.
29 N. C. Bell, C. Minelli and A. G. Shard, Anal. Methods, 2013, 5,4591–4601.
30 A. Sikora, A. G. Shard and C. Minelli, Langmuir, 2016, 32,2216–2224.
31 ISO, Particle Size Analysis – Small-angle X-ray Scattering,International Organization for Standardization, ISO 17867,2015.
32 M. Krumrey and G. Ulm, Nucl. Instrum. Methods Phys. Res.,Sect. A, 2001, 467–468, 1175–1178.
33 J. Wernecke, C. Gollwitzer, P. Muller and M. Krumrey,J. Synchrotron Radiat., 2014, 21, 529–536.
34 I. Hughes and T. P. A. Hase, Measurements and TheirUncertainties: a Practical Guide to Modern Error Analysis,Oxford University Press, Oxford, New York, NY, 2010.
35 D. Bartczak, P. Vincent and H. Goenaga-Infante, Anal. Chem.,2015, 87, 5482–5485.
36 V. Poderys, M. Matulionyte, A. Selskis and R. Rotomskis,Nanoscale Res. Lett., 2010, 6, 9.
This journal is © The Royal Society of Chemistry 2016