a comparison of accurate automatic hippocampal ...adni.loni.usc.edu/adni-publications/zandifar)...
TRANSCRIPT

A comparison of accurate automatic hippocampal
segmentation methods
Azar Zandifar, Vladimir Fonov, Pierrick Coupe, Jens Pruessner, D Louis
Collins
To cite this version:
Azar Zandifar, Vladimir Fonov, Pierrick Coupe, Jens Pruessner, D Louis Collins. A comparisonof accurate automatic hippocampal segmentation methods. NeuroImage, Elsevier, 2017, .
HAL Id: hal-01520108
https://hal.archives-ouvertes.fr/hal-01520108
Submitted on 9 May 2017
HAL is a multi-disciplinary open accessarchive for the deposit and dissemination of sci-entific research documents, whether they are pub-lished or not. The documents may come fromteaching and research institutions in France orabroad, or from public or private research centers.
L’archive ouverte pluridisciplinaire HAL, estdestinee au depot et a la diffusion de documentsscientifiques de niveau recherche, publies ou non,emanant des etablissements d’enseignement et derecherche francais ou etrangers, des laboratoirespublics ou prives.
Distributed under a Creative Commons Attribution - NonCommercial - NoDerivatives 4.0International License

A comparison of accurate automatic hippocampal
segmentation methods
Azar Zandifara,b, Vladimir Fonova, Pierrick Coupec,d, Jens Pruessnere, D.Louis Collinsa,b, for the Alzheimer’s Disease Neuroimaging Initiative1
aMcConnell Brain Imaging Centre, Montreal Neurological Institute, McGill University,
Montreal, Canada
bDepartment of Biomedical Engineering, McGill University, Montreal, Canada
cUniv. Bordeaux, LaBRI, UMR 5800, PICTURA, F-33400 Talence, France.
dCNRS, LaBRI, UMR 5800, PICTURA, F-33400 Talence, France.
eMcGill University Research Centre for Studies in Aging
Abstract
The hippocampus is one of the first brain structures a↵ected by Alzheimer’s
disease (AD). While many automatic methods for hippocampal segmentation
exist, few studies have compared them on the same data. In this study, we
compare four fully automated hippocampal segmentation methods in terms of
their conformity with manual segmentation and their ability to be used as an
AD biomarker in clinical settings. We also apply error correction to the four
automatic segmentation methods, and complete a comprehensive validation to
investigate di↵erences between the methods. The e↵ect size and classification
performance is measured for AD versus normal control (NC) groups and for
stable mild cognitive impairment (sMCI) versus progressive mild cognitive im-
pairment (pMCI) groups. Our study shows that the nonlinear patch-based
segmentation method with error correction is the most accurate automatic seg-
mentation method and yields the most conformity with manual segmentation
( = 0.894). The largest e↵ect size between AD versus NC and sMCI versus
pMCI is produced by FreeSurfer with error correction. . We further show that,
1Data used in preparation of this article were obtained from the Alzheimer’s Disease Neu-roimaging Initiative (ADNI) database (adni.loni.usc.edu). As such, the investigators withinthe ADNI contributed to the design and implementation of ADNI and/or provided data butdid not participate in analysis or writing of this report. A complete listing of ADNI investiga-tors can be found at: http://adni.loni.usc.edu/wp-content/uploads/how_to_apply/ADNI_Acknowledgement_List.pdf
Preprint submitted to NeuroImage April 5, 2017

using only hippocampal volume, age, and sex as features, the area under the re-
ceiver operating characteristic curve reaches up to 0.8813 for AD versus NC and
0.6451 for sMCI versus pMCI. However, the automatic segmentation methods
are not significantly di↵erent in their performance.
Keywords: Hippocampal segmentation, Alzheimer’s disease, Dice’s ,
Cohen’s d, Area under receiver operating characteristic curve
1. Introduction
The hippocampus is part of the limbic system and is located in the temporal
lobe, medial to the inferior horn of the lateral ventricle. It plays an important
role in spatial navigation and consolidation of information from short-term to
long-term memory. Hippocampal neuronal degeneration and dysfunction has
been vastly studied in a large number of neurodegenerative diseases and mental
health disorders such as Alzheimer’s dementia [1], post-traumatic stress disor-
der [2], major depressive disorder [3], schizophrenia [4], and epilepsy [5].
Alzheimer’s disease (AD) is the most common cause of dementia [6]. The
global burden of AD is approximately 25 million people worldwide and is pre-
dicted to quadruple in prevalence by 2050 due to aging of the population [7].
As with most neurodegenerative diseases, early detection, before too much de-
generation of brain tissue occurs, may be crucial for e↵ective treatment.
A quantitative measure of the atrophy pattern can be obtained by segment-
ing di↵erent anatomical structures in magnetic resonance (MR) images. Many
recent studies have focused on hippocampal atrophy as one of the first AD
biomarkers, since the hippocampus is easier to segment than other medial tem-
poral lobe structures [8, 9, 10] and is highly sensitive to AD-related atrophic
patterns [11]. Manual segmentation of anatomical structures is often consid-
ered the gold standard for volumetric assessment. However, it is a laborious,
time-consuming task (taking between 30 and 120 minutes for hippocampal seg-
mentation) and su↵ers from both inter- and intra-rater variability. To overcome
these limitations, several semi- and fully automated methods have been devel-
2

oped for hippocampal segmentation [12, 13, 14, 8, 15, 16] (for a recent review,
see [17]).
Medial temporal lobe anatomy presents automatic segmentation procedures
with many nontrivial problems, the most important of which is the striking sim-
ilarity in the intensity distributions of di↵erent anatomical structures such as
the amygdala, hippocampus, and entorhinal cortex. As a result, di↵erent brain
structures cannot be di↵erentiated based solely on intensity information [13].
Furthermore, the high anatomical variability, low contrast, small size, and dis-
continuous boundaries of the hippocampus render its segmentation extremely
di�cult without the use of prior information [13].
Semi-automated methods use manual intervention as a first step in defining
seed points or bounding boxes [18]. Yet, even such a simple intervention can pose
a major challenge given the size of the databases used in clinical studies (e.g.,
the Alzheimer’s Disease Neuroimaging Initiative, ADNI, adni.loni.usc.edu).
To fully automate the segmentation procedure, some methods attempt to
integrate shape information using appearance-based strategies [15, 19]. Others
combine both level-set shape representation and statistical gray level informa-
tion [20, 16]. Template-based segmentation (or label propagation) is one of the
major categories in structural segmentation due to its e�cacy and accuracy. In
these methods, single [21], probabilistic or multiple templates [22, 23, 14, 12] are
used to spatially label the desired structure through a label propagation step.
FreeSurfer, a well-known segmentation tool [13], uses both probabilistic tem-
plate priors and intensity features from each anatomical structure to complete
the structure identification using a classifier.
Using only a single template can be suboptimal for several reasons: First,
the template may not be the best match to represent the target image; this
type of error may be more pronounced in a diseased population. In addition,
certain types of registration errors may be unavoidable, and any labeling error
resulting from imperfect manual segmentation may also a↵ect the segmentation
procedure [23].
Multi-template methods combine multiple templates to decrease these types
3

of errors. These methods define each voxel label by combining the labels derived
from multiple templates using a decision-making approach such as majority vot-
ing [23, 14, 12]. They are further improved by the use of similar templates from
a template library in segmenting a new subject. Multi-template methods im-
plicitly benefit from shape priors by using fine nonlinear registration. However,
this improvement comes at the expense of high computational burden. Further-
more, these methods weight each template equally and are therefore highly sus-
ceptible to registration error and template choice. Recently, inspired by nonlo-
cal means image-denoising techniques, a patch-based segmentation method has
been shown to reduce computational burden while preserving the segmentation
accuracy, accomplished by weighting each expert label based on the intensity
similarity with the to-be-segmented patch [12]. Patch-based methods have be-
come extremely popular in medical image segmentation and have been employed
in brain structure segmentation [12, 24, 25], lesion segmentation [26, 27], and
segmentation of cardiac MR images [28]. Di↵erent images can be e�ciently rep-
resented based on patches of a training library, and patch-based segmentation
methods serve as an example of a dictionary learning problem. A recent method
approached image segmentation based on discriminative dictionary learning and
sparse reconstruction [29]. However, patch-based methods are not without their
shortcomings. For example, the image similarity index over a small patch may
not be the optimal descriptor for the overall structure. The two approaches
(multi-template and patch-based) can be combined to take advantage of both
implicit shape priors of the non-linear registration and the robustness of patch-
based methods to segmentation errors [30, 31].
Despite the progress achieved by these di↵erent methods, segmentation er-
rors and mislabeled voxels remain unavoidable. Wang et al. 2011 presented a
machine learning approach to find and correct mislabeled voxels, which can be
used as a post hoc correction for any automatic segmentation method. For a
given image, their classifier investigates the automatic segmentation for the mis-
labeled voxels and corrects them. In addition, they showed that a patch-based
method with nonlinear registration can be further enhanced using this correc-
4

tion technique, producing the most accurate segmentation strategy developed
thus far [33].
Quantitative comparison of the various automatic segmentation methods
poses some di�culties. The reported results may be a↵ected by varying im-
age acquisition parameters, di↵erent manual structure segmentation protocols,
di↵erent gold standards, and di↵erent metrics. While manual segmentation is
used as the gold standard for automatic segmentation methods, there are di-
verse ways of segmenting anatomical structures. This inconsistency between
expert priors greatly a↵ects the comparison of di↵erent segmentation methods.
A reliable protocol for manual segmentation is crucial for a valid comparison.
To address the issues identified above, this study compares four di↵erent
automatic hippocampal segmentation methods, based on a well-defined man-
ual segmentation protocol, using the same dataset. We improve upon the four
methods using error correction [32] and then compare the resulting eight seg-
mentations. We also evaluate the power of these techniques to be used as an
AD biomarker. We characterize some of the factors that lead to more accurate
segmentation and further investigate whether this accuracy improves the ability
of hippocampal volumetry to distinguish between di↵erent AD clinical groups.
2. Materials & Methods
Among the di↵erent automatic hippocampal segmentation approaches re-
ported in a recent review from Dill et al. [17], multi-template segmentation
strategies appear to be the most accurate, with Dice’s kappa values ranging
from 0.72 to 0.91. Three of the four methods compared in this study are multi-
template segmentation methods. The first two methods (ANIMAL with tem-
plate library and label fusion; patch-based segmentation using expert priors)
were selected from the most successful and accurate segmentation methods,
with reported Dice’s kappa values of 0.88 [14, 12]. The third method (multi-
atlas labeling with population-specific template and nonlocal patch-based label
fusion) is an enhancement to Coupe et al. [12] using fine nonlinear registration,
5

with a Dice’s kappa of 0.89 [30].
We compared the three multi-template methods [14, 12, 30] using a common
training and testing dataset, manually segmented using the protocol presented
in [34]. Use of a common dataset avoids the inhomogeneity that might be im-
posed on comparative studies that evaluate di↵erent datasets. A fourth auto-
matic segmentation method, FreeSurfer (a well-known freely available tool) [13],
has shown better results in terms of agreement with manual segmentation in
comparison with both FSL/FIRST [35] and IBASPM [36]. Therefore, we also
compare hippocampal segmentation derived from FreeSurfer with manual seg-
mentation. Finally, since the wrapper-based error correction technique [32] can
be applied to any host segmentation strategy [31, 17], we applied the error
correction technique [32] to all four compared methods.
In the second part of the study, we estimated the power of each technique to
di↵erentiate between groups based on hippocampal volume. The methods were
compared based on their ability to di↵erentiate between AD and normal con-
trol (NC) groups (diagnosis ability) and between groups of subjects with stable
versus progressive mild cognitive impairment (MCI) (prognosis ability). In this
study, progressive MCI (pMCI) refers to MCI subjects who converted to AD
during three years of follow-up, and stable MCI (sMCI) refers to subjects who
maintained their MCI status. We measured e↵ect size and classification perfor-
mance, the latter measured by area under the receiver operating characteristic
(ROC) curve.
2.1. Datasets
Data used in the preparation of this article were obtained from the Alzheimer’s
Disease Neuroimaging Initiative (ADNI) database (adni.loni.usc.edu). The
ADNI was launched in 2003 as a public-private partnership. The project is the
result of e↵orts of many co-investigators from a broad range of academic insti-
tutions and private corporations led by Michael W. Weiner, MD, as principal
investigator. The primary goal of the ADNI has been to test whether serial MR
imaging, positron emission tomography (PET), other biomarkers, and clinical
6

and neuropsychological assessment can be combined to measure the progres-
sion of mild cognitive impairment (MCI) and early AD (for more information,
visit www.adni-info.org).
2.1.1. Experiment 1
To validate the di↵erent approaches to hippocampal automatic segmenta-
tion, we selected sixty 1.5 T images from the baseline ADNI scans. Selection
was based on age, sex, handedness, and years of education, so that the groups in
di↵erent clinical stages (NC (n=20), MCI (n=20), and AD (n=20)) were com-
parable in terms of age, sex, and median years of education (see table 1). This
dataset was used for training for all the selected methods, except for FreeSurfer,
both without and with error correction. In FreeSurfer, the segmentation was
performed based on its default training dataset. However, the labels are cor-
rected (in FreeSurfer with error correction) based on the dataset of 60 images
described above.
Table 1: Experiment 1: Dataset information. NC: normal controls; MCI: mild cognitive
impairment; AD: Alzheimer’s disease; MMSE: Mini-Mental State Examination.
NC MCI AD combined
Number 20 20 20 60
Median age at baseline (yrs) 75.5 75.6 74.9 75.2
Sex: female (%) 50% 50% 50% 50%
Median education (yrs) 16.0 16.0 15.5 16.0
Median MMSE score 29.5 27.5 23.0 27.0
2.1.2. Experiment 2
For the clinical grouping and power analysis study, we selected all the ADNI-
1 baseline visit 1.5T T1 MR images. The demographic information can be found
in Table 2.
7

Table 2: Experiment 2: Dataset information. NC: normal controls; sMCI: stable mild cog-
nitive impairment; pMCI: progressive mild cognitive impairment; AD: Alzheimer’s Disease;
MMSE: Mini-Mental State Examination.
NC sMCI pMCI AD
Number 231 240 168 199
Median age at baseline (yrs) 75.93 75.68 75.14 76.04
Sex: female (%) 48% 33% 39% 49%
Median MMSE score 29.0 27.5 26.0 23.0
2.2. Preprocessing
All selected images went through a preprocessing pipeline, consisting of de-
noising [37], N3 inhomogeneity correction [38], linear intensity normalization
based on histogram matching between the image and the average template,
and a�ne registration to ICBM152 template space with 1⇥ 1⇥ 1 mm3 resolu-
tion [39] using a population-specific template from the ADNI-1 database [40].
Lastly, all the images were coarsely aligned, and image intensities were normal-
ized within each image and among the whole database [10, 30, 14].
2.3. Manual Segmentation
The hippocampi were manually segmented on the first experimental dataset
(60 subjects from ADNI-1) using the manual segmentation protocol presented
in [34]. The labels were segmented on linearly transformed stereotaxic volumes.
We used the same preprocessed dataset as the direct input for all the auto-
mated segmentation methods to facilitate the comparison. The tracings were
performed by expert raters. Raters were blinded to the hemisphere (images were
randomly flipped left-right) and to the group (the filenames did not identify the
subject as NC, MCI, or AD).
8

2.4. Automatic Segmentation Methods
2.4.1. FreeSurfer
FreeSurfer is a suite of tools for analysis of human brain data obtained from
MR images and includes automatic segmentation of many macroscopically visi-
ble brain structures [41]. The tool performs subcortical structure segmentation
using the method presented in [13]. First, each image is linearly aligned with an
average template. A frequency histogram of possible structures (defined by the
spatial template prior) is used to compute the probability of a given anatomical
label occurring at a given location. The prior of a given spatial arrangement of
di↵erent labels is also incorporated into the segmentation.
The segmentation procedure is considered an anisotropic nonstationary Markov
random field. The probabilistic labels and corresponding predicted image inten-
sities are priors, and the intensity similarity between the target image and the
atlas is a likelihood term [13]. In this study, we used version 5.3.0 of FreeSurfer,
which is freely available from https://surfer.nmr.mgh.harvard.edu/.
2.4.2. ANIMAL with template library and label fusion
The ANIMAL segmentation method [42, 43] is enhanced with a multi-
template strategy [14]. The enhanced version benefits from a library of tem-
plates and label fusion of their corresponding propagated labels, while the orig-
inal ANIMAL method uses a single nonlinear averaged template. In ANIMAL,
the target image is nonlinearly warped to a template, which is manually seg-
mented by an expert. The structural voxel labels are propagated back to the
corresponding voxel in the target space using the inverse of the estimated nonlin-
ear transformation. However, the average template might not be representative
of the anatomy all subjects. To take into account anatomical variability, AN-
IMAL with template library and label fusion uses n most similar templates
(using normalized mutual information as the similarity metric) from a template
library. Then, an ANIMAL segmentation is performed using each of these tem-
plates. The final label is determined based on a majority voting step between
the n labels assigned to each voxel. The number of templates used for training
9

is n = 11, as suggested in the original paper [14]. Throughout the rest of this
paper, we refer to this method as ANIMAL with label fusion.
2.4.3. Patch-based segmentation using expert priors
The first patch-based approach to segment brain structures was proposed
in [12]. The algorithm attempts to determine a desired label for a voxel in the
target image based on similar patches of neighborhood voxels in the template
library. This label fusion step uses a nonlocal means estimator that weights each
of the template patch labels using an intensity-based similarity metric with
the target patch. Finally, the target patch’s label is defined by thresholding
the weighted average of its similar patches from the template library. Rigid
registration is only used in the segmentation procedure. The implementation is
described comprehensively in [12]. Throughout the rest of this paper, we refer
to this method as the patch-based method.
2.4.4. Multi-atlas labeling with population-specific template and nonlocal patch-
based label fusion
This method is a combination of the previously described patch-based seg-
mentation method with a population-specific nonlinear template construction [30,
31]. When creating a population-based average model, all individual templates
(and their labeled structures) are nonlinearly aligned [44] to the average model.
In this segmentation method, each target image is then nonlinearly warped
to the average template space, and the patch-based segmentation algorithm is
applied. Finally, the inverse of the nonlinear transformation is used to warp
the labels back to the subject’s native space. Since this method o↵ers an en-
hancement to the patch-based method by incorporating a nonlinearly aligned
template library, throughout the rest of this paper, we refer to this method as
the nonlinear patch-based method.
10

2.4.5. A learning-based wrapper method to correct systematic errors in auto-
matic image segmentation
Wang et al. 2011 presented a method that learns the pattern of mismatch
between automatic segmentation labels and their corresponding manual seg-
mentations. The method uses a classification technique in which the classifier
is trained by a set of automatically labeled voxels and their corresponding man-
ual segmentation. For an unseen image, the method corrects the mislabeled
segmentation using the learned pattern. Both intensity and neighborhood in-
formation are used as features to train an AdaBoost learner [45]. We applied
error correction to the four previously described methods. For error correction,
we used version 1.9 of the freely available online implementation of the method,
which can be found here http://www.nitrc.org/projects/segadapter. All
hyperparameters were set based on the original paper [32]. Throughout the rest
of this paper, we refer to the corrected version of each method as the method
with error correction.
2.5. Validation Schema
2.5.1. Experiment 1
To investigate segmentation accuracy, we used a leave-one-out (LOO) pro-
cedure to validate the methods. Specifically, for each subject in the 60-subject
dataset, the methods were trained with the other remaining 59 subjects and
their corresponding labels. For testing, the automatic segmentation of the one
subject is compared with its corresponding manual segmentation.
2.5.2. Experiment 2
As stated above, the entire ADNI-1 1.5 T dataset was used to investigate
the power of the segmented structure’s volume to act as an AD biomarker. We
used two classification experiments (NC vs AD, and sMCI vs pMCI) to evaluate
biomarker performance using a LOO procedure.
11

2.6. Metrics
2.6.1. Experiment 1
• Dice’s kappa metric
Volumetric overlap between each automatic segmentation method (i.e.,
FreeSurfer, ANIMAL with label fusion, patch-based, nonlinear patch-
based, and nonlinear patch-based with error correction) and manual seg-
mentation is measured using Dice’s kappa similarity index [46]. The kappa
index for two segmented labels is computed as follows:
= 2⇥ V(M) \V(A)
V(M) + V(A), (1)
where M and A represent a set of manually and automatically labeled
voxels, respectively. V(.) is the volume operator, while \ represents set
intersection. The value of varies between 0 and 1, where 1 indicates
the complete overlap between the manual segmentation and that of the
automatic method. Dice’s kappa similarity metric is computed by com-
paring the segmentation from each automatic method with the manual
segmentation for both left and right hippocampi. Since FreeSurfer uses a
di↵erent anatomical definition of the hippocampus for training, we expect
its values will not be as high as those for the other methods.
• Intraclass correlation coe�cient
We used the regression coe�cient and the intraclass correlation coe�-
cient (ICC) to show the similarities between automatically and manually
segmented volumes [47].
2.6.2. Experiment 2
• Cohen’s d e↵ect size
In order to investigate the sensitivity of each method in detecting between-
group di↵erences in a clinical setting, we computed Cohen’s d e↵ect size
based on the hippocampal volumes derived by each automatic segmenta-
tion method. Cohen’s d e↵ect size measures the separability of two normal
12

distributions. It is computed as follows:
Cohen’s d =m1 �m2
SDPooled(2)
SDPooled =
sSD1
2 + SD22
2, (3)
where m and SD are the mean and standard deviation, respectively.
• Receiver operating characteristic curve
To assess the performance of each method in detecting the clinical state
of single subjects, we trained and tested a linear discriminant analysis
(LDA) classifier to assign the subjects to di↵erent groups. We used the
LDA classifier in two di↵erent classification tasks: to assign subjects to
either the AD or NC group and to either the sMCI or pMCI group. For
this problem, we used a simple linear classifier fed with mean hippocampal
volumes along with age and sex as features. We used scikit-learn [48], a
Python-based implementation of LDA, and all the hyperparameters were
set to their default values. The classification task is evaluated based on
ROC curves, which are calculated through a LOO cross-validation proce-
dure. Since separate training and test datasets are used in this framework,
classification analysis yields a more conservative performance evaluation
than Cohen’s d e↵ect size.
3. Experiment 1: Results
3.1. Dice’s kappa metric
The distribution is shown for the left and right hippocampus respectively
in Figure 1 and is summarized numerically in Table 3. The nonlinear patch-
based segmentation method with error correction yields the highest median
( = 0.894 and 0.894 for the left and right hippocampus, respectively). These
values are among the highest Dice’s kappas reported in the literature [17]. A
two-way repeated measures ANOVA, with segmentation method and the hemi-
sphere in which the structure is located as independent variables, shows that
13

the di↵erences between the values for di↵erent methods are significant, while
no significant di↵erence was observed when considering either left or right hemi-
sphere. A post hoc paired Wilcoxon test with Bonferroni correction for multiple
comparisons shows that the nonlinear patch-based method with error correction
has the most overlap with manual segmentation, and the di↵erence is statisti-
cally significant. The pairwise comparison further shows that all the di↵erences
are significant (p < .01), except between FreeSurfer with error correction and
ANIMAL with label fusion both with and without error correction, as well
as between the patch-based method with error correction and the nonlinear
patch-based method. The same pattern was observed for both left and right
hippocampi. The test shows that the di↵erence between each method and its
corresponding error corrected version is statistically significant. Furthermore,
the large bias of FreeSurfer was expected due to a di↵erent anatomical definition
of the hippocampus in its training phase.
Table 3: statistical results for segmentation methods.
Method Left Hippocampus Right Hippocampus
FreeSurfer 0.770 (0.049) 0.769 (0.048)
FreeSurfer with EC 0.867 (0.033) 0.870 (0.031)
ANIMAL with label fusion 0.862 (0.028) 0.861 (0.032)
ANIMAL with label fusion with EC 0.867 (0.024) 0.870 (0.030)
Patch-based 0.879 (0.025) 0.879 (0.036)
Patch-based with EC 0.888 (0.025) 0.890 (0.036)
Nonlinear patch-based 0.887 (0.022) 0.885 (0.032)
Nonlinear patch-based with EC 0.894 (0.021) 0.894 (0.031)Values are median , with standard deviation in parentheses.
14

Freesurfer ANIMAL−LF Pb nlin. Pb
●
●
●●
0.867
0.770
●●
●
●●
●
0.870
0.769
●● ●
●●
0.867 0.862
●●
●
●
0.870 0.861
●●
●
0.888 0.879
●
●
●
●
●●
●
●
●
0.890 0.879
●●
0.894 0.887
●
●●
●
●
●●
0.894 0.885
0.6
0.7
0.8
0.9
1.0
0.6
0.7
0.8
0.9
1.0
LeftR
ight
Corrected Original Corrected Original Corrected Original Corrected Original
Error Correction
Kap
pa
Error Correction
Corrected
Original
Figure 1: Method comparison. Kappa index distribution for di↵erent methods with and
without error correction for both hippocampi (Top: left; Bottom: right). Methods, from left
to right: FreeSurfer, ANIMAL with label fusion, patch-based (Pb), nonlinear patch-based
(nlin. Pb). Original method in red; error-corrected version in blue.
3.2. Volumetric Correlation
Figure 2 shows the volumetric correlations between manual segmentation
and the di↵erent automatic segmentation methods. In this study, we consider
the raters (automatic and manual segmentation methods) to be fixed e↵ects.
The results show that the nonlinear patch-based method, with and without error
correction, shows the highest correlation with manually segmented volumes for
both the left and right hippocampi. The ICC values can be found in Table 4
for both left and right hippocampi for each method.
A two-way repeated measures ANOVA of manually and automatically seg-
mented hippocampal volume di↵erence, with segmentation method and hemi-
sphere as independent variables, shows that volumetric di↵erences are significant
for between-methods, but not between the left and right hemispheres. A post
hoc paired Wilcoxon test with Bonferroni correction for multiple comparisons
shows that the di↵erence between the volumes measured by automatic and man-
15

ual segmentation is insignificant for all methods, except for FreeSurfer, for which
there was a significant di↵erence when compared with manual segmentation and
with all other methods (p < .001).
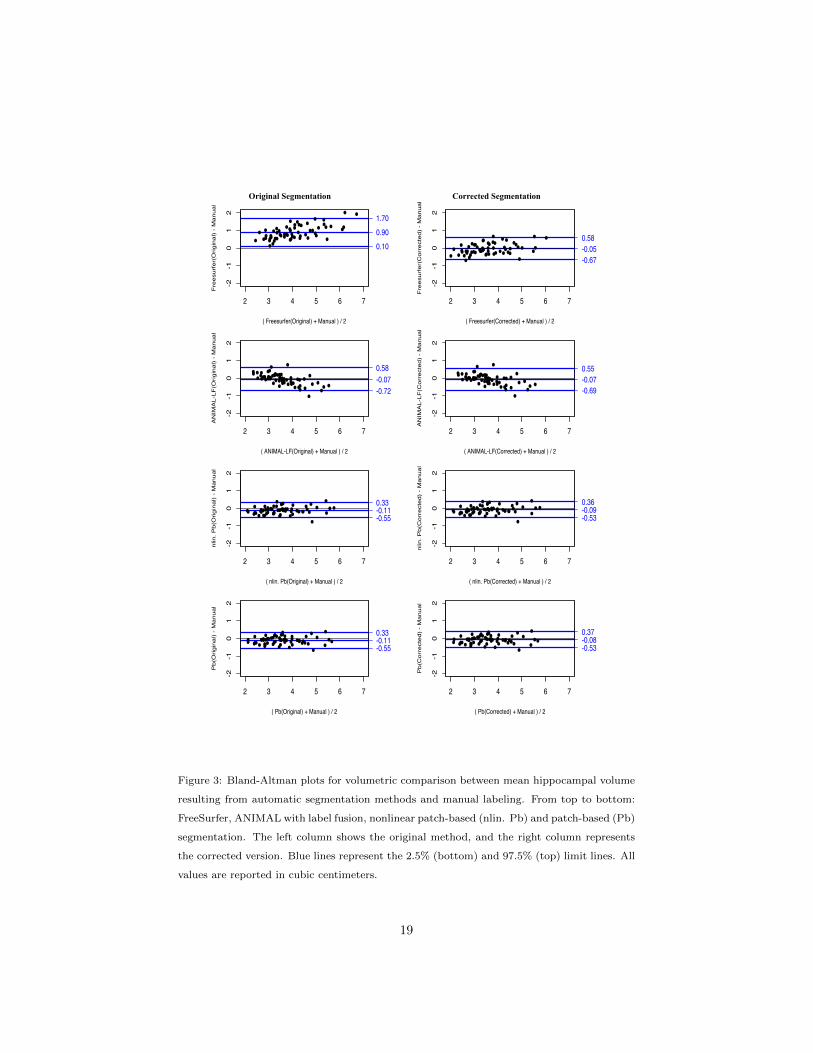
Bland-Altman plots (Figure 3, Table 5) show that FreeSurfer oversegments
the structure and furthermore has a tendency to oversegment larger hippocampi
more so than smaller ones. An opposite tendency was observed for ANIMAL
with label fusion. That method has a slight bias toward undersegmenting, and
undersegmentation is more dominant for larger hippocampi, while smaller ones
tend to be oversegmented. No significant pattern of di↵erence between small and
large hippocampi was observed in either of the other two methods. The plots
show that error correction can be considered a bias correction technique, since
the magnitude of the mean bias is reduced for each method.. Error correction
is more successful when applied to methods with large bias, such as FreeSurfer,
whereas in the case of the methods with small bias, such as the patch-based
techniques, error correction showed little improvement to segmentation perfor-
mance. However, the variance of the pattern of di↵erences between automatic
and manual segmentations is still observable after the correction step has been
applied.
16

Left Right
●
●
●
●
●
●
●
●
●
●
●
●
●
●
●
●
●
●●
●
●
●
●
●
●
●
●
●
●
●
●
●
●
●
●
●●
●
●
●
●
●
●
●
●
●
●
●
●
●
●
●
●
●
●
●
●
●
●
●
●
●
●
●
●
●
●
●
●
●
●
●
●
●
●
●
●
●
●
●
●
●
●
●
●
●
●
●
●
●●
●
●
●●
●
●
●
●
●
●
●
●
●
●
●
●
●
●
●
●
●
●
●
●
●
●
●
●
●
ICC=0.93ICC=0.91
●●
●●
●●
●●
●●
●●
●●
●●
●●
●●●●
●● ●●
●●
●●
●●
●●
●●
●●●●
●●
●●
●●
●●●●●●
●●
●●
●●
●●
●●
●●
●●●●
●●●●
●●
●●
●●
●●
●●
●●
●●
●●
●●●●
●●
●●
●●
●●
●●
●●
●●
●●
●●●●
●● ●●
●●
●●
ICC=0.92ICC=0.91
●●
●●
●●
●●
●●
●●
●●
●●
●●
●●●●
●●
●●●●
●●
●●
●●
●●
●●●●
●●
●●
●●
●● ●●●●
●●
●●
●●
●●
●●
●●●●
●●
●●●●
●●
●●
●●
●●
●●
●●
●●
●●
●●●●
●●●●
●●
●●
●●
●●
●●
●●
●●
●●
●●
●●
●●
●●
ICC=0.97ICC=0.96
●●
●●
●●
●●
●●
●●
●●
●●
●●
●●
●●
●●
●●●●
●●
●●
●●
●●
●●
●●
●●
●●
●●
●●
●●
●●
●●
●●
●●
●●
●●
●●●●
●●
●●●●●●
●●
●●
●●
●●
●●
●●
●●
●●●●
●●
●●
●●
●●
●●
●●
●●
●●
●●
●●
●●
●●
●●
●●
ICC=0.97ICC=0.97
●
●
●
●
●
●
●
● ●
●
●
●
●
●
●
●
●
●
●
●
●
●
●
●
●
●
●
●
●
●
●
●
●
●
●
●●
●
●
●
●
●
●
●
●
●
●
●
●
●
●
●
●
●
●
●
●
●
●
●
●
●
●
●
●
●●
●
●
●
●
● ●
●
●
●
●
●
●
●
●
●
●
●
●
●
●
●
●
●
●
●●
●
●
●
●
●
●
●
●
●●
●
●
●
●
●
●
●
●
●
●
●●
●
●
●
●
●
ICC=0.94ICC=0.92
●●
●●
●●
●●
●●
●●
●●●●
●●
●●
●●
●●●●●●
●●
●●
●●
●●
●●●●
●●
●●
●●
●●
●●
●●●●
●●
●●
●●
●●
●●
●●
●●
●●
●●●●
●●
●●
●●
●●
●●
●●
●●
●●
●● ●●●●
●●
●●
●●
●●
●●
●●
●●
●●
●●●●
●●
●●
ICC=0.90ICC=0.89
●●
●●
●●
●●
●●
●●
●●
●●
●●
●●
●●
●●
●●●●
●●
●●
●●
●●
●●
●●
●●
●●
●●
●●●●
●●●●
●●
●●
●●
●●
●●
●●
●●
●●
●●●●
●●
●●
●●
●●
●●
●●
●●
●●
●● ●●●●
●●
●●
●●
●●
●●
●●
●●
●●
●●●●
●●
●●
ICC=0.94ICC=0.94
●●
●●
●●
●●
●●
●●
●●
●●
●●
●●
●●
●●●●
●●
●●
●●
●●
●●
●●
●●
●●
●●
●●
●●
●●
●●●●
●●
●●
●●
●●
●●
●●
●●
●●
●● ●●
●●
●●
●●
●●
●●
●●
●●
●●
●● ●●●●
●●
●●
●●
●●
●●
●●
●●
●●
●●
●●
●●
●●
ICC=0.95ICC=0.95
2
4
6
8
2
4
6
8
2
4
6
8
2
4
6
8
FreesurferA
NIM
AL−LF
Pbnlin. Pb
2 3 4 5 6 2 3 4 5 6Manual Segmentation
Auto
mat
ic S
egm
enta
tion
Error Correction
●
●
Corrected
Original
Figure 2: Volumetric comparison of hippocampal segmentations by automatic methods and
manual labeling. Dashed black line represents the unity line. From top to bottom: FreeSurfer,
ANIMAL with label fusion, patch-based method (Pb), and nonlinear patch-based method
(nlin. Pb). All values are reported in cubic centimeters.
17

Table 4: ICC between di↵erent automatic segmentation methods and manual segmentation.
Method Left Hippocampus Right Hippocampus
FreeSurfer 0.91 0.92
FreeSurfer with EC 0.93 0.94
ANIMAL with label fusion 0.91 0.89
ANIMAL with label fusion with EC 0.92 0.90
Patch-based 0.96 0.94
Patch-based with EC 0.97 0.94
Nonlinear patch-based 0.97 0.95
Nonlinear patch-based with EC 0.97 0.95
18
Original Segmentation Corrected Segmentation
Figure 3: Bland-Altman plots for volumetric comparison between mean hippocampal volume
resulting from automatic segmentation methods and manual labeling. From top to bottom:
FreeSurfer, ANIMAL with label fusion, nonlinear patch-based (nlin. Pb) and patch-based (Pb)
segmentation. The left column shows the original method, and the right column represents
the corrected version. Blue lines represent the 2.5% (bottom) and 97.5% (top) limit lines. All
values are reported in cubic centimeters.
19

Table 5: Bland-Altman estimations for segmentation methods.
Method mean 2.5% limit 97.5% limit SD
FreeSurfer 0.8996 0.0999 1.6992 0.3998
FreeSurfer with EC �0.0483 �0.6745 0.5778 0.3130
ANIMAL with label fusion �0.0727 �0.7249 0.5795 0.3261
ANIMAL with label fusion with EC �0.0689 �0.6903 0.5525 0.3107
Patch-based �0.1087 �0.5468 0.3293 0.2190
Patch-based with EC �0.0864 �0.5324 0.3595 0.2230
Nonlinear patch-based �0.1112 �0.5491 0.3268 0.2190
Nonlinear patch-based with EC �0.0789 �0.5295 0.3717 0.2253Mean column shows mean value of di↵erences; SD column shows standard deviation of
di↵erences.
4. Experiment 2: Results
4.1. Dataset selection
Each method has a di↵erent number of failures; hence, we limited our analy-
sis to the datasets which have successfully passed all the segmentation methods.
The largest number of failures belongs to FreeSurfer (see Table 6). We further
excluded the 60 subjects (20 AD, 8 pMCI, 12 sMCI, 20 NC) of the first dataset.
The final dataset consists of 135 patients with Alzheimer’s disease, 152 pMCI,
215 sMCI, and 178 normal controls, for which the demographic information can
be found in Table 7.
20

Table 6: Experiment 2: Quality control information. NC: normal controls; sMCI: stable mild
cognitive impairment; pMCI: progressive mild cognitive impairment; AD: Alzheimer’s disease.
NC sMCI pMCI AD
Total number of subjects 231 240 168 199
Number of failures for FreeSurfer 33 13 8 44
Number of failures ANIMAL with label fusion 1 2 1 0
Number of failures Patch-based 0 0 0 0
Number of failures nlin. Patch-based 3 2 2 1
Table 7: Experiment 2: Dataset information. NC: normal controls; sMCI: stable mild cog-
nitive impairment; pMCI: progressive mild cognitive impairment; AD: Alzheimer’s Disease;
MMSE: Mini-Mental State Examination.
NC sMCI pMCI AD
Number 178 215 152 135
Median age at baseline (yrs) 76.14 75.17 75.69 75.44
Sex: female (%) 44% 32% 39% 47%
Median MMSE score 29 28 26 23
4.2. Hippocampal Volume as an AD Biomarker
The e↵ect size between the AD and NC groups for each method is given
in Table 8. A prognosis study was also completed, where the e↵ect size was
measured between the sMCI and pMCI groups (see Table 9). E↵ect size was
measured as the mean of 200 bootstrapped copies of the dataset. Hippocampal
volumes are corrected for age and sex. A paired t-test with Bonferroni correction
for multiple comparisons was performed to show significant di↵erences. Based
on a conventional operational definition of Cohen’s d, small, medium, and large
e↵ect sizes were defined as d < 0.5, 0.5 < d < 0.8, and d > 0.8, respectively.
21

All investigated methods show large e↵ect sizes between the AD and NC groups
and medium e↵ect sizes between the sMCI and pMCI groups (see Table 9). Hip-
pocampal volumes are all reported in the population-specific average template
stereotaxic space to correct for brain volume. For the AD versus NC experi-
ment, the methods from worst to best (in terms of Cohen’s d) are ANIMAL
with label fusion (d = 1.3228), ANIMAL with label fusion and error correc-
tion (d = 1.3765), FreeSurfer (d = 1.4886), the nonlinear patch-based method
(d = 1.5076), the patch-based method with error correction (d = 1.5104), the
nonlinear patch-based method with error correction (d = 1.5134), the patch-
based method (d = 1.5793), and FreeSurfer with error correction (d = 1.6921)..
For the sMCI versus pMCI experiment, the methods from worst to best are AN-
IMAL with label fusion (d = 0.4565), ANIMAL with label fusion and error cor-
rection (d = 0.5040), the patch-based method with error correction (d = 0.5450),
the nonlinear patch-based method with error correction (d = 0.5481), the non-
linear patch-based method (d = 0.5551), FreeSurfer (d = 0.5919), the patch-
based method (0.5988), and FreeSurfer with error correction(d = 0.6683). In
both experiments a pairwise t-test with Bonferroni correction for multiple com-
parisons shows that FreeSurfer with error correction works significantly better
than the other methods to distinguish in both experiments (p < .001).
22

Table 8: Cohen’s d e↵ect size mean and (standard deviation) for NC/AD group di↵erence on
200 bootstrapped replicates.
Method Mean between group e↵ect size
Freesurfer 1.4886 (0.1544)
Freesurfer with EC 1.6921 (0.1630)
ANIMAL with label fusion 1.3228 (0.1400)
ANIMAL with label fusion with EC 1.3765 (0.1502)
Patch-based 1.5793 (0.1696)
Patch-based with EC 1.5104 (0.1472)
Nonlinear patch-based 1.5076 (0.1522)
Nonlinear patch-based with EC 1.5134 (0.1468)
Table 9: Cohen’s d e↵ect size mean and (standard deviation) for sMCI/pMCI group di↵erence
on 200 bootstrapped replicates.
Method Mean between group e↵ect size
Freesurfer 0.5919 (0.1044)
Freesurfer with EC 0.6683 (0.1049)
ANIMAL with label fusion 0.4565 (0.1025)
ANIMAL with label fusion with EC 0.5040 (0.1076)
Patch-based 0.5988 (0.1046)
Patch-based with EC 0.5450 (0.1147)
Nonlinear patch-based 0.5551 (0.1066)
Nonlinear patch-based with EC 0.5481 (0.0973)
4.3. Hippocampal Volume as an AD Biomarker: ROC curve
We used the LDA classifier with LOO cross-validation to classify all the
baseline data. Two similar experiments were run on AD versus NC subjects
23

and stable MCI versus progressive MCI groups (See Figure 4). The area under
the ROC curve (AUC) values are summarized in Table 10. A Cochran’s Q test,
followed by a post hoc pairwise McNemar test with Bonferroni correction for
multiple comparisons, shows there is no significant di↵erence between the meth-
ods in terms of classification performance for AD versus NC, nor for sMCI versus
pMCI. Furthermore, we observed no significant di↵erence using the volume of
left and right hippocampi as separate features.
Table 10: Area under the ROC curve values using LDA with LOO cross-validation based on
mean hippocampal volume, age, and sex as features.
Method AUC (AD/NC) AUC (sMCI/pMCI)
FreeSurfer 0.8710 0.6451
FreeSurfer with EC 0.8813 0.6048
ANIMAL with label fusion 0.8392 0.6093
ANIMAL with label fusion with EC 0.8410 0.5865
Patch-based 0.8684 0.6061
Patch-based with EC 0.8694 0.6379
Nonlinear patch-based 0.8701 0.6403
Nonlinear patch-based with EC 0.8702 0.6382
24

Figure 4: Receiver operating characteristic (ROC) curve shows the performance of the LDA
classifier with LOO cross-validation using volumes derived by each method, age, and sex as
features. Left panel shows ROC curves for AD versus NC; right panel shows ROC curves for
sMCI versus pMCI.
25

5. Discussion
Achieving a fair comparison of the accuracy of di↵erent automatic segmen-
tation methods is not a trivial task. The quality of the MR images segmented,
the segmentation protocol itself, inter- and intra-rater variability, and speci-
ficity of the participant groups can all a↵ect the reported accuracy [14]. For
example, mean hippocampal volume decreases with age [49], which can a↵ect
overlap-based statistics like Dice’s . In this study, we compared three di↵erent
automatic hippocampal segmentation methods using the same testing dataset
and manual segmentation protocol [34]. We then compared the three meth-
ods to the hippocampal segmentation of the well-known FreeSurfer tool [13].
We also applied an error correction technique to each automatic segmentation
method using the same library of manual labels for correction [32].
Dice’s metric is a measure of volumetric overlap, which means that it
can be a↵ected by both registration and segmentation errors. In our compar-
ison, the nonlinear patch-based method with error correction showed the best
median value. The use of nonlinear registration enables better alignment
than that accomplished by the linear patch-based method. The intensity-based
patch-based method shows promising results in its ability to capture structural
variability [12], and applying the wrapper error correction method [32] further
improves the segmentation. The other methods show proper alignment with
manual segmentation as well. The results showed that the key factor a↵ecting
higher values is registration. However, the linear patch-based method, despite
its use of simple linear alignment of scans to the template, shows acceptable re-
sults in terms of the Dice’s metric. The FreeSurfer method does not use
the population-based specific template. Its probabilistic template is based on a
young, healthy population and thus is perhaps not a fair representation of the
test database under study here. This distinction partially explains the overseg-
mentation pattern in the FreeSurfer segmentation: We observed that FreeSurfer
26

oversegments larger hippocampi more than it does smaller ones, whereas AN-
IMAL with label fusion undersegments the larger hippocampi while overseg-
menting the smaller ones. FreeSurfer’s pattern of oversegmentation has been
observed in [50] as well. As FreeSurfer uses its own atlas to define the hip-
pocampus, it is not surprising that it di↵ers from the segmentation derived
from Pruessner’s protocol. The error correction method could successfully cor-
rect the bias in FreeSurfer results; yet, the variance pattern persists. Consider-
ing the bias toward oversegmentation observed in FreeSurfer, a wrapper error
correction technique such as that used in this paper [32] is suggested to ren-
der the segmentation compatible with the population under study. Specifically,
this addition becomes critically important when the population has anatomical
characteristics that di↵er from the FreeSurfer template, which is derived from
young, healthy adult population.
The ICC ratio, as a measure of volume similarity between the gold standard
(manual segmentation) and each automatic segmentation, shows the benefit of
the patch-based intensity-driven strategy in segmentation. Considering both
the ICC and values, the results demonstrate that fine nonlinear registration
combined with the patch-based strategy of segmentation is highly successful. A
similar strategy won the MICCAI 2012 segmentation challenge [33]. Figure 2
shows the improvement for the patch-based methods from linear to nonlinear
registration; the algorithm is further enhanced when the error correction strat-
egy is applied.
The error correction strategy improves segmentation accuracy (in terms of
agreement with manual labeling) for all four methods. Since FreeSurfer has
the largest bias in comparison with the other automatic methods, it benefits
the most from the bias correction technique; the improvement for all the other
methods is slight. The methods already work well in accordance with manual
segmentation and show only a very small bias before applying the correction.
Furthermore, the variance of the methods does not improve even after applying
the correction (see Figure 3). A similar pattern was observed in the original
paper [32]. Error correction performance is highly sensitive to its hyperparam-
27

eters, such as the search boundary or the patch size around each voxel. For the
sake of harmonization, in this study, we used the default parameters from the
original paper [32]. It is possible to further tune the error correction method for
each individual method separately, but such adjustments are out of the scope
of this paper.
We computed Cohen’s d e↵ect size as a measure of how well each method
di↵erentiates between di↵erent clinical groups. Our study shows that Cohen’s d
is large for all the automated segmentation methods for AD/NC between-group
analysis. That is, all eight methods can detect the hippocampal volume reduc-
tion for the AD group compared with the NC group. This observation confirms
the idea that the hippocampus is a↵ected by the disease neurodegeneration
pathway.
With the prognosis experiment, we attempted to di↵erentiate between sMCI
and pMCI clinical groups. All methods showed medium e↵ect sizes in this ex-
perimental setting; that is, the between-group mean di↵erence is much smaller
compared with the di↵erence between the AD and NC groups. Considering the
huge impact early detection of AD can have for treatment, this study has impor-
tant clinical implications. The results of this study aligns with previous work [6]
showing that hippocampal atrophy on volumetric MR images is informative in
separating the di↵erent clinical groups.
We further used a linear classifier to classify the subjects to AD or NC groups
(diagnosis study) and to sMCI or pMCI groups (prognosis study). The methods
are compared based on the area under the ROC curve (AUC), and results show
that the methods do not di↵er in terms of classification performance in either
the diagnosis or prognosis experiments.
FreeSurfer has been shown to be fairly successful in previously published
clinical studies. Considering the quality of FreeSurfer segmentations, we hy-
pothesize that this di↵erence can be explained by one or a combination of the
following points. First, as observed in Figure 2, FreeSurfer has the tendency
to bias the segmentation by oversegmenting the volume in general, with larger
volumes showing a greater degree of oversegmentation in relation to smaller
28

volumes. Second, oversegmentation in FreeSurfer is partially explained by the
use of a di↵erent training population. We expect larger hippocampal volumes
for a young, healthy population, which is exactly the population from which
FreeSurfer’s template is derived. While this may explain the oversegmentation
tendency due to di↵erences in MR image intensities, it does not explain the
bias toward oversegmenting larger hippocampi. FreeSurfer tends to overseg-
ment larger hippocampi more so than smaller ones, which has led to stronger
group di↵erences for disease studies. The pattern is still observable after error
correction is applied.
Recently, an e↵ort has been made to harmonize di↵erent protocols for man-
ual hippocampal segmentation [51, 52]. The harmonized protocol (HarP) is
highly similar to the manual segmentation protocol by Pruessner, which is used
in this manuscript [34]. We have already run a comparison between the HarP
and Pruessner’s protocol [53]. The result showed no significant di↵erence in
terms of the e↵ect size between clinical groups using these two protocols. How-
ever, segmentation accuracy measures (e.g., Dice’s kappa) are higher for Pruess-
ner’s protocol. We hypothesized that the higher values could be in part due to
the protocol’s use of three-dimensional tracing versus two-dimensional tracing
for HarP labels, where boundary smoothness may not be ensured [53]. A de-
tailed comparison between the two manual segmentation protocols would be
worthwhile and should be considered in the future.
5.1. Limitations
We faced some limitations in conducting this study. First, FreeSurfer was
used with its default settings, which may bias the results against it. We applied
the error correction method to partially correct for the bias due to di↵erent
training datasets. Although we included only the subjects that passed quality
control for all processing pipelines, it is important to note that the experiments
(AD:NC and sMCI:pMCI) are biased towards FreeSurfer. Indeed, for the 101
(=31+24+45) subjects that failed the FreeSurfer pipeline (see Table 6), it was
not possible to estimate hippocampal volume. That is, greater than 12% of the
29

test set should receive a random classification (or be considered missing data)
in a forced-choice design, which would greatly reduce the advantage when using
FreeSurfer hippocampal volumes for both AD:NC and sMCI:pMCI experiments.
For the second experiment, it would have been worthwhile to compare the
performance of the automatic methods with manual segmentations. However,
because manually segmenting the hippocampus on the entire ADNI dataset
would be such a lengthy and laborious undertaking, we limited the comparison
to the automatic methods.
6. Conclusion
We conclude that the four automatic methods tested all show acceptable
conformity with manual segmentation. Nonlinear registration is the key factor
to obtaining good spatial alignment with the manual segmentation. The patch-
based strategies perform well, with good correlation with manual segmentation.
Our second experiment demonstrated that all four automatic methods can be
used as a proper substitute for costly manual segmentation in a clinical setting.
All the e↵ect sizes for diagnosis setting were found to be large, while all methods
compared showed a medium e↵ect size in prognosis settings. Overall, the patch-
based method enhanced with nonlinear registration and the error correction
technique [32] shows the most promising results among the di↵erent methods
conducted in our experiments.
7. Acknowledgments
This work was supported by grants from the Canadian Institutes of Health
Research (MOP-111169), les Fonds de Research Sante Quebec Pfizer Innovation
fund, and an NSERC CREATE grant (4140438 - 2012). We would like to
acknowledge funding from the Famille Louise & Andre Charron.
Data collection and sharing for this project was funded by the Alzheimer’s
Disease Neuroimaging Initiative (ADNI) (National Institutes of Health Grant
30

U01 AG024904) and DODADNI (Department of Defense award numberW81XWH-
12-2-0012). ADNI is funded by the National Institute on Aging, the National
Institute of Biomedical Imaging and Bioengineering, and through generous con-
tributions from the following: AbbVie; Alzheimer’s Association; Alzheimer’s
Drug Discovery Foundation; Araclon Biotech; BioClinica, Inc.; Biogen; Bristol-
Myers Squibb Company; CereSpir, Inc.; Cogstate; Eisai, Inc.; Elan Pharmaceu-
ticals, Inc.; Eli Lilly and Company; EuroImmun; F. Ho↵mann-La Roche Ltd and
its a�liated company Genentech, Inc.; Fujirebio; GE Healthcare; IXICO Ltd.;
Janssen Alzheimer Immunotherapy Research & Development, LLC.; Johnson &
Johnson Pharmaceutical Research & Development, LLC.; Lumosity; Lundbeck;
Merck & Co., Inc.; Meso Scale Diagnostics, LLC.; NeuroRx Research; Neuro-
track Technologies; Novartis Pharmaceuticals Corporation; Pfizer, Inc.; Piramal
Imaging; Servier; Takeda Pharmaceutical Company; and Transition Therapeu-
tics. The Canadian Institutes of Health Research is providing funds to support
ADNI clinical sites in Canada. Private sector contributions are facilitated by the
Foundation for the National Institutes of Health (www.fnih.org). The grantee
organization is the Northern California Institute for Research and Education,
and the study is coordinated by the Alzheimer’s Therapeutic Research Institute
at the University of Southern California. ADNI data are disseminated by the
Laboratory for Neuroimaging at the University of Southern California.
Part of the computations were conducted on the supercomputer Guillimin
from McGill University, managed by Calcul Quebec and Compute Canada. The
operation of this supercomputer is funded by the Canada Foundation for In-
novation (CFI), ministere de l’Economie, de la Science et de l’Innovation du
Quebec (MESI) and the Fonds de recherche du Quebec - Nature et technologies
(FRQ-NT).
References
[1] H. Braak, E. Braak, Neuropathological staging of Alzheimers related
changes, Acta Neuropathologica 82 (1991) 239–259.
31

[2] J. D. Bremner, P. Randall, E. Vermetten, L. Staib, R. A. Bronen,
C. Mazure, S. Capelli, G. McCarthy, R. B. Innis, D. S. Charney, Mag-
netic resonance imaging-based measurement of hippo campal volume in
post traumatic stress disorder related to childhood physical and sexual
abusea preliminary report, Biological Psychiatry 41 (1997) 23–32.
[3] M. J. Kempton, Z. Salvador, M. R. Munafo, J. R. Geddes, A. Simmons,
S. Frangou, S. C. R. Williams, Structeral neuroimaging studies in major
depressive disorder: Meta-analysis and comparison with bipolar disorder,
Arch. Gen. Psychiatry 68 (2011) 675–690.
[4] M. Nelson, A. Saykin, L. Flashman, H. Riordan, Hippocampal volume
reduction in schizophrenia as assessed by magnetic resonance imaging: a
meta-analytic study, Arch. Gen. Psychiatry 55 (1998) 433–440.
[5] U. C. Wieshmann, F. G. Woermann, L. Lemieux, S. L. Free, P. A. Bartlett,
S. J. M. Smith, J. S. Duncan, J. M. Stevens, F. D. Shorvon, Development of
hippocampal atrophy: A serial magnetic resonance imaging study in a pa-
tient who developed epilepsy after generalized status epilepticus, Epilepsia
38 (1997) 1238–1241.
[6] R. A. Sperling, P. S. Aisen, L. A. Beckett, D. A. Bennett, S. Craft, A. M.
Fagan, T. Iwatsubo, C. R. Jack, J. Kaye, T. J. Montine, D. C. Park,
E. M. Reiman, C. C. Rowe, E. Siemers, Y. Stern, K. Ya↵e, M. C. Carrillo,
B. Thies, M. Morrison-Bogorad, M. V. Wagster, C. H. Phelps, Toward
defining the preclinical stages of Alzheimer’s disease: recommendations
from the national institute on Aging-Alzheimer’s association workgroups
on diagnostic, Alzheimer’s & dementia 7 (2011) 280–292.
[7] R. Brookmeyer, E. Jahnson, K. Ziegler-Graham, H. Arrighi, Forecasting
the global burden of Alzheimers disease., Alzheimer’s & dementia 3 (2007)
186–191.
[8] M. Chupin, E. Grardin, R. Cuingnet, C. Boutet, L. Lemieux, S. Lehricy,
H. Benali, L. Garnero, O. Colliot, The Alzheimer’s Disease Neuroimaging
32

Initiative, Fully automatic hippocampus segmentation and classification
in Alzheimers disease and mild cognitive impairment applied on data from
ADNI, Hippocampus 19 (2009) 579–587.
[9] R. Cuingnet, E. Gerardin, J. Tessieras, G. Auzias, S. Lehricy, M. Habert,
M. Chupin, H. Benali, O. Colliot, T. The Alzheimer’s Disease Neuroimag-
ing Initiative, Automatic classification of patients with Alzheimer’s dis-
ease from structural MRI: A comparison of ten methods using the ADNI
database., NeuroImage 56 (2011) 766–781.
[10] P. Coupe, S. F. Eskildsen, J. V. Manjn, V. S. Fonov, D. L. Collins, The
Alzheimer’s Disease Neuroimaging Initiative, Simultaneous segmentation
and grading of anatomical structures for patient’s classification: Applica-
tion to Alzheimer’s disease, NeuroImage 59 (2012) 3736–3747.
[11] C. R. Jack, R. C. Petersen, Y. C. Xu, S. C. Waring, P. C. O’Brien, E. G.
Tangalos, G. E. Smith, R. J. Ivnik, E. Kokmen, Medial temporal atrophy
on mri in normal aging and very mild alzheimer’s disease, Neurology 49
(1997) 786–794.
[12] J. V. Coupe, P. Manjn, V. Fonov, J. Pruessner, D. L. Robles, M. Collins,
Patch-based segmentation using expert priors: application to hippocampus
and ventricle segmentation., NeuroImage 54 (2011) 940–954.
[13] B. Fischl, D. H. Salat, E. Busa, M. Albert, M. Dieterich, C. Haselgrove,
A. van der Kouwe, R. Killiany, D. Kennedy, S. Klaveness, A. Montillo,
N. Makris, B. Rosen, A. M. Dale, Whole brain segmentation: Automated
labeling of neuroanatomical structures in the human brain., Neuron 33
(2002) 341–355.
[14] D. L. Collins, J. Pruessner, Towards accurate, automatic segmentation of
the hippocampus and amygdala from MRI by augmenting animal with a
template library and label fusion., NeuroImage 52 (2010) 1355–1366.
33

[15] S. Duchesne, J. Pruessner, D. L. Collins, Appearance-based segmentation
of medial temporal lobe structures., NeuroImage 17 (2002) 515–531.
[16] S. Hu, P. Coupe, J. C. Pruessner, D. L. Collins, Appearance-based modeling
for segmentation of hippocampus and amygdala using multi-contrast MR
imaging., NeuroImage 58 (2011) 549–559.
[17] V. Dill, A. R. Franco, M. S. Pinho, Automated methods for hippocampus
segmentation: the evolution and a review of the state of the art, Neuroin-
formatics 13 (2015) 133–150.
[18] M. Chupin, A. R. Mukuna Bantumbakulu, D. Hasboun, E. Bardinet,
S. Baillet, S. Kinkingnhun, L. Lemieux, B. Dubois, L. Garnero, Automated
segmentation of the hippocampus and the amygdala driven by competition
and anatomical priors: method and validation on healthy subjects and
patients with Alzheimer’s disease., Neuroimage 34 (2007) 996–1019.
[19] S. Hu, D. L. Collins, Joint level-set shape modeling and appearance mod-
eling for brain structure segmentation., NeuroImage 36 (2007) 672–683.
[20] J. Yang, J. S. Duncan, 3d image segmentation of deformable objects with
joint shape-intensity prior models using level sets., NeuroImage 8 (2004)
285–294.
[21] J. Barnes, J. Foster, R. G. Boyes, T. M. E. K. Pepple, J. M. Schott, C. Frost,
R. Schahill, N. Fox, A comparison of methods for the automated calculation
of volumes and atrophy rates in the hippocampus., NeuroImage 40 (2008)
1655–1671.
[22] R. A. Heckemann, J. Hajnal, P. Aljabar, D. Ruckert, A. Hammers, Au-
tomatic anatomical brain MRI segmentation combining label propagation
and decision fusion., NeuroImage 33 (2006) 115–126.
[23] P. Aljabar, R. A. Heckemann, A. Hammers, J. V. Hajnal, D. Rueckert,
Multi-atlas based segmentation of brain images: Atlas selection and its
e↵ect on accuracy., NeuroImage 46 (2009) 726–738.
34

[24] F. Rousseau, P. Habad, C. Studholm, A supervised patch-based approach
for human brain labeling., IEEE trans. on medical imaging 30 (2011) 1852–
1862.
[25] Y. Xiao, V. S. Fonov, S. Beriault, I. Gerard, A. F. Sadikot, G. B. Pike, D. L.
Collins, Patch-based label fusion segmentation of brainstem structures
with dual-contrast MRI for parkinson’s disease, International Journal of
Computer Assisted Radiology and Surgery 10 (2015) 1029–1041.
[26] N. Guizard, P. Coupe, V. Fonov, J. V. Manjn, D. L. Arnold, D. L. Collins,
Rotation-invariant multi-contrast non-local means for ms lesion segmenta-
tion., NeuroImage: Clinical. 31 (2015) 376–389.
[27] S. Roy, A. Carass, J. L. Prince, D. L. Pham, Longitudinal patch-based seg-
mentation of multiple sclerosis white matter lesions, in: L. Zhou, L. Wang,
Q. Wang, Y. Shi (Eds.), Machine Learning in Medical Imaging: 6th Inter-
national Workshop, MLMI 2015, Held in Conjunction with MICCAI 2015,
Munich, Germany, October 5, 2015, Proceedings, Springer International
Publishing, 2015, pp. 194–202.
[28] W. Bai, W. Shi, C. Ledig, D. Rueckert, Multi-atlas segmentation with
augmented features for cardiac MR images, Medical Image Analysis 19
(2015) 98–109.
[29] T. Tong, R. Wolz, P. Coupe, J. V. Hajnal, D. Rueckert, T. A. D. N. Ina-
tiative, Segmentation of MR images via discriminative dictionary learning
and sparse coding: application to hippocampus labeling., NeuroImage 76
(2013) 11–23.
[30] V. Fonov, P. Coupe, S. F. Eskildsen, J. M. Manjon Herrera, D. L. Collins,
Multi-atlas labeling with population-specific template and non-local patch-
based label fusion, in: MICCAI 2012 Workshop on Multi-Atlas Labeling,
MICCAI, 2012, pp. 63–66.
35

[31] H. Wang, A. Poch, M. Takabe, B. Jackson, J. Gorman, R. Gorman, P. A.
Yushkevich, Multi-atlas segmentation with robust label transfer and label
fusion., in: Information processing in medical imaging: proceedings of the
conference., IPMI, 2013, pp. 548–559.
[32] H. Wang, S. R. Das, J. W. Suh, M. Altinay, J. Pluta, C. Craige, B. Avants,
P. A. Yushkevich, A learning-based wrapper method to correct systematic
errors in automatic image segmentation: Consistently improved perfor-
mance in hippocampus, cortex and brain segmentation., NeuroImage 55
(2011) 968–985.
[33] H. Wang, P. A. Yushkevich, Multi-atlas segmentation with joint label
fusion and corrective learning-an open source implementation., Frontiers
in neuroinformatics 7 (2013) 27.
[34] J. C. Pruessner, L. Li, W. Serles, M. Pruessner, D. L. Collins, N. Kabani,
S. Lupien, A. Evans, Volumetry of hippocampus and amygdala with high-
resolution MRI and three-dimensional analysis software: Minimizing the
discrepancies between laboratories., Cerebral Cortex 10 (2000) 433–442.
[35] R. A. Morey, C. M. Petty, J. P. Xu, Y. Hayes, H. R. Wagner, D. V. Lewis,
K. S. LaBar, M. Styner, M. G. McCarthy, A comparison of automated seg-
mentation and manual tracing for quantifying hippocampal and amygdala
volumes, NeuroImage 45 (2009) 855–866.
[36] W. S. Tae, S. S. Kim, K. U. Lee, E. Nam, K. W. Kim, Validation of
hippocampal volumes measured using a manual method and two automated
methods (Freesurfer and IBASPM) in chronic major depressive disorder,
Neuroradiology 50 (2008) 569–581.
[37] P. Coupe, P. Yger, S. Prima, P. Hellier, C. Kervrann, C. Barillot, An opti-
mized blockwise nonlocal means denoising filter for 3-d magnetic resonance
images., Medical Imaging, IEEE Transactions on 27 (2008) 425–441.
36

[38] J. G. Sled, A. P. Zijdenbos, A. C. Evans, A nonparametric method for
automatic correction of intensity non uniformity in MRI data., Medical
Imaging, IEEE Transactions on 17 (1998) 87–97.
[39] D. L. Collins, P. Neelin, T. M. Peters, A. C. Evans, Automatic 3d intersub-
ject registration of MR volumetric data in standardized talairach space.,
Journal of computer assisted tomography 18 (1994) 192–205.
[40] V. Fonov, A. C. Evans, K. Botteron, C. R. Almli, R. C. McKinstry, D. L.
Collins, Unbiased average age-appropriate atlases for pediatric studies.,
NeuroImage 54 (2011) 313–27.
[41] B. Fischl, Freesurfer., NeuroImage 62 (2012) 774–81.
[42] D. L. Collins, A. C. Evans, Animal: Validation and applications of non-
linear registration-based segmentation, International Journal of Pattern
Recognition and Artificial Intelligence 11 (1997) 1271–1294.
[43] D. L. Collins, C. J. Holmes, T. M. Peters, A. C. Evans, Automatic 3-
d model-based neuroanatomical segmentation, Human Brain Mapping 3
(1995) 190–208.
[44] B. B. Avants, C. L. Epstein, M. Grossman, J. C. Gee, Symmetric di↵eo-
morphic image registration with cross-correlation: evaluating automated
labeling of elderly and neurodegenerative brain., Medical Image Analysis
12 (2008) 26–41.
[45] Y. Freund, R. E. Schapire, A desicion-theoretic generalization of on-line
learning and an application to boosting, Computational learning theory
(1995) 23–37.
[46] A. P. Zijdenbos, B. M. Dawant, R. A. Margolin, A. C. Palmer, Morphome-
tric analysis of white matter lesions in MR images: method and validation.,
Medical Imaging, IEEE Transactions on 13 (1994) 716–24.
37

[47] P. E. Shrout, J. L. Fleiss, Intraclass correlations: uses in assessing rater
reliability., Psychological bulletin 86 (1979) 420.
[48] F. Pedregosa, G. Varoquaux, A. Gramfort, V. Michel, B. Thirion, O. Grisel,
M. Blondel, P. Prettenhofer, R. Weiss, V. Dubourg, J. Vanderplas, A. Pas-
sos, D. Cournapeau, M. Brucher, M. Perrot, E. Duchesnay, Scikit-learn:
Machine learning in Python, Journal of Machine Learning Research 12
(2011) 2825–2830.
[49] J. C. Pruessner, D. L. Collins, M. Pruessner, A. C. Evans, Age and gender
predict volume decline in the anterior and posterior hippocampus in early
adulthood., The Journal of Neuroscience 21 (2001) 194–200.
[50] J. Pipitone, M. M. Parka, J. Winterburna, T. A. Lett, J. P. Lerch,
J. C. Pruessner, M. Lepage, A. N. Voineskosa, M. M. Chakravarty, The
Alzheimer’s Disease Neuroimaging Initiative, Multi-atlas segmentation of
the whole hippocampus and subfields using multiple automatically gener-
ated templates., NeuroImage 101 (2014) 494–512.
[51] M. Boccardi, R. Ganzola, M. Bocchetta, M. Pievani, A. Redolfi, G. Bart-
zokis, R. Camicioli, J. Csernansky, M. J. de Leone, L. deToledo Morrell,
R. J. Killiany, L. S., J. Pantel, J. Pruessner, H. Soininen, C. Watson,
S. Duchesne, C. R. Jack, G. B. Frisoni, Survey of protocols for the man-
ual segmentation of the hippocampus: Preparatory steps towards a joint
EADC-ADNI harmonized protocol., Journal of Alzheimer’s Disease 26
(2011) 61–75.
[52] M. Boccardi, M. Bocchetta, R. Ganzola, N. Robitaille, A. Redolfi, S. Duch-
esne, C. J. Jack, G. B. Frisoni, T. E. W. G. on The Harmonized Protocol for
Hippocampal Volumetry, The Alzheimer’s Disease Neuroimaging Initiative,
Operationalizing protocol di↵erences for EADC-ADNI manual hippocam-
pal segmentation., Alzheimer’s & dementia 11 (2013) 184–194.
[53] A. Zandifar, V. Fonov, P. Coupe, J. C. Pruessner, C. D. L, A quantita-
38

tive comparison between two manual hippocampal segmentation protocols.,
Alzheimer’s & Dementia 11 (2015) 67–68.
39