a comparison between item analysis based on item … · christina stage. 2 introduction the swedish...
TRANSCRIPT

A Comparison Between Item Analysis Basedon Item Response Theory and Classical Test
Theory. A Study of the SweSAT SubtestWORD.
Christina Stage

2
Introduction
The Swedish Scholastic Aptitude Test (SweSAT) is a norm-referencedtest, which is used for selection to higher education in Sweden. Thetest is administered twice a year, once in spring and once in autumn.After each administration the test is made public and therefore a newversion has to be developed for each administration. As test results arevalid for five years it is important that results from different administ-rations are comparable.
Since 1996 the test consists of 122 mutiple-choice items, divided intofive subtests:
1. DS, a data sufficiency subtest measuring mathematical reasoningability by 22 items.
2. DTM, a subtest measuring the ability to interpret diagrams, tablesand maps by 20 items.
3. ERC, an English reading comprehension subtest consisting of 20items.
4. READ, a Swedish reading comprehension subtest consisting of 20items.
5. WORD, a vocabulary subtest consisting of 40 items.
As for all high-stake tests the pretesting of items for SweSAT is a cru-cial part of the test development The pretesting of items has severalpurposes (see Henrysson, 1972) of which the most important for Swe-SAT are:
• to determine the difficulty of each item so that a selection may bemade that will give a difficulty level of the subtest which is paral-lel to earlier versions of the same subtest.
• to identify weak or defective items with nonfunctioning distrac-tors.
• to determine for each item its power to discriminate between goodand poor examinees in the achievement variable measured.
• to identify (gender) biased items.
Ever since SweSAT was first taken into use in spring 1977, the deve-lopment and assembly of the test as well as the equating of forms fromone administration to the next has been based on classical test theory

3
(CTT). On the basis of the data obtained in the pretest the items areimproved and selected for the final test and the statistics which areused in the item analysis are:
p-values of the items
p-values of the distractors
biserial correlations (rbis)
p-values of males and females
(the item test regression)
There are some shortcomings with CTT, however, one of which is thatthe item statistics are sample dependent; this may especially causeproblems if the sample on which the pretesting was made differs insome unknown way from the examinee population. Another limitationwhich may be of importance in item analysis is that CTT is test ori-ented rather than item oriented.
During the last decades a new measurement system, item responsetheory (IRT) has been developed and has become an important comp-lement to CTT in the design and evaluation of tests. The potential ofIRT for solving different kinds of testing problems is substantial pro-vided fit between the model and the test data of interest.
IRT rests on two basic postulates: a) the performance of an examineeon a test item can be predicted (or explained) by a set of factors calledtraits, latent traits or abilities; and b) the relationship between exami-nees´ item performance and the set of traits underlying item perfor-mance can be described by a monotonically increasing function calledan item characteristic function or item characteristic curve (ICC).(Hambleton et al., 1991, p. 7) The item statistics of interest are b, a,and c (for the three parameter model) plus corresponding item infor-mation functions. The b-parameter is an item difficulty parameter, a isan item discrimination parameter and c is a psuedo guessing parame-ter. (for more detailed descriptions of IRT see i.e. Lord, 1980, Hamb-leton & Swaminathan, 1985, Hambleton, Swaminathan & Rogers,1991).
One great advantage of IRT is the item parameter invariance. Theproperty of invariance of ability and item parameters is the corner-stone of IRT. It is the major distinction between IRT and classical testtheory. (Hambleton, 1994, p. 540). The property of item parameter

4
invariance is also the property which would be of most value in thedesign of SweSAT. One drawback of IRT is that a big sample size isnecessary for the estimation of parameters.
IRT has been vigorously researched by psychometricians and nume-rous books and articles have been published. The empirical studiesavailable, however, have primarily focused on the application in testequating and very few studies have compared CTT and IRT for itemanalysis and test design. It is somewhat surprising that empirical stu-dies examining and/or comparing the invariance characteristics ofitem statistics from the two measurement frameworks are so scarce. Itappears that the superiority of IRT over CTT in this regard has beentaken for granted in the measurement community, and no empiricalscrutiny has been deemed necessary. The empirical silence on thisissue seems to be an anomaly. (Fan, 1998 p.361)Since spring 1996 pretesting of items for SweSAT has been performedin connection with the regular test administration, which means thatthe examinee sample on which pretesting is performed is a samplefrom the true examinee population and it contains 1500 examinees asa minimum. This new procedure for pretesting would make possiblethe use of IRT for item analysis and compilation of new test versions.
The present study has been performed within a project1 with the gene-ral aim to examine whether the use of IRT would improve the qualityof SweSAT. In earlier studies the applicability of IRT models to theSweSAT subtests was examined (Stage, 1996, 1997a, b, c, d) and theconclusion was that the three parameter logistic IRT model fitted thedata reasonably well. In this study a comparison is made on theWORD subtest between item analysis based on CTT and item anlysisbased on IRT. In studies to come the same comparisons will be madefor other SweSATsubtests.
In the SweSAT given in spring 1997 the subtest WORD contained 20items which had been pretested on five different samples from theexaminee population in spring 1996. The aim of this study is to com-pare, for these 20 items, the stability of the item parameters estimatedby IRT (BILOGW) with the item statistics obtained by CTT.
1 The project is financed by The Swedish Council for Research in the Humanitiesand Social Sciences (HSFR).

5
In an earlier study (Stage, 1997d) of the applicability of IRT on thesubtest WORD, the unidimensionality was assessed by factor analysisand the first three eigenvalues were 6.1, 1.4 and 1.2. An analysis ofthe standardized residuals between observed and model predicted per-formance gave as a result that 0.31 % of the standardized residualshad an absolute value higher than three, 3.13 % had an absolute valuebetween two and three, 26.25 % between one and two and 70.31 % ofthe residuals had an abslute value lower than one. The test of indivi-dual item misfit which is included in the BILOGW program resultedin one item misfitting at the ∝ =.01 level.
Aim
The purpose of the present study was to compare the item statisticsfrom the CTT framework with those from the IRT framework and toexamine the stability from pretest to regular test of the two sets ofitem statistics. Specifically the study addresses the following ques-tions:
1. How do item difficulty indices from CTT compare to item diffi-culty parameters estimated by IRT?
a) for pretest data?
b) for regular test data?
2. How do item dicrimination indices from CTT compare to itemdiscrimination parameters estimated by IRT?
a) for pretest data?
b) for regular test data?
3. How stable are the CTT item indices from pretest data to regulartest data?
4. How stable are the IRT item parameters from pretest data to regu-lar test data?
Method
Classical test theory
For the 20 WORD-items in the regular test spring 1997, which hadbeen pretested in spring 1996, the p-values and the biserial correla-

6
tions (rbis) were calculated. The same indices were calculated on thecorresponding items in the pretest data and the values were compared.
Item response theory
The five WORD pretest combinations spring 1996 were run in BI-LOGW together with the regular WORD subtest from spring 1996 andthe a-, b- and c-parameters were estimated. The WORD subtest fromspring 1997 was run in BILOGW and the item parameters were esti-mated. The parameter estimates for the corresponding 20 items werenoted and compared. The ICCs for the corresponding items were alsocompared (Figure 5 to 24).
One problem when analysing the stability of the item parameters isthat pretesting has two purposes. One aim is to get information aboutthe difficulty level and the discrimination power of the items in orderto be able to compile parallel tests.The other purpose is to make surethat all the items function in a satisfactory way, and if an item is notworking well enough one or more distractors may be changed. Thesechanges mean that the corresponding items are not always exactly thesame in the pretest version as in the regular test. Another preblem isthat items are usually presented in different order in the pretest book-lets and the regular test booklet.Even though the WORD subtest is notspeeded, items may be more difficult when presented in the end of thebooklet than when they are presented in the beginning In connectionwith the ICCs (pp. 11-30) the changes made between pretest and re-gular test will be described.
Results
Classical test theory
In Table 1 the p-values and the rbis obtained from the five pretest ver-sions spring 1996 and from the regular test spring 1997 are presentedfor the the 20 common items.

7
Table 1 CTT-based item statistics.
Item No Pretest Regular test
pre reg p-value rbis p-value rbis
8 1 .73 .60 .71 .5820 4 .79 .46 .72 .4139 5 .78 .25 .74 .3318 9 .68 .44 .71 .4336 10 .75 .50 .72 .5327 11 .80 .35 .82 .3536 15 .71 .40 .58 .3714 16 .65 .44 .70 .485 19 .46 .42 .42 .3716 23 .65 .35 .62 .4038 24 .58 .47 .56 .3012 25 .51 .58 .59 .5824 27 .69 .36 .66 .354 28 .53 .56 .44 .524 29 .42 .33 .42 .265 35 .31 .32 .38 .4637 36 .71 .43 .62 .446 38 .41 .31 .46 .3728 39 .27 .28 .40 .3239 40 .31 .23 .31 .21
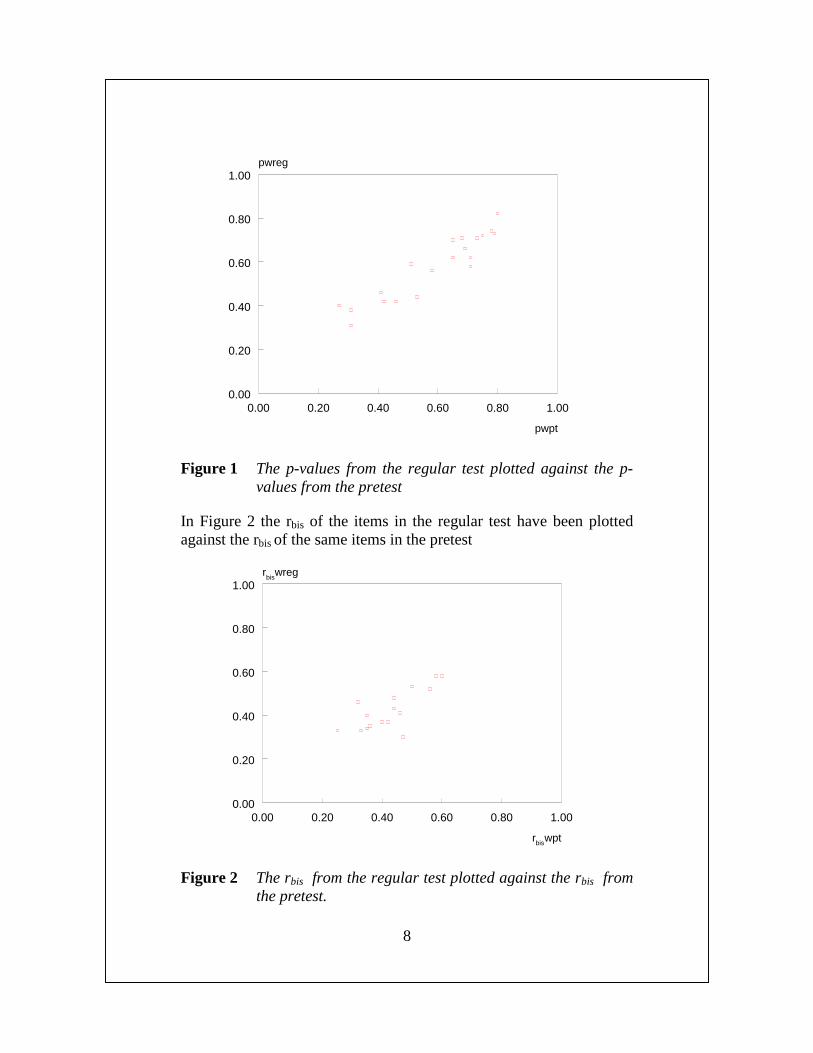
The Spearman rho between p-values from pretest and regular test wasρ =.92 and for the same p-values transformed to delta, the correlationwas r =.93.
In Figure 1 the p-values from the regular test spring 1997 have beenplotted against the p-values from the pretest versions.
8
0.00 0.20 0.40 0.60 0.80 1.00
pwpt
0.00
0.20
0.40
0.60
0.80
1.00pwreg
Figure 1 The p-values from the regular test plotted against the p-values from the pretest
In Figure 2 the rbis of the items in the regular test have been plottedagainst the rbis of the same items in the pretest
0.00 0.20 0.40 0.60 0.80 1.00
rbiswpt
0.00
0.20
0.40
0.60
0.80
1.00rbiswreg
Figure 2 The rbis from the regular test plotted against the rbis fromthe pretest.

9
For the rbis the correlation between pretest and regular test was r = .81.
Item response theory
In Table 2 the a-, b- and c-parameters are presented from the pretestversions spring 1996 and the regular test spring 1997.
Table 2 IRT-based item statistics.
Item No Pretest Regular test
pre reg b a c b a c
8 1 -.43 1.29 .27 -.43 1.14 .2320 4 -.96 .73 .25 -.64 .62 .2339 5 -1.94 .32 .20 -1.19 .43 .1718 9 -.25 .71 .27 -.59 .63 .2336 10 -.92 .72 .15 -.81 .78 .1127 11 -1.49 .48 .20 -1.79 .46 .1936 15 -.55 .59 .26 .11 .55 .2014 16 -.02 .81 .29 -.65 .72 .165 19 .46 .55 .08 .71 .50 .0916 23 .11 .58 .32 .08 .72 .2838 24 .08 .75 .18 .16 .40 .1612 25 .17 .97 .12 -.02 1.13 .1724 27 .37 1.07 .48 .33 .83 .414 28 .35 1.55 .25 .51 1.04 .144 29 1.16 .71 .23 1.08 .61 .195 35 1.59 .45 .09 .89 .95 .1637 36 -.37 .70 .29 -.07 .70 .216 38 1.25 .70 .23 .49 .48 .0928 39 1.61 1.13 .19 1.22 1.18 .2739 40 2.27 .42 .15 2.45 .45 .18
The correlation between the b-values estimated on pretest and regulartest data was r = 92. A plot of the b-values is shown in Figure 3.
The correlation between a-values estimated on pretest and regular testdata was r = .74 and the plot is shown in Figure 4.

10
The correlation between c-values was r = .74
-2 -1 0 1 2 3
bwpt
-2
-1
0
1
2
3bwreg
Figure 3 Plot of b-values from the regular test against b-valuesfrom the pretest.
0.00 0.40 0.80 1.20 1.60 2.00
awpt
0.00
0.40
0.80
1.20
1.60
2.00awreg
Figure 4 Plot of a-values from the regular test against a-valuesfrom the pretest.

11
Item Characteristic Curves of the 20 word items 1997 whichwere pretested in spring 1996
In Figures 5 to 24 the ICCs of each item from the pretest as well as theICCs of the corresponding items from the regular test are shown.
-3 -2 -1 0 1 2 3
Scale Score
0.00
0.10
0.20
0.30
0.40
0.50
0.60
0.70
0.80
0.90
1.00
Prob
abili
ty SweSAT 96A
SweSAT 97A
Figure 5 ICCs for item No 1 in the Spring 1997 WORD subtest.
In this item two of the distractors had been changed after the pretestand the item was number 8 in the pretest booklet.
As may be seen in Figure 6 the two ICCs correspond very well, the b-values were exactly the same (-.43) in the pretest as in the regular test,while the a-value in the pretest was 1.29 and in the regular test 1.14,i.e. there was a very small decrease in discrimination power frompretest to regular test.
The p-value for this item in the pretest was .73 and in the regular testthe p-value was .71; i.e. a very small decrease; the rbis in the pretestwas .60 and in the regular test it was .58; a small decrease as well.
On the whole the results from CTT and IRT correspond very well andaccording to both analyses this item seems to work in the same way inthe pretest as in the regular test.

12
-3 -2 -1 0 1 2 3
Scale Score
0.00
0.10
0.20
0.30
0.40
0.50
0.60
0.70
0.80
0.90
1.00Pr
obab
ility SweSAT 96A
SweSAT 97A
Figure 6 ICCs of item No 4.
In item No 4 one distractor had been changed after the pretest and theposition in the pretest booklet was No 20.
For this item the b-value had increased from -.96 in the pretest to -.64in the regular test, i.e. the item was a bit more difficult in the regulartest; the a-value had decreased from .73 to .62, hence the discrimina-tion is somewhat lower in the regular test than in the pretest.
From the CTT the conclusions are the same: the p-value has decreasedfrom .79 to .72 and the rbis has decreased from .46 to .41; i.e. the itemhad become somewhat more difficult but less discriminating in theregular test than it was in the pretest.
For item No 4 as well the conclusions from the two analyses are thesame.

13
-3 -2 -1 0 1 2 3
Scale Score
0.00
0.10
0.20
0.30
0.40
0.50
0.60
0.70
0.80
0.90
1.00Pr
obab
ility SweSAT 96A
SweSAT 97A
Figure 7 ICCs of item No 5.
In item No 5 two distractors and the correct answer had been changedslightly; the position in the pretest booklet was No 39
For this item the b-value as well as the a-value had increased frompretest to regular test (from -1.94 to -1.19 and from .32 to .43) whichmeans that the item is more difficult and also a bit more discrimina-ting in the regular test than it was in the pretest.
The same conclusions are drawn from CTTas the p-value had decrea-sed from .78 to .74 and the rbis had increased from .25 to .33.

14
-3 -2 -1 0 1 2 3
Scale Score
0.00
0.10
0.20
0.30
0.40
0.50
0.60
0.70
0.80
0.90
1.00Pr
obab
ility SweSAT 96A
SweSAT 97A
Figure 8 ICCs of item No 9.
In item No 9 only the order of distractors had been changed but theposition in the pretest booklet was No 18.
For this item the b-value had decreased from -.25 to -.59 and the a-value from .71 to .63. from the pretest to the regular test. This meansthat the item was a bit easier and less discriminating in the regular testthan in the pretest.
The p-value had increased from .68 to .71 while the rbis is almost thesame (.44/.43).
Hence the conclusions from the two theories are the same: the itemwas somewhat easier and slightly less discriminating in the regulartest than in the pretest.

15
-3 -2 -1 0 1 2 3
Scale Score
0.00
0.10
0.20
0.30
0.40
0.50
0.60
0.70
0.80
0.90
1.00Pr
obab
ility SweSAT 96A
SweSAT 97A
Figure 9 ICCs of item No 10.
In item No 10 one distractor had been changed and the position in thepretest booklet was No 36.
For this item the b-value had increased very little (from -.92 to -.81)from the pretest to the regular test and so had the a-value (from .72 to.78). This means that the item is a little more difficult and better disc-riminating in the regular test than it was in the pretest.
The same conclusion is drawn from the classical test theory since thep-value had decreased from .75 to .72 and the rbis had increased from.50 to .53.

16
-3 -2 -1 0 1 2 3
Scale Score
0.00
0.10
0.20
0.30
0.40
0.50
0.60
0.70
0.80
0.90
1.00Pr
obab
ility SweSAT 96A
SweSAT 97A
Figure 10 ICCs of item No 11
In item No 11 one distractor had been changed and the position in thepretest booklet was No 27.
For this item the b-value had decreased (from -1.49 to -1.79), whilethe a-value was very much the same (.48/.46), i.e. the item was a littlebit easier in the regular test than in the pretest, while the discrimina-tion is about the same.
The p-value had increased from .80 to .82, while rbis was the the same.35 in the regular test as in the pretest.
Again the conclusions are the same from CTT and IRT.

17
-3 -2 -1 0 1 2 3
Scale Score
0.00
0.10
0.20
0.30
0.40
0.50
0.60
0.70
0.80
0.90
1.00Pr
obab
ility SweSAT 96A
SweSAT 97A
Figure 11 ICCs of item No 15.
In item No 15 one distractor had been changed; and the position in thepretest booklet was No 36.
For item 15 the b-value had increased from -.55 to .11, while the a-value had decreased to a very small extent (from .59 to .56). The p-value had decreased from .71 to .52 and the rbis from .40 to .37.
Again the conclusions are the same, the item was more difficult andsomewhat less discriminating in the regular test than in the pretest.

18
-3 -2 -1 0 1 2 3
Scale Score
0.00
0.10
0.20
0.30
0.40
0.50
0.60
0.70
0.80
0.90
1.00Pr
obab
ility SweSAT 96A
SweSAT 97A
Figure 12 ICCs of item No 16.
In item No 16 as well one distractor had been changed; the position inthe pretest booklet was No 14.
For item No 16 the b-value had decreased from -.02 to -.65 and the a-value had decreased from .81 to .72, which means that the item waseasier and somewhat less discriminating in the regular test than in thepretest.
The p-value had increased from .65 to .70 and the rbis had increasedfrom .44 to .48.
For this item the conclusion from both item-analyses is that the itemwas easier in the regular test than in the pretest but according to IRT itwas less discriminating and according to CTT it was more discrimina-ting in the regular test than in the pretest.

19
-3 -2 -1 0 1 2 3
Scale Score
0.00
0.10
0.20
0.30
0.40
0.50
0.60
0.70
0.80
0.90
1.00Pr
obab
ility SweSAT 96A
SweSAT 97A
Figure 13 ICCs of item No 19.
In item No 19 nothing had been changed, but the position in the pre-test booklet was No 5.
For item No 19 the b-value had increased from .46 to .71, while the a-value had decreased from .55 to .50.
The p-value had decreased from .46 to .42 and the rbis from .42 to .37.
According to both analyses the item was a bit more difficult and lessdiscriminating in the regular test than in the pretest.
20
-3 -2 -1 0 1 2 3
Scale Score
0.00
0.10
0.20
0.30
0.40
0.50
0.60
0.70
0.80
0.90
1.00Pr
obab
ility SweSAT 96A
SweSAT 97A
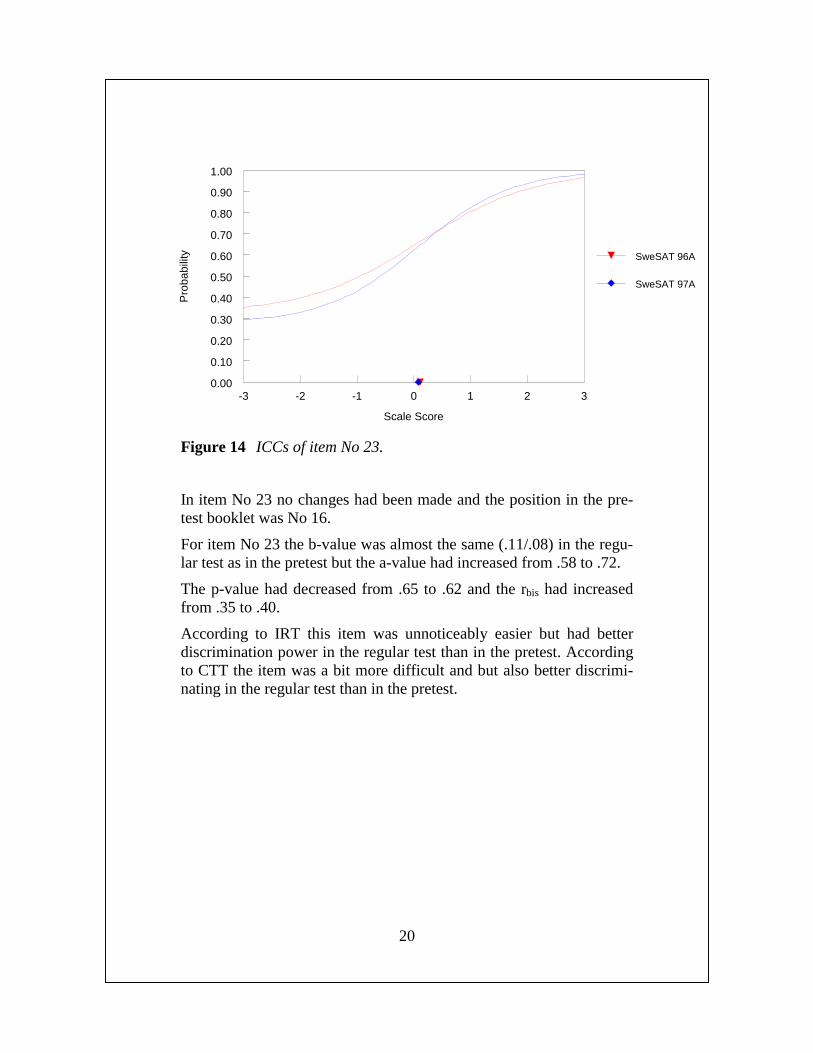
Figure 14 ICCs of item No 23.
In item No 23 no changes had been made and the position in the pre-test booklet was No 16.
For item No 23 the b-value was almost the same (.11/.08) in the regu-lar test as in the pretest but the a-value had increased from .58 to .72.
The p-value had decreased from .65 to .62 and the rbis had increasedfrom .35 to .40.
According to IRT this item was unnoticeably easier but had betterdiscrimination power in the regular test than in the pretest. Accordingto CTT the item was a bit more difficult and but also better discrimi-nating in the regular test than in the pretest.

21
-3 -2 -1 0 1 2 3
Scale Score
0.00
0.10
0.20
0.30
0.40
0.50
0.60
0.70
0.80
0.90
1.00
Prob
abili
ty SweSAT 96A
SweSAT 97A
Figure 15 ICCs of item No 24.
In item No 24 no changes had been made but the position in the pre-test booklet was No 38.
For item No 24 the b-value had increased slightly from .08 to .16,while the a-value had decreased from .75 to .40 from pretest to regulartest.
The p-value had decreased from .58 to .56 and the rbis had decreasedfrom .47 to .30.
According to both analyses the item had become a bit more difficultbut less discriminating in the regular test than in the pretest.

22
-3 -2 -1 0 1 2 3
Scale Score
0.00
0.10
0.20
0.30
0.40
0.50
0.60
0.70
0.80
0.90
1.00Pr
obab
ility SweSAT 96A
SweSAT 97A
Figure 16 ICCs of item No 25.
In item No 25 no changes had been made but the position in the pre-test booklet was No 12.
For item No 25 the b-value had decreased from .17 to .12, while the a-value had increased from .97 to 1.13 from the pretest to the regulartest.
The p-value had increased from .51 to .59 and the rbis was unchanged(.58).
Hence according to both analyses the item was a bit easier in the re-gular test but according to IRT it was also slightly more discrimina-ting in the regular test than in the pretest.

23
-3 -2 -1 0 1 2 3
Scale Score
0.00
0.10
0.20
0.30
0.40
0.50
0.60
0.70
0.80
0.90
1.00Pr
obab
ility SweSAT 96A
SweSAT 97A
Figure 17 ICCs of item No 27.
In item No 27 no changes had been made and the position in the pre-test booklet was No 24.
For item No 27 the b-value had decreased from .37 to .33 and the a-value had decreased from 1.07 to .83 from pretest to regular test.
The p-value had decreased from .69 to .66 and the rbis had decreasedslightly (from .36 to .35) from pretest to regular test.
Hence according to IRT this item was somewhat easier in the regulartest than in the pretest, while according to CTT the item was somew-hat more difficult in the regular test. According to both analyses thediscrimination power had decreased to a small extent from pretest toregular test.

24
-3 -2 -1 0 1 2 3
Scale Score
0.00
0.10
0.20
0.30
0.40
0.50
0.60
0.70
0.80
0.90
1.00Pr
obab
ility SweSAT 96A
SweSAT 97A
Figure 18 ICCs of item No 28.
In item No 28 one distractor and the correct answer had been changed;the position in the pretest booklet was No 4.
For item No 28 the b-value had increased from .35 to .51, while the a-value had decreased from 1.55 to 1.04 from pretest to regular test.
The p-value had decreased from .53 to .44 and the rbis had decreasedfrom .56 to .52.
According to both theories the item was more difficult but less discri-minating in the regular test than in the pretest.

25
-3 -2 -1 0 1 2 3
Scale Score
0.00
0.10
0.20
0.30
0.40
0.50
0.60
0.70
0.80
0.90
1.00Pr
obab
ility SweSAT 96A
SweSAT 97A
Figure 19 ICCs of item No 29.
In item No 29 no changes had been made but the position in the pre-test booklet was No 4.
For item No 29 the b-value had decreased slightly from 1.16 to 1.08and the a-value had decreased from .71 to .61 from pretest to regulartest.
The p-value was the same (.42) in the pretest as in the regular test andso was the rbis (.33).
Hence according to IRT the item was somewhat easier and poorerdiscriminating in the regular test than in the pretest. According to CTTthe difficulty level was exactly the same and so was the discriminationpower.

26
-3 -2 -1 0 1 2 3
Scale Score
0.00
0.10
0.20
0.30
0.40
0.50
0.60
0.70
0.80
0.90
1.00Pr
obab
ility SweSAT 96A
SweSAT 97A
Figure 20 ICCs of item No 35.
In item No 35 one distractor had been changed and the position in thepretest booklet was No 5.
For item No 35 the b-value had decreased substantially (from 1.59 to.89) but the a-value had increased (from .45 to .95) between pretestand regular test.
The p-value had increased from .31 to .38 and the rbis had increasedfrom .32 to .46 from pretest to regular test.
Hence according to both analyses this item was easier but more dicri-minating in the regular test than in the pretest.

27
-3 -2 -1 0 1 2 3
Scale Score
0.00
0.10
0.20
0.30
0.40
0.50
0.60
0.70
0.80
0.90
1.00Pr
obab
ility SweSAT 96A
SweSAT 97A
Figure 21 ICCs of item No 36.
In item No 36 one distractor had been changed and the position in thepretest booklet was No 37.
For item No 36 the b-value had increased from -.37 to -.07 from pre-test to regular test, while the a-value remained the same (.70).
The p-value had decreased from .71 to .62 and the rbis had increasedslightly (from .43 to .44) from pretest to regular test.
According to both analyses the item was more difficult in the regulartest than in the pretest, while the discrimination remained approxima-tely the same.

28
-3 -2 -1 0 1 2 3
Scale Score
0.00
0.10
0.20
0.30
0.40
0.50
0.60
0.70
0.80
0.90
1.00Pr
obab
ility SweSAT 96A
SweSAT 97A
Figure 22 ICCs of item No 38.
In item No 38 as well one distractor had been changed and the posi-tion in the pretest booklet was No 6.
For item No 38 the b-value had decreased from 1.25 to .49 and the a-value had decreased from .70 to .48 from the pretest to the regular test.
The p-value had increased from .41 to .46 and the rbis had increasedfrom .31 to .37.
According to both analyses the item was easier in the regular test thanin the pretest, but according to IRT the discrimination was relativelybetter in the pretest version and according to classical test theory itwas better in the regular test.

29
-3 -2 -1 0 1 2 3
Scale Score
0.00
0.10
0.20
0.30
0.40
0.50
0.60
0.70
0.80
0.90
1.00Pr
obab
ility SweSAT 96A
SweSAT 97A
Figure 23 ICCs of item No 39.
In item No 39 three distractors had been changed and the position inthe pretest booklet was No 28.
For item No 39 the b-value had decreased from 1.61 to 1.22, while thea-value had increased slightly from 1.13 to 1.18 from the pretest to theregular test.
The p-value had increased from .27 to .40 and the rbis had increasedfrom .28 to .32.
According to both analyses the item was easier and more discrimina-ting in the regular test than in the pretest.
30
-3 -2 -1 0 1 2 3
Scale Score
0.00
0.10
0.20
0.30
0.40
0.50
0.60
0.70
0.80
0.90
1.00Pr
obab
ility SweSAT 96A
SweSAT 97A
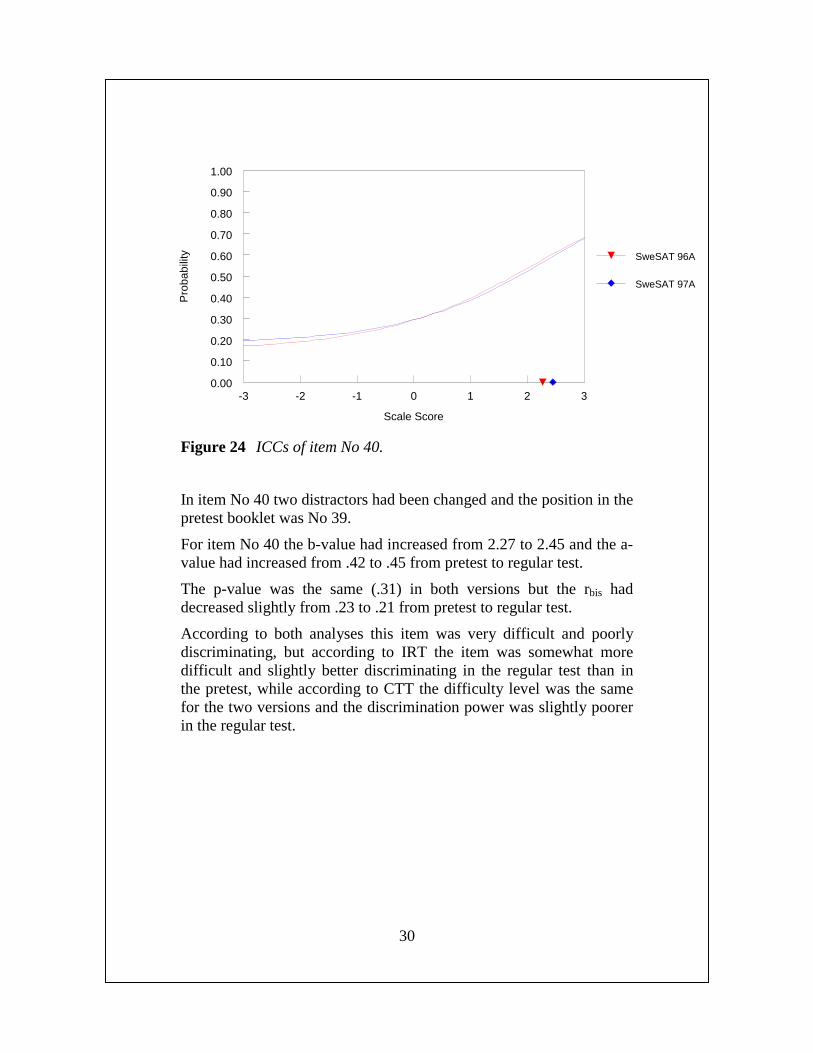
Figure 24 ICCs of item No 40.
In item No 40 two distractors had been changed and the position in thepretest booklet was No 39.
For item No 40 the b-value had increased from 2.27 to 2.45 and the a-value had increased from .42 to .45 from pretest to regular test.
The p-value was the same (.31) in both versions but the rbis haddecreased slightly from .23 to .21 from pretest to regular test.
According to both analyses this item was very difficult and poorlydiscriminating, but according to IRT the item was somewhat moredifficult and slightly better discriminating in the regular test than inthe pretest, while according to CTT the difficulty level was the samefor the two versions and the discrimination power was slightly poorerin the regular test.

31
Discussion
The agreement between results from item-analysis performed by IRTand CTT is very good. For 13 of the 20 items analysed the conclusionsabout the change between pretest and regular test regarding difficultylevel as well as discrimination were exactly the same. For only oneitem (No 40) the conclusion about both difficulty and discriminationdifferred, but according to both theories this item was very difficultand had low discrimination. For two items only (No 25 and 29) therewere differences regarding the change of difficulty level and for threeitems there were differences regarding the change of discrimination.All differences, however, were minor.
As for model data fit if the IRT model used (three parameter logisticmodel) none of the 20 items was identified as misfitting at the α = .01level in the pretest versions. In the regular test version one item (No10) was identified as missfitting at α = .01 level2. For item No 10 theresults from the two theories were the same, however.
There are at least two complications for the prediction of the regulardata, when using actual data as in this study. One complication is thatthe items are not always exactly the same in the pretest as in the regu-lar test. Distractors which did not work in the pretest were changedbefore the item was included in the regular test; and the effect of suchchanges is not always possible to foresee. The other complication isthat items are presented in different order in the pretest and the regulartest. Even though the test is not actually speeded, items seem to bemore difficult when placed in the end of the booklet than when theyare placed in the beginning. For the two items which had changedmost in difficulty level according to CTT (No 15 and 39) it is impos-sible to tell the reason; for item No 15 one distractor had been chang-ed but the item was number 36 in the pretest booklet; for item No 39three distractors had been changed and also the item was number 28 inthe pretest booklet. The items which had changed most in difficultylevel according to IRT were No 5 and No 35 and these changes weredifficult to interpret as well; in item No 5 two distractors had beenchanged and the order in the pretest booklet was 39, but the item hadbecome more difficult; for item No 35 one distractor had been chang-ed and the position in the pretest booklet was 5, but the item had be-
2 There was a discrepancy between model predicted and observed response pattern.

32
come easier. For the items where no distractors had been changed(Nos 9, 23, 24, 25, 27 and 29) the ICCs are very similar and all chang-es in p-values were very small as well.
The overall conclusion from this study is that the prediction frompretest to regular test data is satisfactory and the major part of thediscrepancy in the prediction can be explained by changes of theitems. This conclusion, however, is true for both analyses regardlessof theoretical framwork..
Because IRT differs considerably from CTT in theory, and commandssome crucial theoretical advantages over CTT, it is reasonable to ex-pect that there would be appreciable differences between IRT- andCTT-based item and person statistics. Theoretically, such relation-ships are not entirely clear, except that the two types of statistics sho-uld be monotonically related under certain conditions (Crocker &Algina, 1986; Lord, 1980). But such relationships have rarely beenempirically investigated, and, as a result they are largely unknown.(Fan, 1998, p. 360)
In this empirical study the correspondence between results from theitem analyses performed within the two different theoretical frame-works was very good. The comparability of IRT- and CTT-based itemstatistics was examined by correlating IRT and CTT item statisticsobtained from the same sample of participants. The correlation betwe-en the item difficulty parameter ”b” from the IRT model with the CTTitem difficulty value ”p” was r = .93 for pretest results as well as forregular test results. The correlation between the IRT item discrimina-tion parameter ”a” and CTT item discrimination index ”rbis” was r =.65 for the pretest results and r= .64 for the regular test results. Andalso for the individual items the accuracy of the predictions madefrom pretest results to regular test results were very similar.
For the CTT item indices the correlation between pretest and regulartest were, for p-values r = .93 and for rbis r = .81. For the IRT parame-ters the correlation between pretest and regular test item parameterswere for b-values r = .92 and for a-values r = .74.
What is important when compiling a test like SweSAT, however, is tobe able to predict the difficulty level of the regular test from the pre-test data. As for the discrimination power of the items it is enough to

33
know that every item is discriminating satisfactorily, you do not needto predict the exact level of discrimination.
In this study where the pretesting had been performed on large andrepresentative samples it does not seem to be of any importance forthe test design whether the item analysis has been performed withinthe IRT framework or within the CTT framework.

34
References
Crocker, L., & Algina, J. (1986). Introduction to Classical and Mo-dern Test Theory. New York: Holt Rinehard & Winston.
Fan, X. (1998). Item Response Theory and Classical Test Theory: AnEmpirical Comparison of their Item/Person Statistics. Edu-cational and Psychological Measurement, 58 (3), 357-381.
Hambleton, R. K. & Swaminathan, H. (1985). Item Response Theory:Principles and Applications. Boston: Kluwer.
Hambleton, R. K., Swaminathan, H. & Rogers, H. J. (1991). Funda-mentals of Item Response Theory. Newbury Park, CA: Sage.
Hambleton, R. K. & Jones, R. W. (1993). Comparison of ClassicalTest Theory and Item Response Theory and their Applica-tions to Test Development. Educational Measurement: Issuesand Practice, 12 (3), 38-47.
Hambleton, R. K. (1994). Item Response Theory: A Broad Psycho-metric Framework for Measurement Advances. Psicothema,6 (3), 535-556.
Henrysson, S. (1971) Gathering, Analyzing, and Using Data on TestItems. In Thorndike, R. L. (Ed.) Educational Measurement,2nd Edition (pp. 130-159). Washington DC: American Coun-cil on Education.
Lord, F. M. (1980). Applications of Item Response Theory to PracticalTesting Problems. Hillsdale NJ: Lawrence Erlbaum.
Stage, C. (1996). An Attempt to Fit IRT Models to the DS Subtest inthe SweSAT. (Educational Measurement No 19). Umeå Uni-versity, Department of Educational Measurement.
Stage, C. (1997a). The Applicability of Item Response Models to theSweSAT. A Study of the DTM Subtest. (Eductional Measure-ment No 21). Umeå University, Department of EducationalMeasurement.
Stage, C. (1997b). The Applicability of Item Response Models to theSweSAT. A Study of the ERC Subtest. (Educational Measure-ment No 24). Umeå University, Department of EducationalMeasurement.

35
Stage, C. (1997c). The Applicability of Item Response Models to theSweSAT. A Study of the READ Subtest. (Educational Measu-rement No 25) Umeå University, Department of EducationalMeasurement.
Stage, C. (1997d). The Applicability of Item Response Models to theSweSAT. A Study of the WORD Subtest. (Educational Measu-rement No 26). Umeå University, Department of EducationalMeasurement.