a comparison between brazilian cotton and alternative ... comparison between brazilian cotton and...
TRANSCRIPT
A Comparison Between Brazilian Cotton
and Alternative Origins
(from a spinning mill point of view)
Leon Piçon
Orta Anadolu
Cotton Purchasing Director

Overview
• A Brief Introduction of Orta
• Turkey - Cotton Market and Trade
• Brazilian Cotton (Quality Analysis and Performance)
• Quality of Cotton and it’s Impact on Orta Spinning&Weaving Process
• Comparison of Brazilian Cotton with Alternative Origins

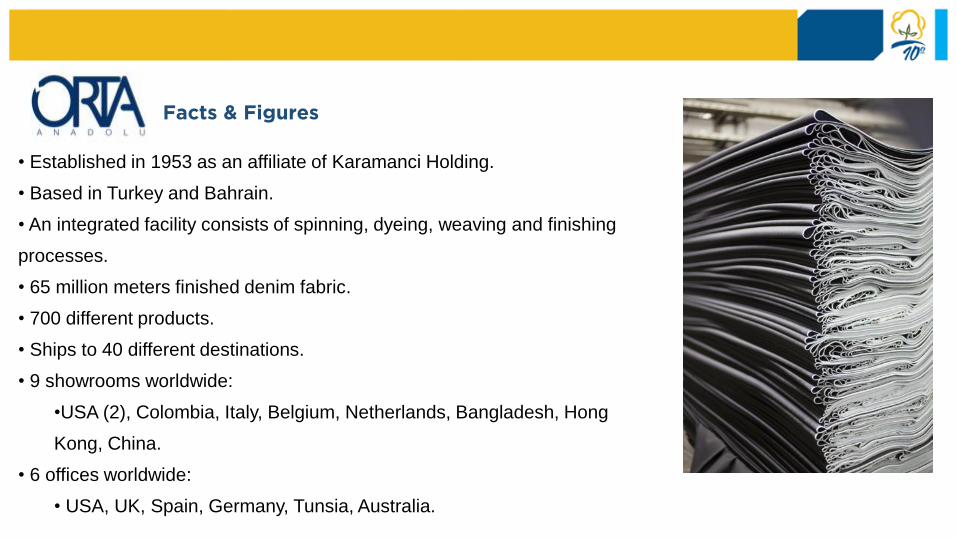
Facts & Figures
• Established in 1953 as an affiliate of Karamanci Holding.
• Based in Turkey and Bahrain.
• An integrated facility consists of spinning, dyeing, weaving and finishing
processes.
• 65 million meters finished denim fabric.
• 700 different products.
• Ships to 40 different destinations.
• 9 showrooms worldwide:
•USA (2), Colombia, Italy, Belgium, Netherlands, Bangladesh, Hong
Kong, China.
• 6 offices worldwide:
• USA, UK, Spain, Germany, Tunsia, Australia.

TurkeyCotton Market & Trade

TURKISH COTTON MARKET & TRADE
Facts & Figures
Turkish Cotton
• 95% Irrigated.
• 100 % GMO Free Seed.
• 75% Machine Picked, 25 % Hand Picked.
• 90% Roller Ginned.
Planted area (Ha)
Production (MT)
Consumption (MT)
Imports (MT)
Yield (kgs/Ha)
2015/16 Season 380.000 610.000 1.393.000 806.000 1.604
Global Share 1,20% 2,51% 5,59% 10,87%
Global Ranking #12 #7 #4 #4 #3

COTTON PLANTINGS IN TURKEY
Cotton planted area lower and unstable
• High production costs.
• Better returns from alternative crops.
• No import tarrif. Domestic cotton prices
exposed to global cotton prices.
• Quality standards suitable for export markets
not available. Practically no export.
• Attaining the size of planted area last seen in
2007 unlikely.
0
200.000
400.000
600.000
800.000
Turkish Cotton Planted Acreage (Ha)
Acreage (Ha)
Source : USDA
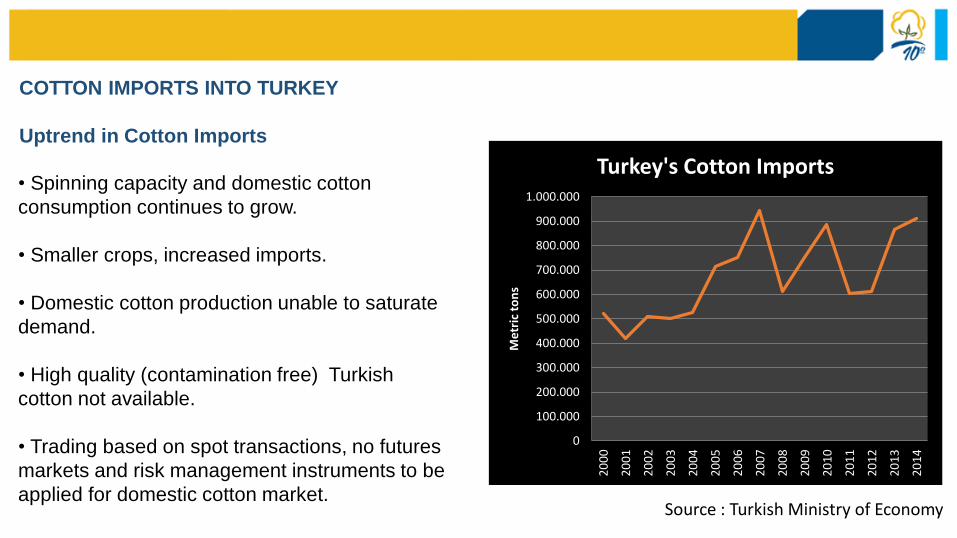
COTTON IMPORTS INTO TURKEY
Uptrend in Cotton Imports
• Spinning capacity and domestic cotton
consumption continues to grow.
• Smaller crops, increased imports.
• Domestic cotton production unable to saturate
demand.
• High quality (contamination free) Turkish
cotton not available.
• Trading based on spot transactions, no futures
markets and risk management instruments to be
applied for domestic cotton market.
0
100.000
200.000
300.000
400.000
500.000
600.000
700.000
800.000
900.000
1.000.000
20
00
20
01
20
02
20
03
20
04
20
05
20
06
20
07
20
08
20
09
20
10
20
11
20
12
20
13
20
14
Me
tric
to
ns
Turkey's Cotton Imports
Source : Turkish Ministry of Economy
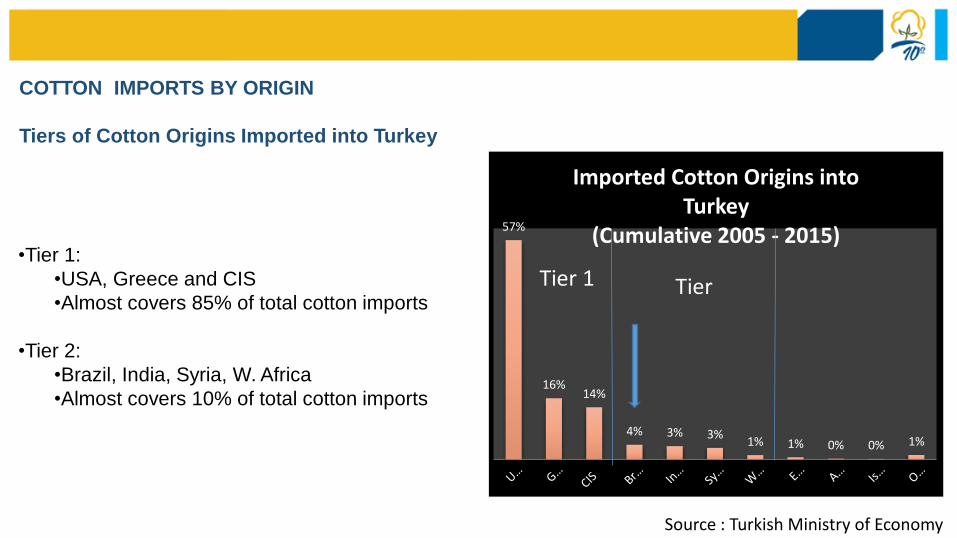
COTTON IMPORTS BY ORIGIN
Tiers of Cotton Origins Imported into Turkey
•Tier 1:
•USA, Greece and CIS
•Almost covers 85% of total cotton imports
•Tier 2:
•Brazil, India, Syria, W. Africa
•Almost covers 10% of total cotton imports
57%
16%14%
4% 3% 3%1% 1% 0% 0% 1%
Imported Cotton Origins into Turkey
(Cumulative 2005 - 2015)
Tier 1 Tier
Source : Turkish Ministry of Economy

COTTON IMPORTS BY ORIGIN
Tier 1 (USA, Greece and CIS)
•USA by far holds the bigest share of imported
cotton market into Turkey .
•Greece and Turkmenistan follow USA and
competing for the 2nd bigest market share.
0
100.000
200.000
300.000
400.000
500.000
600.000
700.000
2005 2006 2007 2008 2009 2010 2011 2012 2013 2014
Turkish Cotton Import OriginsTier 1
(Metric tons)
USA Greece CIS
Source : Turkish Ministry of Economy
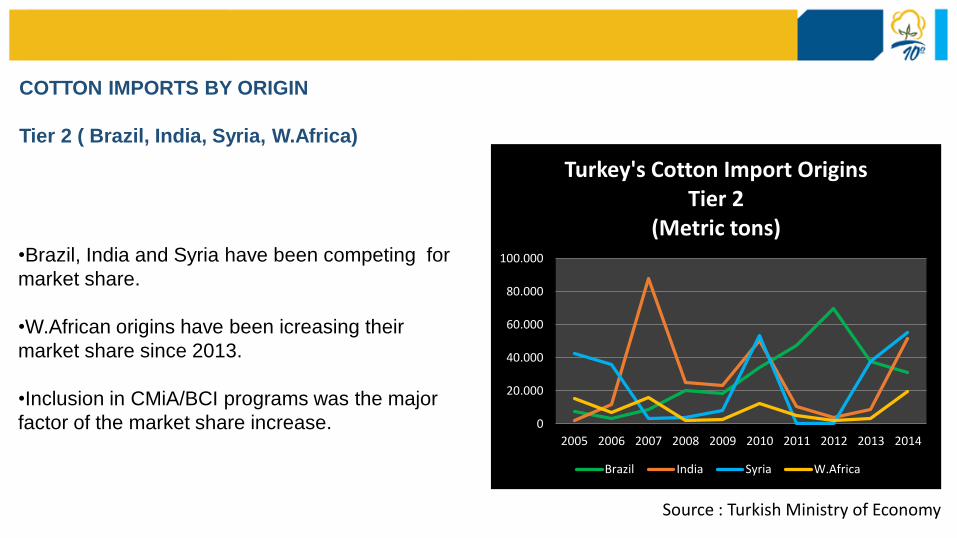
COTTON IMPORTS BY ORIGIN
Tier 2 ( Brazil, India, Syria, W.Africa)
•Brazil, India and Syria have been competing for
market share.
•W.African origins have been icreasing their
market share since 2013.
•Inclusion in CMiA/BCI programs was the major
factor of the market share increase. 0
20.000
40.000
60.000
80.000
100.000
2005 2006 2007 2008 2009 2010 2011 2012 2013 2014
Turkey's Cotton Import OriginsTier 2
(Metric tons)
Brazil India Syria W.Africa
Source : Turkish Ministry of Economy
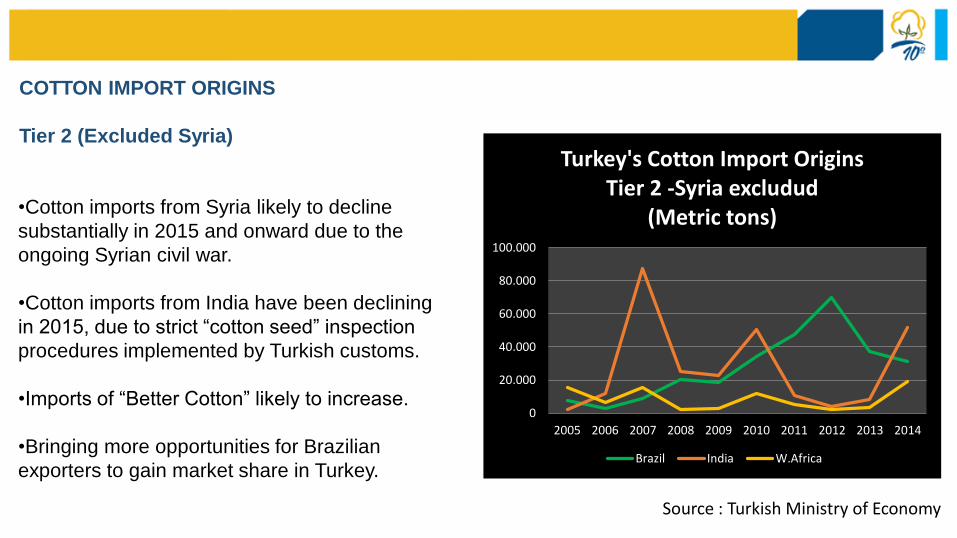
COTTON IMPORT ORIGINS
Tier 2 (Excluded Syria)
•Cotton imports from Syria likely to decline
substantially in 2015 and onward due to the
ongoing Syrian civil war.
•Cotton imports from India have been declining
in 2015, due to strict “cotton seed” inspection
procedures implemented by Turkish customs.
•Imports of “Better Cotton” likely to increase.
•Bringing more opportunities for Brazilian
exporters to gain market share in Turkey.
0
20.000
40.000
60.000
80.000
100.000
2005 2006 2007 2008 2009 2010 2011 2012 2013 2014
Turkey's Cotton Import OriginsTier 2 -Syria excludud
(Metric tons)
Brazil India W.Africa
Source : Turkish Ministry of Economy
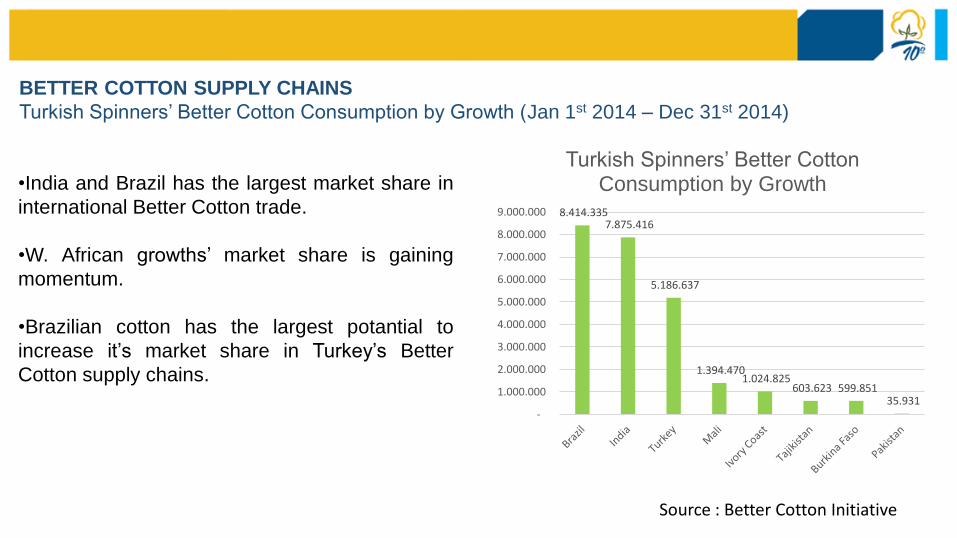
BETTER COTTON SUPPLY CHAINS
Turkish Spinners’ Better Cotton Consumption by Growth (Jan 1st 2014 – Dec 31st 2014)
•India and Brazil has the largest market share in
international Better Cotton trade.
•W. African growths’ market share is gaining
momentum.
•Brazilian cotton has the largest potantial to
increase it’s market share in Turkey’s Better
Cotton supply chains.
8.414.335 7.875.416
5.186.637
1.394.470 1.024.825
603.623 599.851 35.931
-
1.000.000
2.000.000
3.000.000
4.000.000
5.000.000
6.000.000
7.000.000
8.000.000
9.000.000
Turkish Spinners’ Better Cotton Consumption by Growth
Source : Better Cotton Initiative

BRAZILIAN COTTON IMPORTS INTO TURKEY
•Imports from Brazil have been steadily
increasing between 2005 - 2012.
•Brazilian cotton imports picked in 2012, and
steadily declined since than.
0
10.000
20.000
30.000
40.000
50.000
60.000
70.000
80.000
2005 2006 2007 2008 2009 2010 2011 2012 2013 2014 2015
Brazilian Cotton Imports into Turkey
Brazilian Cotton Imports (Tons)
Source : Turkish Ministry of Economy

Brazilian Cotton
(Quality Analysis and Performance)
27
28
29
30
2008/09 2009/10 2010/11 2011/12 2012/13 2013/14 2014/15
Brazilian CottonStaple
Roda Velha Sapezal
3,00
3,50
4,00
4,50
2008/092009/102010/112011/122012/132013/142014/15
Brazilian CottonMicronaire
Roda Velha Sapezal
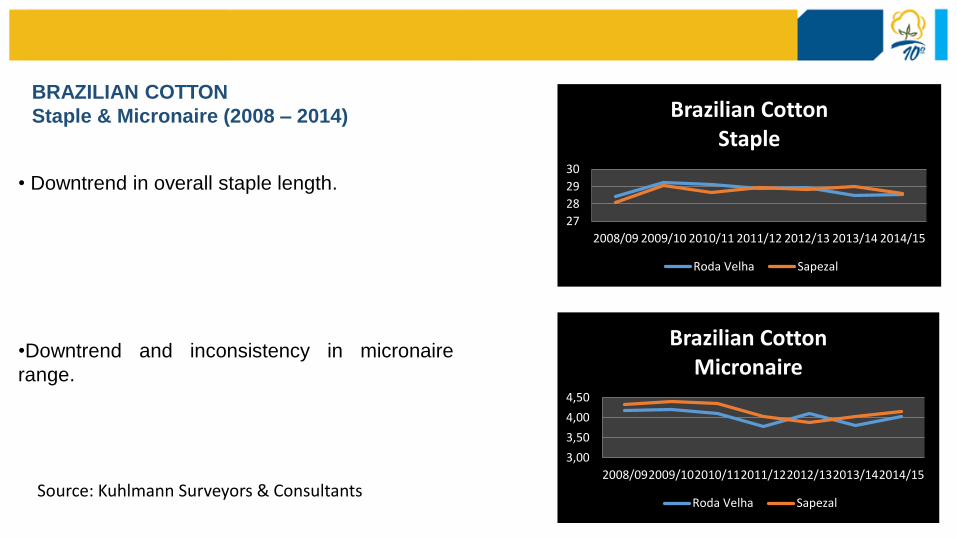
BRAZILIAN COTTON
Staple & Micronaire (2008 – 2014)
Source: Kuhlmann Surveyors & Consultants
• Downtrend in overall staple length.
•Downtrend and inconsistency in micronaire
range.
80
82
84
2008/09 2009/10 2010/11 2011/12 2012/13 2013/14 2014/15
Brazilian CottonUniformity
Roda Velha Sapezal
8
9
10
2008/09 2009/10 2010/11 2011/12 2012/13 2013/14 2014/15
Brazilian CottonShort Fiber Content
Roda Velha Sapezal
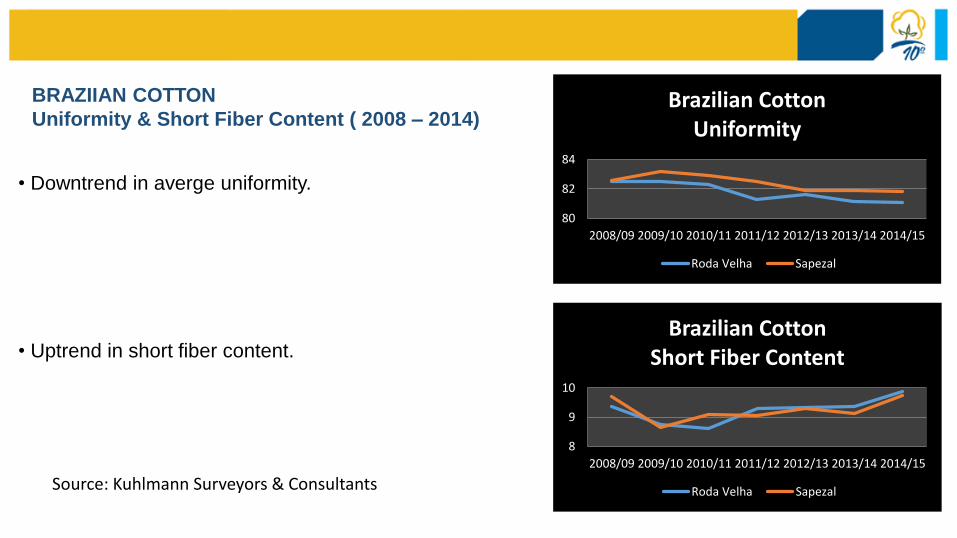
BRAZIIAN COTTON
Uniformity & Short Fiber Content ( 2008 – 2014)
Source: Kuhlmann Surveyors & Consultants
• Downtrend in averge uniformity.
• Uptrend in short fiber content.
Quality of Cotton
and
The Impact on Orta
Spinning & Weaving Efficiency

FLOW CHART OF DENIM PRODUCTION
Critical Stages Affected by Quality Parameters of Cotton
SpinningBall
WarpingRope Dying
Long Chain Beaming
Sizing Weaving Finishing
Unf&
sfc All
Mic
Unf&
sfc All
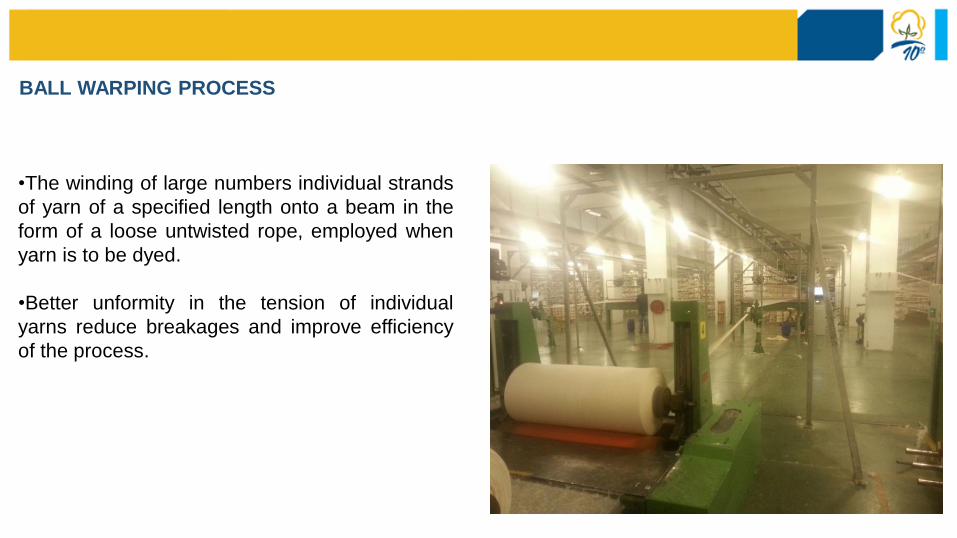
BALL WARPING PROCESS
•The winding of large numbers individual strands
of yarn of a specified length onto a beam in the
form of a loose untwisted rope, employed when
yarn is to be dyed.
•Better unformity in the tension of individual
yarns reduce breakages and improve efficiency
of the process.

BALL WARPING PROCESS
Brazilian Cotton Performance (dated Q1 – 2012)
• Best performance (least breakages) seen in lay
out consisting 50 % Brazilian + 50% US Cotton.
•Worst performance (more breakages) seen in
lay out consisting 100 % Brazilian.
100,00%98,46%
113,08%
80% Turkish RG 20% SG 50% Brazil+50% US 100% Brazil
Ball Warping Breakages
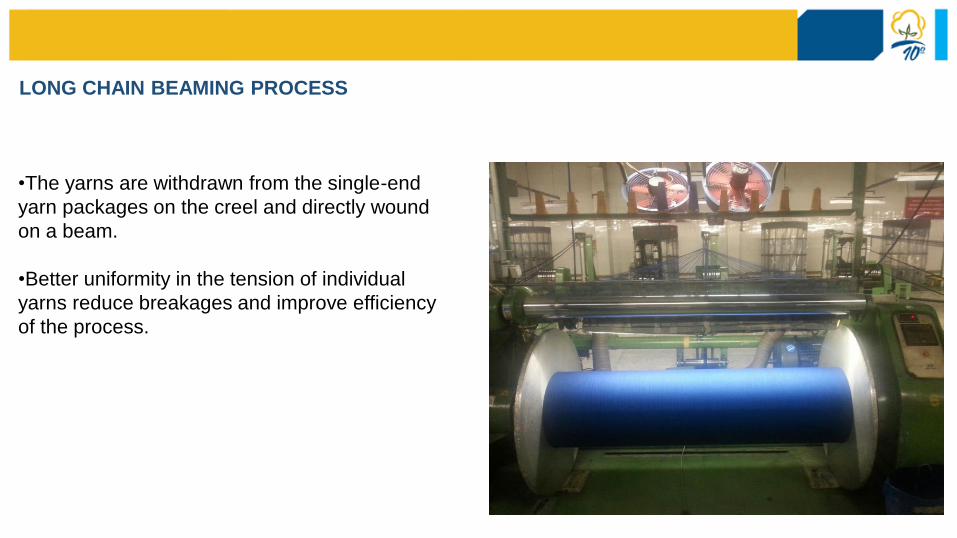
LONG CHAIN BEAMING PROCESS
•The yarns are withdrawn from the single-end
yarn packages on the creel and directly wound
on a beam.
•Better uniformity in the tension of individual
yarns reduce breakages and improve efficiency
of the process.
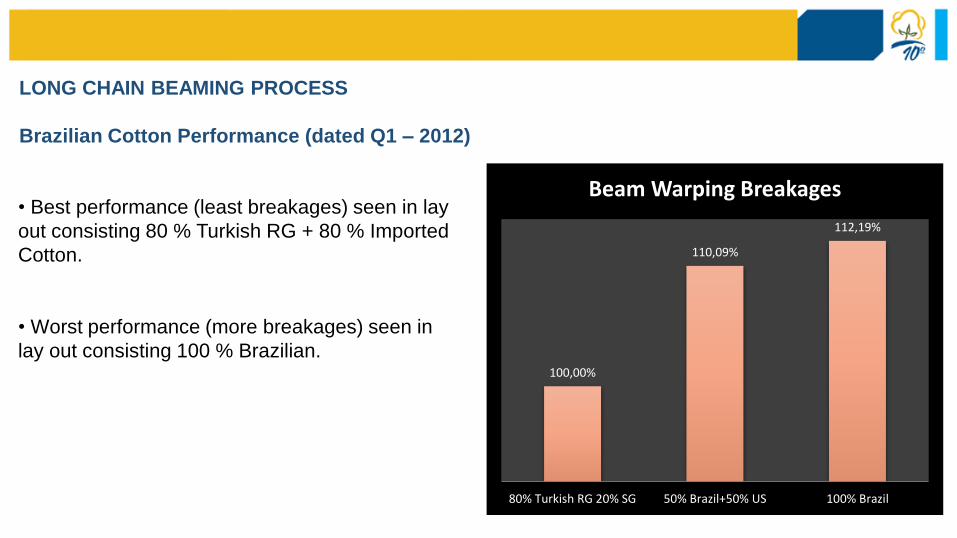
LONG CHAIN BEAMING PROCESS
Brazilian Cotton Performance (dated Q1 – 2012)
• Best performance (least breakages) seen in lay
out consisting 80 % Turkish RG + 80 % Imported
Cotton.
• Worst performance (more breakages) seen in
lay out consisting 100 % Brazilian.100,00%
110,09%
112,19%
80% Turkish RG 20% SG 50% Brazil+50% US 100% Brazil
Beam Warping Breakages
Comparison
Brazilian Cotton with Alternative Origins

A Comparison of Uniformity and Short Fiber Content
Saw Ginned Origins
Roller Ginned Origins
BrazilUSA
(Memphis/E)Greece Turkmenistan Mali Cameroon Turkey India
Uniformity 81,10 81,90 82,70 82,50 83,70 81,20 84,70 83,20
Short Fiber Content
9,70 8,50 7,90 8,30 7,30 9,80 6,00 6,40
Source : Orta Anadolu HVI Lab.
WEAKNESS OF BRAZILIAN COTTON
• High Variation and Inconsistancy in Physical Parameters within Lots
• Higher Short Fiber Content
• Lower Uniformity
STRENGTHS OF BRAZILIAN COTTON
• Large Size and Machanized Farming (Low Risk of Contamination)
• Saw Ginned (Less Trash – Higher Efficiency)
• Bale per Bale HVI (Quality Transparency)
• High Quality Packaging
• Strong corelation with NYF (Risk management applicable)
• Better Cotton Initiative and ABR Practices (Access to responsible textile supply chains)
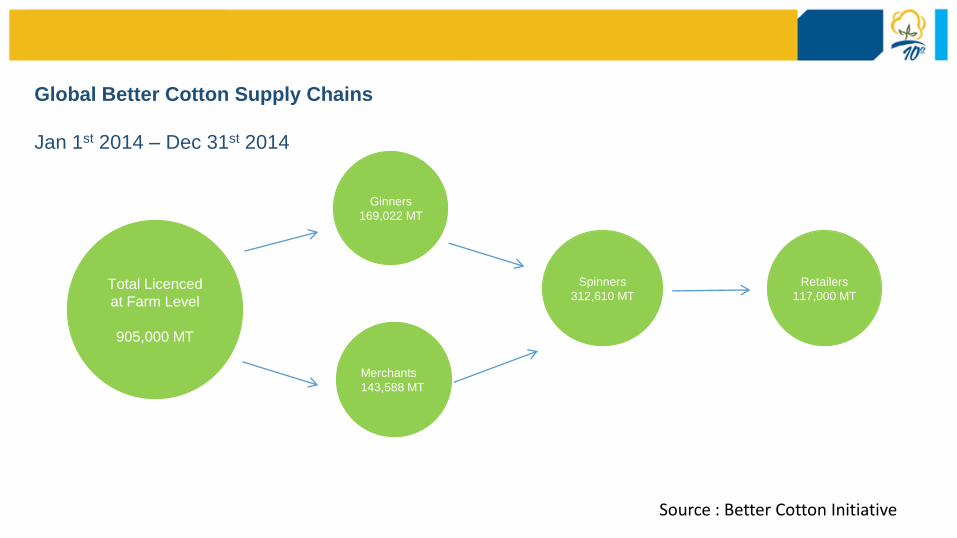
Global Better Cotton Supply Chains
Jan 1st 2014 – Dec 31st 2014
Total Licenced
at Farm Level
905,000 MT
Merchants
143,588 MT
Ginners
169,022 MT
Spinners
312,610 MT
Retailers
117,000 MT
Source : Better Cotton Initiative
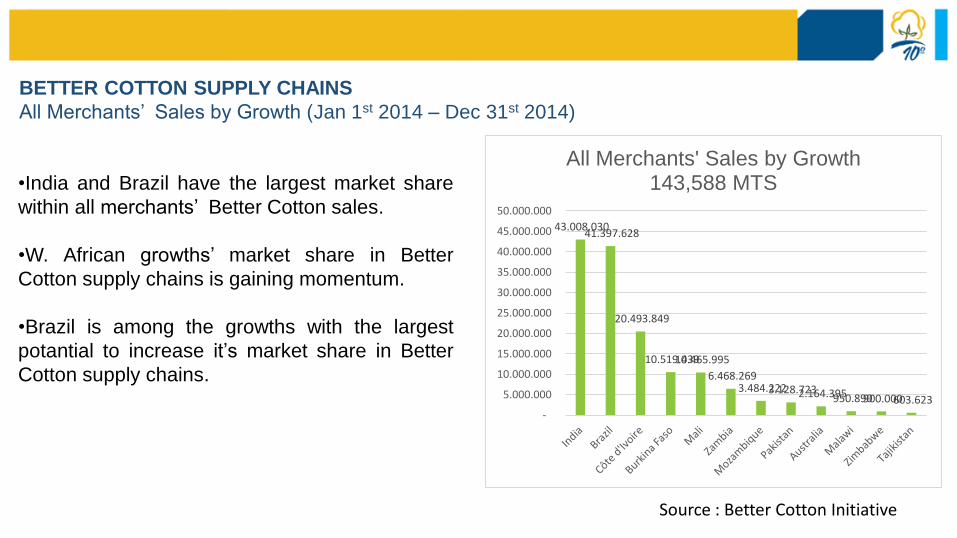
BETTER COTTON SUPPLY CHAINS
All Merchants’ Sales by Growth (Jan 1st 2014 – Dec 31st 2014)
•India and Brazil have the largest market share
within all merchants’ Better Cotton sales.
•W. African growths’ market share in Better
Cotton supply chains is gaining momentum.
•Brazil is among the growths with the largest
potantial to increase it’s market share in Better
Cotton supply chains.
43.008.030 41.397.628
20.493.849
10.519.439 10.465.995
6.468.269 3.484.222 3.128.723 2.164.395 950.890 900.000 603.623
-
5.000.000
10.000.000
15.000.000
20.000.000
25.000.000
30.000.000
35.000.000
40.000.000
45.000.000
50.000.000
All Merchants' Sales by Growth 143,588 MTS
Source : Better Cotton Initiative
Thank You
Leon Piçon
Orta Anadolu
Cotton Purchasing Director