a comparative study on the aeromechanic performances of
TRANSCRIPT

Contents lists available at ScienceDirect
Energy Conversion and Management
journal homepage: www.elsevier.com/locate/enconman
A Comparative study on the aeromechanic performances of upwind anddownwind horizontal-axis wind turbines
Zhenyu Wang1, Wei Tian, Hui Hu⁎
Department of Aerospace Engineering, Iowa State University, Ames, IA 50011, USA
A R T I C L E I N F O
Keywords:Upwind turbine (UWT)Downwind turbine (DWT)Turbine aeromechanicsWake flow characteristics
A B S T R A C T
Traditional horizontal-axis wind turbines are mainly designed as upwind configuration. In order to avoid bladestrikes, the rotor blades have to be positioned far enough away from the turbine tower and have to be designedas inflexible as possible. In addition, a complicated yaw control system is required to keep the turbine rotorfacing the incoming wind. Due to these drawbacks, the turbine in downwind configuration is proposed toovercome these disadvantages because, first of all, rotor blades can be designed more flexible since there is nodanger of blade strikes, and secondly, yaw control system could be eliminated if nacelle is designed appro-priately to follow the incoming wind direction passively. In the present study, a comparative experimentalinvestigation was conducted to quantify the aeromechanic performance of a downwind turbine (DWT), incomparison to that of a traditional upwind turbine (UWT). The thrust coefficient of the DWT model was found tobe increased slightly in the time-averaged quantity, but have a significant augment in the fluctuations. Due to theshadow effect, the power outputs of the DWT model was found to be decreased by 3.2% when they wereoperated in a same atmospheric boundary layer (ABL) wind. In addition, a high-resolution particle image ve-locimetry (PIV) system was employed to characterize the ensemble-averaged and phase-locked wake flowstructures to quantify the turbulent flow characteristics in the turbine wakes. The velocity deficit in the lowerhalf turbine wake for the UWT case was found to be greater than that of the DWT case at the location of X/D < 1.0. The higher wind load fluctuations for the DWT system were found to be correlated well with the higherTKE distributions in the turbine wakes. The phase-locked PIV measurements illustrated that the wake regionscan be divided into four zones, which are dominated by the vortices shedding from different turbine compo-nents. The detailed flow field measurements were correlated with the dynamic force and power measurementdata to elucidate the underlying physics.
1. Introduction
Wind energy is one of the primary renewable and clean energysources. Wind turbines are the most common system to convert thekinetic energy from wind into electrical energy. As we know that, windturbines can be generally divided into two configurations: horizontal-axis wind turbine (HAWT) and vertical-axis wind turbine (VAWT).HAWT is usually more efficient and has a longer lifetime than VAWTconfiguration [1]. Therefore, vast majority of the large-scale windturbines are applied as horizontal-axis designs. Traditional utility-scaleHAWTs have one singular rotor with three rotating blades, and most ofthem are mounted in front of turbine tower. This upwind configurationis mainly for the consideration of aerodynamic performance, for in-stance, to reduce the tower shadow effect [2–4], etc. However, thedisadvantages of this design are also prominent. Take the rotor blades
as an example, the rotor has to be positioned far enough away from theturbine tower to avoid blade strike. Therefore, these rotor blades haveto be designed as inflexible as possible to avert such problems, espe-cially for the blades employed in MW-class wind turbines. As a result,this requirement would greatly increase the blade manufacturing cost.It is massive especially compared with the numerous turbines (By theend of 2016, the global cumulative installed wind power capacity ex-panded to 486,749MW) [5] installed in large-scale onshore and off-shore wind farms. In order to avoid blade strike occurring in the op-eration, people usually tilt the rotors (e.g., 2.5–8°) slightly to keep themaway from turbine towers [2,3,6,7], but which would reduce the powergeneration in comparison to those turbines with zero tilt angle [8]. Inaddition, upwind wind turbines require a complicated yaw controlsystem to keep the turbine rotor facing the incoming wind [9]. With theconcerns of these drawbacks, the downwind configuration was
https://doi.org/10.1016/j.enconman.2018.02.038Received 2 November 2017; Received in revised form 18 January 2018; Accepted 9 February 2018
⁎ Corresponding author.
1 Current address: Simulation Innovation and Modeling Center (SIMCenter), The Ohio State University, Columbus, OH 43210, USA.E-mail address: [email protected] (H. Hu).
Energy Conversion and Management 163 (2018) 100–110
0196-8904/ © 2018 Elsevier Ltd. All rights reserved.
T
proposed to overcome these disadvantages existing in the upwind de-sign [4]. As we know that, the rotor in the downwind configuration isinstalled behind turbine tower, which means the rotor blades can bedesigned more flexible since there is no danger of blade strikes. Thiscould largely reduce the manufacturing cost and lower the weight ofrotor blades, potentially resulting in a 15–20% reduction in turbinecapital cost [10]. In addition, if nacelle can be appropriately designedto follow the incoming wind direction passively, there is no need to usea yaw control mechanism in the wind turbine system.
In comparison to a large amount of studies conducted to investigatethe flow performance on traditional upwind HAWTs [11–15], relativelylittle attention is paid on the downwind design for commercial appli-cation possibly due to the concern of shadow effect. Because peoplefound shadow effect would reduce the total power coefficient and in-crease turbulence and fatigue on wind turbines [2]. As a result, very fewliteratures on investigating downwind turbines can be found in the pastseveral decades and the corresponding flow characteristics are still notquite clear. Therein, most of them were studied by computationalmethods. Janajreh et al. [16,17] numerically investigated the rotor-tower interaction of downwind turbine configuration. They found thatthe aerofoil shape tower has a lower resulting aerodynamic force onrotating blades and a reduced rotor wake in comparison to those in thecircular tower case. However, these advantages would be diminishedunder highly-turbulent flows. Zhao et al. [9] used a high-fidelity CFDcode U2NCLE to compare two-bladed and three-bladed upwind anddownwind turbines, respectively. They stated that the unsteady aero-dynamic loads are higher in the downwind turbine than those in theupwind turbines, but the impact of rotor orientations (i.e., upwind ordownwind) are smaller than that caused by the blade number and therotating speed. Zhou and Wan [18] also observed that the rotor-towerinteraction in downwind turbines would cause a larger thrust reductionwhen the rotating blades approaching turbine tower. Given that ahigher flow incidence across the rotational disk and a higher axial ve-locity in the outboard portion of rotor blades, Frau et al. [7] found a 3%enhancement of power coefficient in the downwind configuration.However, the drawback is that the loadings on rotor blades are 14%higher than that in the upwind design. In contrast with the numericalstudies on the downwind turbines, Kress et al. [6] conducted an ex-perimental investigation to understand the unsteady torque character-istics with different rotor cone angles. They observed that the un-steadiness of rotor torque for the downwind configurations is about38–68% higher than the values in the corresponding upwind designs,which is similar with the results shown in the aforementioned compu-tational studies. Larwood and Chow [19]confirmed this finding througha wind tunnel study on a downwind NREL Phase VI wind turbine.However, the fatigue loads can be significantly mitigated if an aero-dynamic shroud that aligned with the incoming wind direction, isamended on the turbine tower. They also stated that the downwindconing could essentially reduce the average loads for blade flap-bending, which shows a great benefit in applying the downwind designfor large-scale wind turbines. Furthermore, Kress et al. [20] found thedownwind rotor configuration is more suitable for yaw stability with agiven wind condition, which could be easier to control turbine rotors
and produce more power from the same incoming airflow.According to the aforementioned studies, the flow characteristics of
downwind rotor design, such as the rotor-tower interaction, are notfully understood because the shortage of detailed investigations. As aresult, the aim of the present study is to provide a comprehensive ex-perimental study on the flow performance of a traditional upwindturbine (UWT) and a downwind turbine (DWT). The instantaneouswind loads acting on both wind turbines were measured to quantify thefatigue analysis. The detailed velocity distributions were obtained by aplanar particle image velocimetry (PIV) measurement, under the sameincoming flow condition. The measured velocity and vorticity dis-tributions were used to characterize the turbine wake characteristicsand evolutions of the unsteady blade tip and root vortices. The poweroutputs of the model wind turbines were also measured to quantify theinfluence of upwind and downwind configurations in power generation.
2. Experimental setup and wind turbine models
2.1. Wind tunnel
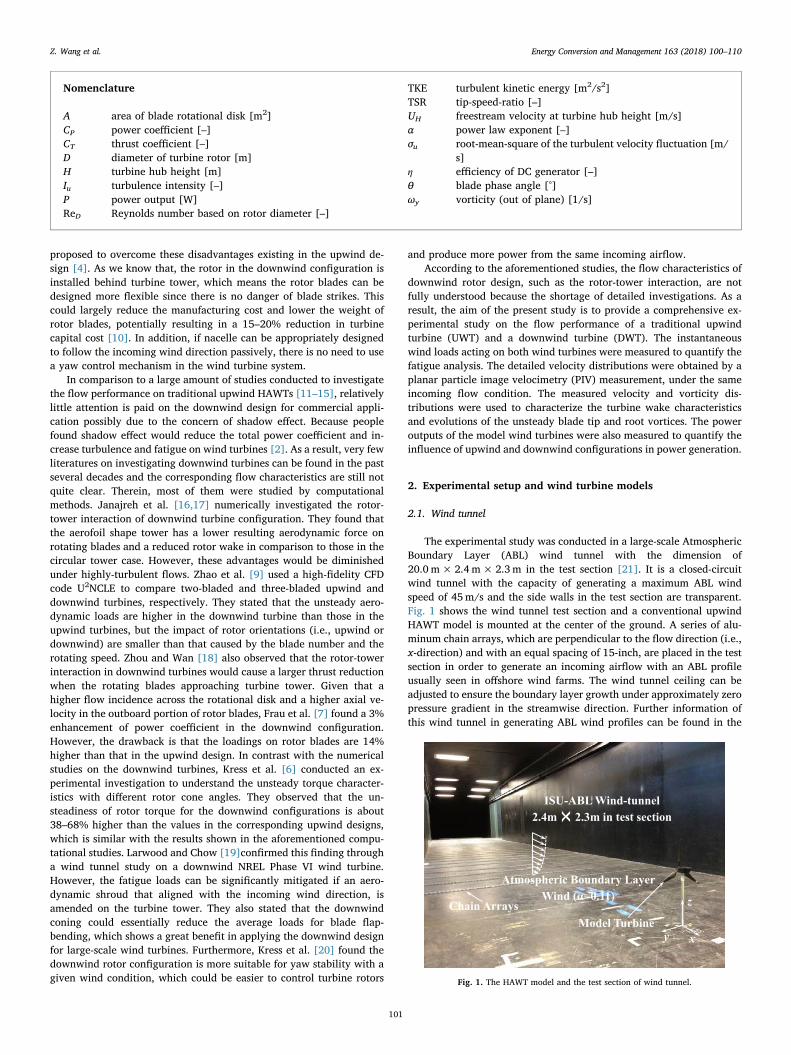
The experimental study was conducted in a large-scale AtmosphericBoundary Layer (ABL) wind tunnel with the dimension of20.0 m×2.4m×2.3m in the test section [21]. It is a closed-circuitwind tunnel with the capacity of generating a maximum ABL windspeed of 45m/s and the side walls in the test section are transparent.Fig. 1 shows the wind tunnel test section and a conventional upwindHAWT model is mounted at the center of the ground. A series of alu-minum chain arrays, which are perpendicular to the flow direction (i.e.,x-direction) and with an equal spacing of 15-inch, are placed in the testsection in order to generate an incoming airflow with an ABL profileusually seen in offshore wind farms. The wind tunnel ceiling can beadjusted to ensure the boundary layer growth under approximately zeropressure gradient in the streamwise direction. Further information ofthis wind tunnel in generating ABL wind profiles can be found in the
Nomenclature
A area of blade rotational disk [m2]CP power coefficient [–]CT thrust coefficient [–]D diameter of turbine rotor [m]H turbine hub height [m]Iu turbulence intensity [–]P power output [W]ReD Reynolds number based on rotor diameter [–]
TKE turbulent kinetic energy [m2/s2]TSR tip-speed-ratio [–]UH freestream velocity at turbine hub height [m/s]α power law exponent [–]σu root-mean-square of the turbulent velocity fluctuation [m/
s]η efficiency of DC generator [–]θ blade phase angle [°]ωy vorticity (out of plane) [1/s]
Atmospheric Boundary Layer Wind ( =0.11)
ISU-ABL Wind-tunnel2.4m 2.3m in test section
Model Turbinexy
zChain Arrays
Fig. 1. The HAWT model and the test section of wind tunnel.
Z. Wang et al. Energy Conversion and Management 163 (2018) 100–110
101
previous study of Tian et al. [22].A typical wind profile over an open terrain condition can be ap-
proximately expressed as a power law function [23]. For the presentstudy, the incoming wind speed in vertical direction (U(z)) can be de-termined by the function shown below:
=U Z U z H( ) ( / )Hα (1)
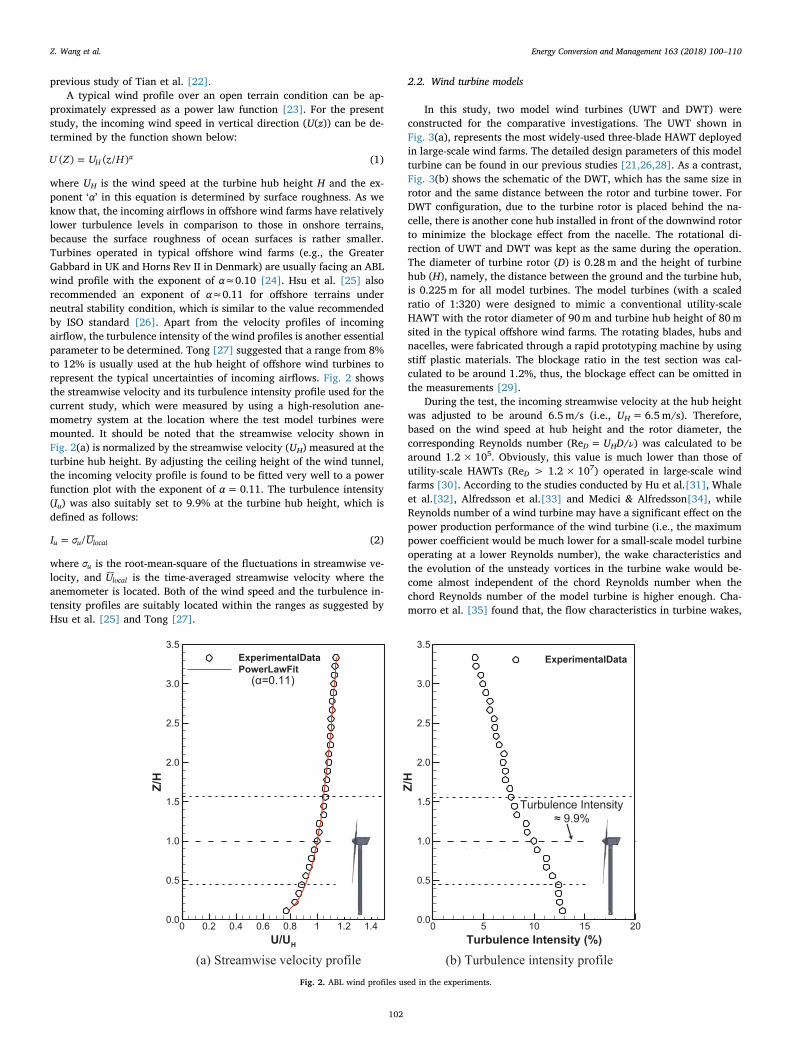
where UH is the wind speed at the turbine hub height H and the ex-ponent ‘α’ in this equation is determined by surface roughness. As weknow that, the incoming airflows in offshore wind farms have relativelylower turbulence levels in comparison to those in onshore terrains,because the surface roughness of ocean surfaces is rather smaller.Turbines operated in typical offshore wind farms (e.g., the GreaterGabbard in UK and Horns Rev II in Denmark) are usually facing an ABLwind profile with the exponent of α≈0.10 [24]. Hsu et al. [25] alsorecommended an exponent of α≈0.11 for offshore terrains underneutral stability condition, which is similar to the value recommendedby ISO standard [26]. Apart from the velocity profiles of incomingairflow, the turbulence intensity of the wind profiles is another essentialparameter to be determined. Tong [27] suggested that a range from 8%to 12% is usually used at the hub height of offshore wind turbines torepresent the typical uncertainties of incoming airflows. Fig. 2 showsthe streamwise velocity and its turbulence intensity profile used for thecurrent study, which were measured by using a high-resolution ane-mometry system at the location where the test model turbines weremounted. It should be noted that the streamwise velocity shown inFig. 2(a) is normalized by the streamwise velocity (UH) measured at theturbine hub height. By adjusting the ceiling height of the wind tunnel,the incoming velocity profile is found to be fitted very well to a powerfunction plot with the exponent of α=0.11. The turbulence intensity(Iu) was also suitably set to 9.9% at the turbine hub height, which isdefined as follows:
=I σ U/u u local (2)
where σu is the root-mean-square of the fluctuations in streamwise ve-locity, and Ulocal is the time-averaged streamwise velocity where theanemometer is located. Both of the wind speed and the turbulence in-tensity profiles are suitably located within the ranges as suggested byHsu et al. [25] and Tong [27].
2.2. Wind turbine models
In this study, two model wind turbines (UWT and DWT) wereconstructed for the comparative investigations. The UWT shown inFig. 3(a), represents the most widely-used three-blade HAWT deployedin large-scale wind farms. The detailed design parameters of this modelturbine can be found in our previous studies [21,26,28]. As a contrast,Fig. 3(b) shows the schematic of the DWT, which has the same size inrotor and the same distance between the rotor and turbine tower. ForDWT configuration, due to the turbine rotor is placed behind the na-celle, there is another cone hub installed in front of the downwind rotorto minimize the blockage effect from the nacelle. The rotational di-rection of UWT and DWT was kept as the same during the operation.The diameter of turbine rotor (D) is 0.28m and the height of turbinehub (H), namely, the distance between the ground and the turbine hub,is 0.225m for all model turbines. The model turbines (with a scaledratio of 1:320) were designed to mimic a conventional utility-scaleHAWT with the rotor diameter of 90m and turbine hub height of 80msited in the typical offshore wind farms. The rotating blades, hubs andnacelles, were fabricated through a rapid prototyping machine by usingstiff plastic materials. The blockage ratio in the test section was cal-culated to be around 1.2%, thus, the blockage effect can be omitted inthe measurements [29].
During the test, the incoming streamwise velocity at the hub heightwas adjusted to be around 6.5m/s (i.e., UH=6.5m/s). Therefore,based on the wind speed at hub height and the rotor diameter, thecorresponding Reynolds number (ReD=UHD/ν) was calculated to bearound 1.2× 10⁵. Obviously, this value is much lower than those ofutility-scale HAWTs (ReD > 1.2×10⁷) operated in large-scale windfarms [30]. According to the studies conducted by Hu et al.[31], Whaleet al.[32], Alfredsson et al.[33] and Medici & Alfredsson[34], whileReynolds number of a wind turbine may have a significant effect on thepower production performance of the wind turbine (i.e., the maximumpower coefficient would be much lower for a small-scale model turbineoperating at a lower Reynolds number), the wake characteristics andthe evolution of the unsteady vortices in the turbine wake would be-come almost independent of the chord Reynolds number when thechord Reynolds number of the model turbine is higher enough. Cha-morro et al. [35] found that, the flow characteristics in turbine wakes,
(a) Streamwise velocity profile (b) Turbulence intensity profileU/UH
Z/H
0 0.2 0.4 0.6 0.8 1 1.2 1.40.0
0.5
1.0
1.5
2.0
2.5
3.0
3.5ExperimentalDataPowerLawFit
=0.11
(α=0.11)
Turbulence Intensity (%)
Z/H
0 5 10 15 200.0
0.5
1.0
1.5
2.0
2.5
3.0
3.5ExperimentalData
HubheightTurbulenceIntensity:9.9%
Turbulence Intensity≈ 9.9%
Fig. 2. ABL wind profiles used in the experiments.
Z. Wang et al. Energy Conversion and Management 163 (2018) 100–110
102

such as velocity, shear stress and turbulence intensity, were found toillustrate asymptotic manners with the changing of the Reynoldsnumbers. While the independence of Reynolds number for velocity wasfound to be reached at a lower value of ReD≈ 4.8× 10⁴, the Reynoldsnumber independence would reach at ReD≈ 9.3×10⁴ for higher ordercharacteristics (e.g., shear stress and turbulence intensity). As men-tioned above, the corresponding Reynolds number of the present studyis about 1.2×10⁵, which is well above the required minimum Rey-nolds number for the independence for both low and high orders flowcharacteristics as suggested by Chamorro et al. [35]. Similarly, the
studies of Whale et al. [32] and Medici et al. [36] also revealed that, thebehaviors of the unsteady flow structures in the turbine wake wouldbecome independent to the Reynolds number once it reaches to a cer-tain level. The wind turbines would generate similar unsteady wakeflow structures under the same tip-speed-ratio (TSR).
2.3. Dynamic wind load and power output measurements
During the experiment, the wind turbine blades, hubs and nacelleswere assembled together and supported by a circular rod that was
(a) UWT (b) DWT
D=280 mm D=280 mm
Fig. 3. Schematics of the tested wind turbine modles.
Incoming ABL Wind
Wind Tunnel
Laser ArmJR3
Tachometer
DG #1 DG #2
Camera #1Camera #2
Host Computer
Laser Sheet
Nd:YAG Laser
x
z
y
Fig. 4. Experimental setup for the dynamic wind loads and PIV measurements.
Z. Wang et al. Energy Conversion and Management 163 (2018) 100–110
103
employed as a turbine tower. In order to monitor the dynamic windloads acting on the wind turbines, a load cell called JR3 (model:30E12A-I40), was applied to measure the dynamic thrust forces andbending moments through a high-sensitive force transducer. The detailsabout this load cell are available in our previous research [26]. Fig. 4shows the experimental setup for the wind load measurement. The loadcell was mounted under the wind tunnel test section to support theturbine tower. During the measurements, the aerodynamic forces actingon these model turbines were continuously collected for 120 s with asampling rate of 1000 Hz for each model wind turbine. A Monarchtachometer was adopted to capture the turbine rotational speeds. Itshould be noted that the resonant frequencies measured from the loadcell were found to be essentially higher than the rotational frequenciesof turbine rotors.
The power outputs of the model wind turbines can be calculatedthrough measuring the voltages from the DC generator in the nacelleand the currents in the electric circuits. By adjusting the electric re-sistance in the circuits, the wind turbine rotational speed can be variedfrom 0 to 2200 rpm, which are equivalent to the TSR from 0 to 6.5. Theoptimum TSR (i.e., with the maximum power output) was observed tobe around 5.0 in the current study, which lies in the range of 4.0–8.0 fortypical modern wind farms [37].
2.4. Flow field measurements
Fig. 4 also illustrates the experimental setup for the 2-D PIV mea-surements, which was used to measure the velocity fields at the verticalcentral plane (i.e., Y=0) to quantify the flow characteristics in theturbine wakes (X/D < 2.2). A fog machine (ROSCO 1900) was used togenerate small oil droplets (∼1 μm in diameter) and spray them in theincoming airflow for illumination purpose. A double-pulsed Nd:YAGlaser (EverGreen 200) was utilized to produce a pulsed laser beam at awavelength of 532 nm. The laser beam was then formed as a sheet witha thickness of around 1.0 mm after passing through a series of mirrorsalong with cylindrical and spherical lenses. Two high-resolution 14-bitCCD cameras (PCO2000), with an overlapping capture window of20mm in streamwise direction, were placed perpendicular to the lasersheet for image acquisitions simultaneously, because the window size ofone camera is not sufficient to capture the whole interested region inthe near wake. A digital time delay generator (BNC565) was applied tocontrol the timing sequences of the laser system and the image acqui-sition. After the image acquisition, the instantaneous velocity compo-nents can be derived from the measured PIV snapshots in the post-processing by using a cross-correlation with an interrogation window of32×32 pixels and an effective overlap rate of 50%. The ensemble-averaged flow characteristics such as mean velocity, turbulent kinetic
energy (TKE) and vorticity can be calculated from the velocity com-ponents and their variances. For each test case, a sequence of 1000 pairsof instantaneous images were captured so as to attain a good con-vergence of flow characteristics of the ensemble-averaged measure-ments. The uncertainty levels of measurements were estimated to bearound 2% for velocity and 5% for TKE and vorticity, respectively [38].
Both ensemble-averaged and phase-locked PIV measurements wereperformed to achieve the time-averaged and instantaneous flow fields.During the ensemble-averaged measurements, a constant image ac-quisition rate (different from the blade rotating frequency) was utilizedto measure the flow quantities in the wake region under variant bladephase angles. While for the phase-locked measurements, a digitaltachometer and another time delay generator (Stanford DG535) wereemployed in the system to control the timing of image acquisition at aspecific blade phase position. They were performed to elucidate moreinsights about the evolution of unsteady turbulent structures such as tipand root vortices shedding from different blade phase positions. Duringthe measurement, the zero phase angle was pre-selected at the mostupward position of a rotor blade, which was also marked by a reflectivetape on the blade surface. Since the turbine rotor has 3 blades (with aphase differentiation of 120°), 8 phase angles were selected rangingfrom 0° to 105° with a constant increment of 15°. At each selected bladephase angle, 400 image pairs were captured to calculate the phase-averaged flow statistics in the wake regions.
3. Results and discussion
3.1. Measurements of dynamic wind loads acting on the wind turbines
The effect of dynamic wind loads acting on turbine is important inthe optimal design of large-scale HAWTs [31]. In this study, the in-stantaneous force components were measured by a JR3 load cell with asampling frequency of 1000 Hz. The corresponding thrust coefficient(CT) of wind turbines, are defined as
=C TρU πD
Tx
H18
2 2(3)
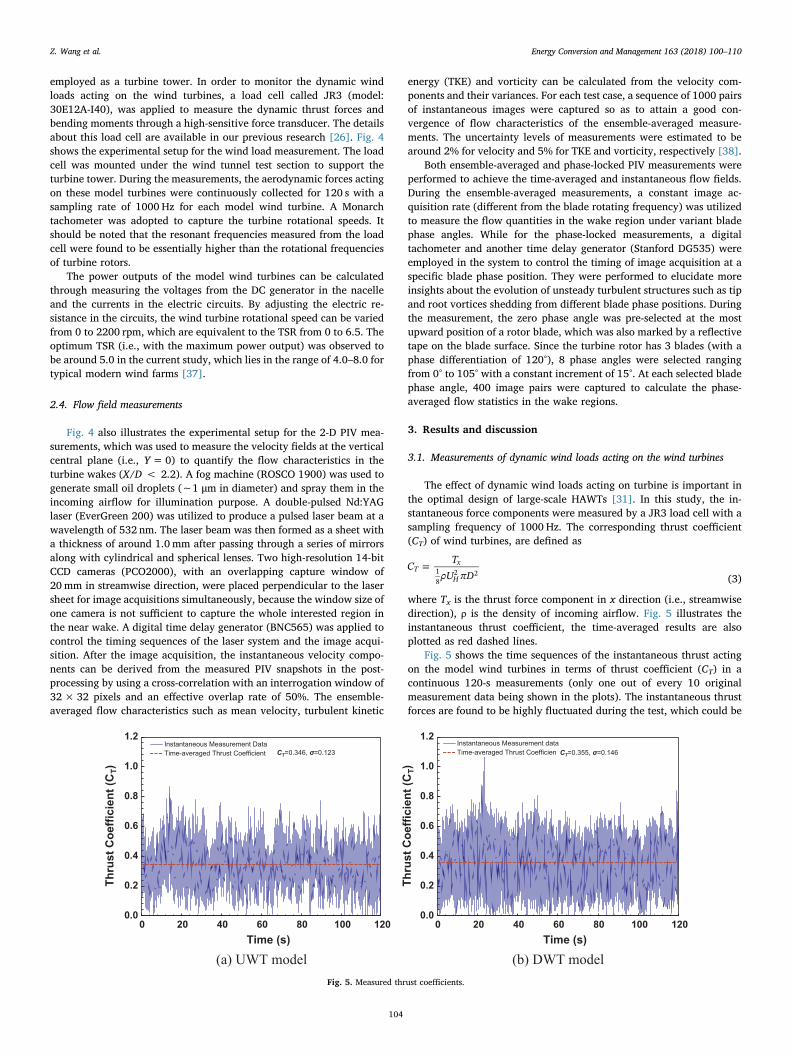
where Tx is the thrust force component in x direction (i.e., streamwisedirection), ρ is the density of incoming airflow. Fig. 5 illustrates theinstantaneous thrust coefficient, the time-averaged results are alsoplotted as red dashed lines.
Fig. 5 shows the time sequences of the instantaneous thrust actingon the model wind turbines in terms of thrust coefficient (CT) in acontinuous 120-s measurements (only one out of every 10 originalmeasurement data being shown in the plots). The instantaneous thrustforces are found to be highly fluctuated during the test, which could be
(a) UWT model (b) DWT model
0.0
0.2
0.4
0.6
0.8
1.0
1.2
0 20 40 60 80 100 120
Thru
st C
oeffi
cien
t (C
T)
Time (s)
Instantaneous Measurement DataTime-averaged Thrust Coefficient CT=0.346, σ=0.123
0.0
0.2
0.4
0.6
0.8
1.0
1.2
0 20 40 60 80 100 120
Thru
st C
oeffi
cien
t (C
T)
Time (s)
Instantaneous Measurement dataTime-averaged Thrust CoefficientCT=0.355, σ=0.146
Fig. 5. Measured thrust coefficients.
Z. Wang et al. Energy Conversion and Management 163 (2018) 100–110
104
2 times higher than the time-averaged values. The time-averaged thrustcoefficient of UWT model is measured to be 0.346, which is close to thevalues reported in the experimental studies of Lebron et al. (0.32) [39],Cal et al. (0.32) [40], and Zhang et al. (0.48) [41] under similar tip-speed-ratios (TSR). However, the thrust coefficient values in computa-tional studies are usually found to be much higher than those in theexperimental investigations. For example, Wu and Porte-Agel [42]found the thrust coefficient was about 0.75 at the TSR near 5.0 due to amuch higher Reynolds number used in their study. For downwindconfiguration, as expected, both of the mean thrust coefficient and itsstandard deviation (σ) values are found to be higher than those in theUWT model, which agree well with the findings shown in Zhao et al. [9]and Frau et al. [7]. The thrust coefficient is found to be slightly en-hanced (0.355 versus 0.346) by 2.6%, while its fluctuation (i.e., stan-dard deviation) increases by 18.7%. The majority of instantaneousthrust coefficients for the UWT case are found to be within the rangebetween 0.20 and 0.55, while for the DWT case, the majority of themare observed to be concentrated from 0.15 to 0.60. As suggested by Huet al. [31] and Tian et al. [22], the standard deviation values of thedynamic wind loads can be employed as an essential parameter toevaluate the fatigue loads acting on wind turbines. The larger variations(i.e., with high fluctuations) of wind loads in the DWT configurationwould indicate greater fatigue loads acting on the turbine, which isbelieved to be due to the shadow effect occurred between the turbinetower and rotor blades. Although the mean thrust coefficients for bothcompared configurations are almost identical, the larger fluctuationsmay indicate a less lifetime of the DWT configuration. In addition, ac-cording to the description in Troldborg et al. [43], the shadow effect inthe downwind design would also cause power reduction, which will bediscussed in the following section of power measurement analysis.
3.2. Power measurements
In order to evaluate the drawback of DWT configuration in powergeneration due to the shadow effect, the power coefficient of the twowind turbines was also measured for comparison. It is well known that,the Reynolds number in such small-scale wind turbines is much lowerthan that of the utility-scale ones, which has a substantial effect on thepower generation in wind-tunnel testing [31]. In the present study, thepower coefficient (CP) is defined as follows:
=CV η
ρU ARP
H L
2
12
3(4)
where RL is the electric resistance applied in the circuit, V is the mea-sured voltage of RL, A is the blade rotational area and η is the efficiencyof the small DC generator. As described in Hu et al. [31], the maximumpower coefficient of wind turbines operating at low Reynolds numbercould be significantly lower than that of large-scale wind turbines inmodern wind farms. In fact, the optimum mechanical power coefficientof the traditional UWT model was found to be about 0.2 for the presentstudy, which is significantly lower than that of utility-scale HAWTs(e.g., CP=0.40–0.45) placed in modern onshore and offshore windfarms. Instead of comparing the absolute value of power coefficientsdirectly, they were normalized based on the power coefficient (CP_ref) ofthe traditional UWT system.
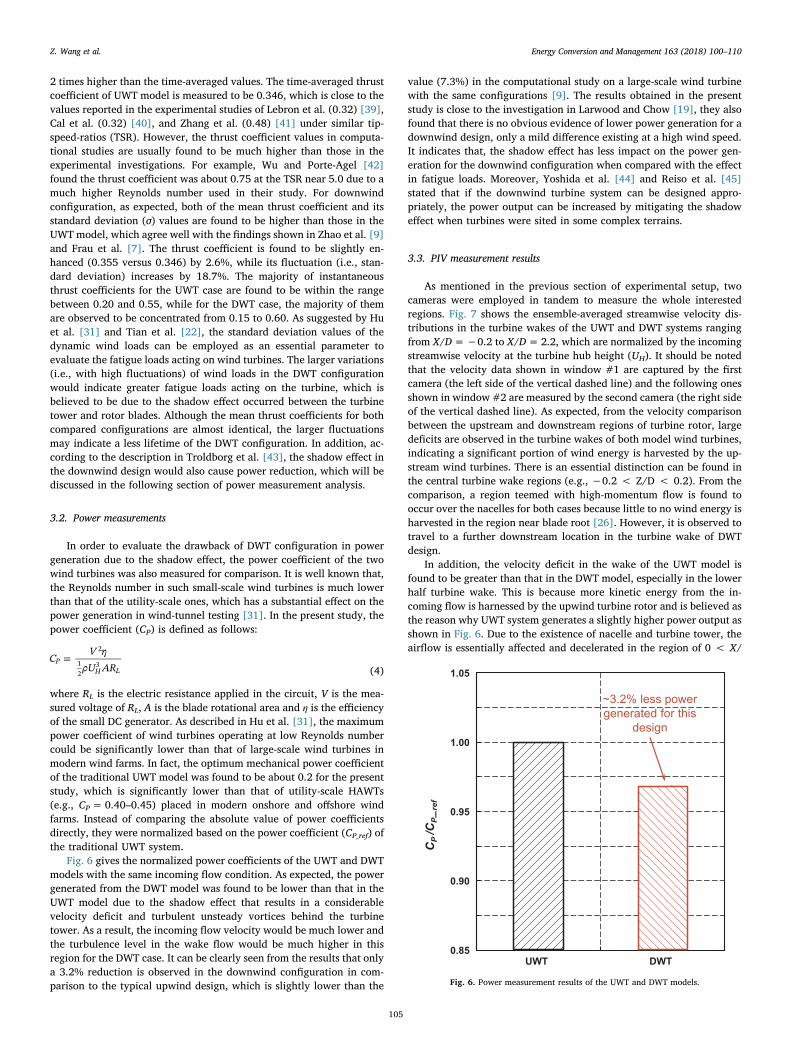
Fig. 6 gives the normalized power coefficients of the UWT and DWTmodels with the same incoming flow condition. As expected, the powergenerated from the DWT model was found to be lower than that in theUWT model due to the shadow effect that results in a considerablevelocity deficit and turbulent unsteady vortices behind the turbinetower. As a result, the incoming flow velocity would be much lower andthe turbulence level in the wake flow would be much higher in thisregion for the DWT case. It can be clearly seen from the results that onlya 3.2% reduction is observed in the downwind configuration in com-parison to the typical upwind design, which is slightly lower than the
value (7.3%) in the computational study on a large-scale wind turbinewith the same configurations [9]. The results obtained in the presentstudy is close to the investigation in Larwood and Chow [19], they alsofound that there is no obvious evidence of lower power generation for adownwind design, only a mild difference existing at a high wind speed.It indicates that, the shadow effect has less impact on the power gen-eration for the downwind configuration when compared with the effectin fatigue loads. Moreover, Yoshida et al. [44] and Reiso et al. [45]stated that if the downwind turbine system can be designed appro-priately, the power output can be increased by mitigating the shadoweffect when turbines were sited in some complex terrains.
3.3. PIV measurement results
As mentioned in the previous section of experimental setup, twocameras were employed in tandem to measure the whole interestedregions. Fig. 7 shows the ensemble-averaged streamwise velocity dis-tributions in the turbine wakes of the UWT and DWT systems rangingfrom X/D=−0.2 to X/D=2.2, which are normalized by the incomingstreamwise velocity at the turbine hub height (UH). It should be notedthat the velocity data shown in window #1 are captured by the firstcamera (the left side of the vertical dashed line) and the following onesshown in window #2 are measured by the second camera (the right sideof the vertical dashed line). As expected, from the velocity comparisonbetween the upstream and downstream regions of turbine rotor, largedeficits are observed in the turbine wakes of both model wind turbines,indicating a significant portion of wind energy is harvested by the up-stream wind turbines. There is an essential distinction can be found inthe central turbine wake regions (e.g., −0.2 < Z/D < 0.2). From thecomparison, a region teemed with high-momentum flow is found tooccur over the nacelles for both cases because little to no wind energy isharvested in the region near blade root [26]. However, it is observed totravel to a further downstream location in the turbine wake of DWTdesign.
In addition, the velocity deficit in the wake of the UWT model isfound to be greater than that in the DWT model, especially in the lowerhalf turbine wake. This is because more kinetic energy from the in-coming flow is harnessed by the upwind turbine rotor and is believed asthe reason why UWT system generates a slightly higher power output asshown in Fig. 6. Due to the existence of nacelle and turbine tower, theairflow is essentially affected and decelerated in the region of 0 < X/
0.85
0.90
0.95
1.00
1.05
UWT DWT
CP/CP_
ref
~3.2% less power generated for this
design
Fig. 6. Power measurement results of the UWT and DWT models.
Z. Wang et al. Energy Conversion and Management 163 (2018) 100–110
105
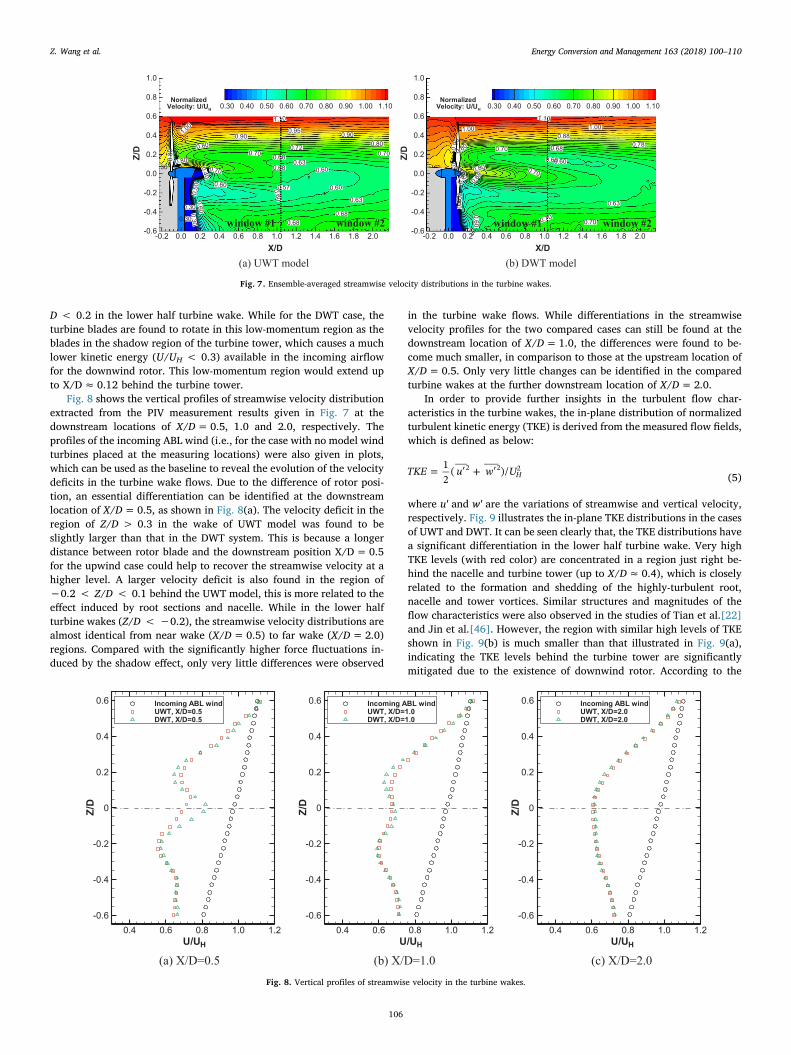
D < 0.2 in the lower half turbine wake. While for the DWT case, theturbine blades are found to rotate in this low-momentum region as theblades in the shadow region of the turbine tower, which causes a muchlower kinetic energy (U/UH < 0.3) available in the incoming airflowfor the downwind rotor. This low-momentum region would extend upto X/D≈ 0.12 behind the turbine tower.
Fig. 8 shows the vertical profiles of streamwise velocity distributionextracted from the PIV measurement results given in Fig. 7 at thedownstream locations of X/D=0.5, 1.0 and 2.0, respectively. Theprofiles of the incoming ABL wind (i.e., for the case with no model windturbines placed at the measuring locations) were also given in plots,which can be used as the baseline to reveal the evolution of the velocitydeficits in the turbine wake flows. Due to the difference of rotor posi-tion, an essential differentiation can be identified at the downstreamlocation of X/D=0.5, as shown in Fig. 8(a). The velocity deficit in theregion of Z/D > 0.3 in the wake of UWT model was found to beslightly larger than that in the DWT system. This is because a longerdistance between rotor blade and the downstream position X/D=0.5for the upwind case could help to recover the streamwise velocity at ahigher level. A larger velocity deficit is also found in the region of−0.2 < Z/D < 0.1 behind the UWT model, this is more related to theeffect induced by root sections and nacelle. While in the lower halfturbine wakes (Z/D < −0.2), the streamwise velocity distributions arealmost identical from near wake (X/D=0.5) to far wake (X/D=2.0)regions. Compared with the significantly higher force fluctuations in-duced by the shadow effect, only very little differences were observed
in the turbine wake flows. While differentiations in the streamwisevelocity profiles for the two compared cases can still be found at thedownstream location of X/D=1.0, the differences were found to be-come much smaller, in comparison to those at the upstream location ofX/D=0.5. Only very little changes can be identified in the comparedturbine wakes at the further downstream location of X/D=2.0.
In order to provide further insights in the turbulent flow char-acteristics in the turbine wakes, the in-plane distribution of normalizedturbulent kinetic energy (TKE) is derived from the measured flow fields,which is defined as below:
= ′ + ′TKE u w U12
( )/ H2 2 2
(5)
where u' and w' are the variations of streamwise and vertical velocity,respectively. Fig. 9 illustrates the in-plane TKE distributions in the casesof UWT and DWT. It can be seen clearly that, the TKE distributions havea significant differentiation in the lower half turbine wake. Very highTKE levels (with red color) are concentrated in a region just right be-hind the nacelle and turbine tower (up to X/D≈ 0.4), which is closelyrelated to the formation and shedding of the highly-turbulent root,nacelle and tower vortices. Similar structures and magnitudes of theflow characteristics were also observed in the studies of Tian et al.[22]and Jin et al.[46]. However, the region with similar high levels of TKEshown in Fig. 9(b) is much smaller than that illustrated in Fig. 9(a),indicating the TKE levels behind the turbine tower are significantlymitigated due to the existence of downwind rotor. According to the
(a) UWT model (b) DWT model
0.30
0.30
.30
0.300.40
0.50 0.60
0.60
0.70
0.700.
800.80
0.901.0
0
0.630.70
0.68
0.800.90
0.68
0.63
0.72
0.95
0.80
0.60
0.68
0.68
0.57
1.10
0.60
0.60
X/D
Z/D
-0.2 0.0 0.2 0.4 0.6 0.8 1.0 1.2 1.4 1.6 1.8 2.0-0.6
-0.4
-0.2
0.0
0.2
0.4
0.6
0.8
1.0
0.30 0.40 0.50 0.60 0.70 0.80 0.90 1.00 1.10Normalized
Velocity: U/UH
window #1 window #2
0.30
0.40
0.40
0.50
0 5
0.60
0.60
0.70
0.700.70
0.70
0.80
0.80
0.90
1.00
1.10
0.600.60
0.68
0.70
0.780.88
1.00
0.68
0.63
X/D
Z/D
-0.2 0.0 0.2 0.4 0.6 0.8 1.0 1.2 1.4 1.6 1.8 2.0-0.6
-0.4
-0.2
0.0
0.2
0.4
0.6
0.8
1.0
0.30 0.40 0.50 0.60 0.70 0.80 0.90 1.00 1.10Normalized
Velocity: U/UH
window #1 window #2
Fig. 7. Ensemble-averaged streamwise velocity distributions in the turbine wakes.
(a) X/D=0.5 (b) X/D=1.0 (c) X/D=2.0 U/UH U/UH U/UH
Z/D
0.4 0.6 0.8 1.0 1.2-0.6
-0.4
-0.2
0
0.2
0.4
0.6 Incoming ABL windUWT, X/D=0.5DWT, X/D=0.5
Z/D
0.4 0.6 0.8 1.0 1.2-0.6
-0.4
-0.2
0
0.2
0.4
0.6 Incoming ABL windUWT, X/D=1.0DWT, X/D=1.0
Z/D
0.4 0.6 0.8 1.0 1.2-0.6
-0.4
-0.2
0
0.2
0.4
0.6 Incoming ABL windUWT, X/D=2.0DWT, X/D=2.0
Fig. 8. Vertical profiles of streamwise velocity in the turbine wakes.
Z. Wang et al. Energy Conversion and Management 163 (2018) 100–110
106
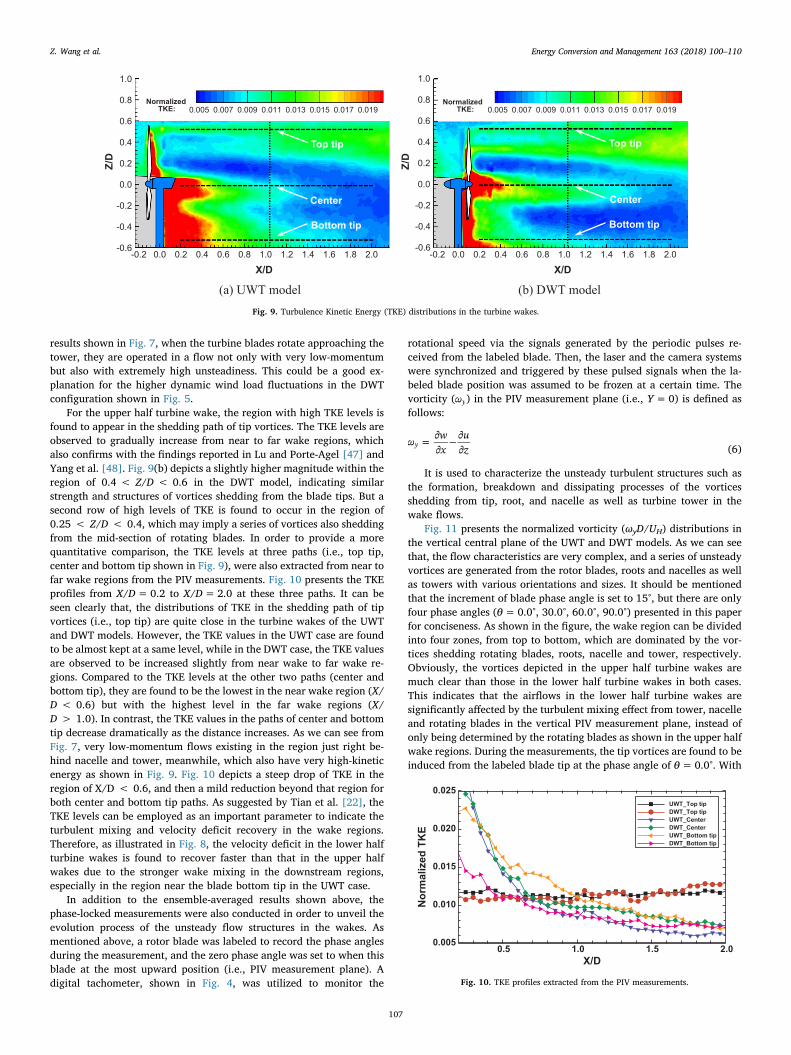
results shown in Fig. 7, when the turbine blades rotate approaching thetower, they are operated in a flow not only with very low-momentumbut also with extremely high unsteadiness. This could be a good ex-planation for the higher dynamic wind load fluctuations in the DWTconfiguration shown in Fig. 5.
For the upper half turbine wake, the region with high TKE levels isfound to appear in the shedding path of tip vortices. The TKE levels areobserved to gradually increase from near to far wake regions, whichalso confirms with the findings reported in Lu and Porte-Agel [47] andYang et al. [48]. Fig. 9(b) depicts a slightly higher magnitude within theregion of 0.4 < Z/D < 0.6 in the DWT model, indicating similarstrength and structures of vortices shedding from the blade tips. But asecond row of high levels of TKE is found to occur in the region of0.25 < Z/D < 0.4, which may imply a series of vortices also sheddingfrom the mid-section of rotating blades. In order to provide a morequantitative comparison, the TKE levels at three paths (i.e., top tip,center and bottom tip shown in Fig. 9), were also extracted from near tofar wake regions from the PIV measurements. Fig. 10 presents the TKEprofiles from X/D=0.2 to X/D=2.0 at these three paths. It can beseen clearly that, the distributions of TKE in the shedding path of tipvortices (i.e., top tip) are quite close in the turbine wakes of the UWTand DWT models. However, the TKE values in the UWT case are foundto be almost kept at a same level, while in the DWT case, the TKE valuesare observed to be increased slightly from near wake to far wake re-gions. Compared to the TKE levels at the other two paths (center andbottom tip), they are found to be the lowest in the near wake region (X/D < 0.6) but with the highest level in the far wake regions (X/D > 1.0). In contrast, the TKE values in the paths of center and bottomtip decrease dramatically as the distance increases. As we can see fromFig. 7, very low-momentum flows existing in the region just right be-hind nacelle and tower, meanwhile, which also have very high-kineticenergy as shown in Fig. 9. Fig. 10 depicts a steep drop of TKE in theregion of X/D < 0.6, and then a mild reduction beyond that region forboth center and bottom tip paths. As suggested by Tian et al. [22], theTKE levels can be employed as an important parameter to indicate theturbulent mixing and velocity deficit recovery in the wake regions.Therefore, as illustrated in Fig. 8, the velocity deficit in the lower halfturbine wakes is found to recover faster than that in the upper halfwakes due to the stronger wake mixing in the downstream regions,especially in the region near the blade bottom tip in the UWT case.
In addition to the ensemble-averaged results shown above, thephase-locked measurements were also conducted in order to unveil theevolution process of the unsteady flow structures in the wakes. Asmentioned above, a rotor blade was labeled to record the phase anglesduring the measurement, and the zero phase angle was set to when thisblade at the most upward position (i.e., PIV measurement plane). Adigital tachometer, shown in Fig. 4, was utilized to monitor the
rotational speed via the signals generated by the periodic pulses re-ceived from the labeled blade. Then, the laser and the camera systemswere synchronized and triggered by these pulsed signals when the la-beled blade position was assumed to be frozen at a certain time. Thevorticity (ωy) in the PIV measurement plane (i.e., Y=0) is defined asfollows:
=∂
∂−
∂
∂ω w
xuzy (6)
It is used to characterize the unsteady turbulent structures such asthe formation, breakdown and dissipating processes of the vorticesshedding from tip, root, and nacelle as well as turbine tower in thewake flows.
Fig. 11 presents the normalized vorticity (ωyD/UH) distributions inthe vertical central plane of the UWT and DWT models. As we can seethat, the flow characteristics are very complex, and a series of unsteadyvortices are generated from the rotor blades, roots and nacelles as wellas towers with various orientations and sizes. It should be mentionedthat the increment of blade phase angle is set to 15°, but there are onlyfour phase angles (θ=0.0°, 30.0°, 60.0°, 90.0°) presented in this paperfor conciseness. As shown in the figure, the wake region can be dividedinto four zones, from top to bottom, which are dominated by the vor-tices shedding rotating blades, roots, nacelle and tower, respectively.Obviously, the vortices depicted in the upper half turbine wakes aremuch clear than those in the lower half turbine wakes in both cases.This indicates that the airflows in the lower half turbine wakes aresignificantly affected by the turbulent mixing effect from tower, nacelleand rotating blades in the vertical PIV measurement plane, instead ofonly being determined by the rotating blades as shown in the upper halfwake regions. During the measurements, the tip vortices are found to beinduced from the labeled blade tip at the phase angle of θ=0.0°. With
(a) UWT model (b) DWT model X/D
Z/D
-0.2 0.0 0.2 0.4 0.6 0.8 1.0 1.2 1.4 1.6 1.8 2.0-0.6
-0.4
-0.2
0.0
0.2
0.4
0.6
0.8
1.0
0.005 0.007 0.009 0.011 0.013 0.015 0.017 0.019Normalized
TKE:
Top tip
Center
Bottom tip
X/D
Z/D
-0.2 0.0 0.2 0.4 0.6 0.8 1.0 1.2 1.4 1.6 1.8 2.0-0.6
-0.4
-0.2
0.0
0.2
0.4
0.6
0.8
1.0
0.005 0.007 0.009 0.011 0.013 0.015 0.017 0.019Normalized
TKE:
Top tip
Bottom tip
Center
Fig. 9. Turbulence Kinetic Energy (TKE) distributions in the turbine wakes.
X/D
Nor
mal
ized
TK
E
0.5 1.0 1.5 2.00.005
0.010
0.015
0.020
0.025UWT_Top tipDWT_Top tipUWT_CenterDWT_CenterUWT_Bottom tipDWT_Bottom tip
Fig. 10. TKE profiles extracted from the PIV measurements.
Z. Wang et al. Energy Conversion and Management 163 (2018) 100–110
107
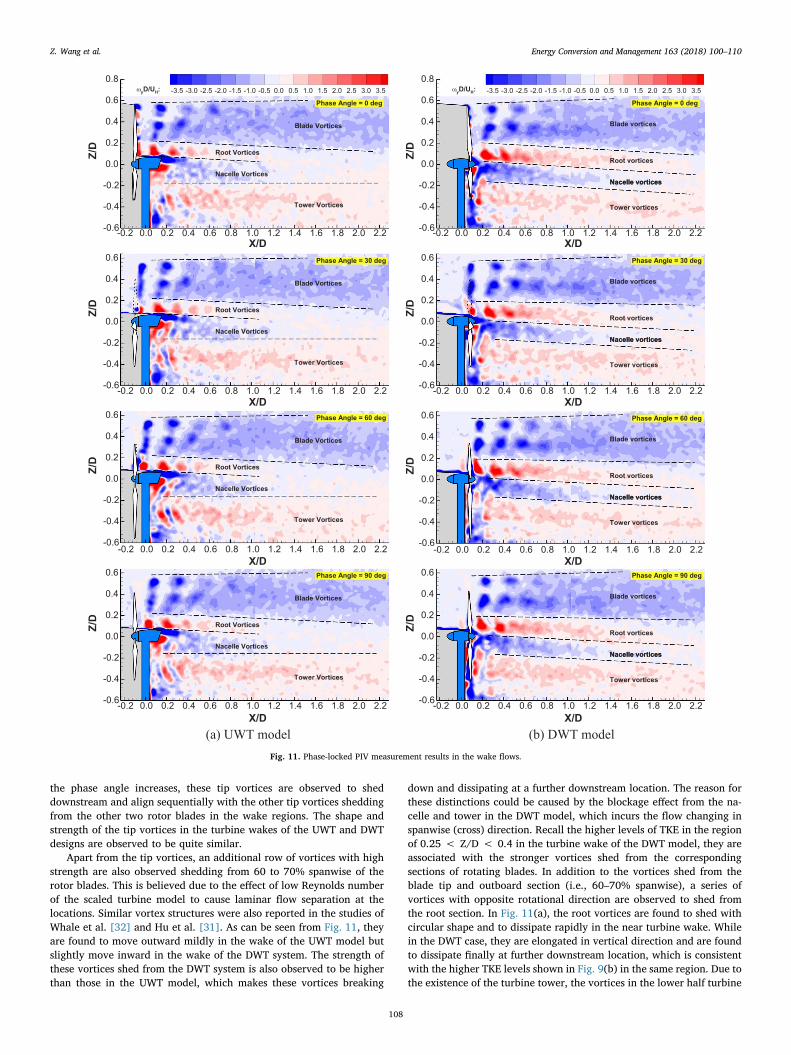
the phase angle increases, these tip vortices are observed to sheddownstream and align sequentially with the other tip vortices sheddingfrom the other two rotor blades in the wake regions. The shape andstrength of the tip vortices in the turbine wakes of the UWT and DWTdesigns are observed to be quite similar.
Apart from the tip vortices, an additional row of vortices with highstrength are also observed shedding from 60 to 70% spanwise of therotor blades. This is believed due to the effect of low Reynolds numberof the scaled turbine model to cause laminar flow separation at thelocations. Similar vortex structures were also reported in the studies ofWhale et al. [32] and Hu et al. [31]. As can be seen from Fig. 11, theyare found to move outward mildly in the wake of the UWT model butslightly move inward in the wake of the DWT system. The strength ofthese vortices shed from the DWT system is also observed to be higherthan those in the UWT model, which makes these vortices breaking
down and dissipating at a further downstream location. The reason forthese distinctions could be caused by the blockage effect from the na-celle and tower in the DWT model, which incurs the flow changing inspanwise (cross) direction. Recall the higher levels of TKE in the regionof 0.25 < Z/D < 0.4 in the turbine wake of the DWT model, they areassociated with the stronger vortices shed from the correspondingsections of rotating blades. In addition to the vortices shed from theblade tip and outboard section (i.e., 60–70% spanwise), a series ofvortices with opposite rotational direction are observed to shed fromthe root section. In Fig. 11(a), the root vortices are found to shed withcircular shape and to dissipate rapidly in the near turbine wake. Whilein the DWT case, they are elongated in vertical direction and are foundto dissipate finally at further downstream location, which is consistentwith the higher TKE levels shown in Fig. 9(b) in the same region. Due tothe existence of the turbine tower, the vortices in the lower half turbine
(a) UWT model (b) DWT model
X/D
Z/D
-0.2 0.0 0.2 0.4 0.6 0.8 1.0 1.2 1.4 1.6 1.8 2.0 2.2-0.6
-0.4
-0.2
0.0
0.2
0.4
0.6
0.8-3.5 -3.0 -2.5 -2.0 -1.5 -1.0 -0.5 0.0 0.5 1.0 1.5 2.0 2.5 3.0 3.5yD/UH:
Phase Angle = 0 deg
Blade Vortices
Tower Vortices
Root Vortices
Nacelle Vortices
X/D
Z/D
-0.2 0.0 0.2 0.4 0.6 0.8 1.0 1.2 1.4 1.6 1.8 2.0 2.2-0.6
-0.4
-0.2
0.0
0.2
0.4
0.6
0.8-3.5 -3.0 -2.5 -2.0 -1.5 -1.0 -0.5 0.0 0.5 1.0 1.5 2.0 2.5 3.0 3.5yD/UH:
Phase Angle = 0 deg
Blade vortices
Root vortices
Nacelle vortices
Tower vortices
Nacelle vortices
X/D
Z/D
-0.2 0.0 0.2 0.4 0.6 0.8 1.0 1.2 1.4 1.6 1.8 2.0 2.2-0.6
-0.4
-0.2
0.0
0.2
0.4
0.6 Phase Angle = 30 deg
Blade Vortices
Tower Vortices
Root Vortices
Nacelle Vortices
X/DZ/
D-0.2 0.0 0.2 0.4 0.6 0.8 1.0 1.2 1.4 1.6 1.8 2.0 2.2-0.6
-0.4
-0.2
0.0
0.2
0.4
0.6 Phase Angle = 30 deg
Blade vortices
Root vortices
Nacelle vortices
Tower vortices
Nacelle vortices
X/D
Z/D
-0.2 0.0 0.2 0.4 0.6 0.8 1.0 1.2 1.4 1.6 1.8 2.0 2.2-0.6
-0.4
-0.2
0.0
0.2
0.4
0.6 Phase Angle = 60 deg
Blade Vortices
Tower Vortices
Root Vortices
Nacelle Vortices
X/D
Z/D
-0.2 0.0 0.2 0.4 0.6 0.8 1.0 1.2 1.4 1.6 1.8 2.0 2.2-0.6
-0.4
-0.2
0.0
0.2
0.4
0.6 Phase Angle = 60 deg
Blade vortices
Root vortices
Nacelle vortices
Tower vortices
Nacelle vortices
X/D
Z/D
-0.2 0.0 0.2 0.4 0.6 0.8 1.0 1.2 1.4 1.6 1.8 2.0 2.2-0.6
-0.4
-0.2
0.0
0.2
0.4
0.6 Phase Angle = 90 deg
Blade Vortices
Tower Vortices
Root Vortices
Nacelle Vortices
X/D
Z/D
-0.2 0.0 0.2 0.4 0.6 0.8 1.0 1.2 1.4 1.6 1.8 2.0 2.2-0.6
-0.4
-0.2
0.0
0.2
0.4
0.6 Phase Angle = 90 deg
Blade vortices
Root vortices
Nacelle vortices
Tower vortices
Nacelle vortices
Fig. 11. Phase-locked PIV measurement results in the wake flows.
Z. Wang et al. Energy Conversion and Management 163 (2018) 100–110
108
wake are not as distinct as those in the upper half wake. However, therotor installed at upwind or downwind position changes the Karmanvortex streets shedding from the turbine tower. They are found to begenerated clearly and shed gradually in the upwind configuration, butwhich are broken down quickly by the rotating blades in the DWTdesign. It may cause the lower TKE levels in the lower turbine wakeshown in Fig. 9(b).
4. Conclusion
A comprehensive experimental study was conducted in a large-scalewind tunnel to investigate the aeromechanic performance of a windturbine with downwind configuration (i.e., DWT in short), in compar-ison with that of a traditional upwind wind turbine (UWT) design. Thedynamic wind loads and the power coefficients of the model windturbines were measured in an atmospheric boundary layer wind profileunder a neutral stability condition. A high-resolution PIV system wasalso employed to perform both ensemble-averaged and phase-lockedmeasurements to characterize the evolution of turbulent flow structuresin the turbine wake regions. Based on the results derived from thepresent study, the conclusions can be summarized as follows:
(1) The dynamic wind loads acting on the wind turbine models werefound to fluctuate greatly. The time-averaged thrust coefficient ofthe DWT model is slightly enhanced by 2.6% compared with that ofthe UWT system, while its fluctuation is found to increase by18.7%, indicating much greater fatigue loadings acting on the DWTmodel due to shadow effect occurred between the turbine towerand rotor blades.
(2) The power coefficient of the DWT design is measured to be only3.2% lower than that measured from the typical UWT model, whichconfirms with the findings reported in previous literatures.
(3) The PIV measurement of ensemble-averaged velocity field showsthat the velocity distributions in the region of Z/D > 0.2 for bothturbine are almost identical, but there is an essential distinction canbe found in the central turbine wake regions (−0.2 < Z/D < 0.2).This region is observed to fill with high-momentum flow and travelto a further downstream location in the wake of DWT design. Inaddition, the velocity deficit in the upper half turbine wake in theUWT model is found to be greater than that in the DWT model,which is because more kinetic energy from the incoming airflow isharvested by the upwind turbine in the UWT design.
(4) The TKE distribution results illustrate that the turbine rotor in theDWT design is operated in a flow with very low-momentum andwith extremely high unsteadiness, which could be a good ex-planation for the higher dynamic wind load fluctuations in the DWTshown in the force measurement.
(5) The phase-locked PIV measurement reveals that the turbulent flowstructures in the turbine wakes are very complex. The vortices inthe upper half turbine wakes are much more clearly identified thanthose in the lower ones since they are mainly determined by therotating blades. Apart from the small distinction existed in tipvortices, an additional row of vortices with high strength are ob-served shedding from 60–70% spanwise of the rotor blades, whichis believed to be due to the effect of laminar flow separation asso-ciated with the low Reynolds number in these scaled-down windturbines. They are found to move outward mildly in the wake of theUWT model, but slightly move inward in the wake of the DWTdesign. The Karman vortex streets shedding from the turbine towerare found to be generated clearly and shed gradually in the upwindconfiguration, but which are broken down quickly via the interac-tions with the rotating blades in the downwind design.
While the findings derived from the present study are very helpful toelucidate the underlying physics for the development of novel windturbines in either downwind or upwind configuration, much more
comprehensive studies are still needed to explore/ optimize designparadigms for higher power yield and better durability of the windturbines operating in complex atmospheric boundary winds.
Acknowledgements
The funding support from the Iowa Energy Center with Grant No.14-008-OG and National Science Foundation (NSF) with GrantNumbers of CBET-1133751 and CBET- 1438099 is gratefully acknowl-edged.
References
[1] Wang Z, Zhuang M. Leading-edge serrations for performance improvement on avertical-axis wind turbine at low tip-speed-ratios. Appl Energy 2017;208:1184–97.http://dx.doi.org/10.1016/j.apenergy.2017.09.034.
[2] Reiso M. The Tower Shadow Effect in Downwind Wind Turbines. 2013.[3] Cai X, Gu R, Pan P, Zhu J. Unsteady aerodynamics simulation of a full-scale hor-
izontal axis wind turbine using CFD methodology. Energy Convers Manag2016;112:146–56. http://dx.doi.org/10.1016/j.enconman.2015.12.084.
[4] Loth E, Ichter B, Steele A, Selig MS, Moriarty PJ. Downwind Pre-Aligned Rotor for a13.2 MW Wind Turbine. 33rd Wind Energy Symp 2015:1–8. doi:10.2514/6.2015-1661.
[5] Global Wind Statistics-2016. 2017.[6] Kress C, Chokani N, Abhari RS. Design Considerations of Rotor Cone Angle for
Downwind Wind Turbines. ASME Turbo Expo 2015 Turbine Tech Conf Expo2015;138:1–13. doi:10.1115/1.4031604.
[7] Frau E, Kress C, Chokani N, Abhari RS. Comparison of performance and unsteadyloads of multimegawatt downwind and upwind turbines. J Sol Energy Eng2015;137:41004. http://dx.doi.org/10.1115/1.4030314.
[8] Abdelsalam A, Ramalingam V. Effect of the tilt angle on the wind turbine perfor-mance and wakes. Eighth Asia-Pacific Conf Wind Eng 2013;11.
[9] Zhao Q, Sheng C, Afjeh A. Computational aerodynamic analysis of offshore upwindand downwind turbines. J Aerodyn 2014;2014:1–13. http://dx.doi.org/10.1155/2014/860637.
[10] Koh JH, Ng EYK. Downwind offshore wind turbines: opportunities, trends andtechnical challenges. Renew Sustain Energy Rev 2016;54:797–808. http://dx.doi.org/10.1016/j.rser.2015.10.096.
[11] Ebrahimi A, Movahhedi M. Power improvement of NREL 5-MW wind turbine usingmulti-DBD plasma actuators. Energy Convers Manag 2017;146:96–106. http://dx.doi.org/10.1016/j.enconman.2017.05.019.
[12] Vaz JRP, Wood DH. Aerodynamic optimization of the blades of diffuser-augmentedwind turbines. Energy Convers Manag 2016;123:35–45. http://dx.doi.org/10.1016/j.enconman.2016.06.015.
[13] Wang L, Tan ACC, Cholette M, Gu Y. Comparison of the effectiveness of analyticalwake models for wind farm with constant and variable hub heights. Energy ConversManag 2016;124:189–202. http://dx.doi.org/10.1016/j.enconman.2016.07.017.
[14] Nobari MRH, Mirzaee E, Nosratollahi M. Improvement of wind turbine performanceusing a novel tip plate structure. Energy Convers Manag 2016;123:592–609. http://dx.doi.org/10.1016/j.enconman.2016.06.078.
[15] Naderi S, Torabi F. Numerical investigation of wake behind a HAWT using modifiedactuator disc method. Energy Convers Manag 2017;148:1346–57. http://dx.doi.org/10.1016/j.enconman.2017.07.003.
[16] Janajreh I, Qudaih R, Talab I, Ghenai C. Aerodynamic flow simulation of windturbine: downwind versus upwind configuration. Energy Convers Manag2010;51:1656–63. http://dx.doi.org/10.1016/j.enconman.2009.12.013.
[17] Janajreh I, Talab I, MacPherson J. Numerical simulation of tower rotor interactionfor downwind wind turbine. Model Simul Eng 2010;2010:1–11. http://dx.doi.org/10.1155/2010/860814.
[18] Zhou H, Wan D. Numerical investigations on the aerodynamic performance of windturbine: downwind versus upwind configuration. J Mar Sci Appl 2015;14:61–8.http://dx.doi.org/10.1007/s11804-015-1295-9.
[19] Larwood SM, Chow R. Comparison of upwind and downwind operation of the NRELPhase VI experiment. J Phys Conf Ser 2016;753:22041. http://dx.doi.org/10.1088/1742-6596/753/2/022041.
[20] Kress C, Chokani N, Abhari RS. Downwind wind turbine yaw stability and perfor-mance. Renew Energy 2015;83:1157–65. http://dx.doi.org/10.1016/j.renene.2015.05.040.
[21] Wang Z, Ozbay A, Tian W, Hu H. An experimental study on the aerodynamic per-formances and wake characteristics of an innovative dual-rotor wind turbine.Energy 2018;147:94–109. http://dx.doi.org/10.1016/j.energy.2018.01.020.
[22] Tian W, Ozbay A, Hu H. Effects of incoming surface wind conditions on the wakecharacteristics and dynamic wind loads acting on a wind turbine model. Phys Fluids2014;26:125108. http://dx.doi.org/10.1063/1.4904375.
[23] Jain P. Wind energy engineering. McGraw Hill Professional; 2007.[24] Hansen KS, Barthelmie RJ, Jensen LE, Sommer A. The impact of turbulence in-
tensity and atmospheric stability on power deficits due to wind turbine wakes atHorns Rev wind farm. Wind Energy 2012;15:183–96. http://dx.doi.org/10.1002/we.512.
[25] Hsu S, Meindl E, Gilhousen D. Determining the power law wind profile exponentunder near neutral stability condition at sea.pdf. J Appl Meteorol 1994:757–65.
[26] Wang Z, Tian W, Ozbay A, Sharma A, Hu H. An experimental study on the
Z. Wang et al. Energy Conversion and Management 163 (2018) 100–110
109
aeromechanics and wake characteristics of a novel twin-rotor wind turbine in aturbulent boundary layer flow. Exp Fluids 2016;57:150. http://dx.doi.org/10.1007/s00348-016-2233-6.
[27] Tong W. Wind Power Generation and Wind Turbine Design. WIT press; 2010.[28] Wang Z, Hu H, Tian W, Ozbay A. An Experimental Investigation on the Wake
Characteristics behind a Novel Twin-Rotor Wind Turbine. AIAA SciTech Conf2015;AIAA 2015. doi:10.1115/1.4031476.
[29] Sarlak H, Nishino T, Martinez-Tossas LA, Meneveau C, Sorensen JN. Assessment ofblockage effects on the wake characteristics and power of wind turbines. RenewEnergy 2016;93:340–52. http://dx.doi.org/10.1016/j.renene.2016.01.101.
[30] Chamorro L, Arndt R, Sotiropoulos F. Turbulent flow properties around a staggeredwind farm. Boundary-Layer Meteorol 2011;141:349–67. http://dx.doi.org/10.1007/s10546-011-9649-6.
[31] Hu H, Yang Z, Sarkar P. Dynamic wind loads and wake characteristics of a windturbine model in an atmospheric boundary layer wind. Exp Fluids2011;52:1277–94. http://dx.doi.org/10.1007/s00348-011-1253-5.
[32] Whale J, Anderson C, Bareiss R, Wagner S. An experimental and numerical study ofthe vortex structure in the wake of a wind turbine. J Wind Eng Ind Aerodyn2000;84:1–21. http://dx.doi.org/10.1016/S0167-6105(98)00201-3.
[33] Alfredsson PH, Dahlberg J-A, Vermeulen PEJ. A comparison between predicted andmeasured data from wind turbine wakes. Wind Eng 1982;6:149–55.
[34] Medici D, Alfredsson P. Measurements on a wind turbine wake: 3D effects and bluffbody vortex shedding. Wind Energy 2006;9:219–36.
[35] Chamorro L, Arndt R, Sotiropoulos F. Turbulent flow properties around a staggeredwind farm. Boundary-Layer Meteorol 2011;141:349–67.
[36] Medici D, Alfredsson PH. Measurements on a wind turbine wake: 3D effects andbluff body vortex shedding. Wind Energy 2006;9:219–36. http://dx.doi.org/10.1002/we.156.
[37] Burton T, Jenkins N, Sharpe D, Bossanyi E. Wind Energy Handbook. 2nd ed. Wiley;2011.
[38] Hu H, Wei T, Wang Z. An Experimental Study on the Wake Characteristics of Dual-
Rotor Wind Turbines by Using a Stereoscopic PIV Technique. 34th AIAA ApplAerodyn Conf 2016.
[39] Lebrón JR, Castillo L, Cal RB, Kang H, Meneveau C. Interaction Between a WindTurbine Array and a Turbulent Boundary Layer. 48th AIAA Aerosp Sci Meet2010:13.
[40] Cal RB, Lebrón J, Castillo L, Kang HS, Meneveau C. Experimental study of thehorizontally averaged flow structure in a model wind-turbine array boundary layer.J Renew Sustain Energy 2010;2:13106. http://dx.doi.org/10.1063/1.3289735.
[41] Zhang W, Markfort CD, Porté-Agel F. Wind-turbine wakes in a convective boundarylayer: a wind-tunnel study. Boundary-Layer Meteorol 2013;146:161–79. http://dx.doi.org/10.1007/s10546-012-9751-4.
[42] Wu YT, Porté-Agel F. Large-eddy simulation of wind-turbine wakes: evaluation ofturbine parametrisations. Boundary-Layer Meteorol 2011;138:345–66. http://dx.doi.org/10.1007/s10546-010-9569-x.
[43] Troldborg N, Sørensen J. A simple atmospheric boundary layer model applied tolarge eddy simulations of wind turbine wakes. Wind Energy 2014;17:657–69.http://dx.doi.org/10.1002/we.
[44] Yoshida S. Performance of downwind turbines in complex terrains. Wind Eng2006;44:487–501.
[45] Reiso M, Muskulus M. The simultaneous effect of a fairing tower and increasedblade flexibility on a downwind mounted rotor. J Renew Sustain Energy 2013;5.doi:10.1063/1.4803749.
[46] Jin Z, Dong Q, Yang Z. A stereoscopic PIV study of the effect of rime ice on thevortex structures in the wake of a wind turbine. J Wind Eng Ind Aerodyn2014;134:139–48. http://dx.doi.org/10.1016/j.jweia.2014.09.001.
[47] Lu H, Porté-Agel F. Large-eddy simulation of a very large wind farm in a stableatmospheric boundary layer. Phys Fluids 2011;23:65101.
[48] Yang X, Howard KB, Guala M, Sotiropoulos F. Effects of a three-dimensional hill onthe wake characteristics of a model wind turbine. Phys Fluids 2015;27. doi:10.1063/1.4907685.
Z. Wang et al. Energy Conversion and Management 163 (2018) 100–110
110