a comparative study of different hand drying methods ...europeantissue.com/pdfs/090403-2009 wus...
TRANSCRIPT

1
A comparative study of different hand drying methods: paper towel, warm air dryer,
.
Keith Redway & Shameem FawdarSchool of Biosciences
University of WestminsterLondon
www.westminster.ac.uk/~redwayk
February 2009
jet air dryer

2
The study was completed at the end of last year and was sponsored by the European Tissue Symposium (ETS) Brussels.
It follows on from several other similar studies that the University of Westminster has carried out on hand drying and washroom hygiene since 1993.

3
Part A: Drying efficiency.
The study investigated 3 different hand drying methods and was in 4 parts:
Part D: Bacterial contamination of
Part B: Changes in the numbers of bacteria on the hands after drying.
Part C: Potential contamination of other users and the washroom environment.
jet air dryers in public washrooms.

4
MethodThe amount of water remaining on the hands of subjects after washing and then drying using 5 types of paper towel, a warm air dryer and a
dryness at different times up to 1 minute.
Part A: Drying efficiency
jet air dryer was measured as percentage (%)

5
10DAB
47WAD
10PT5
11PT4
10PT3
10PT2
10PT1
MEAN TIME TO ACHIEVE A MINIMUM OF 90% DRYNESS
(seconds)
HAND DRYING METHOD
Results for Part ATable showing the mean times to achieve a minimum of 90%
dryness of the hands using 5 different types of paper towel (PT), a
(N = 2)
warm air dryer (WAD), and a jet air dryer (J AD).
6
0
10
20
30
40
50
60
70
80
90
100
0 10 20 30 40 50 60
DRYING TIME (seconds)
MEA
N PE
RCEN
TAG
E DR
YNES
S (%
)
PT 1
PT 2
PT 3
PT 4
PT 5
WAD
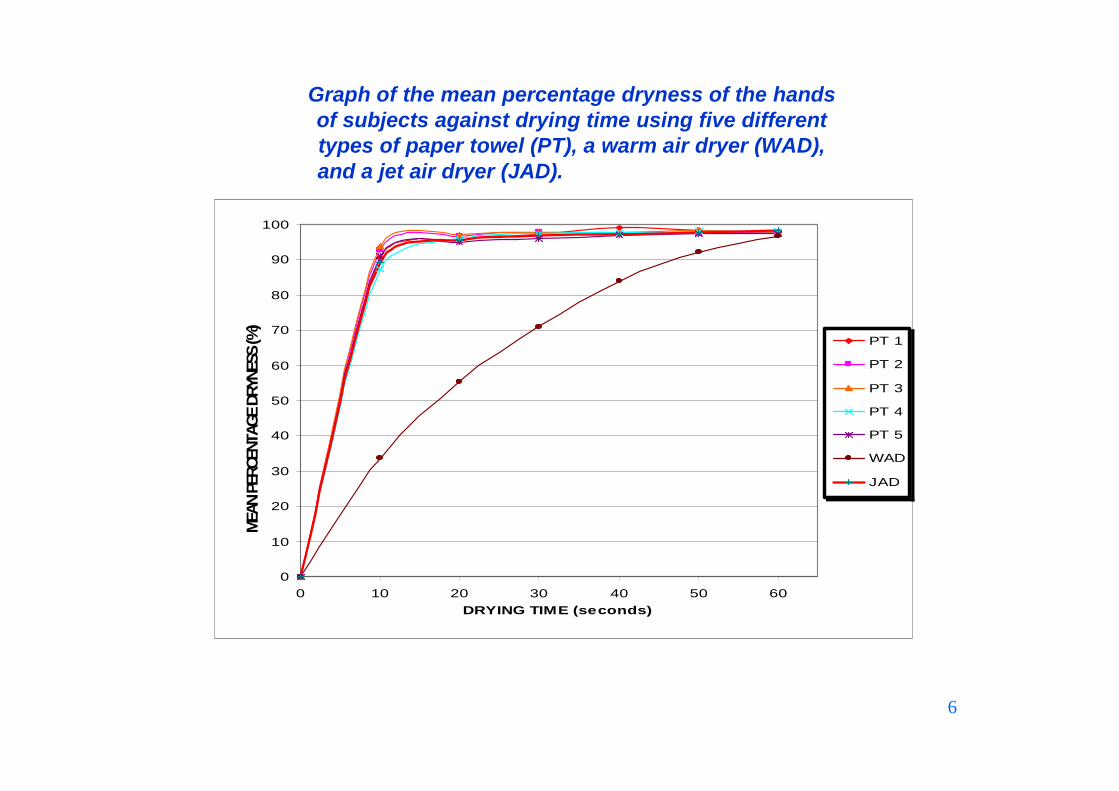
Graph of the mean percentage dryness of the handsof subjects against drying time using five differenttypes of paper towel (PT), a warm air dryer (WAD),
J AD
and a jet air dryer (J AD).

7
The results showed that the 5 types of paper towel and the equallyefficient at drying the hands of users, all of them achieving 90% dryness in approximately 10 seconds.
Conclusions for Part A
However, the results showed that the warm air dryer was considerably less efficient (i.e. slower) than the 5 types of
achieve 90% dryness of the hands.
jet air dryer were
paper towel and also the jet air dryer and took over 4 times as long to

8
Part B: Changes in the numbers of bacteria on the hands after drying.
Method
20 subjects (10 male, 10 female) were used.
3 different agar growth media were used to count and identify the bacteria on the fingertips and the palms before and after washing and drying using 2 types of paper towel, a warm air dryer
dryer.and a jet air

9
• Nutrient agar [NA] (grows most types of bacteriabut does not usually give their identification)
• Cystine-lactose –electrolyte-deficient medium [CLED] (grows gut bacteria and aids their identification, e.g. E. coli, Salmonella)
• Mannitol salt agar [MSA] (grows skin bacteria and aids their identification, e.g. MRSA, Staphylococcus aureus)

10
Subjects pressed their fingerpads onto agar plates. Their palms were sampled using a swab and metal ring of set size.
After incubation for 1-2 days bacterial colonies were counted and identified

11
• Paper towels (PT 1 and PT 3) for 10 seconds
• Warm air dryer (WAD) for 20 seconds
11
Bacterial counts performed before and after washing and drying the hands using:
• DAB) for 10 secondsJ et air dryer (

12Laboratory set-up showing paper towel dispenser and warm air dryer.

13
Laboratory set-up showing jet air dryer.

14
Results for Part BSummary of mean percentage (%) changes in bacterialnumbers on fingerpads before and after washing and drying hands using different hand drying methods.
+42+194-76-51TOTAL
(ALL 3 MEDIA)
+46+191-77-57MSA
+28+204-70-53CLED
+53+186-77-45NA
WARM AIR DRYER
PAPER TOWEL 2
PAPER TOWEL 1
GROWTH MEDIUM
GREEN FIGURES = REDUCTIONS IN BACTERIAL NUMBERS
RED FIGURES = INCREASES IN BACTERIAL NUMBERS
DRYERJ ET AIR

15
Summary of mean percentage (%) changes in bacterialnumbers on palms before and after washing and drying
hands using different hand drying methods.
+15+254-77-48TOTAL
(ALL 3 MEDIA)
+23+303-81-35MSA
+14+243-72-41CLED
+9+230-78-61NA
WARM AIR DRYER
PAPER TOWEL 2
PAPER TOWEL 1
GROWTH MEDIUM
GREEN FIGURES = REDUCTIONS IN BACTERIAL NUMBERS
RED FIGURES = INCREASES IN BACTERIAL NUMBERS
DRYERJ ET AIR

16
GRAPH OF MEAN PERCENTAGE CHANGE IN NUMBERS OF BACTERIALCOLONY-FORMING UNITS (CFUs) ON ALL 3 GROWTH MEDIA
(NA, CLED, MSA) AFTER HAND DRYING USING 4 DIFFERENT METHODS
42
194
-76-51
15
254
-77-48
-100
0
100
200
300
PT 1 PT 3 WAD
ME
AN
% C
HA
NG
E IN
CF
Us
FINGERPADS PALMS
HAND DRYING METHOD
Standard error bars shown(N = 20)
J AD
(PT = PAPER TOWEL; WAD = WARM AIR DRYER; J AD = J ET AIR DRYER)

17
Conclusions for Part B
Both types of paper towel (PT 1 & PT 3) reduced the numbers of all types of bacteria on both the fingerpads and the palms of subjects.
The warm air dryer increased the numbers of all types of bacteria on both the fingerpads and the palms of subjects.
The increased
fingerpads and the palms of subjects.
jet air dryer the numbers of most types of bacteria on both the

18
Part C: Potential contamination of other usersand the washroom environment.
Method
The hands of 10 subjects were artificially contaminated with yeast suspension.
The subjects then dried their hands using 2 types of paper towel (10 seconds) or a warm air dryer (20 seconds) or a seconds).
During use open agar plates were placed at 0.25 metre intervals from the hand drying device up to a maximum of 2 metres. Yeast colonies that grew on the plates were counted.
jet air dryer (10

19
Results for Part C
1.24.88.111.916.021.837.576.247.0
0.00.00.00.00.10.00.02.834.1WARM AIR DRYER
0.00.00.00.00.00.00.11.73.2PAPER TOWEL 3
0.00.00.00.00.00.00.11.24.0PAPER
TOWEL 1
2.001.751.501.251.000.750.500.250.00
DISTANCE OF AGAR PLATE FROM DEVICE
(metres)
HAND DRYING DEVICE
Mean number of yeast colonies isolated on agar plates placed at varying distances from different hand-drying devices used by subjects with artificially
contaminated hands.
J ET AIRDRYER

20
GRAPH OF MEAN NUMBER OF YEAST COLONIES ISOLATEDON AGAR PLATES PLACED AT VARYING DISTANCES FROM
DIFFERENT HAND-DRYING DEVICES USED BY PARTICIPANTSWITH ARTIFICIALLY CONTAMINATED HANDS
0.0
20.0
40.0
60.0
80.0
0.00 0.25 0.50 0.75 1.00 1.25 1.50 1.75 2.00
DISTANCE OF SDA PLATE FROM HAND-DRYING DEVICE (metres)(SDA = SABOURAUD-DEXTROSE AGAR; PT = PAPER TOWEL;
(N = 10)
MEA
N N
UM
BER
OF
CO
LON
IES
PER
PLA
TE
PT1
PT3
WAD
J AD
WAD = WARM-AIR DRYER; J AD = J ET AIR DRYER)

21
Conclusions for Part C
The contamination to other users and the washroom environment to a distance of at least 2 metres.
Warm air dryers and paper towels do not disperse potential contamination as much as
dryer.
Warm air dryer performs worse than paper towel directly below the device but there is little significant difference at greater distances.
jet air dryer can disperse potential
the jet air
22
The distances between pairs in the male and female washrooms of a mainline London railway station ranged from 0.36 to 0.45 metres, with an average distance of 0.39 metres.
jet air dryers in

23J et air dryers in a gents washroom.

24A pair of jet air dryers in a gents washroom.

25
dryers in public washrooms.
Sterile swabs were used to sample the inner surfaces of 8 and 8 in the ladies washroom of a main line London rail station on different days and at different times.
One swab sample was taken from each dryer by swabbing the inner surfaces and the air slits. Another swab sample was taken along the bottom of the hand drying chamber.
Method
Part D: Bacterial contamination of jet air
jet air dryers in the gents washroom

26
Swab samples were plated out on agar plates, incubated, and the numbers of colonies recorded and identified.
Samples of the air emitted for 10 seconds by the
plates of 3 the different growth media as used in Part B.
jet air dryers were taken using open agar

27
10201410-SECOND AIR SAMPLE PER AGAR PLATE
474575377003BOTTOM OF DRYING
CHAMBER PER cm2
12785171INNER SURFACES AND SLITS PER cm2
MANNITOL SALT AGAR
CLEDNUTRIENT AGAR
GROWTH MEDIUM
SAMPLE TYPE
Mean bacterial colony counts on different growth media of
Results for Part D
samples from jet air dryers in public washrooms.

28
Bacteria isolated from public washrooms included:
Urinary tract andother infections
94Other Staphylococcusspecies
10
Water and soil
Human skin,
hair and nose
Human gut and faeces
SOURCE
PneumoniaKlebsiella species
Wound and lung infections
21Pseudomonas aeruginosa
Boils, abscesses,food poisoning, etc.
71Staphylococcus aureus
Urinary tract infections23E. coli
CAN CAUSEPERCENTAGE (%) OF
POSITIVE SAMPLES
BACTERIUM
jet air dryers in

29
Conclusions for Part D
public washrooms were contaminated with large numbers of bacteria.
Bacteria were detected on the inner surfaces and in the air emitted by the
The greatest numbers of bacteria were found at the bottom of the hand drying chamber.
Some of the bacteria were potential pathogens (i.e. could cause disease).
The jet air dryers sampled in these
jet air dryers.
30
Overall conclusions
Part A showed that the equally efficient as the paper towel at drying the hands and both were considerably more efficient than the warm air dryer.
Part B showed that paper towel reduced the mean numbers of all types of bacteria on the fingerpads and palms of the hands.
The warm air dryer and increased the mean numbers of most types of bacteria on the fingerpads and palms, with the warm air dryer producing the largest increases.
jet air dryer was
jet air dryer both

31
Part C showed that paper towel is likely to produce considerably less contamination of other users and the washroom environment than the
Part D showed that the in the public washrooms sampled were contaminated with large numbers of bacteria, particularly the bottom of the hand drying chamber.
dryers in the public washrooms were potential pathogens (i.e. could cause disease).
jet air dryer.
jet air dryers
Some of the bacteria isolated from jet air

32
HIGHHIGH*
NONENUMBERS OF PATHOGENIC BACTERIA CONTAMINATING
THE DEVICE OR TOWEL
HIGHLOWVERY LOWPOTENTIAL FOR CONTAMINATION OF OTHER
USERS AND THE WASHROOM
INCREASESINCREASESREDUCTIONSAVERAGE CHANGE IN BACTERIAL NUMBERS ON
THE HANDS AFTER USE
HIGH(FAST)
LOW(SLOW)
HIGH(FAST)
DRYING EFFICIENCY(SPEED OF DRYING)
DRYERWARM AIR
DRYERPAPER TOWEL
CHARACTERISTIC
Summary of dryer characteristics
* NOT TESTED IN THIS STUDY(but has been in previous UoW studies)
J ET AIR

33
Based on these results, the use of warm air dryers and considered in locations where hygiene is paramount, such as hospitals, clinics, schools, nurseries, care homes, kitchens and other food preparation areas.
In all the tests in this study, paper towel was found to be superior to both types of electric dryer, with the exception of hand
but the warm air dryer never was.the jet air was equal to paper towel, drying efficiency and speed where
jet air dryers should be carefully

34
Keith RedwayDepartment of Biomedical Sciences
University of WestminsterLondon
www.westminster.ac.uk/~redwayk