a comparative performance study of several pitch detection algorithms
TRANSCRIPT

IEEE TRANSACTIONS ON ACOUSTICS, SPEECH, AND SIGNAL PROCESSING, VOL. ASSP-24,NO. 5, OCTOBER 1976 399
A Comparative Performance Study of Several PitchDetection Algorithms
LAWRENCE R. RABINER, FELLOW, IEEE, MICHAEL J. CHENG, STUDENT MEMBER, IEEE,AARON E. ROSENBERG, MEMBER, IEEE, AND CAROL A. McGONEGAL
Abstract—A comparative performance study of seven pitch detectionalgorithms was conducted. A speech data base, consisting of eightutterances spoken by three males, three females, and one child was con-structed. Telephone, close talking microphone, and wideband record-ings were made of each of the utterances. For each of the utterancesin the data base; a "standard" pitch contour was semiautomaticallymeasured using a highly sophisticated interactive pitch detection pro-gram. The "standard" pitch contour was then compared with thepitch contour that was obtained from each of the seven programmedpitch detectors. The algorithms used in this study were 1) a centerclipping, infinite-peak clipping, modified autocorrelation method(AUTOC), 2) the cepstral method (CEP), 3) the simplified inverse fil-tering technique (SIFT) method, 4) the parallel processing time-domainmethod (PPROC), 5) the data reduction method (DARD), 6) a spectralflattening linear predictive coding (LPC) method, and 7) the averagemagnitude difference function (AMDF) method. A set of measure-ments was made on the pitch contours to quantify the various typesof errors which occur in each of the above methods. Included amongthe error measurements were the average and standard deviation of theerror in pitch period during voiced regions, the number of gross errorsin the pitch period, and the average number of voiced—unvoiced clas-sification errors. For each of the error measurements, the individualpitch detectors could be rank ordered as a measure of their relative per-formance as a function of recording condition, and pitch range of thevarious speakers. Performance scores are presented for each of theseven pitch detectors based on each of the categories of error.
I. INTRODUCTION
A PITCH DETECTOR is an essential component in avariety of speech processing systems. Besides provid-ing valuable insights into the nature of the excitation
source for speech production, the pitch contour of an utter-ance is useful for recognizing speakers [1], [2], for speechinstruction to the hearing impaired [31, and is required in al-most all speech analysis—synthesis (vocoder) systems [4] -Because of the importance of pitch detection, a wide varietyof algorithms for pitch detection have been proposed in thespeech processing literature (e.g., [5] —[11]). In spite of theproliferation of pitch detectors, very little formal evaluationand comparison among the different types of pitch detectorshas been attempted. There are a wide variety of reasons whysuch an evaluation has not been made. Among these are thedifficulty in selection of a reasonable standard of comparison;collection of a comprehensive data base; choice of pitch de-tectors for evaluation; and the difficulty in interpreting theresults in a meaningful and unbiased way. This paper is a re-port on an attempt to provide such a performance evaluation
Manuscript received March 3,1976; revised June 7,1976.The authors are with Bell Laboratories, Murray Hill, NJ 07974.
of seven pitch detection algorithms. Although a wide varietyof alternatives were available in almost every aspect of thisinvestigation, several arbitrary (but hopefully reasonable) de-cisions were made to limit the scope of the performance eval-uation to a reasonable size.
In this section we provide an overview of the investigation.We begin with a discussion of the general problems and issuesin pitch detection. Then we discuss the various types of pitchdetection algorithms which have been proposed and reviewtheir general characteristics. We conclude with a discussion ofthe types of performance measures which would be suitablefor various applications.
In Section lIthe detailed implementations of the seven pitchdetectors used in this study are reviewed. Included in this sec-tion is a brief discussion of the method of operation of thepitch detector and the method used to make a voiced-unvoicedclassification. In Section III we discuss the data base selectedfor evaluating the seven pitch detectors. In Section IV themethod used to measure the standard pitch contour is out-lined. Section V presents the results of several error analyses.Section VI provides a discussion of the error analyses and Sec-tion VII discusses the computational considerations in the im-plementation of each of the algorithms.
A. Problems in Pitch Detection
Accurate and reliable measurement of the pitch period of aspeech signal from the acoustic pressure waveform alone isoften exceedingly difficult for several reasons. One reason isthat the glottal excitation waveform is not a perfect train ofperiodic pulses. Although finding the period of a perfectlyperiodic waveform is straightforward, measuring the period ofa speech waveform, which varies both in period and in the de-tailed structure of the waveform within a period, can be quitedifficult. A second difficulty in measuring pitch period is theinteraction between the vocal tract and the glottal excitation.In some instances the formants of the vocal tract can alter sig-nificantly the structure of the glottal waveform so that theactual pitch period is difficult to detect. Such interactionsgenerally are most deleterious to pitch detection during rapidmovements of the articulators when the formants are alsochanging rapidly. A third problem in reliably measuring pitchis the inherent difficulty in defining the exact beginning andend of each pitch period during voiced speech segments. Thechoice of the exact beginning and ending locations of the pitchperiod is often quite arbitrary. For example, based on theacoustic waveform alone, some candidates for defining the

400 IEEE TRANSACTIONS ON ACOUSTICS, SPEECH, AND SIGNAL PROCESSING, OCTOBER 1976
beginning and end of the period include the maximum valueduring the period, the zero crossing prior to the maximum,etc. The only requirement on such a measurement is that itbe consistent from period-to-period in order to be able to de-fine the "exact" location of the beginning and end of eachpitch period. The lack of such consistency can lead to spu-rious pitch period estimates. Fig. 1 shows two possible choicesfor defining a pitch marker directly based on waveform mea-surements. The two waveform measurements shown in Fig. 1can (and often will) give slightly different values for the pitchperiod. The pitch period discrepancies are due not only to thequasiperiodicity of the speech waveform, but also the fact thatpeak measurements are sensitive to the formant structure dur-ing the pitch period, whereas zero crossings of a waveform aresensitive to the formants, noise, and any dc level in the wave-form. A fourth difficulty in pitch detection is distinguishingbetween unvoiced speech and low-level voiced speech. Inmany cases transitions between unvoiced speech segments andlow-level voiced speech segments are very subtle and thus areextremely hard to pinpoint.
In addition to the difficulties in measuring pitch period dis-cussed above, additional complications occur when one isfaced with the problem of pitch extraction of speech that hasbeen transmitted through the telephone system. Many sys-tems, in which pitch detection is required, must processtelephone-quality speech. The effects of the telephone systemon speech include linear filtering, nonlinear processing, and theaddition of noise to the speech signal. With regard to linear fil-tering, the telephone system acts like a bandpass filter (low-frequency cutoff of approximately 200 Hz, high-frequencycutoff of approximately 3200 Hz) which can significantly at-tenuate the fundamental pitch frequency and many of thehigher pitch harmonics. The result is that the periodicity ofthe signal is much harder to detect. Nonlinear contributionsof the telephone system to the speech signals can, depend-ing on the particular transmission system used, include thefollowing.
1) Phase distortion.2) Fading or amplitude modulation of the speech signal.3) Crosstalk between two or more messages.4) Clipping or distortion of extremely high-level sounds.
(It should be noted that one would not expect all the abovelisted effects to occur simultaneously) Thus the overall effectof the telephone line is to obscure the periodic structure of thespeech waveform such that the pitch period becomes more dif-ficult to detect.
B. Types of Pitch DetectorsAs a result of the numerous difficulties in pitch measure-
ments, a wide variety of sophisticated pitch detection methodshave been developed. Basically, a pitch detector is a devicewhich makes a voiced-unvoiced decision, and, during periodsof voiced speech, provides a measurement of the pitch period.However, some pitch detection algorithms just determine thepitch during voiced segments of speech and rely on some othertechnique for the voiced—unvoiced decisions. Pitch detection
PEAI<MEASUREMENT
ZERO CROSSINGMEASUREMENT
Fig. 1. Two waveform measurements which can be used to define pitchmarkers.
algorithms can roughly be divided into the following threebroad categories.
1) A group which utilizes principally the time-domain prop-erties of speech signals.
2) A group which utilizes principally the frequency-domainproperties of speech signals.
3) A group which utilizes both the time- and frequency-domain properties of speech signals.
Time-domain pitch detectors operate directly on the speechwaveform to estimate the pitch period. For these pitch detec-tors the measurements most often made are peak and valleymeasurements, zero- crossing measurements, and autocorrela-tion measurements. The basic assumption that is made in allthese cases is that if a quasiperiodic signal has been suitablyprocessed to minimize the effects of the formant structure,then simple time-domain measurements wifi provide good es-timates of the period.
The class of frequency-domain pitch detectors use the prop-erty that if the signal is periodic in the time domain, then thefrequency spectrum of the signal will consist of a series of im-pulses at the fundamental frequency and its harmonics. Thussimple measurements can be made on the frequency spectrumof the signal (or a nonlinearly transformed version of it as inthe cepstral pitch detector [5]) to estimate the period of thesignal.
The class of hybrid pitch detectors incorporates features ofboth the time-domain and the frequency-domain approachesto pitch detection. For example, a hybrid pitch detectormight use frequency- domain techniques to provide a spectrallyflattened time waveform, and then use autocorrelation mea-surements to estimate the pitch period.
In this investigation four time-domain, one frequency-domain, and two hybrid pitch detectors were studied. De-tailed discussions of the algorithms which were used will begiven in Section II.
C. Criteria for Evaluating Pitch Detectors
One of the most difficult problems in comparing and evalu-ating the performance of pitch detectors is choosing a mean-ingful objective performance criterion. The basic problem isthat a criterion suitable for one application may not be suit-able for a different application of pitch detectors.
There are many characteristics of pitch detection algorithmswhich influence the choice of a set of performance criteria.Among these factors are the following.
1) Accuracy in estimating pitch period.2) Accuracy in making a voiced-unvoiced decision.3) Robustness of the measurements, i.e., they must be
RABINER et al.: PITCH DETECTION ALGORITHMS 401
modified for different transmission conditions, speakers,etc.
4) Speed of operation.5) Complexity of the algorithm.6) Suitability for hardware implementation.7) Cost of hardware implementation.
Depending on the specific application, various weights mustbe given to each of the above factors in choosing a single ob-jective performance criterion. In this paper we will presentresults based on factors 1 and 2 in the above list, i.e., onlythose factors which are most amenable to numerical tabula-tions. However, whenever possible, we will try to discuss howfactors 3—7 enter into an overall assessment of the pitch de-tectors discussed in this paper.
There is one major factor which was omitted from the abovelist and which, for many applications, is the dominant factorin evaluating pitch detectors. This factor is the perceptualaccuracy of the pitch detectors, i.e., the question of howfaithfully the pitch contour measured by the pitch detectormatches the natural excitation pitch contour in terms of syn-thetic speech quality. We have omitted this factor from thelist because it is not an objective performance criterion, butis instead a subjective criterion that can only be assessedthrough a series of extensive perceptual tests using syntheticspeech samples. Such a companion investigation is being un-dertaken by the authors and will be reported on at a later date.
II. PITCH DETECTION ALGORITHMS
As stated earlier, seven distinct algorithms for detectingpitch were investigated. These algorithms were the following.
1) Modified auto correlation method using clipping (AUTOC)(Dubnowski [11]).
2) Cepstrum method (CEP) (Schafer [12]).3) Simplified inverse filtering technique (SIFT) (Markel [8]).4) Data reduction method (DARD) (Miller [9]).5) Parallel processing method (PPROC) (Rabiner [21).6) Spectral equalization LPC method using Newton's trans-
formation (LPC) (Atal, unpublished).7) Average magnitude difference function (AMDF) (NSA
version, [10]).
The names in parentheses are the individual (or group) respon-sible for providing Fortran code for .the computational partsof each algorithm, and the code following the name of themethod is the abbreviation which wifi be used to refer to thepitch detector throughout this paper.
The choice of pitch detectors was based on both practicalconsiderations (i.e., availability of reasonably portable Fortrancode) as well as the desire to choose a good cross section ofrecent examples of each of the three types of pitch detectorsdiscussed in Section I. Thus, included in this study were twotime-domain (waveform) pitch detectors (4 and 5), two auto-correlation pitch detectors (1 and 7), one frequency-domainpitch detector (2), and two LPC hybrid pitch detectors (3and 6).
In the following section we provide a summary of themethod of operation of each of the seven pitch detectors.
Whenever possible, exact values of parameters of the pitch de-tector (e.g., section length, window, etc., will be given).
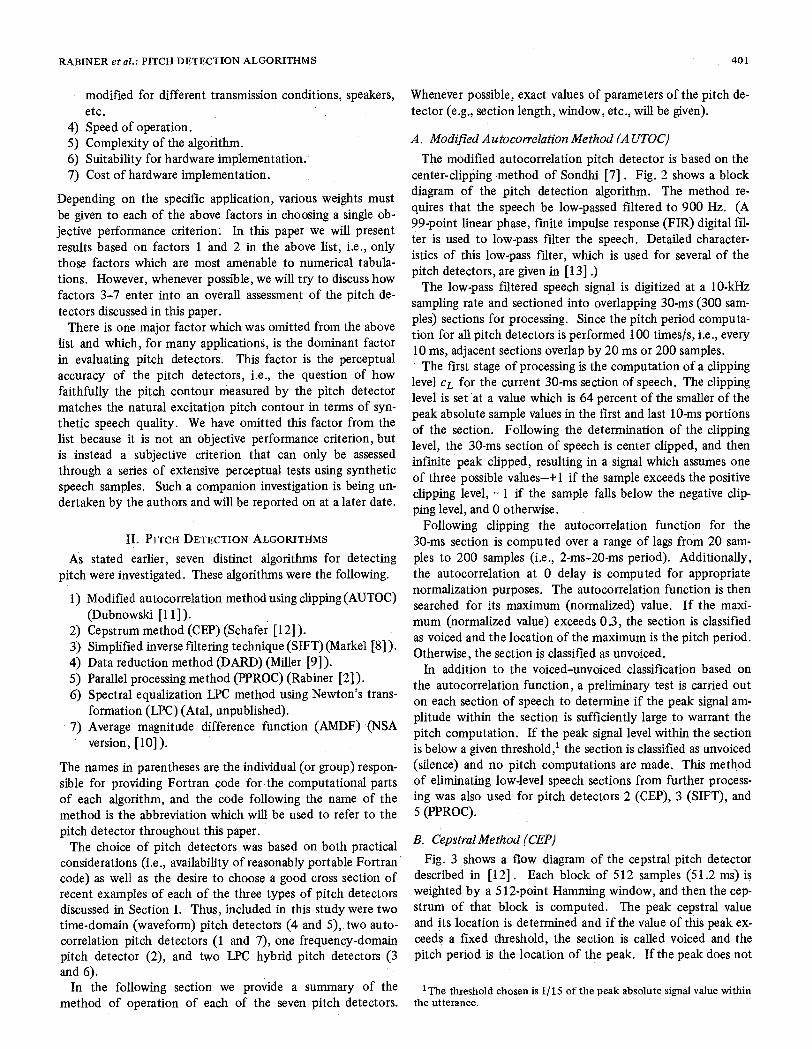
A. Modified Autocorrelation Method (A UTOC)
The modified autocorrelation pitch detector is based on thecenter-clipping method of Sondhi [7]. Fig. 2 shows a blockdiagram of the pitch detection algorithm. The method re-quires that the speech be low-passed filtered to 900 Hz. (A99-point linear phase, finite impulse response (FIR) digital fil-ter is used to low-pass filter the speech. Detailed character-istics of this low-pass filter, which is used for several of thepitch detectors, are given in [13] -)
The low-pass filtered speech signal is digitized at a 1 0-kHzsampling rate and sectioned into overlapping 30-ms (300 sam-ples) sections for processing. Since the pitch period computa-tion for all pitch detectors is performed 100 times/s, i.e., every10 ms, adjacent sections overlap by 20 ms or 200 samples.
The first stage of processing is the computation of a clippinglevel CL for the current 30-ms section of speech. The clippinglevel is set at a value which is 64 percent of the smaller of thepeak absolute sample values in the first and last 10-ms portionsof the section. Following the determination of the clippinglevel, the 30-ms section of speech is center clipped, and theninfinite peak clipped, resulting in a signal which assumes oneof three possible values—+ 1 if the sample exceeds the positiveclipping level, — 1 if the sample falls below the negative clip-ping level, and 0 otherwise.
Following clipping the autocorrelation function for the30-ms section is computed over a range of lags from 20 sam-ples to 200 samples (i.e., 2-ms-20-ms period). Additionally,the autocorrelation at 0 delay is computed for appropriatenormalization purposes. The autocorrelation function is thensearched for its maximum (normalized) value. If the maxi-mum (normalized value) exceeds 03, the section is classifiedas voiced and the location of the maximum is the pitch period.Otherwise, the section is classified as unvoiced.
In addition to the voiced—unvoiced classification based onthe autocorrelation function, a preliminary test is carried outon each section of speech to determine if the peak signal am-plitude within the section is sufficiently large to warrant thepitch computation. If the peak signal level within the sectionis below a given threshold,1 the section is classified as unvoiced(silence) and no pitch computations are made. This methodof eliminating low-level speech sections from further process-ing was also used for pitch detectors 2 (CEP), 3 (SIFT), and5 (PPROC).
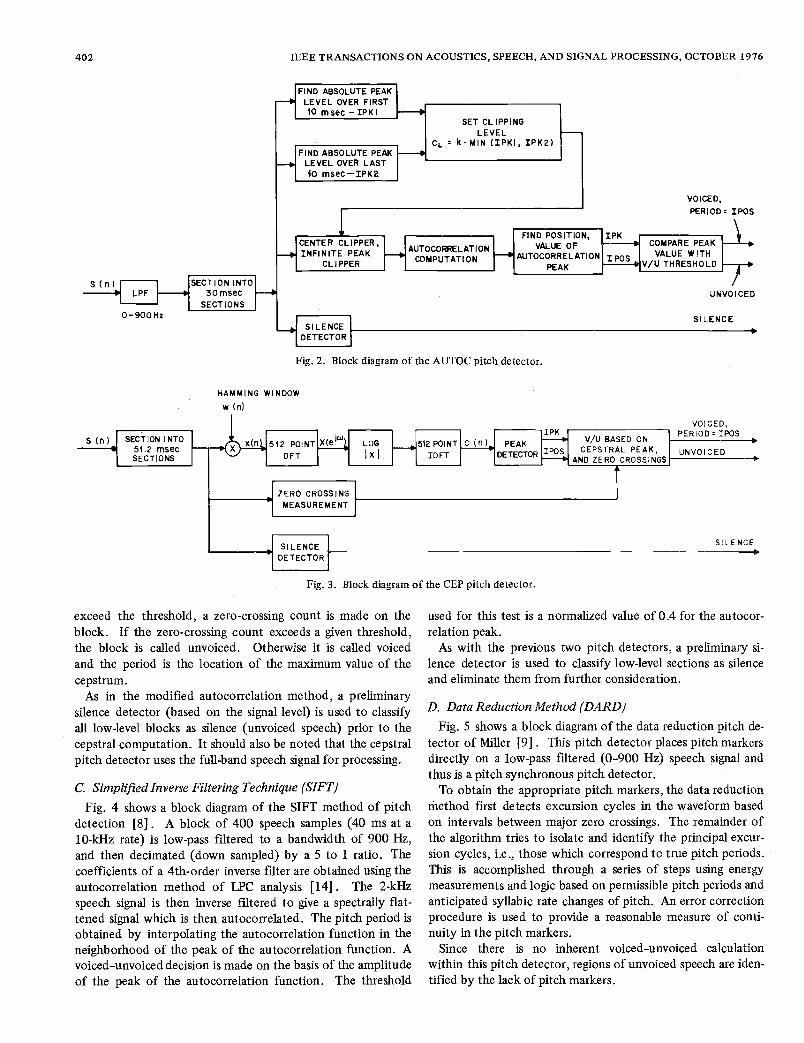
B. Cepstral Method (CEP)Fig. 3 shows a flow diagram of the cepstral pitch detector
described in [12]. Each block of 512 samples (51.2 ms) isweighted by a 512-point Hamming window, and then the cep-strum of that block is computed. The peak cepstral valueand its location is determined and if the value of this peak ex-ceeds a fixed threshold, the section is called voiced and thepitch period is the location of the peak. If the peak does not
1The threshold chosen is 1/15 of the peak absolute signal value withinthe utterance.
402 IEEE TRANSACTIONS ON ACOUSTICS, SPEECH, AND SIGNAL PROCESSING, OCTOBER 1976
FIND POSITION,bl COMPARE PEAKVALUE OF
VALUE WITHIAUTOCORRELATION1 n'os IVIU THRESHOLDPEAK
w In)
exceed the threshold, a zero-crossing count is made on theblock. If the zero-crossing count exceeds a given threshold,the block is called unvoiced. Otherwise it is called voicedand the period is the location of the maximum value of thecepstrum.
As in the modified autocorrelation method, a preliminarysilence detector (based on the signal level) is used to classifyall low1evel blocks as silence (unvoiced speech) prior to thecepstral computation. It should also be noted that the cepstralpitch detector uses the full-band speech signal for processing.
C. Simplified Inverse Filtering Technique (SIFT)Fig. 4 shows a block diagram of the SIFT method of pitch
detection [8]. A block of 400 speech samples (40 ms at a1 0-kHz rate) is low-pass filtered to a bandwidth of 900 Hz,and then decimated (down sampled) by a 5 to 1 ratio. Thecoefficients of a 4th-order inverse filter are obtained using theautocorrelation method of LPC analysis [14]. The 2-kHzspeech signal is then inverse ifitered to give a spectrally flat-tened signal which is then autocorrelated. The pitch period isobtained by interpolating the autocorrelation function in theneighborhood of the peak of the autocorrelation function. Avoiced-unvoiced decision is made on the basis of the amplitudeof the peak of the autocorrelation function. The threshold
used for this test is a normalized value of 0.4 for the autocor-relation peak.
As with the previous two pitch detectors, a preliminary si-lence detector is used to classify low-level sections as silenceand eliminate them from further consideration.
D. Data Reduction Method (DARD)
Fig. 5 shows a block diagram of the data reduction pitch de-tector of Miller [9] . This pitch detector places pitch markersdirectly on a low-pass filtered (0-900 Hz) speech signal andthus is a pitch synchronous pitch detector.
To obtain the appropriate pitch markers, the data reductionmethod first detects excursion cycles in the waveform basedon intervals between major zero crossings. The remainder ofthe algorithm tries to isolate and identify the principal excur-sion cycles, i.e., those which correspond to true pitch periods.This is accomplished through a series of steps using energymeasurements and logic based on permissible pitch periods andanticipated syllabic rate changes of pitch. An error correctionprocedure is used to provide a reasonable measure of conti-nuity in the pitch markers.
Since there is no inherent voiced—unvoiced calculationwithin this pitch detector, regions of unvoiced speech are iden-tified by the lack of pitch markers.
S In)
0- 900 Hz
VOICED,
PERIOD IPOS
Fig. 2. Block diagram of the AUTOC pitch detector.
HAMMING WINDOW
UNVOICED
SILENCE
VOICED,PERIOD TPOs
SI LENCEDETECTOR
Fig. 3. Block diagram of the CEP pitch detector.

RABINER et al.: PITCH DETECTION ALGORITHMS 403
Fig. 5. Block diagram of the DARD pitch detector.
E. Parallel Processing Method (PPROC)
Fig. 6 shows a block diagram of the parallel processing pitchdetector [6] . The speech signal is first low-pass filtered to abandwidth of 900 Hz. Then a series of measurements aremade on the peaks and valleys of the low-pass filtered signalto give six separate functions. Each of these six functions isprocessed by an elementary pitch period estimator (PPE), giv-ing six separate estimates of the pitch period. The.six pitchestimates are then combined by a sophisticated decision algo-rithm which determines the pitch period. A voiced-unvoiceddecision is obtained based on the degree of agreement amongthe six pitch detectors. Additionally, the preliminary silencedetector described in Section Il-A is used to classify low-levelsegments as silence.
F. Spectral Equalization LPC Method Using Newton'sTransformation (LPC)
Fig. 7 shows a block diagram of an LPC pitch detector pro-posed by Atal (unpublished). The first step in this pitch de-tector is a voiced—unvoiced detector which uses a pattern-recognition technique to classify each 10-ms interval of speechas voiced or unvoiced [15]. If the speech section is classifiedas voiced, the 10-kHz sampled speech is digitally low-passfiltered to a bandwidth of about 900 Hz, and then decimatedby 5 to I to a 2-kHz sampling rate. A 41-pole LPC analysis isperformed on a 40-ms frame of speech to give a good repre-sentation of the speech spectrum in terms of the pitch har-monics. A Newton transformation is used to spectrally flattenthe speech, i.e., to transform the signal into one which hassharp peaks at the pitch impulses, and is approximately zeroeverywhere else. A peak picker is used to determine the pitchperiod at the 2-kHz rate anda simple interpolation network isused to obtain higher resolution in the value of the pitchperiod.
It should be pointed out that the voiced-unvoiced patternrecognition algorithm uses a training set which provides a sta-tistical description of the measurements used in the algorithmfor each of classes. The success of this method of making avoiced-unvoiced decision depends heavily on how well thetraining set of data characterizes the different speech classes.
With careful training, voiced—unvoiced accuracies on the orderof 99 percent have been obtained [15].
G. Average Magnitude Different Function (AMDF)Fig. 8 shows a block diagram of the AMDF pitch detector
[10]. (The version used in this study was kindly supplied byM. Malpass of the Massachusetts Institute of TechnologyLincoln Laboratory, based on the NSA version of the AMDFmethod. Details of implementation differ somewhat fromthose of [10] .) The speech signal, initially sampled at 10 kHz,is decimated to a 6.67-kHz rate using a system of the typediscussed in [16] . A zero-crossing measurement (NOZ) ismade on the full-band speech file, and an energy measurement(ENG) is made on a low-pass filtered version (0-900 Hz) of thesignal. The average magnitude difference function is computedon the low-pass filtered speech signal at 48 lags running from16 to 124 samples. The pitch period is identified as the valueof the lag at which the minimum AMDF occurs. Thus a fairlycoarse quantization is obtained for the pitch period. Logic isused to check for pitch period doubling, etc., and to check oncontinuity of pitch periods with previous pitch estimates (atype of nonlinear smoothing). In addition to the pitch esti-mate, the ratio between the maximum and minimum values ofAMDF (MAX/MIN) is obtained. This measurement, alongwith NOZ and ENG is used to make a voiced-unvoiceddecision using logical operations.
III. DATA BASE FOR EVALUATION
In order to evaluate the performance of these seven pitchdetectors, an appropriately chosen data base was required tospan the range of pitch, types of utterances, and recording andtransmission environments which are normally encountered inspeech processing. In this section we describe the data baseused in this study.
A. SpeakersThe set of seven speakers for this study included the fol-
lowing.
1) Low-pitched male (LM).2) Malespeaker1M1).3) Male speaker 2 M2).
0- 900 Hz
Fig. 4. Block diagram of the SIFT pitch detector.
SIn) DETECT EXCURSION iISOLATE AD IDENTIFY PITCH MARKERS
LPF 1 1CYCLS USING ZERO 1PRINCIPAL EXCURSION _____ ERROR
ON WAVEFORM
CROSSING ANALYSIS CYCLES USING ENERGY AND CORRECTION
0—900PITCH PERIOD LIMITS
I

404 IEEE TRANSACTIONS ON ACOUSTICS, SPEECH, AND SIGNAL PROCESSING, OCTOBER 1976
4) Female speaker 1 (Fl).5) Female speaker 2 (F2)6) Child (4 year old) (Cl).7) Diplophonic speaker (Dl).
Diplophonia is a condition in which a person's alternateglottal pulses are more strongly correlated (both in length andamplitude) than adjacent glottal pulses. Thus, it is extremelydifficult to detect the pitch of a diplophonic speaker—evenunder the best of conditions. Fig. 9 shows a section of wave-form from the diplophonic speaker. It is hard to detect, evenby eye, the correct pitch periods. For diplophonic speakers,many pitch detectors calculate the pitch period as the distancebetween major peaks, and not the distance between major andminor peaks. As a result, the pitch contour for a diplophonicspeaker often exhibits a large amount of pitch period doubling.
2
,-' —.. —.--' /-. -. —.- ,_-513
— \./ — —V 768
769
TIME (SAMPLES)
Fig. 9. Section of the waveform from the diplophonic speaker.
Mi
5(n)
0—900Hz
Fig. 6. Block diagram of the PPROC pitch detector.
Fig. 7. Block diagram of the LPC pitch detector.
Fig. 8. Block diagram of the AMDF pitch detector.
256

RABINER et al.: PITCH DETECTION ALGORITHMS 405
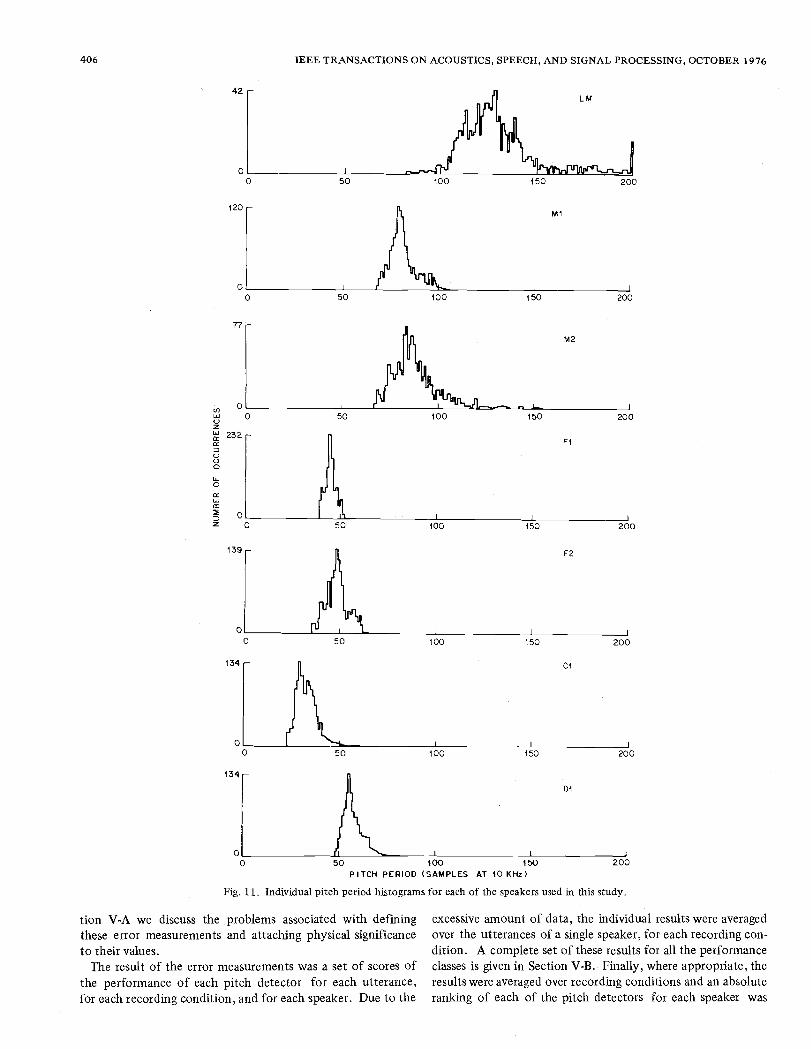
To illustrate the range of pitch (both period and frequency)for the speakers in the data base, Fig. 10 shows a plot of thepitch variation for each of the seven speakers for the utter-ances used in this evaluation (see Section 111-B). It can beseen that a wide range of pitch is encompassed by these sevenspeakers. Additionally, Fig. 11 shows the individual histo-grams for each of these speakers. It can be seen from this fig-ure that the low-pitched (long period) speakers used in thisstridy (i.e., LM, Ml, M2) had a much larger range of pitch pe-riod variation than the high-pitched speakers. The histogramfor the low-pitched male (LM) shows that on several occasionshis pitch period exceeded 200 samples (i.e., the pitch fre-quency fell below 50 Hz). Since this was outside the antici-pated range of pitch variation, all the pitch detectors made er-rors during these regions.
B. Recorded Utterances
The utterances used in this study included the four mono-syllabic nonsense words:
1) Hayed2) Heed3) Hod4) Hoed
and the four sentences:
5) We were away a year ago.6) I know when my lawyer is due.7) Every salt breeze comes from the sea.8) I was stunned by the beauty of the view.
Sentences 5 and 6 are all voiced (except for the stop gaps)whereas sentences 7 and 8 contain both voiced and unvoicedspeech.
C. Recording ConditionsThe three types of recording conditions that were used in
this study included:
1) Close-talking microphone (M). 1 simultaneous
2) Standard telephone transmission (T). recording3) High- quality microphone (W). J
The close-talking microphone recordings were made simul-taneously with the telephone recordings since this was themost convenient method of providing a good-quality signal(during voiced regions) for manual pitch detection whichcould be time aligned with the telephone recordings and whichdid not interfere with using a standard telephone handset in anatural manner. HOwever, because of its placement close tothe mouth of the speaker, the close-talking microphone wasquite sensitive to breath noise, plosives, and other unvoicedtransients. The telephone recordings were made over the localPBX using an ordinary telephone handset. The close-talkingmicrophone recordings were band-limited to about 3 kHz, aswere the telephone recordings. The recordings made on thehigh-quality microphone were wideband recordings whichwere filtered at 4 kHz prior to digitization.
IV. MEASUREMENT OF THE STANDARD PITCH CONTOUR
The method used to measure the standard pitch contour foreach of the utterances in the data base was the semiautomatic
2 5 tO IS 20 25 TIME (msec(
Ft
F2H—H
AT TWO ISOLATED POINTS THE PITCH PERIOD WAS 14.7 rnsec**AT TWO ISOLATED POINTS THE PITCH PERIOD WAS 21.8 mseC
Fig. 10. Pitch variation for each of the speakers used in this study.
pitch detector of McGonegal et al. [13] which was developedfor this study. This method is a highly sophisticated, user-interactive, pitch detector which estimated pitch on a 10-msframe-by-frame basis. Extensive analysis of the results ob-tained from this semiautomatic pitch detector across severalusers on the same utterances showed this method to be highlyreliable [13]
Using the semiautomatic method the analysis time for anexperienced user was about 30 mm to process 1 s of speech(i.e., 100 frames). For the data base used in this study, a totalof 60 h of computer processing was required to estimate thestandard pitch contours for the entire data base.
V. ERROR ANALYSIS RESULTS
The way in which objective comparisons of the performanceof each of the individual pitch detectors were made was as fol-lows. For each of the utterances in the data base, a standardpitch contour was obtained using the semiautomatic methodof Section IV. We denote the standard pitch contour as ps(m)were m goes from 1 to M, and M is the number of 10-msframes in the utterance. The contour ps(m) has the value 0if the mth frame is unvoiced; otherwise it has the value of thepitch period for the mth frame.
Next, each of the utterances was used as input to each ofthe seven pitch detectors and a set of pitch contours was ob-tained as output. We denote the pitch contour from the /thpitch detector (/l,2,'",7) as {p1(m),m=l,2,,M}.Of course, special attention had to be given in the Fortrancode to compensate the processing delay of each pitch detec-tor to ensure that the pitch contours from each of the sevenpitch detectors registered properly with the standard pitchcontour.
To quantitatively measure the performance of each of thepitoh detectors relative to the semiautomatic analysis, a seriesof error measurements was defined for each utterance. In Sec-
PITCH PEPIOD
0114- 14
14M2
LMI. 14
PITCH FREQUENCYI I I I I
500 200 100 66.7 50 40 FREQUENCY (HZ)
LEGEND:
C): CHILD (NO.1) —Fl: FEMALE(NO.1) —F2: FEMALE (NO.2) —DI DIPLOPHON (NO.1) —Ml: MALE (NO.1) —M2: MALE (NO.2)LM: LOW PITCH MALE —
PITCH PERIODRANGE
2.3 TO 4.5 mSAC3.8 TO 5.1 mSeC3.5 TO 6.2 mseC4.3 TO 10.6 mSec*6.8 TO 9.5 mSeC6.5 TO 17.2 roseC6.6 TO 19.2 mSeC*
(I)L1JUzLia:a:C.)C)0Li0a:Lia:
z
tion V-A we discuss the problems associated with definingthese error measurements aiid attaching physical significanceto their values.
The result of the error measurements was a set of scores ofthe performance of each pitch detector for each utterance,for each recording condition, and for each speaker. Due to the
excessive amount of data, the individual results were averagedover the utterances of a single speaker, for each recording con-dition. A complete set of these results for all the performanceclasses is given in Section V-B. Finally, where appropriate, theresults were averaged over recording conditions and an absoluteranking of each of the pitch detectors for each speaker was
42
406 IEEE TRANSACTIONS ON ACOUSTICS, SPEECH, AND SIGNAL PROCESSING, OCTOBER 1976
0
LM
i 20
50 100 200
Ml
7?
0
232
0
M2
0 50 100 150 200
Fl
F2
134
0 50 100 150 200
Cl
100
01
0 50 100 150 200PITCH PERIOD (SAMPLES AT 10KHz)
Fig. 11. Individual pitch period histograms for each of the speakers used in this study.

RABINER et al.: PITCH DETECTION ALGORITHMS 407
1 N.0e e2(m1)-ë2.
given. Such rankings provided a good picture of the perfor-mance strengths and weaknesses of each of the seven pitchdetectors.
Before proceeding to the discussion of the error measure-ments, an additional dimension to the error analysis should bementioned. This added dimension was the application of non-linear smoothing (error correcting) methods to detect andcorrect several types of errors which occur in pitch detection[171. Such a nonlinear smoother was incorporated into thisinvestigation to see what the effects would be on this database. Extensive examples of the applications of nonlinearsmoothers to speech processing are given in [17].
A. Definition of Error Parameters
As mentioned above, for every utterance in the data basethere is a standard pitch contour, p(m), and a pitch contourfor each pitch detector, p1(m), where 1 denotes the pitch de-tector used in the comparison, i.e., j= 1 is the AUTOCmethod, / = 2 is the CEP method, etc. By comparing p8(m)to p1(m), (for each value of /) it can be seen that four possibili-ties can occur for each value of m. These four possibilities arethe following.
1) p(m) 0, pj(m) = 0 in which case both the standardanalysis and the pitch detector classified the mth interval asunvoiced. No error results here.
2) p(m) = 0, pj(m) 0 in which case the standard analysisclassified the mth interval as unvoiced, but the pitch detectorclassified the mth interval as voiced. An unvoiced-to-voicederror results here.
3) p(m) 0, p1(m) 0 in which case the standard analysisclassified the mth interval as voiced, but the pitch detectorclassified the mth interval as unvoiced. A voiced-to-unvoicederror results here.
4) p(m) =P1 0, p1(m) =P2 ' 0 in which case both thestandard analysis and the pitch detector classified the mthinterval as voiced. For this case two types of errors can exist,depending on the values of P1 and F2, the pitch periods fromthe standard analysis and from the pitch detector. If we definethe voiced error e(m) as
e(m)=P1-P2, (1)
then, if I e(m)I 10 samples (i.e., more than 1-ms error inestimating the. pitch period), the error was classified as a grosspitch period error. For such cases, the pitch detector hasfailed dramatically in estimating the pitch period. Possiblecauses of such gross pitch errors are pitch period doubling ortripling, inadequate suppression of formants so as to effectpitch measurements, etc. The second type of pitch error wasthe fine pitch period error in which case I e(m) I < 10 samples.For such cases the pitch detector has estimated the pitchperiod sufficiently accurately to attribute the errors (primarily)to the measurement techniques.
Based on the above four possibilities for comparing eachframe of the reference pitch contour to each frame of eachpitch detector contour, five distinct measurements of theperformance of each pitch, detector were derived. These fiveerror measurements are the following.
1) Gross Error Count: For this measurement the number of
gross pitch period errors (as defined above) per utterance wastabulated.
2) Mean of the Fine Pitch Errors: The mean ë is defined as
1 Njeçe(m/) (2)
I j=j
where m1 is the /th interval in the utterance for whichI e(m)l < 10 (fine pitch error), and N is the number of suchintervals in the utterance. Thus ë is a measure of the bias inthe pitch measurement during voiced intervals.
3) Standard Deviation of the Fine Pitch Errors: The stan-dard deviation, ae, is defined as
(3)
The standard deviation of the fine pitch errors is a measure ofthe accuracy of the pitch detector in measuring pitch periodduring voiced intervals.
4) Voiced -to-Unvoiced ErrorRate: This measurement showsthe accuracy in correctly classifying voiced intervals.
5) Unvoiced-to- Voiced Error Rate: This measurement showsthe accuracy in correctly classifying unvoiced intervals.
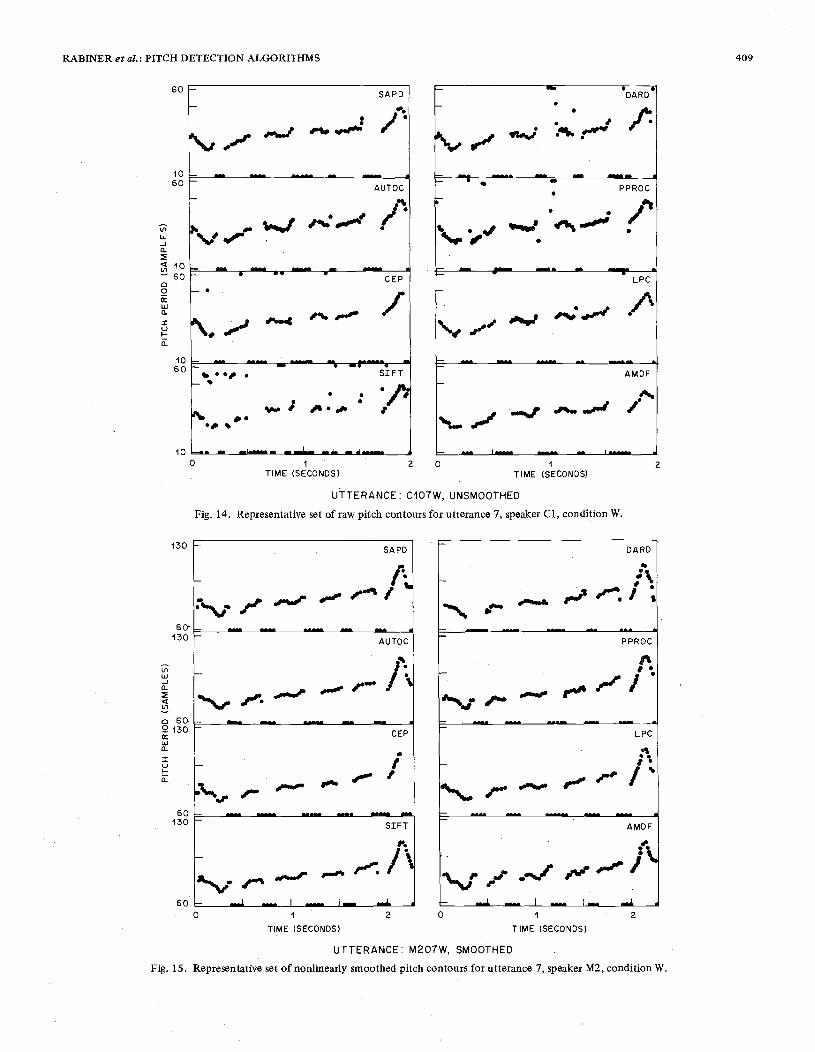
Although other error analyses are possible, it was felt thatthese five error measurements provided a good description ofthe performance strengths and weaknesses of each of the sevenpitch detectors. The results of these error analyses are given inSection V-B. Before presenting these results, we first showsome examples of the individual pitch contours for three ofthe utterances used in this study. Figs. 1 2—i 4 show typicalsets of pitch contours for the seventh utterance of SectionIll-B, for the wideband condition, for speakers LM, M2, andCl. The curve of the upper left in each figure is the result ofthe semiautomatic analysis (i.e., the standard pitch contour).It can be seen from these figures that each of the types oferrors discussed above occurs in these examples. Finally, Fig.15 shows the result of processing each of the pitch contours ofFig. 13 by a nonlinear smoother (a combination of runningmedians of length 7 and some simple logic). The overallsimilarity among the smoothed pitch contours is startlinglyevident in Fig. 15. As will be seen later, a good nonlinearsmoother (error correcter) is able to correct a large number ofthe errors in pitch detection and considerably improve the per-formance of a pitch detector. However, if the error rate is toohigh, no amount of nonlinear smoothing will suffice.
B. Results ofErrorAnalysis
The complete set of error analyses discussed in Section V-Awas performed on the entire data base of Section III, and themajor results are presented in Tables I—XX, along with corre-sponding performance scores for each error category. Severalpoints about the analysis should first be noted before discuss-ing the individual tables and the resulting performance scores.First it must be pointed out that for the microphone andtelephone recording conditions all eight sentences were pro-cessed, whereas for the wideband case only the four sentenceswere processed (i.e., the four nonsense words were not used).

-J
150
080
250I0a.
1 2 0 1
TIME SECONDS) TIME (SECONDS)
UTTERANCE: LMO7W, UNSMOOTHED
Fig. 12. Representative set of raw pitch contours for utterance 7, speaker LM, recording condition W.
130
60130
(I)
Ui-Ja.
(h
0o 60130
Uia.I0a.
60130
600
TIME (SECONDS)2 0
TIME (SECONDS)
2
UTTERANCE: M207W, UNSMOOTHED
Fig. 13. Representative set of raw pitch contours for utterance 7, speaker M2, condition W.
408 IEEE TRANSACTIONS ON ACOUSTICS, SPEECH, AND SIGNAL PROCESSING, OCTOBER 1976
280
150
80250
'I,Ui
— SAPD
— AUTOC
I._ _. •... .a• _t
— CEP
.ISI'_ — . .. .5.' 1- — — _a. —— SIFT
—5.. .-.1 1= .. i:.... ._• _t.a )0
— DARD
PPROC
- LPC
— S
- AMDF
150
80250
150
80
DARD
.40
Se
z
—SAPO
k
AUTOC
.
CEP.1
%' — ,' I-
SIFT
.h- .
PPROC
'5
_0_LPC/
AMDF
p.
i/%I'S_ It'
If,LU-J0
106000
LU0.I0I-0.
0-Ja-
U,
o 609130LUJ1.I00.
RABINER etal.: PITCH DETECTION ALGORITHMS 409
60
1060
1060
100 1 2
TIME (SECONDS)
UTTERANCE: CIO7W, UNSMOOTHED
Fig. 14. Representative set of raw pitch contours for utterance 7, speaker Cl, condition W.
130
60130
DARD
vv' vi t— — —
. PPROC
.
— 1•LPC
\, I,.., '' _.,AMDF
". Is.' I"
O_
— — I_TIME (SECONDS)
2
D A RD
C-PPROC
1%
—L PC
St
AMDF
F •II%/ — Is /'- _I I_C -
2
—SAPD
- /.•4 '/' _•
-AUTOC
-CEP
- I—C 4'
60 - — — —— _.. — —130 -SIFT
60 -I—T—0 1 2 0
TIME (SECONDS) TIME (SECONDS)
UTTERANCE: M2O7W, SMOOTHED
Fig. 15. Representative set of nonlinearly smoothed pitch contours for utterance 7, speaker M2, condition W.

410 IEEE TRANSACTIONS ON ACOUSTICS, SPEECH, AND SIGNAL PROCESSING, OCTOBER 1976
Second, the results obtained for the diplophonic speaker (Dl)were omitted entirely from the error analysis because of theuniversal difficulties of all the pitch detectors (including thesemiautomatic method) in estimating the correct pitch periodfor this speaker. Some of the raw analysis results for speakerDl are presented in the M.S. thesis of Cheng [18]. Finally, be-cause of the large number of factors involved in the analysis,each of the error measurements was averaged over the utter-ances of each speaker. This is justified in that it is not antici-pated that the sentence material is a factor in the performanceevaluation of any pitch detector.
The format for the results presented in Tables I—XX is asfollows. First we present the average (over utterances) errorscores for each category for each speaker, recording condition,and pitch detector. Also included in the tables is a sum of theraw averages across the three recording conditions. Each tableof raw data is followed by one (or sometimes two) table(s) ofperformance rankings based on an empirical (but hopefullyphysically justifiable) evaluation of the average scores for eachpitch detector and for each speaker. From these performancerankings for each error category the performance strengthsand weaknesses of each pitch detector can readily be seen andevaluated. Following the tables of unsmoothed raw averages,the results obtained after, nonlinear smoothing are presented.Comparisons between the unsmoothed and smoothed per-formance rankings show cases where the error rate is too highto be properly corrected with simple nonlinear smoothingtechniques. We now proceed to discuss the results for each ofthe five error categories of Section V-A.
1) Gross Pitch Errors: Tables I—IV present the results ob-tained for the gross pitch error measurements, From Table litcan be seen that, for the most part, a great deal of homogene-ity existed between the scores for the three recording condi-tions, although in some cases there were fairly substantialdifferences in the average gross error score's. Table II showsthe performance rankings based on the sum of the averagegross error scores across the three recording conditions. Thebest rankings are the lowest scores in Table II, i.e., 1 is the bestscore, S is the worst score. Rank 1 was given to a score offrom 0 to 6; rank 2 for a score from 6 to 18; rank 3 for a scorefrom 18 to 42; rank 4 for a score from 42 to 90; and rank 5for scores over 90. The scale in this case is logarithmic becausethe difficulty in detecting and correcting such gross errors in-herently appears to be logarithmically related to the numberof such errors per utterance. Based on these assumptions, therankings of Table II show that each pitch detector performedbetter for some speakers (i.e., range of pitch variation) thanfor others. For example, the AUTOC pitch detector per-formed much worse on the two low-pitch speakers (LM andM2) than on the three higher pitch speakers (Fl, F2, Cl);whereas the CEP pitch detector performed much better on thelower pitch speakers than on the higher pitch speakers. Anoverall ranking score for each pitch detector (i.e., the sum ofthe rankings over the speakers) is given at the bottom of TableII, and the ranking scores in the rightmost column of Table II(the sum of the rankings over the pitch detector) is a measureof the difficulty of detecting pitch for a given speaker. Table IIshows that the overall ranking scores for five of the sevenpitch detectors were comparable, and that the two others were
TABLE INUMBER OF GROSS PITCH ERRORS—UNSMOOTH€D
Speaker AUTOC,
Pitch Detector
CEP SIFT DARD PPROC LPC AMDF
LM MTW
Sum
15.326.119.560.9
0.5 0.6 5.81.1 4.5 5.81.3 4.5 13.82.9 9.6 25.4
10.011.023.844.8
4.45.6
13.023.0
12.815.623.852.2
Ml MTW
Sum
0.63.42.86.8
0.1 0.0 5.90.1 0.8 6.30.5 3.0 23.50.7 3.8 35.7
2.03.06.0
11.0
0.10.80.81.7
0.30.82.83.9
M2 MTW
Sum
6.19.97.3
23.3
0.4 1.3 15.90.6 3.4 4.01.3 5.3 26.82.3 10.0 46.7
4.95.8
12.323.0
2.94.05.5
12.4
7.39.88.5
25.6Fl M
TW
Sum
1.91.60.03.5
9.1 4.4 7.38.5 1.8 6.3
29.0 8.0 0.846.0 14.2 14.4
4.02.84.0
10.8
2.41.42.05.8
0.50.00.00.5
F2 MTW
Sum
0.40.62.03.0
1.4 2.1 7.12.0 1.5 5.62.5 3.8 8.55.9 7.4 21.2
2.41.55.08.9
1.61.52.05.1
0.61.01.83.4
Cl MTW
Sum
1.01.90.02.9
13.6 65.3 6.114.8 62.6 12.912.5 40.8 3.040.9 168.7 22.0
7.89.07.3
24.1
8.312.35.5
26.1
10.69.16.5
26.2
PBRFORMANCETABLE II
SCORES BASED ON SUM 0ERRORS—UNSMOOTI-IED
F GROSS PITCH'
Pitch Detector
Speaker AUTOC CE? SIFT DARD PPROC LPC AMDF Sum
LM 4 1 2 3 4 3 4 21Ml 2 1 1 3 2 1 1 11M2 3 1 2 4 3 2 3 18Fl 1 4 2 2 2 1 1 13F2 1 1 2 3 2 1 1 11Cl 1 3 5 3 3 3 3 21Sum 12 11 14 18 16 11 13
Code: (0—6) = 1, (6—12) = 2, (12—42) = 3, (42—90) =4, (90— ) = 5.
somewhat inferior for this error category. Additionally, it isseen that the speakers with the most extreme pitch (LM, Cl)presented the most difficulty in terms of this error category.
Tables III and IV present the results for the gross pitch errorcategory after processing by a nonlinear smoother. This typeof error is most easily detected and corrected by the nonlinearsmoother used in this study as verified by Tables III and IV.It can be seen from Table IV that only 12 out of the 42 pairsin Table IV were not given the best ranking of 1. These 12represent cases where the gross error rate was too high to becorrected entirely by a nonlinear smoother. The overall rank-ing scores for the smoothed results showed all seven pitch de-tectors (with the exception of speaker Cl for pitch detectorSIFT) to be essentially identical in their overall performancein this error category.
2) Fine Pitch Error—Average Value: The results of theanalysis of the average value of the fine pitch error indicatedthat all seven pitch detectors yielded average values of ë on theorder of ±0.5 samples across all utterances, speakers, and re-

RABINER eta!.: PITCH DETECTION ALGORITHMS 411
TABLE IIINUMBER OF GROSS PITCH ERRORS—SMOOTHED
Speaker AUTOC CEP
Pitch Det
SIFT
ector
DARD PPROC LPC AMDF
LM MTW
Sum
5.36.13.8
15.2
2.31.65.08.9
2.02:06.8
10.8
3.52.05.0
10.5
5.86.0
13.325.1
3.63.19.5
16.2
9.410.817.337.5
Ml MTW
Sum
0.30.00.30.6
0.40.10.51.0
0.50.00.51.0
0.80.52.84.1
1.30.11.52.9
0.40.30.81.5
0.60.52.83.9
M2 MTW
Sum
0.81.32.34.4
1.51.82.35.6
1.51.43.05.9
6.02.38.3
16.6
2.93.07.0
12.9
3.53.65.0
12.1
6.47.45.3
19.1
Fl MTW
Sum
0.00.00.00.0
0.80.00.00.8
0,00.00.00.0
0.10.10.00.2
0,00.00.00.0
0.00.00.00.0
0.00.00.00.0
F2 MTW
Sum
0.00.10.80.9
0.10.00.00.1
0.00.11.31.4
0.40.60.31.3
0.30.01.31.6
0.00.30.00.3
0.10.30.00.4
Cl MTW
Sum
0.00.00.00.0
0.00.00.00.0
57.455.815.8
129.0
0.10.30.00.4
0.00.00.00.0
0.00.00.00.0
0.51.80.02.3
TABLE IVPERFORMANCE SCORES BASED ON SUM OF GROSS PITCH ERRORS—SMOOTHED
Pitch Detector
Speaker AUTOC CEP SIFT DARD PPROC LPC AMDF Sum
LM 2 2 2 2 3 2 3 16Ml 1 1 1 1 1 1 1 7M2 1 1 1 2 2 2 2 11Fl 1 1 1 1 1 1 1 7F2 1 1 1 1 1 1 1 7Cl 1 1 5 1 1 1 1 11Sum 7 7 11 8 9 8 9
Code same as Table II.
cording conditions. No consistent bias (either positive ornegative) in the value of ë was noted in the data. Thus for allpractical purposes the average value of the fine pitch error wasessentially 0 in all cases and, therefore, no results are tabulatedhere.
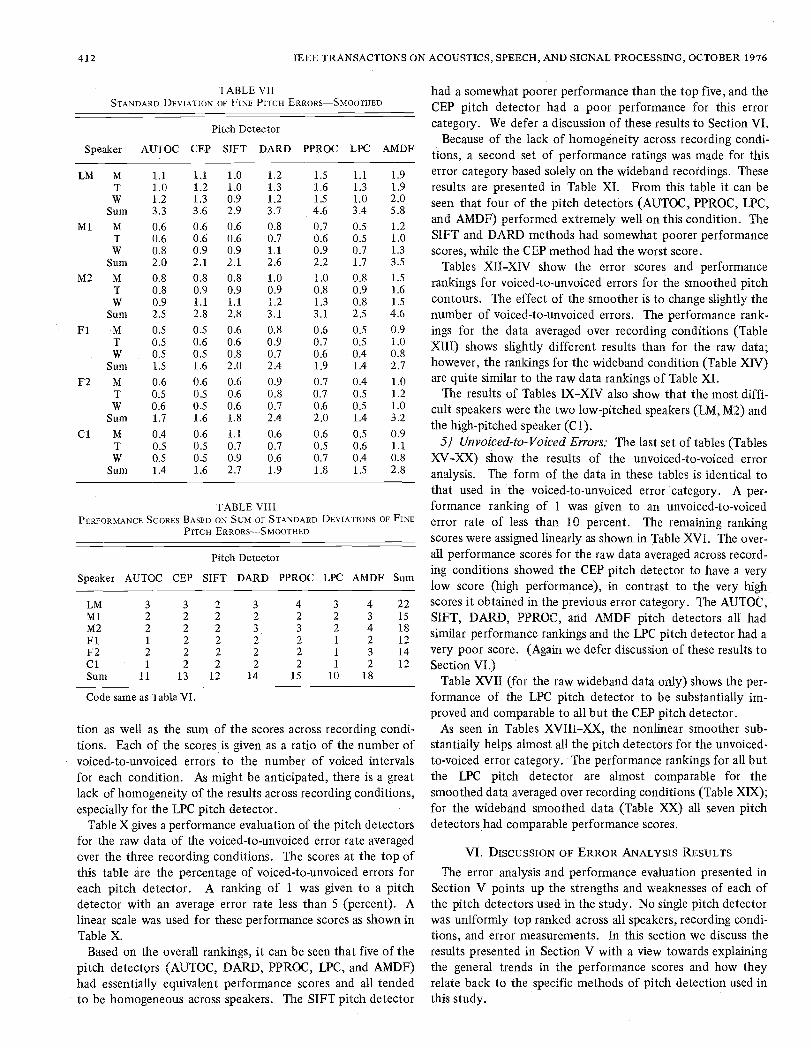
3) FineFitch Error—Standard Deviation: Tables V—VIII pre-sent the results of the analysis of the standard deviation of thefme pitch error. The units of the standard deviation aresamples. The results here were quite homogeneous across re-cording conditions and thus the sum of the standard deviationsover recording conditions was used as the performance mea-sure in Tables VI (raw averages) and VIII (smoothed averages).Based on the analysis results, a standard deviation of less than0.5 samples per condition, or 1.5 samples for the sum wasgiven a score of I. A linear scale was used for this measurement—thus a standard deviation sum from 1.5 to 3 samples wasgiven the next best score (2), etc.
As seen in Table VI, four of the pitch detectors (AUTOC,CEP, SIFT, and LPC) performed almost uniformly across allspeakers, and had comparably high overall performance scores.
TABLE VSTANDARD DEVIATION OF FINE PITCH ERRORS—UNSMOOTHED
Speaker AUTOC CEP
Pitch De
SIFT
tector
DARD PPROC LPC AMDF
LM MTW
Sum
1.01.00.82,8
0.91.01.02.9
0.90.9092.7
1.11.21.13.4
1.81.91.65.3
1.11.21.13.4
2.32.12.16.5
Ml MTW
Sum
0.70.61.02.3
0.50.50.81.8
0.70.70.82.2
0.90.81.33.0
0.90.61.12.6
0.60.60.71.9
1.11.01.33.4
M2 MTWSum
0.70.61.02.3
0.70.70.92.3
0.70.81.02.5
1.01.01.23.2
1.11.01.43.5
0.80.90.92.6
1.51.31.64.4
Fl
F2
MTWSum
MTW
Sum
0.60.60.51.70.60.60.61.8
0.50.60.51.60.60.50.51.6
0.70.70.72.1
0.6
0.70.72.0
1.11.00.93.0
0.8
0.90.82.5
0.80.90.82.5
0.80.80.72.3
0.60.60.51.7
0.40.50.61.5
1.01.10.93.01.11.31.13.5
Cl MTW
Sum
0.40.40.51.3
0.50.50.41.4
0.80.80.92.5
0.70.80.82.3
0.60.60.71.9
0.50.50.51.5
0.91.01.02.9
TABLE VIPERFORMANCE SCORES BASED ON SUM OF STANDARD DEVIATIONS OF FINE
PITCH ERRORS—U NSMOOTHED
Pitch Detector
Speaker AUTOC CEP SIFT DARD PPROC LPC AMDF Sum
LM 2 2 2 3 4 3 5 21Ml 2 2 2 2 2 2 3 15M2 2 2 2 3 3 2 3 17Fl 2 2 2 3 2 2 2 15F2 2 2 2 2 2 1 3 14Cl 1 1 2 2 2 1 2 11
Sum 11 11 12 15 15 11 18
Code: (0—1.5) 1, (1.5-3) 2, (3—4.5) 3, (4.5—6) = 4, (6— )= 5.
The two simple time-domain pitch detectors (DARD andPPROC) had somewhat higher scores (poorer performance)due to the lower resolution which is obtained in estimating apitch period directly on the waveform due to effects discussedearlier. Finally, the worst performance in this category wasfor the AMDF pitch detector. This result is due to the lack ofresolution in the AMDF measurement which is made onlyevery third or fourth sample—thus the pitch period is onlyestimated to within a couple of samples.
Tables VII and VIII for the smoothed standard deviationsshow that the nonlinear smoother does not strongly affect theraw results presented in Tables V and VI. Slight differences inthe overall performance scores do exist both because of thegross pitch period errors which are detected and corrected tofine pitch period errors, and because of the smoothing of thefine pitch errors themselves.
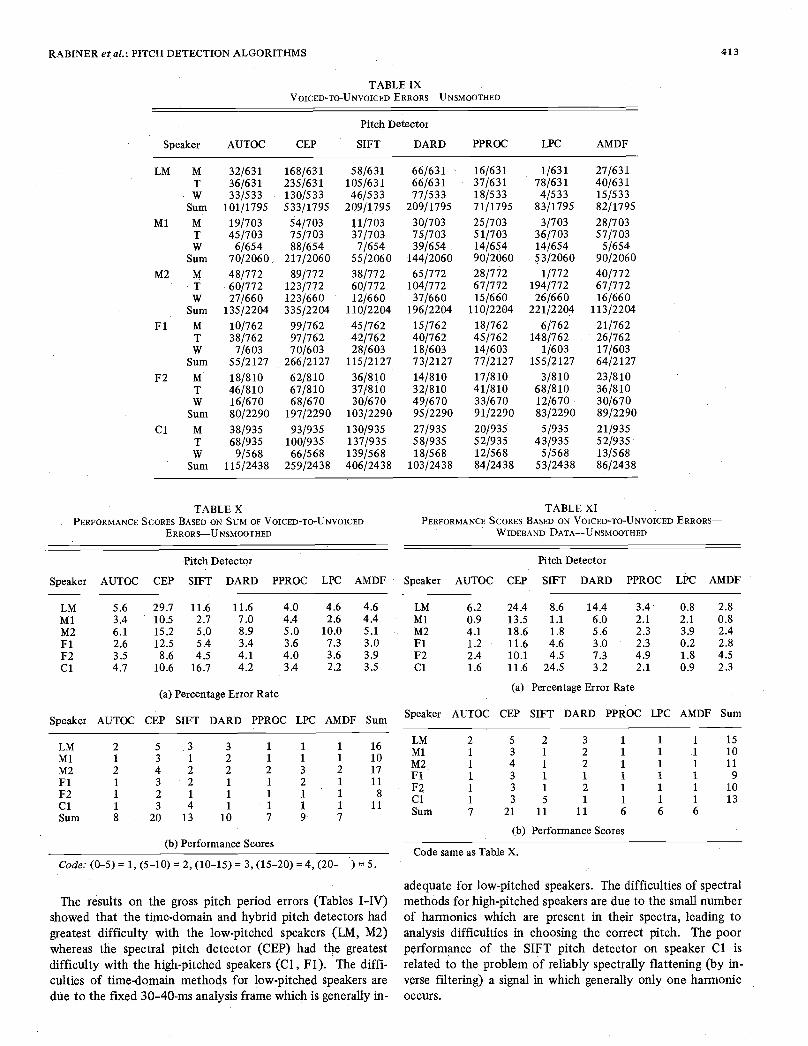
4) Voiced-to-Unvoiced Errors: Tables IX.-XIV present theresults of the voiced-to-unvoiced errors for each pitch detector.Table IX gives the raw average scores for each recording condi-
412 IEEE TRANSACTIONS ON ACOUSTICS, SPEECH, AND SIGNAL PROCESSING, OCTOBER 1976
TABLE VIISTANDARD DEVIATION OF FINE Pvrcsi ERRORSSMOOTHED
Speaker AUTOC CEP
Pitch De
SIFT
tector
DARD PPROC LPC AMDF
LM MTW
Sum
1.11.01.23.3
1.11.21.33.6
1.01.00.92.9
1.21.31.23.7
1.51.61.54.6
1.11.31.03.4
1.91.92.05.8
Ml MTW
Sum
0.60.60.82.0
0.60.60.92.1
0.60.60.92.1
0.80.71.12.6
0.70.60.92.2
0.50.50.71.7
1.21.01.33.5
M2 MTW
Sum
0.80.80.92.5
0.80.91.12.8
0.80.91.12.8
1.00.91.23.1
1.00.81.33.1
0.80.90.82.5
1.51.61.54.6
Fl MTW
Sum
0.50.50.51.5
0.50.60.51.6
0.60.60.82.0
0.80.90.72.4
0.60.70.61.9
0.50.50.41.4
0.91.00.82.7
F2 MTW
Sum
0.60.50.61.7
0.60.50.51.6
0.60.60.61.8
0.90.80.72.4
0.70.70.62.0
0.40.50.51.4
1.01.21.03.2
Cl MTW
Sum
0.40.50.51.4
0.60.50.51.6
1.10.70.92.7
0.60.70.61.9
0.60.50.71.8
0.50.60.41.5
0.91.10.82.8
TABLE VIIIPERFORMANCE SCORES BASED ON SUM OF STANDARD DEVIATIONS OF FINE
PITCH ERRORS—-SMOOTHED
Speaker AUTOC CEP
Pitch
SIFT
Detecto
DARD
r
PPROC LPC AMDF Sum
LM 3 3 2 3 4 3 4 22Ml 2 2 2 2 2 2 3 15M2 2 2 2 3 3 2 4 18Fl 1 2 2 2 2 1 2 12F2 2 2 2 2 2 1 3 14Cl 1 2 2 2 2 1 2 12Sum 11 13 12 14 15 10 18
Code same as Table VI.
tion as well as the sum of the scores across recording condi-tions. Each of the scores is given as a ratio of the number ofvoiced-to-unvoiced errors to the number of voiced intervalsfor each condition. As might be anticipated, there is a greatlack of homogeneity of the results across recording conditions,especially for the LPC pitch detector.
Table X gives a performance evaluation of the pitch detectorsfor the raw data of the voiced-to-unvoiced error rate averagedover the three recording conditions. The scores at the top ofthis table are the percentage of voiced-to-unvoiced errors foreach pitch detector. A ranking of 1 was given to a pitchdetector with an average error rate less than 5 (percent). Alinear scale was used for these performance scores as shown inTable X.
Based on the overall rankings, it can be seen that five of thepitch detectors (AUTOC, DARD, PPROC, LPC, and AMDF)had essentially equivalent performance scores and all tendedto be homogeneous across speakers. The SIFT pitch detector
had a somewhat poorer performance than the top five, and theCEP pitch detector had a poor performance for this errorcategory. We defer a discussion of these results to Section VI.
Because of the lack of homogeneity across recording condi-tions, a second set of performance ratings was made for thiserror category based solely on the wideband recordings. Theseresults are presented in Table XI. From this table it can beseen that four of the pitch detectors (AUTOC, PPROC, LPC,and AMDF) performed extremely well on this condition. TheSIFT and DARD methods had somewhat poorer performancescores, while the CEP method had the worst score.
Tables XII—XIV show the error scores and performancerankings for voiced-to-unvoiced errors for the smoothed pitchcontours. The effect of the smoother is to change slightly thenumber of voiced-to-unvoiced errors. The performance rank-ings for the data averaged over recording conditions (TableXIII) shows slightly different results than for the raw data;however, the rankings for the wideband condition (Table XIV)are quite similar to the raw data rankings of Table XI.
The results of Tables IX—XIV also show that the most diffi-cult speakers were the two low-pitched speakers (LM, M2) andthe high-pitched speaker (C 1).
5) Unvoiced-to-Voiced Errors: The last set of tables (TablesXV-XX) show the results of the unvoiced-to-voiced erroranalysis. The form of the data in these tables is identical tothat used in the voiced-to-unvoiced error category. A per-formance ranking of 1 was given to an unvoiced-to-voicederror rate of less than 10 percent. The remaining rankingscores were assigned linearly as shown in Table XVI. The over-all performance scores for the raw data averaged across record-ing conditions showed the CEP pitch detector to have a verylow score (high performance), in contrast to the very highscores it obtained in the previous error category. The AUTOC,SIFT, DARD, PPROC, and AMDF pitch detectors all hadsimilar performance rankings and the LPC pitch detector had avery poor score. (Again we defer discussion of these results toSection VI.)
Table XVII (for the raw wideband data only) shows the per-formance of the LPC pitch detector to be substantially im-proved and comparable to all but the CEP pitch detector.
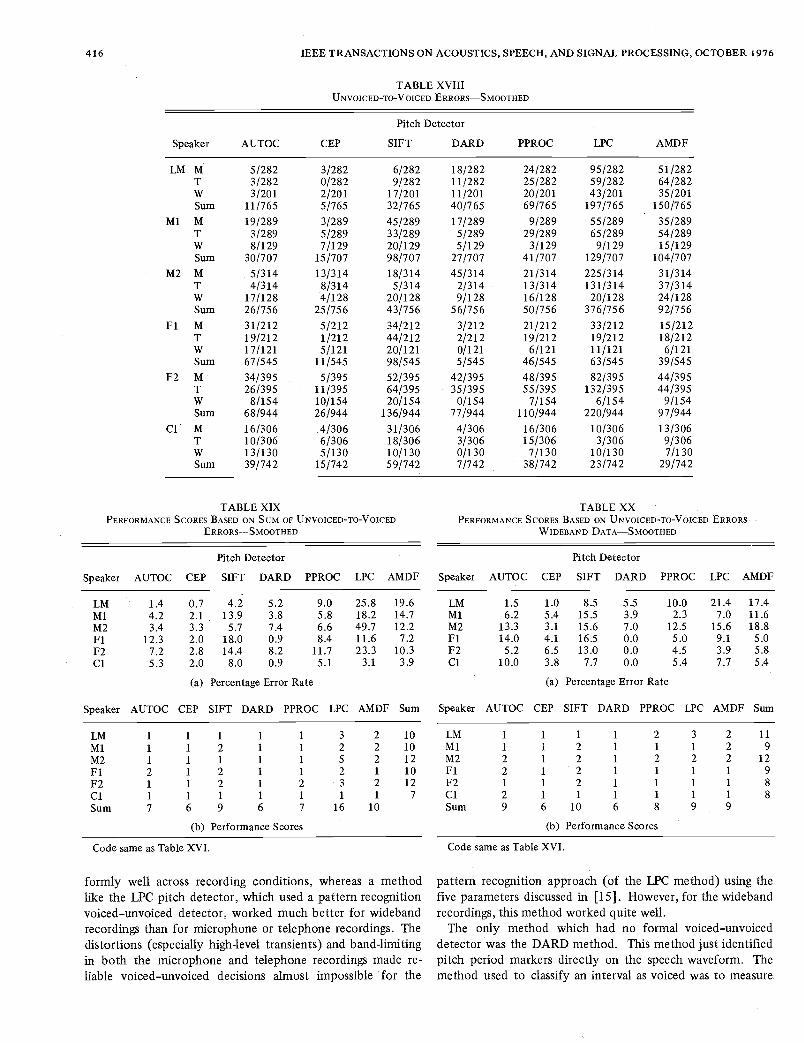
As seen in Tables XVIII—XX, the nonlinear smoother sub-stantially helps almost all the pitch detectors for the unvoiced-to-voiced error category. The performance rankings for all butthe LPC pitch detector are almost comparable for thesmoothed data averaged over recording conditions (Table XIX);for the wideband smoothed data (Table XX) all seven pitchdetectors had comparable performance scores.
VI. DISCUSSION OF ERROR ANALYSIS RESULTS
The error analysis and performance evaluation presented inSection V points up the strengths and weaknesses of each ofthe pitch detectors used in the study. No single pitch detectorwas uniformly top ranked across all speakers, recording condi-tions, and error measurements. In this section we discuss theresults presented in Section V with a view towards explainingthe general trends in the performance scores and how theyrelate back to the specific methods of pitch detection used inthis study.
RABINER etal.: PITCH DETECTION ALGORITHMS 413
TABLE IXVOICED-TO-UNVOICED ERRORS—UNSMOOTHED
Pitch Detector
Speaker AUTOC CEP SIFT DARD PPROC LPC AMDF
LM M 32/631 168/631 58/631 66/631 16/631 1/631 27/631T 36/631 235/631 105/631 66/631 37/631 78/631 40/631W 33/533 130/533 46/533 77/533 18/533 4/533 15/533
Sum 101/1795 533/1795 209/1795 209/1795 71/1795 83/1795 82/1795Ml M 19/703 54/703 11/703 30/703 25/703 3/703 28/703
T 45/703 75/703 37/703 75/703 51/703 36/703 57/703W 6/654 88/654 7/654 39/654 14/654 14/654 5/654
Sum 70/2060, 217/2060 55/2060 144/2060 90/2060 53/2060 90/2060M2 M 48/772 89/772 38/772 65/772 28/772 1/772 40/772
T 60/772 123/772 60/772 104/772 67/772 194/772 67/772W 27/660 123/660 12/660 37/660 15/660 26/660 16/660
Sum 135/2204 335/2204 110/2204 196/2204 110/2204 221/2204 113/2204Fl M 10/762 99/762 45/762 15/762 18/762 6/762 21/762
T 38/762 97/762 42/762 40/762 45/762 148/762 26/762W 7/603 70/603 28/603 18/603 14/603 1/603 17/603
Sum 55/2127 266/2127 115/2127 73/2127 77/2127 155/2127 64/2127F2 M 18/810 62/810 36/810 14/810 17/810 3/810 23/810
T 46/810 67/810 37/810 32/810 41/810 68/810 36/810W 16/670 68/670 30/670 49/670 33/670 12/670 30/670
Sum 80/2290 197/2290 103/2290 95/2290 91/2290 83/2290 89/2290Cl M 38/935 93/935 130/935 27/935 20/935 5/935 21/935
T 68/935 100/935 137/935 58/935 52/935 43/935 52/935W 9/568 66/568 139/568 18/568 12/568 5/568 13/568
Sum 115/2438 259/2438 406/2438 103/2438 84/2438 53/2438 86/2438
TABLEXPERFORMANCE SCORES BASED ON SUM OF VOICED-TO-UNVOICED
ERRORS—UNSMOOTHED
TABLE XIPERFORMANCE SCORES BASED ON VOICED-TO-UNVOICED ERRORS—
WIDEBAND DATA—UNSMOOTHED
Pitch Detector Pitch Detector
Speaker AUTOC CEP SIFT DARD PPROC LPC AMDF ' Speaker AUTOC CEP SIFT DARD PPROC LPC AMDF
5.6 29.7 11.6 11.63.4 10.5 2.7 7.06.1 15.2 5.0 8.92.6 12.5 5.4 3.43.5 8.6 4.5 4.14.7 10.6 16.7 4.2
2 5 .3 31 3 1 22 4 2 21 3 2 11 2 1 11 3 4 18 . 20 13 10
4.0 4,6 4.6 LM4.4 2.6 4.4 Ml5.0 10.0 5.1 M23.6 7.3 3.0 Fl4.0 3.6 3.9 F23,4 2.2 3.5 . Cl
2 5 21 3 11 4 11 3 11 3 1
1 3 57 21 11
3 1 1 1 152 1 1 1 102 1 1 1 111 1 1 1 92 1 1 1 101 1 1 1 13
11 6 6 6
LMMlM2FlF2Cl
6.2 24.4 8.6 14.4 3.4 0.8 '2.80.9 13.5 1.1 6.0 2.1 2.1 0.84.1 18.6 1.8 5.6 2.3 3.9 2.41.2 11.6 4.6 3.0 ' 2.3 0.2 2.82.4 10.1 4.5 7.3 4.9 1.8 4.51.6 11.6 24.5 3.2 2.1 0.9 2.3
(a) Percentage Error Rate
LMMlM2FlF2ClSum
(a) Percentage Error Rate
Speaker AUTOC CEP SIFT DARD PPROC LPC AMDF Sum Speaker AUTOC CEP SIFT DARD PPROC LPC AMDF Sum
LM1 1 1 16 Ml1 1 1 10
M22 3 2 17 Fl1 2 1 11 F21 11 8 Cl1 1 1 11 Sum7 9 7
(b) Performance Scores(b) Performance Scores
Code same as Table X.Code: (0—5) = 1, (5—10) = 2, (10—15) = 3, (15—20) = 4, (20— ) = 5.
adequate for low-pitched speakers. The difficulties of spectralThe results on the gross pitch period errors (Tables I—IV) methods for high-pitched speakers are due to the small number
showed that the time-domain and hybrid pitch detectors had of harmonics which are present in their spectra, leading togreatest difficulty with the low-pitched speakers (LM, M2) analysis difficulties in choosing the correct pitch. The poorwhereas the spectral pitch detector (CEP) had the greatest performance of the SIFT pitch detector on speaker Cl isdifficulty with the high-pitched speakers (Cl, Fl). The diffi- related to the problem of reliably spectrally flattening (by in-culties of time-domain methods for low-pitched speakers are verse filtering) a signal in which generally only one harmonicdue to the fixed 30—40-ms analysis frame which is generally in- occurs.

414 IEEE TRANSACTIONS ON ACOUSTICS, SPEECH, AND SIGNAL PROCESSING, OCTOBER 1976
TABLE XIIVOICED-TO-UNVOICED ERRORS—SMOOTBED
Speaker AUTOC CEP
Pitch D
SIFT
etector
DARD PPROC LPC AMDF
LM MTWSum
112/626213/62669/512
404/1764
137/626226/62697/512
460/1764
48/626135/62628/512
211/1764
56/62660/62661/512
117/1764
31/62660/62618/512
109/1764
6/62679/6266/512
91/1764
34/62685/62611/512
130/1764Ml M
TWSum
20/70664/7069/657
93/2069
43/706
65/70674/657
182/2069
8/70642/7067/657
57/2069
33/706
91/70644/657168/2069
26/70667/70617/657
110/2069
0/70625/70614/657
39/2069
24/70660/7065/657
89/2069M2 M
TWSum
90/782134/78232/660
256/2224
80/782104/782116/660300/2224
47/78286/782
9/660142/2224
86/782114/78243/660
243/2224
45/78289/78225/660
159/2224
0/782213/78215/660
228/2224
46/78285/78216/660
147/2224Fl M
TWSum
7/76940/769
7/60754/2145
119/76992/76981/607
292/2145
50/76934/76922/607
106/2145
32/76953/76924/607
109/2145
16/76945/76918/60779/2145
2/769157/769
2/607161/2145
19/76922/76921/60762/2145
F2 MTWSum
13/81544/81515/67672/2306
61/81570/81572/676
203/2306
29/81534/81528/67691/2306
17/81543/81583/676
143/2306
8/81546/81538/67692/2306
4/81547/81512/67663/2306
32/81548/81532/676
112/2306Cl M
TWSum
40/94170/941
8/600118/2482
99/941107/94170/600
276/2482
198/941175/941230/600603/2482
44/941107/94126/600
177/2482
31/94165/94115/600
11.1/2482
31/94185/9415/600
121/2482
86/94197/94133/600
216/2482
Speaker AUTOC CEP
Pitch Detector
SIFT DARD PPROC LPC AMDF
LM 22.9 26.1 12.0 10.0 6.2 5.2 7.4Ml 4.5 8.8 2.8 8.1 5.3 1.9 4.3M2 11.5 13.5 6.4 10.9 7.1 10.3 6.6Fl 2.5 13.6 4.9 5.1 3.7 7.5 2.9F2Cl
3.14.8
8.811.1
3.9 6.2 4.024.3 7.1 4.5
2.74.9
4.98.7
(a) Percentage Error Rate
Speaker AUTOC CE? SIFT DARD PPROC LPC AMDF Sum
LM 5 5 3 3 2 2 2 22Ml 1 2 1 2 2 1 1 10M2 3 3 2 3 2 3 2 18Fl 1 3 1 2 1 2 1 11
F2 1 2 1 2 1 1 1 9Cl 1 3 5 2 1 1 2 15Sum 12 18 13 14 9 10 9
(b) Performance Scores
Code same as Table X.
The results on the fine pitch period errors (Tables V—VIII)showed that (aside from the AMDF method which inherentlylacked pitch resolution) the time-domain waveform pitch de-tectors (DARD, PPROC) had somewhat lower resolution thanthe other methods. This is due to the sensitivity of waveformpeaks, valleys, and zero crossings to formant changes, noise,distortion, etc.
The error measurements of voiced-to-unvoiced and unvoiced-
Speaker AUTOC CEP
Pitch Detector
SIFT DARD PPROC LPC AMDF
LMMlM2FlF2Cl
13.51.44.8
1.22.21.3
18.911.317.6
13.310.711.7
5.5 11.9 3.51.1 6.7 2.6
1.4 6.5 3.83.6 4.0 3.04.1 12.3 5.6
38.3 4.3 2.5
1.22.12.3
0.31.80.8
2.10.82.4
3.54.75.5
(a) Percentage Error Rate
Speaker AUTOC CEP SIFT DARD PPROC LPC AMDF Sum
LMMlM2FlF2ClSum
31
1
11
1
8
434333
20
2 3 1
1 2 1
1 2 1
1 1 1
1 3 25 1 1
11 12 7
1
1
1
1
1
1
6
1
1
1
1
1
27
151011
91214
(b) Performance Scores
Code same as Table X.
to-voiced errors provided several interesting results. Thesecategories cannot be examined separately because they areoften intimately related. For example, a voiced—unvoiced de-tector which is biased towards the category voiced willgenerally have a low voiced-to-unvoiced error rate, but incompensation will have a high unvoiced-to-voiced error rate.There are three types of voiced—unvoiced decision methodsused in the seven pitch detectors. One method is the use of a
TABLE XIIIPERFORMANCE SCORES BASED ON SUM OF VOICED-TO-UNVOICED
ERRORS—S MOOTHED
TABLE XIVPERFORMANCE SCORES BASED ON VOICED-TO-UNVOICED ERRORS—-
WIDEBAND DATA—SMOOTHED

RABINER et a!.: PITCH DETECTION ALGORITHMS 415
Speaker AUTOC CEP
Pitch Detector
SIFT DARD PPROC LPC AMDF
LMMlM2FlF2Cl
15.110.113.116.215.912.3
3.32.74.73.95.63.2
16.9 10.0 20.717.6 10.1 16.118.7 15.3 18.522.7 15.8 18.521.0 23.0 25.420.0 11.8 18.5
46.925.150.423.847.626.7
20.216.913.611.423.811.8
(a) Percentage Error Rate
Speaker AUTOC CEP SIFT DART PPROC LPC AMDF Sum
LMMlM2FlF2ClSum
222222
12
111111
6
2 2 3 52 2 2 32 2 2 53 2 2 33 3 3 53 2 2 3
15 13 14 24
3
222
3214
181416152015
(b) Performance Scores
simple threshold on one or more measurements to classify aninterval as voiced or unvoiced. For example, the preliminaryvoiced-unvoiced detector used in the AUTOC, CEP, SIFT, andPPROC methods used a waveform threshold to remove inter-vals of silence. The second type of voiced—unvoiced detectoris the periodicity measurement. For example, the AUTOC,AMDF, and SIFT methods used a threshold on the autocorre-lation peak to decide if the interval was periodic whereas the
Speaker AUTOC CEP
Pitch Detector
SIFT DARD PPROC LPC AMDF
LMMlM2FlF2Cl
17.810.615.6
16.8
10.0
11.4
1.76.83.1
4.0
6.9
5.3
18.3 13.9 16.116.7 6.8 12.1
23.4 14.8 20.324.8 6.4 10.4
16.9 1.9 5.6
15.9 12.9 11.4
25.68.3
17.2
12.0
9.4
8.3
17.213.618.8
4.8
8.1
6.8
(a) Percentage Error Rate
Speaker AUTOC CEP SIFT DARD PPROC LPC AMDF Sum
LMMlM2FlF2ClSum
22222212
1
1
1
1
1
1
6
2 2 2 3
2 1 2 13 2 3 23 1 2 22 1 1 12 2 2 1
14 9 12 10
2
2
2111
9
1411
15129
11
(b) Performance Scores
CEP method used a threshold on the cepstral peak for thispurpose. The third type of voiced—unvoiced detector is thepattern recognition statistical approach used in the LPC pitchdetector. Each of these methods has some advantages anddisadvantages. For example, the periodicity measurementtends to be extremely robust with regard to noise, distortion,and spurious transients in the signal. Thus methods like theAUTOC and AMDF pitch detectors tended to work uni-
TABLE XVUNVOICED-TO-VOICED ERRORS—UNSMOOTHED
Speaker AUTOC CEP
Pitch Detector
SIFT DARD PPROC LPC AMDF
LM MTWSum
44/277
35/27732/180111/734
16/2775/2773/180
24/734
45/27746/27733/180124/734
24/27725/27725/18074/734
52/27771/27729/180152/734
165/277133/27746/180344/734
48/27769/27731/180148/734
Ml MTWSum
32/29226/29214/13272/716
5/2925/2929/13219/716
52/29252/29222/132
126/7.16
27/29236/2929/132
72/716
25/29274/29216/132
115/716
73/29296/29211/132
180/716
35/29268/29218/132121/716
M2 MTWSum
42/32439/32420/128101/772
19/324
13/3244/12836/772
55/32459/32430/128144/772
88/324
11/32419/128
118/772
65/32452/32426/128143/772
226/324141/32422/128389/772
43/32438/32424/128105/772
Fl MTWSum
40/21930/21921/125
91/563
9/2198/219
5/12522/563
50/219
47/21931/125128/563
56/21925/2198/125
89/563
48/21943/21913/125
104/563
68/219
51/21915/125
134/563
29/21929/2196/12564/563
F2 MTWSum
86/40051/40016/160
153/960
20/40023/40011/16054/960
91/40084/40027/160202/960
147/40071/4003/160
221/960
128/400107/400
9/160244/960
254/400188/40015/160 .
457/960
126/40089/40013/160
228/960
Cl MTWSum
43/31235/312
15/13293/756
7/312
10/3127/132
24/756
73/31257/31221/132151/756
29/31243/31217/132
89/756
51/31274/312
15/132
140/756
89/312102/31211/132
202/756
37/312
43/3129/132
89/756
TABLE XVIPERFORMANCE SCORES BASED ON SUM OF UNVOICED-TO-VOICED
ERRORS—UNSMOOTHED
TABLE XVIIPERFORMANCE SCORES BASED ON UNVOICED-TO-VOIGED ERRORS—
WIDEBAND DATA—UNSMOOTHED
Code: (0—10) = 1, (10—20) 2, (20—30) = 3,(30—40)4,(40— )=5.
Code same as Table XVI.
416 IEEE TRANSACTIONS ON ACOUSTICS, SPEECH, AND SIGNAL PROCESSING, OCTOBER 1976
TABLE XVIIIUNVOICED-TO-VOICED ERRORS—SMOOTHED
Speaker AUTOC CEP
Pitch De
SIFT
tector
DARD PPROC LPC AMDF
LM MTWSum
5/2823/2823/201
11/765
3/2820/2822/2015/765
6/2829/282
17/20132/765
18/28211/28211/20140/765
24/28225/28220/20169/765
95/28259/28243/201
197/765
51/28264/28235/201
150/765Ml M
TWSum
19/2893/2898/129
30/707
3/2895/2897/129
15/707
45/28933/28920/12998/707
17/2895/2895/129
27/707
9/28929/289
3/12941/707
55/28965/289
9/129129/707
35/28954128915/129
104/707M2 M
TWSum
5/3144/314
17/12826/756
13/3148/3144/128
25/756
18/3145/314
20/12843/756
45/3142/3149/128
56/756
21/31413/31416/12850/756
225/314131/31420/128
376/756
31/31437/31424/12892/756
Fl MTWSum
31/21219/21217/12167/545
5/2121/2125/121
11/545
34/21244/21220/12198/545
3/2122/2120/1215/545
21/21219/2126/121
46/545
33/21219/21211/12163/545
15/21218/2126/121
39/545F2 M
TWSum
34/39526/395
8/15468/944
5/39511/39510/15426/944
52/39564/39520/154
136/944
42/39535/3950/154
77/944
48/39555/3957/154
110/944
82/395132/395
6/154220/944
44/39544/395
9/15497/944
Cl MTWSum
16/30610/30613/13039/742
4/3066/3065/130
15/742
31/30618/30610/13059/742
4/3063/3060/1307/742
16/30615/3067/130
38/742
10/3063/306
10/13023/742
13/3069/3067/130
29/742
Speaker AUTOC CEP
Pitch Detector
SIFT DARD PPROC LPC AMDF
LMMlM2FlF2Cl
1.44.23.4
12.37.25.3
0.72.13.32.02.82.0
4.2 5.2 9.013.9 3.8 5.85.7 7.4 6.6
18.0 0.9 8.414.4 8.2 11.7
8.0 0.9 5.1
25.818.249.711.623.3
3.1
19.614.712.27.2
10.33.9
(a) Percentage Error Rate
Speaker AUTOC CEP SIFT DARD PPROC LPC AMDF Sum
LMMlM2FlF2ClSum
1112117
11
1
1
1
1
6
1 1 1 32 1 1 21 1 1 52 1 1 22 1 2 31 1 1 1
9 6 7 16
222121
10
10101210127
(b) Performance Scores
formly well across recording conditions, whereas a methodlike the LPC pitch detector, which used a pattern recognitionvoiced—unvoiced detector, worked much better for widebandrecordings than for microphone or telephone recordings. Thedistortions (especially high-level transients) and band-limitingin both the microphone and telephone recordings made re-liable voiced—unvoiced decisions almost impossible for the
Speaker AUTOC CEP
Pitch Detector
SIFT DARD PPROC LPC AMDF
LMMlM2FlF2Cl
1.56.2
13.314.05.2
10.0
1.05.43.14.16.53.8
8.5 5.5 10.015.5 3.9 2.315.6 7.0 12.516.5 0.0 5.013.0 0.0 4.5
7.7 0.0 5.4
21.47.0
15.69.13.97.7
17.411.618.85.05.85.4
(a) Percentage Error Rate
Speaker AUTOC CEP SIFT DARD PPROC LPC AMDF Sum
LMMlM2FlF2ClSum
1122129
1
1
1
1
1
1
6
1 1 2 3
2 1 1 1
2 1 2 22 1 1 1
2 1 1 1
1 1 1 1
10 6 8 9
2221
1
1
9
119
12988
(b) Performance Scores
pattern recognition approach (of the LPC method) using thefive parameters discussed in [15]. However, for the widebandrecordings, this method worked quite well.
The only method which had no formal voiced-unvoiceddetector was the DARD method. This method just identifiedpitch period markers directly on the speech waveform. Themethod used to classify an interval as voiced was to measure
TABLE XIXPERFORMANCE SCORES BASED ON SCM OF UNVOICED-TO-VOICED
ERRORS—SMOOTHED
TABLE XXPERFORMANCE SCORES BASED ON UNVOICED-TO-VOICED ERRORS—
WIDEBAND DATA—SMOOTHED
Code same as Table XVI.
RABINER etaL: PITCH DETECTION ALGORITHMS 417
the spacing between adjacent markers centered around theinterval and to call the interval as unvoiced if the marker spac-ing exceeded 200 samples (20-ms period). This method pro-vided surprisingly good results yielding a reasonable voiced—unvoiced error rate.
Finally, it can be seen that the CEP pitch detector had astrong tendency to classify voiced intervals as unvoiced. Incompensation the unvoiced-to-voiced error rate for the CEPmethod was very low. Readjustment of the cepstral peakthreshold and the following zero-crossing threshold wouldyield a tradeoff in these scores.
VII. COMPUTATIONAL CONSIDERATIONS
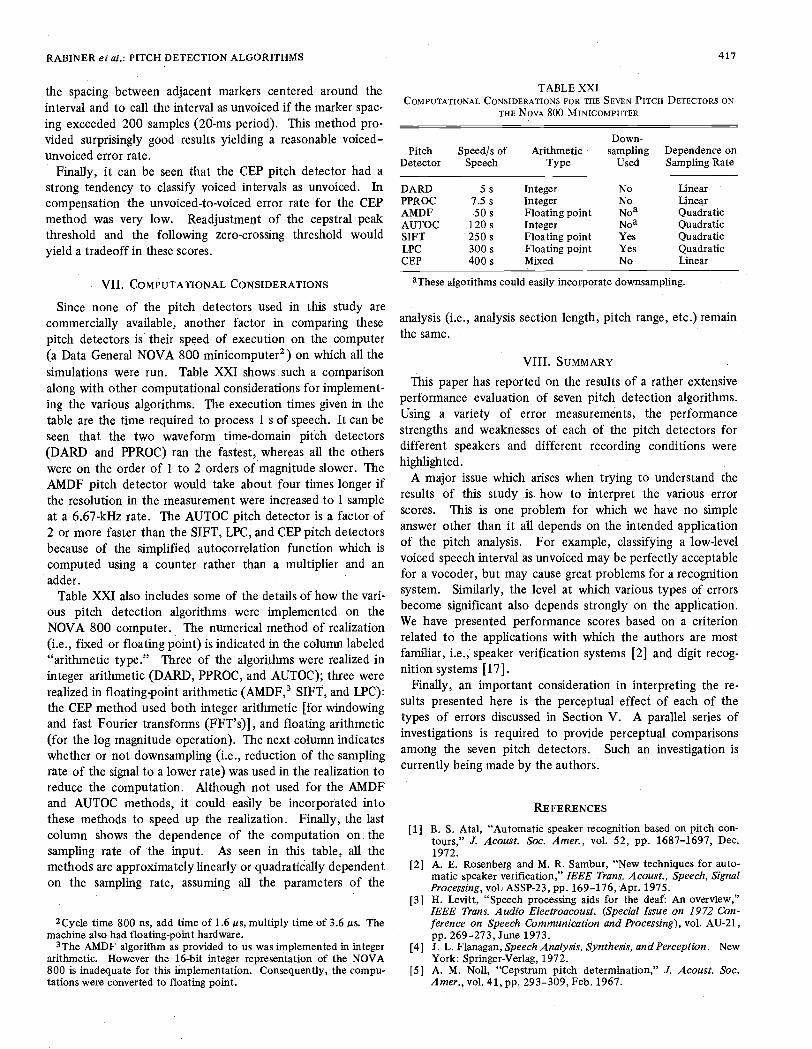
Since none of the pitch detectors used in this study arecommercially available, another factor in comparing thesepitch detectors is their speed of execution on the computer(a Data General NOVA 800 minicomputer2) on which all thesimulations were run. Table XXI shows such a comparisonalong with other computational considerations for implement-ing the various algorithms. The execution times given in thetable are the time required to process 1 s of speech. It can beseen that the two waveform time-domain pitch detectors(DARI) and PPROC) ran the fastest, whereas all the otherswere on the order of 1 to 2 orders of magnitude slower. TheAMDF pitch detector would take about four times longer ifthe resolution in the measurement were increased to 1 sampleat a 6.67-kHz rate. The AUTOC pitch detector is a factor of2 or more faster than the SIFT, LPC, and CEP pitch detectorsbecause of the simplified autocorrelation function which iscomputed using a counter rather than a multiplier and anadder.
Table XXI also includes some of the details of how the vari-ous pitch detection algorithms were implemented on theNOVA 800 computer. The numerical method of realization(i.e., fixed or floating point) is indicated in the column labeled"arithmetic type." Three of the algorithms were realized ininteger arithmetic (DARD, PPROC, and AUTOC); three wererealized in floating-point arithmetic (AMDF,3 SIFT, and [PC):the CEP method used both integer arithmetic [for windowingand fast Fourier transforms (FFT's)], and floating arithmetic(for the log magnitude operation). The next column indicateswhether or not downsampling (Le., reduction of the samplingrate of the signal to a lower rate) was used in the realization toreduce the computation. Although not used for the AMDFand AUTOC methods, it could easily be incorporated intothese methods to speed up the realization. Finally, the lastcolumn thows the dependence of the computation on thesampling rate of the input. As seen in this table, all themethods are approximately linearly or quadratically dependenton the sampling rate, assuming all the parameters of the
2Cycle time 800 ns, add time of 1.6 s, multiply time of 3.6 is. Themachine also had floating-point hardware.
3The AMDF algorithm as provided to us was implemented in integerarithmetic. However the 16-bit integer representation of the NOVA800 is inadequate for this implementation. Consequently, the compu-tations were converted to floating point.
TABLE XXICOMPUTATIONAL CONSIDERATIONS FOR THE SEVEN PITCH DETECTORS ON
THE NOVA 800 MINICOMPUTER
Down-Pitch
DetectorSpeed/s of
SpeechArithmetic
Typesampling
UsedDependence onSampling Rate
DARD 5 s Integer No LinearPPROC 7.5 s Integer No LinearAMDF 50 s Floating point N0 QuadraticAUTOC 120 s Integer No QuadraticSIFT 250 s Floating point Yes QuadraticLPC 300 s Floating point Yes QuadraticCEP 400 s Mixed No Linear
aThese algorithms could easily incorporate downsampling.
analysis (i.e., analysis section length, pitch range, etc.) remainthe same.
VIII. SUMMARY
This paper has reported on the results of a rather extensiveperformance evaluation of seven pitch detection algorithms.Using a variety of error measurements, the performancestrengths and weaknesses of each of the pitch detectors fordifferent speakers and different recording conditions werehighlighted.
A major issue which arises when trying to understand theresults of this study is how to interpret the various errorscores. This is one problem for which we have no simpleanswer other than it all depends on the intended applicationof the pitch analysis. For example, classifying a low-levelvoiced speech interval as unvoiced may be perfectly acceptablefor a vocoder, but may cause great problems for a recognitionsystem. Similarly, the level at which various types of errorsbecome significant also depends strongly on the application.We have presented performance scores based on a criterionrelated to the applications with which the authors are mostfamiliar, i.e., speaker verification systems [2] and digit recog-nition systems [17].
Finally, an important consideration in interpreting the re-sults presented here is the perceptual effect of each of thetypes of errors discussed in Section V. A parallel series ofinvestigations is required to provide perceptual comparisonsamong the seven pitch detectors. Such an investigation iscurrently being made by the authors.
REFERENCES
[1] B. S. Atal, "Automatic speaker recognition based on pitch con-tours," J. Acoust. Soc. Amer., vol. 52, pp. 1687—1697, Dec.1972.
[2] A. E. Rosenberg and M. R. Sambur, "New techniques for auto-matic speaker verification," IEEE Trans. Acoust., Speech, SignalProcessing, vol. ASSP-23, pp. 169—176, Apr. 1975.
[3] H. Levitt, "Speech processing aids for the deaf: An overview,"IEEE Trans. Audio Electroacoust. (Special Issue on 1972 Con-ference on Speech Communication and Processing), vol. AU-21,pp. 269—273, June 1973.
[4] J. L. Flanagan, Speech Analysis, synthesis, andPerception. NewYork: Springer-Verlag, 1972.
[5] A. M. NoB, "Cepstrum pitch determination," .1. Acoust. Soc.Amer, vol. 41, pp. 293—309, Feb. 1967.
418 IEEE TRANSACTIONS ON ACOUSTICS, SPEECH, AND SIGNAL PROCESSING, VOL. ASSP-24, NO. 5, OCTOBER 1976
[6] B. Gold and L. R. Rabiner, "Parallel processing techniques forestimating pitch periods of speech in the time domain," J.Acoust. Soc. Amer., vol. 46, pp. 442-448, Aug. 1969.
[7] M. M. Sondhi, "New methods of pitch extraction," IEEE Trans.Audio Electroacoust. (Special Issue on Speech Communicationand Processing—Part Ii) vol. AU-16, pp. 262—266, June 1968.
[8] J. D. Market, "The SIFT algorithm for fundamental frequency es-timation," IEEE Trans. Audio Electroacourt., vol. AU-20, pp.367—377, Dec. 1972.
[9] N. J. Miller, "Pitch detection by data reduction," IEEE Tranr,Acoust., Speech, Signal Processing (Special Issue on IEEE Sym-posium on Speech Recognition), vol. ASSP-23, pp. 72-79, Feb.1975.
[10] M. J. Ross, H. L. Shaffer, A. Cohen, R. Freudberg, and H. J.Manley, "Average magnitude difference function pitch extrac-tor," IEEE Trans. Acoust., Speech, Signal Processing, vol.ASSP-22, pp. 353—362, Oct. 1974.
[11] 3. J. Dubnowski, R. W. Schafer, and L. R. Rabiner, "Real-timedigital hardware pitch detector," IEEE Trans. Acoust., Speech,Signal Processing, vol. ASSP-24, pp. 2—8, Feb. 1976.
[12] R. W. Schafer and L. R. Rabiner, "System for automatic formantanalysis of voiced speech," .1. Acoust. Soc. Amer., vol. 47, pp.634—648, Feb. 1970.
[13] C. A. McGonegal, L. R. Rabiner, and A. E. Rosenberg, "A semi-aptomatic pitch detector (SAPD)," IEEE Trans. Acoust., Speech,Signal Processing, vol. ASSP-23, pp. 570—574, Dec. 1975.
[14] J. D. Markel and A. H. Gray, Linear Prediction of Speech. NewYork: Springer, 1976.
[15] B. S. Atal and L. R. Rabiner, "A pattern recognition approach tovoiced—unvoiced—silence classification with applications to speechrecognition," IEEE Trans. Acoust., Speech, Signal Processing,vol. ASSP-24, pp. 201—212, June 1976.
[16] R. E. Crochiere and L. R. Rabiner, "Optimum FIR digital fllterimplementations for decimation, interpolation, and narrow-bandfiltering," IEEE Trans. Acoust., Speech, Signal Processing, vol.ASSP-23, pp. 444—456, Oct. 1975.
[17] L. R. Rabiner, M. R. Sambur, and C. E. Schmidt, "Applicationsof a nonlinear smoothing algorithm to speech processing' IEEETrans. Acoust., Speech, Signal Processing, vol. ASSP-23, pp. 552—557, Dec. 1975.
[18] M. J. Cheng, "A comparative performance study of several pitchdetection algorithms," M. S. thesis, Mass. Inst. Technol., Cam-bridge, June 1975.
[19] L. R. Rabiner and M. R. Sambur, "Some preliminary experimentsin the recognition of connected digits," IEEE Trans. A coust.,Speech, Signal Processing, vol. ASSP-24, pp. 170—182, Apr. 1976.
Maximum Likelihood Pitch EstimationJAMES D. WISE, STUDENT MEMBER, IEEE, JAMES R. CAPRIO, MEMBER, IEEE, AND THOMAS W. PARKS, MEMBER, IEEE
Abstract—A method for estimating the pitch period of voiced speechsounds is developed based on a maximum likelihood (ML) formulation.It is capable of resolution finer than one sampling period and is shownto perform better in the presence of noise than the cepstrum method.
I. INTRODUCTION
MANY current speech encoding techniques attempt toachieve low-rate digitized speech transmission bymodeling the speech source as a linear filter, repre-
senting the vocal tract resonances, excited by either randomnoise or a quasiperiodic pulse train, representing the sourcesignal for unvoiced and voiced speech, respectively. Achievinggood-quality resynthesized speech with this model requiresthat both the filter parameters and the excitation signal beaccurately estimated. The mechanical character of the earlyvocoders was due largely to their inability to extract the exci-tation signal and motivated the development of the voice-excited vocoder [1]. It is this same difficulty in accuratelymodeling the excitation signal which is responsible for thepopularity of systems which transmit a quantized version ofthe estimated excitation signal even though they have a higherdata rate than those which parameterize the excitation.
Manuscript received October 23, 1975; revised March 30, 1976 andAprll 6, 1976. This work was supported in part by the National Sci-ence Foundation under Grant ENG 70-01349 A03.
3. D. Wise and T. W. Parks are with the Department of ElectricalEngineering, Rice University, Houston, TX 77001.
J. R. Caprio is with Comptek Research, Inc., Buffalo, NY.
The difficulty in estimating the excitation is compounded bydepartures from the idealizations used in developing themethod which are encountered in a realistic situation: noisyenvironment, absence of the fundamental due to band-limiting,simultaneous presence of periodic and random excitation,phase distortion, or rapid changes in pitch period. In particu-lar, the sensitivity of the pitch detector to ambient noise is aserious limitation in many potential applications of analysis-synthesis telephony systems [2] -
The pitch detection scheme to be discussed is designed to beresistant to white, Gaussian noise, may be extended to colorednoise, and shows promising performance in the presence ofrealistic environmental noise. In addition, it is capable ofdetermining the pitch period with a resolution finer than onesample period, resulting in improved performance for high-pitched speech.
In revising this paper, the authors discovered that Noll [3]proposed a maximum likelthood (ML) pitch estimationmethod similar to that described in Section II of this paper.The modifications developed in Section III reduce his problemof multiple peaks with increasing amplitude caused by noise,and enable this method to provide a parameter which is usefulin making the voiced-unvoiced decision. An interpretation interms of the signal autocorrelation function is presented whichis useful in suggesting possible efficient implementationsand in providing insight into the frequency-domain behaviorof the estimator. This method has been evaluated on sev-eral utterances with various types of noise and signal-to-