a comparative cost analysis of material handling equipment ... · dla-92-p10090 a comparative cost...
TRANSCRIPT

.4
AD-A248 195
DTIC.! ELECTE 1
DLA-92-P10090 I D
A COMPARATIVE COST ANALYSIS OFMATERIAL HANDLING EQUIPMENTFOR THE CONNECTOR BUILDING
COMPLEX
October 1991
OPERATIONS RESEARCH AND ECONOMIC. ANALYSIS OFFICE
im~~ ~i *uk *wo cmrVjp~t
L. A!a a n a u i ts
DEPARTMENT OF DEFENSEDEFENSE LOGISTICS AGENCY
92-0845492 4 oa I02I 1I0lH

DLA-92-P10090
A COMPARATIVE COST ANALYSIS OFMATERIAL HANDLING EQUIPMENT
FOR THE CONNECTOR BUILDING
COMPLEXAccesion '!or
NTIS RLCDTIC TA3@ Ell
October 1991 Una"o'"cd 0 ISJustificaion
Henry J. Kostanski -----i-itio°tl
Av .:'.i;4y Coce zAvail a-;,d i ot
Dist Sp.-UaI
DEPARTMENT OF DEFENSEDEFENSE LOGISTICS AGENCY
OPERATIONS RESEARCH AND ECONOMIC ANALYSIS OFFICECAMERON STATION
ALEXANDRIA, VA 22304-6100

DEFENSE LOGISTICS AGENCYHEADQUARTERS
CAMERON STATION
At EXANDR,A VIRGINIA 22304 6100
DLA- LO
FOREWORD
This report identifies the cost of implementing an automated guidedvehicle system and compares this to the cost of utilizing conventionalequipment for the same functions in the Connector Building Complex atDefense Depot Richmond, Virginia. The report provides the informationnecessary to decision makers to select an appropriate type ofequipment.
The results of this study indicate that several alternatives arefeasible and cost effective. The study also describes in detail theresources required to implement each alternative. Finally, theanal is shows that investment in a full scale automated guidedveh e system is not cost effective. Implementation of a moreconventional type of equipment would provide Defense Depot Richmond,Virginia, with the ability to meet all processing goals and afford anopportunity for DLA to experience a savings of $6.2 million indiscounted dollars. /
C. ROY
tant DirectorOfl ce of Policy and Plans
iii

CONTENTS
Title Pave
Foreword....................................................................11iContents...................................................................... vList of Tables............................................................. viiList of Figures.............................................................. ixExecutive Summary........................................................... xi
I. INTRODUCTION............................................................1IA. Background.......................................................... 1B. Purpose....................................................... ...... 1IC. Study Objectives....................................................1ID. Scope................................................................ I
II. CONCLUSIONS..............................................................3
Ill. RECOMMENDATIONS......................................................... 3
IV. SAVINGS AND BENEFITS.................................................... 3A. Savings............................................................. 3B. Benefits...................................................... ...... 3
V. METHODOLOGY............................................................. 3A. General Methodology................................................. 3
V1. ANALYSIS................................................................. 6A. Operational Procedures for the AGV
System and Alternate Equipment.................................. 6B. Equipment Capabilities
and System Requirements.......................................... 0C. Performance Throughput............................................. 1)
VII. COST ANALYSIS........................................................... 13A. General............................................................. 13B. Least Cost Alternative............................................. 17C. Additional Alternative............................................. 19
APPENDIX A................................................................. A-]
APPENDIX B.................................................................. B-1
v

LIST OF TABLES
Number Title Page
1 Daily Workload Bin and Bulk Areas .................... 5
2 Equipment Characteristics ........................... 11
3 Pallet and Module Movement
Capabilities .................................... 14
4 Cost Factors ........................................ 14
5 Total Workload 10-YearLife Cycle ...................................... 15
6 Least Cost Combination
10-Year Life Cycle .............................. 21
vii

LIST OF FIGURES
Number Title Page
1 Connector Building Complex.......................... 2
2 Connector Building Complex......................... 10
3 Total Cost/l0-Year Life Cycle ......................16
4 Cumulative Cost- -Discounted ........................18
5 Total Cost/l0-Year Life Cycle ......................20
6 Total Cost/l0-Year Life CycleBin Area- -Baseline Workload .....................22
7 Package Conveyer/TransporterBaseline Workload............................. 23
ix.

EXECUTIVE SUMMARY
The construction of the Connector Building Complex (CBC) at Defense DepotRichmond, Virginia (DDRV), is well under way and due to be completed in
February 1992. The original concept for the CBC included an automated guidedvehicle (AGV) system to be installed throughout. However, based on depot
consolidation efforts in progress for all of Defense Logistics Agency (DLA),the mission of DDRV may be changing. For this reason, the Directorate ofSupply Operations, Depot Operations Division (DLA-OWM), asked DLA OperationsResearch and Economic Analysis Management Support Office (DORO) to perform ananalysis to determine if an AGV system or an alternative type of equipmentwould be most cost effective for the CBC.
The results of the study indicate that an AGV system would not be costeffective at any foreseeable workload level. Implementation of a full scale
AGV system, which would handle a workload similar to that which DDRV currentlyhandles, would have a 10-year life cycle cost of $8.4 million in discounteddollars. In this study, we propose using forklifts and transporters to handlethe same workload, at a cost of $2.2 million in discounted dollars, over thesame life cycle. Selection of this alternative would result in a cost savingsto DLA of $6.2 million in discounted dollars over the AGV system.
xi

I. INTRODUCTION
A. Background.
The contract for the Connector Building at Defense Depot Richmond Virginia
(DDRV) was awarded in December 1989. This contract provided for a building tobp built which would connect buildings 11 and 14 in the bulk warehousing area
with buildings 60 and 59 in the bin warehousing area. The contract alsocalled for other common connections between existing buildings which whencombined with connections already in place resulted in the DDRV ConnectorBuilding Complex (CBC) (See Figure 1). The CBC at completion would consistof nine connected warehouse buildings and the Connector Building itself. Theoriginal design called for an Automated Guided Vehicle (AGV) system to be used
in the CBC to move pallet and module size loads throughout the complex. ThisAGV system would extend to every building in the complex utilizing 16,850 feet
of guidepath. The AGV system as well as other mechanization for the CBC was
under a separate contract. Requests for bids were to be released in June of
1991 and could be modified before then to accomodate any changes inrequirements. We briefed our results in May of 1991 to provide the necessary
information for modifications.
Currently, depot consolidation efforts are underway in the Defense Logistics
Agency (DLA). As a result of these efforts, the workload at DDRV is expected
to change. This change will probably be manifested in the overall volume ofworkload, as well as in the ratio of bin to bulk items processed. For this
reason, the Directorate of Supply Operations, Depot Operations Division, (DIA-
OWM), asked DLA Operations Research and Economic Analysis Management SupportOffice (DORO) to perform an analysis to determine whether the use of an ACV
system or the use of conventional material handling equipment is most cost
effective for the CBC.
B. Purpose. Determine the economic impact of implementing a full scale
AGV system or utilizing conventional equipment in regard to the changingrole of DDRV in the DLA Depot System.
C. Study Objectives.
i. Estimate the cost of moving material throughout the CBC using au
AFV ;ysten a;iid using conventoial equipment.
2. Cost each of the systems using several workload scenarios.
3. Cost each of the systems using present value analysis to project
and compare costs over a predetermined life cycle.
D. Scope. The study will be limited to material handling equipment forthe CBC that is related to the functions that would be performed by an AGV
system.

LC) (0DtoCD( m0~j
LO _
C) 0- 0 0
0)0
zz
-JO

II. CONCLUSIONS
The analysis yielded the following conclusion:
o An ACV system is not as cost effective as other material handling equipmentunder any foreseeable workload scenario.
III. RECOMMENDATIONS. Proceed with the use of conventional materialhandling equipment, such as transporters, forklifts and mule trains, in the
CBC, instead of an AGV system.
IV. SAVINGS AND BENEFITS
A. Savings. The discounted cost for an AGV system which would handlea baseline workload is $8.4 million over a 10-year life cycle. The cost ofusing the least costly combination of alternative equipment over the sameperiod is $2.2 million. The difference in discounted dollars is then $6.2million.
B. Benefits. The benefits of using one of the conventional equipmenttypes fall into two categories, flexibility and maintainability. Anvalternative which requires installation of a guidepath or in-floormechanization would configure the CBC to a particular operational plan.Changing this configuration at a later date to adapt to different requirementscould be difficult. The use of transporters, mule trains and forklifts doesnot disturb the useable floor space in the storage areas. Should the missionsfor these areas change, the areas could be re-configured without regard toproblems of moving guidepath or towline.
DDRV already has extensive experience maintaining the equipment in use there.Naturally, this experience has allowed them to become efficient in keepingthis equipment up and operating. Furthermore, there is no reason to think
that maintaining this equipment in the future will be any different than ithas been in the past.
Even under ideal circumstances, the implementation of a new type of equipmentis going to cause some maintenance problems. There will be learning curvesand training requirements. Additionally, equipment such as AGV systems tendto be maintenance intensive, needing expensive replacement parts aind specially
trained technicians.
V. METHODOLOGY
A. General Methodology. The basic approach for this analysis involvedcosting the AGV system as designed by Depot Operations Support Office (DOSO)and comparing that cost with the cost of available alternatives which wouldperform the same functions as the AGV system. This was accomplished using thefollowing five step process:
1. Review of the Design and Operation of the CBC. The CBC wasoriginally designed with an ACV system to move pallets and modules throughout
3

the complex. Aniy alternative equipment, therefore, would have to satisfy therequirements associated with the AGV system. In order to isolate the tasksperformed by the AGV system, DORO reviewed the design specifications withDlOSO and DDRV. We then developed flow charts to record pallet and modulemovements. These flow charts included the number of pallets and modules to hemoved trom each location as well as distances between locations. Ultimately,the distances from location to location were used to calculate travel timesfor the various types of equipment.
In reviewing the operation it became evident that the bin and bulk areas wereserviced by a contiguous ACV system. For all practical purposes the bin andhtlk areas are separate and distinct operations. The areas are located atopposite ends of the complex and have separate packing and receivingoperations. It was one of our initial proposals that bin and bulk beexamined as distinct areas particularly from the aspect of using different
alternatives in each one.
2. Establish Workload Levels. The number of pallet and modulemovements in the DOSO design of the AGV system are derived from a baselineworkload which approximates what DDRV is currently handling. One problem
that exists in estimating pallet and module loads is that the density of theIad [often varies. There is no way to convert a given number of itemsdirectLy to a module or pallet load. This fact is particularly evident in thehlin area. We were aware of the variation in module and pallet loads, and weilso knew that the workload at DDRV would change. In order to compensate forthese two conditions, we conducted the analysis using several workload levels.The different workload levels used were percentage increases and decreases tothe baseline workload for bin and bulk. These percentages and the associatednumber of modules and pallets are listed in Table 1.
3. Determine equipment alternatives and configurations. DDRV uses avariety of equipment to move material. This equipment includes transporters,mule trains, fork lifts and conveyors (both pallet and package conveyors).Since these types of equipment are already used successfully they were obviouscandidates for alternatives Lo an AGV system. Also considered as analternative was a towveyor system. Towveyers are not in use at DDRV, but arein use at- other DLA depots.
The final list of alternatives we presented to DLA-OWM was as follows:
AGVsT ranspor tersMule Trains
TowveyorsForklifts (Exclusively)C;onvevor-
The conveyor alternative consisted of powered pallet conveyors in the bulkarea and package conveyors in the bin area. These conveyors would be
i;tal led to hasimll y overlay the ACV guidepath. From the onset it waseidetit that t Ii alt nitit iv e would le far too costly. By mutual agreementwith PIA OWM a id D)OSt) the (:B( -wide conveyor system was dropped as an
4

Table 1
DAILY WORKLOADBIN AND BULK AREASDAILY WORKLOAD - BIN AREA
SCENARIO
30% 60% BASE 120%MODULE MOVES
RECEIVING TO STORAGE 30 60 100 120
STORAGE TO PACKING 18 36 60 72
PACKING TO LTL 20 41 68 82
TOTAL 68 137 228 274
DAILY WORKLOAD - BULK AREA
SCENARIO
75% BASE 125%PALLET MOVES
STORAGE TO PACKING 157 209 261
RECEIVING TO STORAGE 288 384 480
TOTAL 445 593 741

alternative. Some additional explanation is required regarding the forkliftaltorniative. Forklifts are required to some extent with several of the otheralternatives. For example, if mule trains are being used as the primary
method to move pallets and modules, forklifts are required to unload the muletrains at the packing induction points. When the cost estimates were done forthe mule train alternative the total cost included the required forklift andforklift operator. The forklift alternative involves using forkliftseIxctsive of any other equipment to replace an AGV system.
*. Cost the Equipment and Personnel. The cost of the AGV was
dev'.eloped by DOSO. This cost was based on current industry data forCIII,,irable systems, and itemized by all major components. Because the costs
,,cii iteml,,,ed, It was possible to configure and cost an AGV system for eachworlk load scenario considered.
lI, c,iventional material handling equipment used in this analysis is alreadyin use at DDRV. The purchase price and maintenance costs for this equipmentweire readily available.
[lie persnnel costs were computed using the current pay scale for wage gradept-qounel at DDRV. In addition to the basic hourly wage rate, factors were
al-;, added to account for leave and benefits. This will be discussed infurt-her detail in the following sections.
5. Perform a present value analysis over a 10-year life cycle. AlO-vear life cycle was chosen as a reasonable analysis period based on the fact
tlhat the equipment involved has an approximate life span of 10 years. Present
valu, factors were applied to the costs for all alternatives in the samemariner. All of the equipment involved in the analysis was for the most parthomogeneous in type. Therefore, it was unlikely that inflation would have asigiifigantly different effect on any one type. The labor costs for thetni ile anialysis involved the wage grade labor force at DDRV.
VI. ANALYSIS
A. Operational Procedures for the AGV System and Alternate _Equipment.
1. AGV. The AGV system was designed to operate throughout the CBC.
The guidepath of the AGV system would extend to every building. Additionally,each building in the bin and bulk areas would have many pick-up and depositstands (P & D stands) . The P & D stands would be located as follows:
In the bin area:
Buiildings 59 and 66--along the West Wall.
Puildings 60 and (") -fl1ong the East. Wall.
In the bulk area:
Building 1--a 1otig the Wes;t Wall
lBildingg 10--along the East WallB',ilding 11--along the West Wall
6

Building 14--along the East Wall
Building 15--along the West Wall
There would also be P & D stands, as well as induction and discharge conveyor
interfaces located throughout LTL packing and receiving. These provisions
enable the AGV system to perform any point to point movement of pallets or
modules almost anywhere in the CBC.
2. Alternative Equipment. In order to make comparisons between the
proposed AGV system and alternative types of equipment, it was first necessary
to design operational procedures for the alternate types of equipment. These
operational procedures would ensure that the alternative equipment would in
fact be capable of fulfilling the functions of the AGV system.
a. Towveyor.
A towveyor is a conveyance system which consists of a vehicle that is pulled
by a mechanism installed along a path in the floor. The mechanism in the
floor is generally a series of sprockets and chains which are driven by
electric motors. The vehicle itself has no propulsion system, only a lever or
rod which can be set to direct it into particular spurs off of the main path.
Towveyor vehicles will follow a path similiar in layout to the AGV guidepath.
The vehicles will be staged on spurs in the same general locations as the AGV
P & D stands throughout the bin and bulk areas.
In the bin area stock pickers will place modules on the towveyor vehicle and
activate it. The vehicle will transport the module to the iinduction conveyor
in bin packing. The vehicle would then pick up an empty module and return it
to one of the spurs in the bin area. Towveyer vehicles would also transport
modules from bin receiving to the staging spurs in the bin area, where stock
pickers will remove tne modules and store the items.
In the bulk area stock pickers will place pallets on towveyor vehicles and
activate the vehicle. The vehicle will transport the pallet to the induction
point at the pallet conveyor in Section A of CBC. Pallets front LTL recciving
will be trarsported by pallet conveyor to Section A where a towveyor vehicle
will pick up the p-llet and transport it to a spur in the bulk area. Once in
the bulk area a stock picker will remove the pallet and store it.
The towveyor system would operate for the most part automaticaillv in regard totraveling. It may be necessary to have operators activate and direct vehicle's
coming from the receiving areas.
h. Tranjsport-ers.
A transport -.r is a single axle flatbed truck that has powered rollers across
t(-te entire bed. This truck works in conjunction with a special roller dock.
7

A transporter can load and unload modules or pallets from these docks at therate of ten at a timL'. Transporters currently operate throughout DDRV onestablished routes. Inbound and outbound transporter docks are already inplace in the existing buildings.
In the bin areas stock pickers will place modules on outbound docks. When adock is full a transporter will be dispatched to remove the modules and takethem to a transporter dock in bin packing. In the bin packing area a fork
lift will unload modules from the inbound dock and place them on an inductionconveyor. In bin receiving, a forklift will place modules on an outbound dockand a transporter will take the modules to an inbound dock in the bin storage
area. Stock pickers will then remove the modules from the dock for storage.
In the bulk storage areas stock pickers will stage pallets on outboundtransporter docks. Pallets can also be staged in staging areas inside thebuilding immediately behind the docks. When the outbound docks become full, atransporter is dispatched tc pick up the pallets and deliver them to less than
truck load (LTL) packing. In LTL packing the inbound docks are designed tointerface with the pallet induction conveyors. The flow of pallets from theinbound transporter docks to LTL packing would be essentially continuous. InL.TI. receiving the dock and conveyor system would be basically the same, sothit pallets could flow directly from the receiving area to the outbounddocks. A transporter would then take the pallets from an outbound dock in thebulk storage area. In the bulk storage area stock pickers will remove thepallets from the dock and place them into storage.
c. Mule Trains.
A mule train is a series of carts which are towed one behind the other by asmall tractor called a tug. They can operate inside or outside the warehousebuildings. Mule trains are currently in use at DDRV.
In the bin area empty mule train carts will be staged in locations similiar tothe AGV P & D stands. Stock pickers will place modules on the carts and tugswill cycle through the area and tow the carts to the bin packing area. In bin
packing a forklift will offload modules from the carts onto the inductionconveyor. In bin receiving modules will be placed on mule train carts byforklift and a tug will tow the carts back to the staging area in bin storage,where stock pickers will remove the modules and store the items.
d. Forklifts.
ForkLifts are currently used extensively at DDRV. Forklifts could be usedextensively throughout the CBC as the sole means of conveying modules andpallets. In the bin storage area stock pickers will stage modules on thefloor in location,; similiar to the P & D stands. In the bulk area, the sameprocedure would be followed. Forklifts would then retrieve staged pallets and
modules from the floor areas and transport them to the proper induction point.The forklifts would also transport the pallets and modules from the LTL andbin receiving areis to the floor staging areas in bin and bulk storage.
8

B. Equipment Capabilities and System Requirements.
The next phase of the analysis involved integrating the capabilities of eachequipment type with the actual system requirements. These system requirements
.- are dependent on two basic factors, the distances the equipment will travel
and the workload levels. The operational procedures provided a fundamental
framework for the routes that vehicles would have to travel. From theseroutes we calculated round trip distances for modules and pallet movements.Figure 2 is a diagram of the CBC annotated with the lengths of the main
sections.
The essential component in evaluating the capabilities of each alternativetype was the individual equipment characteristics. These characteristicsconsist of speed, capacity and specific travel distances. Speed refers to theaverage speed in miles per hour at which vehicles travel. Capacity refers tothe number of modules or pallets that the equipment will handle as a singleload. Specific travel distances refer to the exact route a particular type ofequipment would use. These routes may vary because of the varying nature ofthe equipment. For example, a transporter travels on the road system outsideand around the CBC, traveling exterior to the building adds distance to thetransporter routes. A mule train can travel through the interior of the CBC,this reduces the travel distance over an exterior route. The mule train.however, has restrictions even other interior vehicles do not have. A muletrain requires wide aisles and open floor space to turn around. It is verylikely that a mule train would have to travel some distance past the intendedpick-up point in order to find a suitable place to turn around and begin thereturn trip. Other interior vehicles such as a forklift can turn and maneuverin much less space, shortening their travel distances. The AGV and towveyorvehicles follow a predetermined guidepath that is usually in the form of alarge loop. This loop is often not a direct route and lengthens the travel
distances.
Because of the many differences in equipment capabilities, each type ofequipment was evaluated separately. A summary of the characteristics of allthe alternative equipment is shown in Table 2.
Maximum distance to travel and maximum travel time refer to the longest roundtrip cycle a vehicle travels. The data for the equipment wa,: obtained byfd, rv Ili ,Ill, I iII I I I h c4im lJ l(II t cur r .im t I y 111 Av;v at DI)IPV. I l 4.41l& p ilt. ltnot. current.ly in use at DDRV, specifically the towveyor anid tl A;V, induistr-standard data was used.
9

1 1 ) CL(0 (D
LL
0 0
C) cm U ~
00 .0
(0 LO
z0
co
cr'
0wz
0 [IC)

Table 2
EQUIPMENT CHARACTERISTICS
AGVSpeed-l./6 MPHCapacity-I module or I pallet
Bin AreaMaximum distance to travel -5,000 feetMaximum travel time -32 minutes
Bulk AreaMaximum distance to travel -3,500 feetMaximum travel time -23 minutes
TOWV EYORSpeed-20 MPHCapacity-i module or I pallet
Bin AreaMaximum distance to travel -5,000 feetMaximum travel time -32 minutes
Bulk AreaMaximum distance to travel -3,500 feetMaximum travel time -23 minutes
TRANSPORTERSpeed-20 MPHCapacity-lO modules or 10 palletsLoad and unload time-i minute
Bin AreaMaximum distance to travel -10,000 feetMaximum travel time -6 minutes
Bulk AreaMax:itm. distaticr to L riv, 1 -15,000 feetMaximum travel time -9 minutes
MULE TRAINSpeed-5 MPHCapacity- I module or 1 pallet
Bin AreaMaximum Distance to travel -4,500 feetMaximum travel time -11 minutes
Bulk AreaMaximum distance to travel -3,300 feetMaximum travel time -8 minutes
i1

It is important to note certain aspects of the data. The speeds for thetransporters, mule trains and lift trucks represent average speeds and aremomewhat conservative. The speeds for the AGV and towveyor are more preciseas those systems can be set to operate at an exact and constant speed. Thereare time factors associated with the transporter and the mule train thatinvolve the acquisition and discharge of the load. For the transporter thisis the load and unload time or the time it takes to roll pallets or modulesfrom the dock to the transporter and vice versa. For a mule train this is thetime required to attach and detach the cart from the tug. With the otherforms of equipment, the transfer times are not as distinct of an operation and
their transfer times are factored into the overall travel time. As anexample, a forklift delivering a pallet deposits that pallet in almost asimultaneous action without stopping to turn around. In any case, we havei,,cluded all the time elements required for the equipment to complete itsfnction, either as a discrete time element or part of a continuous travelt im' periocl.
C. Performance Throughput. Based on the capabilities and operationalprocedures for the alternative equipment, it was possible to model theperformance of each type of equipment. Each type was evaluated on the basisof throughput for a single 8-hour shift. This throughput was then compared totlk -arious workload levels required in an 8-hour shift.
1. AGV System. The AGV system was evaluated using a computersimulation model written in the SLAM language. The AGV system was the onlyalternative evaluated in this way. The reason for this was twofold. The AGVsystem is a dynamic system which continuously readjusts itself to make theoptimum use of all its vehicles. The other equipment follows set routes andschedules. Also, every individual ACV vehicle is very expensive. It was veryimportant to define exactly how many vehicles were required for each workloadscenario. So, where mule trains, transporters and forklifts could beeva uated on a component by component basis, the AGV system had to beevaluated as a whole, taking into consideration the synergistic effects of allvehicles working together. The simulation of the AGV system was designedusing; 8 full hours per shift and using the number of vehicles as an inputvariable. Several iterations of the model were run using different workloadsand varying the total number of vehicles within the same workload framework.We reviewed the results of the model runs and identified the least number ofvehicles which could handle a given workload.
2. Towveyors. The towveyor system operates similiar to theACV system. However, there are two major differences. The towveyor cartsare not dynamically allocated; rather they are set in motion to a particulardestination, arid must complete a round-trip cycle before they can be re-assigned. The other difference is that the carts are relatively inexpensive,
so that increasing the number of carts does not signifigantly increase cost.Becauuse of these differences the towveyor system could be evaluated using amathematical model. The main output variable to the model was, as with theAGV system, the number of vehicles or carts. The towvevor system was modeledwith all of the workload scenarios and generally required more carts as theworkload increasced. The towveyor also requires two operators to activate the
12

carts and send them to their destination. The towveyor system like the AGVsystem was modeled to operate 8 hours in a shift.
3. Transporters, Mule Trains and Forklifts. Transporters,mule trains and forklifts do not operate as a unified system in the same waythat an AGV system or a towveyor system does. For this reason it was onlynecessary to model a single unit of equipment from each of the types. Thiswas done using a simple mathematical model. Once the performance capabilitiesof one unit were identified, it was a simple matter of calculating what two ormore units would do. In this way, the equipment could be matched rathereasily to the workload requirements.
Transporters, mule trains and forklifts have to be manned by operators at alltimes. It was therefore necessary to apply Personal, Fatigue and Delay (P.F.
and D) factors to the 8-hour shift time. The P.F. and D. factor used was 12.6percent. This figure represents a conservative approach to estimating
productive time as it is at the high end of factors used for standards withdepot operations. Reducing the 8-hour shift by 12.6 percent yielded slightlyless than 7 hours of productive time per shift, This i-hour time, and thethroughput capacity of each type of equipment were input into the models. Theresults are summarized in Table 3.
VII. COST ANALYSIS
A. General.
Using the previously developed data we projected three cost configurationsover a 10-year life cycle. These cost configurations covered the baselineworkload scenario, the low workload scenario, and the high workload scenario.The baseline workload scenario consisted of the baseline workloads for boththe bin and bulk areas. The low workload scenario consisted of the 30 percent
of baseline workload for the bin area and the 75 percent of baseline workloadfor the bulk area. The high workload scenario consisted of the 120 percentworkload for the bin area and the 125 percent workload for the bulk area.
The project ion included all costs for systems, vehicles maintenance aiwdpersonnel. The personnel costs are based on the current wage grade pay scaIcfor DDRV and include an 18 percent factor for leave and a 29.')5 peru ,ir factorfor bunefits. The mid-range of each pay grade was used as the hourly wage.The annual maintenance cost for the AGV system was 11 percent of the purchase
price. The factor for all other equipment was I percent annually. The AGV issomewhat higher due to the higher costs for parts.
Several of the alternative types of equipment are already in place at DDRV,but for the purpose of this analysis all equipment required for everyalternative was purchased as new. The cost factors for each alternative areshown in Table 4.
13

Table 3
PALLET AND MODULE MOVEMENT CAPABILITIES
Transporters (per vehicle)Bin area-410 modules per shiftBulk area-370 pallets per shift
Mule Trains (per tug with 4 carts)Bin Area-160 modules per shiftBulk Area-160 pallets per shift
[- ki ik I J f t-s (pvr vehicle)I~in Ai,. (9 modilIs per shiftBulk Area-59 pallets per shift
Vehicles required for each workload scenario.
Bin Area Workload
30 Percent 60 Percent Baseline 120 Percent
Transporters 1 1 1 1Mule Trains 1 1 2 2Forklifts 2 3 4 4
Bulk Area75 Percent Baseline 125 Percent
Transporters 2 2 2Mule Trains 3 4 5Fork] it ts 8 10 13
Table 4
COST FACTORS
System Vehicle (each)
AGV $2,961,190 $64,110
Towvey r $2,244,420 $1,500
Transporter $368,000 $110,000
Mulf Trains $0 $15,000
Forklift $0 $24,000
14

The system cost for the AGV system includes the computer hardware and softarewhich control the system, the guidepath and the battery charging equipment.
The system cost for the towveyor includes the motors, the towline and thespurs. The transporter alternative does not have a system cost as such;however, a cost factor has been included here to insure that all docks will be
in proper working order and to cover the cost of new modules for the bin a -awhich would be required if transporters are used. Mule trains and forklifts
have no system cost. The total cost for a 10-year life cycle for the low,baseline and high workload scenarios is shown in Table 5 in undiscounted arndiscounted dollars. Figure 3 is a graphical representation of this data.
Table 5
TOTAL COST 10-YEAR LIFE CYCLE
Low Workload Scenario Discounted Undiscounted
AGV 7,337,148 9,345,708
Towveyer 5,321,178 6,570,491Transporter 2,170,600 3,020,808Mule Train 1,837,931 2,734,589Forklift 2,404,337 3,614,771
Baseline Workload Scenario Discounted Undiscounted
AGV 8,403,336 10,692,020
Towveyer 5,553,897 6,918,561Transporter 2,411,034 3,382,286
Mule Train 2,856,246 4,257,377Forklift 3,366,072 5,060,679
High Workload Scenario Discounted Undiscounted
AGV 8,936,430 11,365,170Towveyer 5,591,838 6,964,461Transporter 2,411,034 3,382,286
Mule Train 3,124,197 4,656,359Forklift 4,087,373 6,145,110
15

Figure 3
TOTAL COST/10-YEAR LIFE CYCLEHIGH WORKLOAD LEVEL
DOLLARS (MiliIon.O
10
4.
12
AOV TOWVEYOR TRANSPORTER MULE TRAIN FORKLIFT
BSLW E WORKLOAD LEVEL
12DOLLARS _(Miliogns)
12
10E
AGV TOWVEVOR TRANSPORTER MULE TRAIN FORKLIFT
LOW WRKLOA LEVE

Two significant things are evident from the graphs. The first is that thecost of each alternative increases and decreases as the workload level
increases and decreases. The second is that the AGV system is not costeffective at any oF these levels.
The reason that the AGV is so costly is twofold. The initial cost for thesystem is very high and the individual vehicle cost is very high. It is truethat there are not any direct labor costs involved with the operation of anAGV system, but the savings in labor is not sufficient to offset the other
high costs.
Figure 4 is a line graph showing the cumulative discounted costs for all the
alternatives under a baseline workload scenario. This graph shows that eventhough the slope of the lines is similiar, the high initial costs are thepredominant factor.
B. Least Cost Alternatives.
The initial cost comparisons in this analysis viewed each alternative as asingle system to be used throughout the CBC. The bin and bulk areas serve as
natural divisions within the CBC. In order to identify a least costalternative for bin and bulk it was necessary to isolate these areas andexamine the differences in each. To some extent the equipment that is anintegral part of the bin and bulk operations dictated the least costalternatives. As an example, in bin packing there is no established linkbetween the dock area and induction conveyors. If a transporter were used inthis area, some other type of equipment would still be required to movemodules from the dock to the induction point. The degree to which equipmentinterfaced became an important factor in identifying the least costalternative. The bin and bulk areas have some similarities but have enoughdifferences to require different equipment. The manner in which the
proprietary equipment in bin and bulk interfaced with the alternativeequipment ultimately dictated the least cost equipment for that area.
Figure 5 illustrates the cost of the alternative equipment, tor bin and bulk,for a 10-year life cycle under the baseline workload scenario. The least costalternatives are forklifts in the bin area and transporters in the bulk area.The total cost of the combination of these two alternatives is shown in Table6, as well as the difference in cost between the least cost alternative
combination and the AGV system. The difference in discounted dollars of usingthe least cost combination verses the AGV system is $6.2 million. Thisdifference would vary under different workload scenarios.
Also, the least cost alternative equipment would vary for different workloadscenarios in the bin area. The transporter alternative remains the least- costalternative in the bulk area under all workload scenarios as its degree ofefficiency in that area is far superior to the other alternatives. In the binarea, the difference in the alternatives is not that pronounced awPong the
forklifts, mule trains and transporters. An exhaustive look at all possiblecombinations is not appropriate for this study. In any case, the alternativs
presented as least cost are for cost comparison purposes and not intended Io
17

,)
Sz I
LUc H; ccw CCzI--
0
Lu (f) LO
C~J
M- W L q

be specific operational recommiendations. It is important to note that withthe costs shown in Figure 5 for the ACV system the towveyor system in bin andbulk add up to a cost which is greater than the cost previously shown for thetotal systm. This is because the AGV and the towveyor system have high fixedcosts which are not proportionally reduced by reducing the size of the system.Tht: other alternative equipment can be reduced in somewhat of a constantratio.
C. Additional Alternative.
When we briefed our findings to DDRV, they requested that we consider oneadditional alternative. DDRV expressed reservations about operating the binarea with muwle trains, transporters or forklifts. Their recommendation was touse a package conveyor and a module tug system in the bin area. As previouslydiscussed in the analysis, a conveyor system which traversed the entire CBCwas absolutely cost prohibitive. However, the DDRV recommendation was for -very limited, basic conveyor system in the bin area, that would operate in onedirection orly. This conveyor would carry the picked bin items to binpacking. ltcms from bin receiving would be brought to the bin storage area inmodules towed by a special module tug. DDRV felt that this alternative wasoperationally the most efficient and safe.
DOSO completed a basic design for the requested alternative in June 1991 Thecost for implementing the package conve,or alternative over a 10-year lifecycle for the baseline workload is $1.3 million in discounted dollars. Thiswould be approximatley $300,000 more over 10-years than the forkliftalternative. A comparison of this cost is shown on the graph in Figure 6.A comparison of the cost of the combination of the transporters in the bulkarea/package conveyor in the bin area, and the other alternatives, is shown i~iFigure 7.
19

Figure 5
TOTAL COST/10-YEAR LIFE CYCLEBIN AREA -BASELINE WORKLOAD
DOLLARS (Millions)
10 --
AGV TOWVEVOR TRANSPORTER MULE TRAIN FORKLIFT
BULK AREA -BASELINE WORKLOAD
DOLLARS (Millions)10
8,
6
4I
2 __
0AGV TOWVEVOR TRANSPORTER MULE TRAIN FORKLIFT
DISCOUNTED 7.UNDISCOUINTED
20

Table 6
LEAST COST COMBINATION10-YEAR LIFE CYCLE
COST COSTUNDISCOUNTED DISCOUNTED
BIN AREA - FORKLIFTS 1,445,908 961,735
BULK AREA - TRANSPORTERS 1,723,301 1,225,318
TOTAL 3,169,209 2,187,053
LEAST COST COMBINATION VERSES AGVs
COST COST
UNDISCOUNTED DISCOUNTED
AGVs 10,692,018 8,403,336
LEAST COST ALTERNATIVE 3,169,209 2,187,053
DIFFERENCE 7,522,809 6,216,283
21

L 0
J 0 I LL0
cE~ 0LZ
0
0 Z 0 0
U)U
i-r a.
.j 0
l<
Z
co coc~j>

U)c
1E Cow
WC/) - cr Clo Z
H- U) r *
uiW Z Uo
cc ~ - < <0 Z
00
H I K
z LI
Ocn
<C.') 09 ~C6 c ~ ~
23

APPENDIX A
Figure A-I, A-2 and A-3 provide the annual cost ainounts for the 10-year lifecycle for each major cost element within the different alternatives. Thesefigures represent the baseline, high and low workload scenarios respectively.Figures A-4, A-5 and A-6 show the annual cost totals and cummulative costs foreach alternative under the same scenarios in both discounted and undiscounteddollars.
A-I

Figure A-i
..... .... ............................ ........................ ............. ....................... --. ..........
fEA I fEAR 1EAR I (EAR * 1EA 5 EA39 6 YEAR 7 fEAR 0 YEAR 9 YEA IT TOTAL
UiL[ENTS
276II~7201II3&3,,ST 0
4,110
9JIRE0 .E"ICLES 3 1 2330 192'!00'A:5'4353 33S7 , 2.1 , 577294 57727 57294 5372,4 53'794 53 7294 579 9 537294 537294 57774 537239
YAN'1N*%'4 10ii704.. I 4145Q 4347 43459 43439 43459 4345 413459 43459 431459 A4;4-7 4 14175 7 ;,1 L MUL It:
N J,
i>F-47
[ CC;'C
7,3T5 IST t4',370,300 3*7000 227200
: R:CARTS lit
A3167043*0 :CST .17 247355 ^,7555 :4715 247555 24'555 24755' -47555 24755 "4755! 2 ' 5 24755
309i 0.- W9 3 3 1 7'6!3 1 r ;b! 0& 9,)651 961 ;0651 "651 90651 91651 ,i 7>651:3;a0Ei, PATE 'k749 4'
z '0 33573 F
;C) r5 I 4049,.60 lOtOOC .,6,",
C01 MT COST :4430 49pr>:F0,,I40 tRANSFC;TFV";.9Ul;Eo FOIIl
Co!NT SNCE ,,ST ,.,: 52C20 5.22" 52220 52220 52220 522^3 5220 52220 52220 727, 2
1p'%<.' '' : !1'' [1''9 11352; 1iI7,C 1353 19 !5I 11"31 1),3529 1'571 i71'17-1,
5 ,AT-'At4 -1744 794 374 3 744 3394 7744 33744 1344 '44 379
9,432 II'S 941'> 64M3 41*35 69125 615 75 6413$5 63135 W3; I 447>
13,382,?Ic
EJUIPMEN 73'SS
:J2 3o75 15.100 90000 9c07c'4;T T23' ?,l110 15181(73pt i:r COST 424. -1 > i2,r7)O
R0iu;REC CAP'S 'E1uI;[O F2'IFTS 5"41!TN44NCE COST 3,'?7 253 6 253z6 25326 25376 25326 25!26 25326 25326 25326 23-17 53
T:x 3E QArT 4:7. 3 3 2703 203893 20393 207g99 2 0993 i393 (189 373 M ' 75 "9'
"ER4> 70 I Iq10 9cr4r43 ATE5 77
3',b"r ._07 035' 4.1,:3 '> 7 336' 1
Cf4UIQEC FO kLIF S 14
IE I I II379 I
4AM 3351F 'IS 77 21S;> 23921 25212 3 21520 20523 2'529 27510 2330 2 35h
r;1'L" 79594771' ' 449349 448949 l4499 449949 440990 449949 40484 449949 444949 449940 449,479
15,0;0,679
A-)'

Figure A-2
^LOS XS : N(:AP 1 YER 2 E4 3 EA5 4 906 5 tEAR 6 6 17 2 E5 6 'A; 4 5995. 10 .I.
OILER SLEMETOS
2?617
E P!.,E 4 1 I .96;ul'E: .0',:LE ~ 35 2495MAWE5NW4; £301 C1i 9i7554 5-'354 5-2554 572554 57:554 572!54 572554 50 4 5',5t4 53, 554 5733333
PER3996L C17S03
VEHICLsE CEE41?2S I
MAINTENANCE ERSONNE9L: 1 4345? 43459 43459 43459 43459 43459 43459 4i451 43459 4;45; 4,7459qGRADEIPAY PATE .4 11 2
$1l,365,/
" t:[ ;43N3 :O9:;
18~r 331 11,5 193500RE3UIRE: 4 :S 125
N'EN0'< 0,07 245443 74q44, 249445 249445 249445 147445 240445 74c445 243W 241445 7494i '
QER3NNEL 127'
016E; OFE1Th, 1451 90651 90631 90651 90651 6l053 9 qWj 5 0651 60s5 3,6 9 51
,,4|.Sr4,|E :
947799 % 33'13568,'00 : 368000 68'S''9-NEP9'9 lOST 111,01O3 330000 ' CoJO ,IFT -VIT 824,00') 48000 hEQIJ9ED 1ANF;0R!ER!. 3RE0U!R£9 :-y-r'sAINTENAN:i :7 l,0: 52220 52220 52220 52220 52220 51220 52220 52220 52220 1227 7.
"MNENEL CO9S"
'90SPOR939 303TO: 3: I13529 113529 113529 113529 113529 13529 i3529 11352 11,529 33T 1135:44ISPATC4 ' 9 3744 33741 63744 33744 33744 !3744 33744 33744 3-44 33144 . 334-
6P40EFF, W E GS6
F08VL3F' 3F01AOP 2 64135 64135 54135 64135 64135 64135 64135 64135 64135 64156RAD9'0f PATE !065/10.05
S$T4M CB1 0
TJG COST 115,r% 1611100 .;f Pf rl P 1 l3 I I1 10009U114 12 ^, O'
R0;bIRED iREWUIRED C .T, 156REIIPEO Fuls; :
MAINTENANCE (ST 0.07 27762 27762 27762 27762 27762 27762 27762 27762 27762 2776' '76
44RSONNEL los's
TUG 0PEP3FS 7 23819 237875 237875 237875 237975 237875 237875 23'875 237875 237075 ?'''9545R4O/FAv RTE :46u10.65FORKLIFT 0PERATOR 5 1603319 160339 160339 160339 160339 160339 160339 !61239 16139 I0TXC !602:R5
(6u:: 46kF W;
SY'STEM C,5T 0C5O'LIFT 33T 124,0{0 I90:,I 4'S"REuIREo ;jpQ33 S I"MAINTN ( (3,3 0.07 ' 28560 29560 29560 28560 29560 29560 28560 25560 28560 71565 . P~t~
r
FO;'933 , 93 ,RS 17 545151 545151 54151 545151 545151 54515 S45151 5453!3 145151 545151 515!1
99685 Pov R63 465/10.05
A6-315,31
A- 3
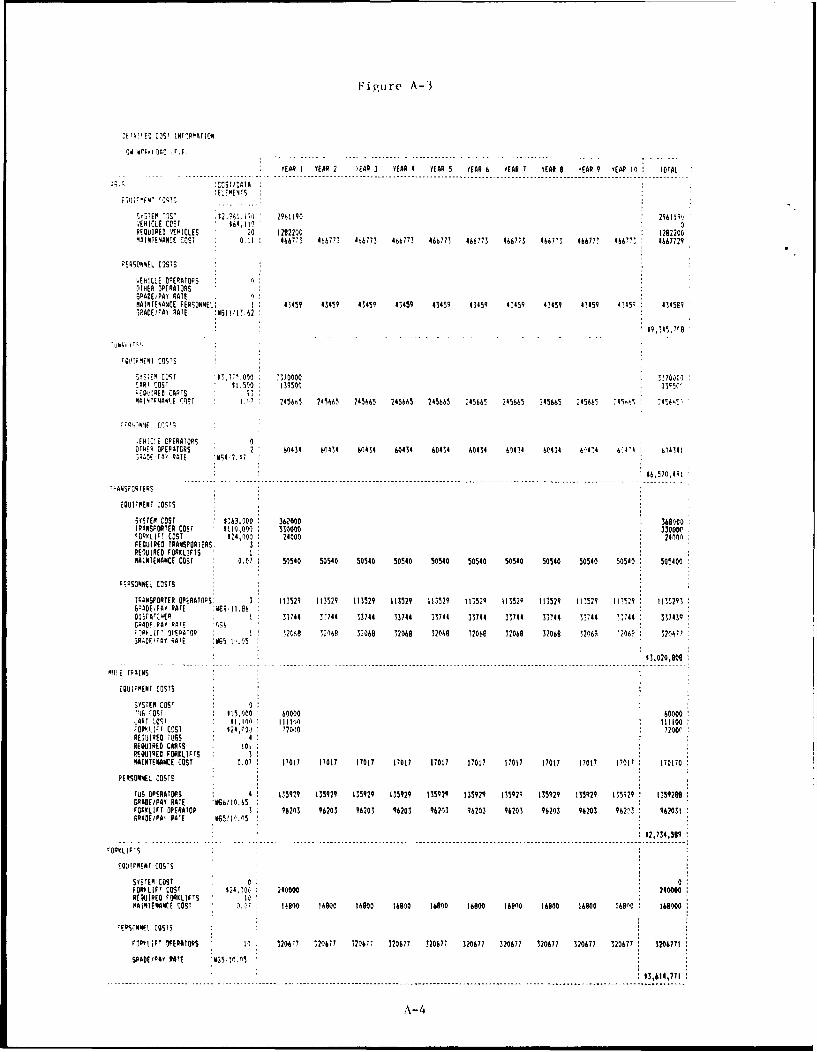
Figure A-3
:YSi'TO C3S INF'RMOTIO i
YEAR I YEAR 2 iEAR 3 YEAR 4 YEAR 5 YEAR 6 YEAR 7 YER 9 Ar 9 VEA 10 TOTAL
. :COST/OEA
SISTEP '%S' !12.;1,179 2961190 29611''','EHICLE COST 14," 0REQUIRED VEHICLES 20 1292200 1292200MAINTEHANCE COST 0.11 466773 4667' 466773 466773 466773 466773 466773 46773 466713 4667': 4667729
'ERSONNEL COSTS
EHICLE OPERATOPSOTHER OPERATORSGPACEPAY RATEMAINTENANCE FERSON4EL; 1 43459 43459 40459 43459 43459 43459 41459 43459 43459 4345c 43459SRA0E/rAY RATE 116111'.62
sITTEm COIST 'ITO '.000 '7370000 i00(CARI COST 11,500 139590 135'LEQ111REO CARTSMATft4441.0 rST 3/,7 245665 245065 245665 245665 24565 74566' 745665 245665 21505 :494 5
•EHIClE OPERATORS 0OTHER OFEPATCRS 2 60434 60434 60494 60434 60434 60434 00414 60434 6'414 64'4 614341STAOE TA' RATE '454 -'4
16,570,4R1
EgUIFMEWT COSTS
SYSTE COST 5303,300 3000 360000TRANSPORTER COST I517),000 330000 33000CtOUYLIFT COST 124,000 24000 24000FECUIREO TRANSPORTERS: 3RESIREO FORKLIFTS IMAINTENANCE COST 0.07 50540 50540 50540 50S40 50540 50540 50540 50540 50540 50540 505400
;CPSONREL COSTS
TRONSPORTCR OPERATORS. 3 113529 113529 H3529 113529 113529 113529 113529 113529 11,529 117529 11,12930A0OEDCrA RATE 4q,11.86DISFiR:H 1 33744 3-746 33744 33744 33744 33744 33744 33744 33744 73744 337439GpAo PAY PAT! 5AY'[A4(F' 3iEPATOR 1 !208 32009 30608 32068 32009 32060 3 206 32669 3206R '206 320077;RTOPFIY qATE V.5 1,.05
t3,020,909
MR E TRAIS
EQUIPPENT COSTS
SYSTE COST 2r'I COS 115.000 60000 60000LAT 'FO I llAo 111100POR6.101 COST 771,4 [ 2070 T2OOrREUIRED ToSRE WIREO CARIS lobROQUIREO FORKLIFTS 3MAINTENANCE COST 0.07 T70T 1017 17017 11017 17017 7017 17017 1717 1717 170t7 170170
PERSONNEL COSTS
TUB OPERATORS 4 1 0599 135929 35929 135929 135929 135929 135929 135929 135?99 135929 1359299,RA9EYPAY RATE :1066/10.65F09VLIFT OPERATOR 0 96203 96203 96203 90203 96203 96203 96203 923 90201 962n3 962031RA9EIPA' gA'E 4657" ,05n
12,734599
Egil"EMT COSTS
SYSTEM COST 0 0FORALIfT COST I24,3O,) 240000 24000HEQWIRED Fr)RLIFS 0 iMAINTENANCE COST l. tq090 1600 16900 16960 16000 16800 16900 16900 160900 96enO 16000
'Ev57IFnt COSTS
F~l '0iF 3 OERATOR 1. 320677 320677 92017 320677 320677 32077 324677 320677 320677 320677 3206771
SPREIPAY RATE RGS, 0).5
$3,614,771
A-4

Figure A-4
E hRk LA[
.... . J3:3jNT{. ,EA ,EAR 2 YEAR 3 YEAR 4 YEAR 5 YEAR YEaR 7 YEAR 9 YEAR 9 EAR 10 TOTAL
5465,43 52.. 5! 180753 56153 580753 5%75' 560157 580153 580753 SB , -3 lt9,R Al
874Er30 7A74 7'6 826 , A2b 332206 13220 32o 7!ob 3362,16 38216 '39206 3326 I956I
I 761Q 2i>b i3629 266:9 236:9 26'29 '63629 2C625 26629 26 37622%
73.75F :8"5e 39556 3955B ;r 5H 19955P 309'58 389'5 :q;55e :89558 4:5737"
61 8470 4746; 4:2468 472460 47216e 4,2466 4'2466 47,46? 472468 47:4tB 501679
.C7- E; I3AR •:3:3 TED VEAR YEA; 2 'EAR 3 YEAR 4 YEA4 5 'EAR 6 YEAR 7 YE~P 9 'ERR 9 YEAR I TOTAL
A3, 5213e42 503513 45763! 416400 37607 3 4":6 312445 263969 256435 2'!25 94)330
,696W, 1937"1 166506 242494 220172 200218 181955 165383 15)502 1073 355'907
96P1ES '3566 D,7119 189022 171622 z56066 141632 128714 17315 106"7 24117)74
i TRAINS 7375 7"7747 30971 27931 25"6 i 2 2O6 7 33K502 17494 ;353 15?771 ?956:
Fc 7TIS 77127 4096:r) 372305 33875 30757 1797(1 154196 2313" 710248 119149 7766MV2
.'PIUtAIIVE ^333 -NOISCOUNTrO YEAR 1 YEAR 2 YEAR 3 YEAR 4 YEAR 3 YEAR 6 YEAR 7 YE 0 'EAR 9 '39P i0
Aj,3 546-4! 6045Q96 66204e 7207501 77B2254 836W137 S949760 Q5335)3 13:1265 116970h
.a'4706 4:12912 4551118 4809314 5227530 '55737 5901943 624214q t580355 69125c:
70.2'. [.;IF: 2,93629 1273:57 15;6886 1600514 206414! 2377' :591400 :3553C2 9 11651 3'R:293
"ANS 7175; 1140915 15'0473 19210'1 2?09529 269914t 38'1)4
'47826? :267819 4"5-'7
P9468 1346 2P 6 1753404 22251872 2608339 317,6e7 '643275 4115743 456311 506lt7q
9'-',4T!JE 330'^
D6N7E: YEAR I 1EAR 2 YEAR 3 YEAR 4 YEAR 5 YEAR 6 YEAR 7 YEAR a YEAR 9 ,EAR 10
!113842 5717354 6174788 6591387 690457 7313267 625736 770Q0q6 916912 943733
.74.-Ps 1696470 39894 4256291 4498694 4718867 4919085 5101041 5266422 74!6924 55519'
-6319 :191752 !399491 1596513 1760115 116203 250035 279619 -'4264 2411:4
*N77 5 !154542 1361513 1640826 !P9442 125046 2334628 293572 2B475 R%26
['IS 77129 :97O'2 15513213 19;19'2 2199549 3479250 2731411 29474 I 4724 ;346'>
A-5

I"i.p-tire A-5
170 .r , ]%21E!2411E0 4AR I YEAR 2 AR 3 YEAR 4 VEAR 5 fFAR 6 Y(R 7 YEAR e Y(R 7 EAR 10 IOAI
'021CS' 61601 ! 61601 1516013 616013 01601! 616013 61601I 6160f1 616013 11 '517]
w 1 34101b 7420 94000 !146096 341)0)6 M4 140096 30'091. ;4076 A 7044f.I
.1 0".272IW .W29 '6'62 0:922070 9 1,9 '069 'Vq0
42 15-':6 4,5976 4259;6 425116 420076 1'59;k 49776 925974 112S116 4,7619
; l~ l '' 11 i1 57;'i11 517 11 I '! ;Ii !:1111 0 1;It 571,11 1 'V11 01 1' if
f 4 1m ;r I AP 2 YR 004 f[R ', (077 0 It fFAR 8 460 9 1f 1 I'.230'
* 9, -;Is '4' 4 485419 44102 4012 400 317 3012D75 -41 ' 6
4,:451!0
IAr ,''rOl24H3 744W 26'?,6 4 4EA 2(Il 1 297 7682'' 111'" -77'? '
7,92566 70773 139022 11'161? i ,4 7 76703 l1392 112914 I7Th% 7 7 2-1-4
161111 *84'2 36V51 33566 4 15425 27"710 25110 2:31 2,11 2 1075",
97, 5 477410 451804 411751 2'43-48A 3,865' 281545 25V 'I' 7'1
FAC' ~ '0 6 I VFA q(60 7 iF68 4 1(0 5 ,(aR ;72p 9 YF0 8 9 IP !r
S921'53 64!7A6' M531)90 766QCII B285707 901762 90177!17 113147 17 01117L P3,!l'3
971 4"'92 45P9798 492984 76o;9q' 500407' 594517 6284209 662475 ~'171103 2769 12 57 1536086 1800514 206 41 27771 25 1 4,M) 295521129 DIM2 "'P22
I AP, I R 7' 2 2 12 (105(4 20204479 150 119447
180460 I 2''A-
ji191711 11005422 7292 27P2944 327650 lpsn20t 4427177 497,76138 557179 '41110
I 'M y') 37OOFF OP I IFA7.2 YEAR I (EAR 4 YEAR 5 0300 h Y(08 I YEAR 9, 0(08, rr9 '
h-11 5 0 6%77797 "')14446 1415W4I9I 7!P7 911 88 412819 4pl 0 P7164 In
249 41,199' 4 4,,1989 450y0779 4152141 495*)48 511,6110 51n,757 54541 0 0h7
F)'P' 6IN6 1917 I 799491 1588519 176('135 19162'i 205P035 2196949 2314164 -411034
''734777 7754 0) 1489728 179152 2n77443 23244r, 259870I 2762118 ?951077 '774397
7! '~90502 14',V 0196044 229795 267A0881 '011518 '71914 3539719 7855()20 119717!

Figure A-6
47536 5132 51'123? 511)2 510237 51022 510237 :'2 54n232 5 : -TC."
3odv 15c63 6 I 306093 339 099 '16009 3U % A ai c.o;5 4
'.794 51081 '22924 >19FB2 1 2881 72979M 2,9H2] 2>92G 2?Fq90 781 1 1723 29M2 ''278
Tc IV 4 72 ',49 249149 249145 2 1119 2491 49 2491 IQ 20214; 24914, :7949 :14- :-4is7IFT3 57,47 77 ?3'47 7 3777 3 3 7 77 3777 ..7.. 37 7 .
:J:'7 FE f- 6 7 " 30ED iEAR I YEAR 2 )3A2 3 YEAR 4 ,EA 5 YEAR 6 'EA; 7 ; B .EAR 9 i(A 10 :D7 ,
-, 43475 442371 402O63 365836 32161 307057 274505 242,Y, 227053 22644 '27ll;
'.7 V1,S 20482 265189 241206 219473 199270 191211 164631 1496P7 C6214 127 5'j
"VP, T TF,.s 90814 199307 10114b 16425 149652 1!6089 123676 1124:2 102297 931), 2 6'.
"OLE 37710$ 466,65 216012 IQ6329 1)9640 162196 W7416 134042 I21674 110971 11c'2 E7'3'q
- ' 55f"13 272592 25932 241971 219698 199786 1815b3 1057> 150177 26670 24 4327
1u -dAHG 303 ' .010LJTh4762 YEAR I 'U 2 EAR 3 YEAR 4 64 5 YEA 6 YEAR I Y[AF 2 [AR 9 'AR 20
4 753622 ::e3s5 5774085 6284217 679454P 7204781 615313 8325745 907512 24576
:.:'1110 7215599 41:169 44277797 4733896 5739995 53146074 5652193 5S293 62642 2 6:70491
I51861 1181742 1411643 1641523 18714041 101285 2331166 2501[47 2790928 '2u8
70L)4 41224-, 741399 990547 1239696 148945 I-791' 1797142 2,'62;l 2465440 27-S9
FC;2.IFS 577477 9:4954 1252431 1589908 1927385 264962 2602339 793991S 3"77294 2t14771
017.76 2232 2133 2 YEAR I YEAR 2 YEAR 3 YEAR 4 YEAR 5 YEAR 6 YEAR 7 lEA; F 'EAR 9 YEAR I-)
-0 4534955 4977326 5379389 5745225 6017386 6379443 6653948 6933451 71305,1 733714e
T2WEP3 564,O82 3M05469 1146675 4366148 4565419 4746630 431111 50633 5197207 3771178
't, 3IF 926S I37I94 l714r 1288547 1453372 1603024 17!91!4 1622729 9'5,>12( . 433 21" r,
2 >24)25J 605612 991947 3060587 1221783 13)079.J7 15 P:1261%5 1717076C., 7'9 55,1 24:566 104C438 1351409 15116 1770893 1952455 ?117'87 2267659 24"4?2
A-7

APPENDIX B
Figure B-I provides the detailed annual cost amounts for the major cost
elements within the package conveyer alternative. Also, included are the
annual cost totals and the cumulative costs in both discounted and
undiscounted dollars.
B-i

Figure B-i
c . 4
'N WI 514) Iti C 441(0 44M0 44 1) 44 ') 4470; iljr.9 441V 4; iS 47
324 206B !2068 32068 32068 3"068 32068 32068 32%8 7"068 , 32C-Z-E A F .>.
1[4 '71> 4(0 YAR3 fE(484 iEA 5 fEP .6 YEAR7 Y(EA; a 17 eE I q~ [O 10 AL
336('d 16 76716P 76 4764861 781. :08788 b b bbp I 1S1
7i 660 7 ' 80 60020 54612 V!5 450C7 40q78 072146 !3e"' >79 :67
S-%h4TF, 6"6169 97223! 988503 106461 7740834 !2170'6& 193174 7364342 1445509 132;-77
A .035s - oms'7>74 8>1~ 0e 978374 O62?59 !71050 7714028 7757274 i165i69 727,07
8l-2

Iorn ApprOvOd
REPORT DOCUMENTATION PAGE (Mf, No 0/0,0188
1. AGENCY USE ONLY (Leave bank) 2. REPORT DATE 3. REPORT TYPE AND DATES COVERL D
October 1991 Final.___________________
4. TITLE AND SUBTITLE 5. FUNDING NUMBERS
A Comparative Cost Analysis of Material Handling
Equipment for the Connector Building Complex
6. AUTHOR(S)
Henry J. Kostanski
7. PERFORMING ORGANIZATION NAME(S) AND ADDRESS(ES) 8. PERFORMING ORGANIZATION
HQ Defense Logistics Agency (DLA-LO) REPORT NUMBER
Operations Research and Economic Analysis Office (DLA-LO)Cameron Station DLA-92-Pli0090
Alexandria, VA 22304-6100
9. SPONSORING/MONITORING AGENCY NAME(S) AND ADDRESS(ES) 10. SPONSORING/ MONITORINGAGENCY REPORT NUMBERDefense Logistics Agency (DLA-OW)
Cameron Station
Alexandria, VA 22304-6100
11. SU-PLEMENTARY NOTES
12a. DISTRIBUTION/ AVAILABILITY STATEMENT 12b. DISTRIBUTION CODE
Public Release; Unlimited Distribution
13. This study compares the cost of iplementing an automated guided vehiclesystem to the cost of utilizing conventional equipment for the same functionsin the Connector Building Complex (CBC) at Defense Depot Richmnd, Virginia(DDRV). The original concept for the Connector Building Coplex included anautomated guided vehicle system to be installed throughout. Due to depotconsolidation efforts in progress throughout DLA, the mission of DDRV may bechanging. It was therefore necessary to perform an analysis to determineif an AGV system or an alternate type of equipment would be most costeffective for the CBC. The results of the study indicate that an AGV systemsystem would not be cost effective at any foreseeable workload level.Implementation of a full scale AGV system, which would handle a workloadsimilar to that which DDRV currently handles, would have a 10-year lifecycle cost of $8.4 million in discounted dollars. Tnis study recommerns usingforklifts and transporters to handle the same workload, at a cost of $2.2million in discounted dollars, over the same life cycle. Selection of thisalternative would result in a cost savings to DIA of $6.2 million indiscounted dollars over the AGV system. -
14. SUBJECT TERMS 15. NUMBER Of PAGES
43Analysis, Automated Guidw Vehicle, Material Handling Equipmen 16. PRICE CODE
17. SECURITY CLASSIFICATION 16 SECURITY CLASSIFICATION 19. SECURITY CLASSIFICATION 20. LIMITATION OF ABSTRACT
OF REPORT Of THIS PAGE OF ABSTRACT
IINCLASSTFI ED UNCLASSIFIED I'NCLASSIFIrlDNN ,"!Jrj r(j 'C'm 2'JH (Re'v 2 d",