a comparative analysis of east and west german labor ... · 12 a comparative analysis of east and...
TRANSCRIPT

This PDF is a selection from an out-of-print volume from the National Bureauof Economic Research
Volume Title: Differences and Changes in Wage Structures
Volume Author/Editor: Richard B. Freeman and Lawrence F. Katz, Editors
Volume Publisher: University of Chicago Press
Volume ISBN: 0-226-26160-3
Volume URL: http://www.nber.org/books/free95-1
Conference Date: July 12-24, 1992
Publication Date: January 1995
Chapter Title: A Comparative Analysis of East and West German Labor Markets:Before and After Unification
Chapter Author: Alan B. Krueger, Jorn-Steffen Pischke
Chapter URL: http://www.nber.org/chapters/c7864
Chapter pages in book: (p. 405 - 446)

12 A Comparative Analysis of East and West German Labor Markets: Before and After Unification Alan B. Krueger and Jorn-Steffen Pischke
The unification of East and West Germany provides a unique natural expen- ment to study a Soviet-style labor market undergoing a dramatic and rapid transition. Furthermore, the demise of the Communist regime in East Germany has for the first time enabled researchers to obtain large quantities of data col- lected during the Communist era. The availability of these data sets permits a detailed comparison of the operation of the labor market under different eco- nomic systems. In this paper, we use several large micro-data sets to compare the labor markets in East and West Germany before and after unification.
Specifically, we address the following questions: How did the income distri- butions compare in East and West Germany just before the collapse of East Germany? What factors determined wages in these countries? How has the transformation to a market-based economy affected the income distribution in eastern Germany? How do former East Germans who commute to work in west Germany or migrated to west Germany perform in the labor market? To provide another point of comparison for the wage structures, we also examine data for the United States.
A number of observers have noted that East German physical capital is of little or no value. The main asset acquired by West Germany from unification is human capital. We therefore devote a great deal of attention to comparing education levels and the economic value of education in East and West Germany.
Alan B. Krueger is the Bendheim Professor of Economics and Public Policy at Princeton Uni- versity and a research associate of the National Bureau of Economic Research. Jom-Steffen Pischke is assistant professor of economics at the Massachusetts Institute of Technology.
The authors thank Matt Downer, Ondraus Jenkins, Gabi Reiss, and Kainan Tang for outstanding research assistance. They are also grateful to seminar participants at the NBER conference on “Differences and Changes in Wage Structures,” at the Universities of Cologne, Konstanz, Mann- heim, and Yale, and at the Center for European Economic Research (ZEW), and to Rebecca Blank, Richard Freeman, Jennifer Hunt, Lawrence Katz, and Robert Topel for helpful comments.
405

406 Alan B. Krueger and Jorn-Steffen Pischke
Our main conclusion is that East Germans were well educated and received a substantial payoff to their education. Indeed, despite greater wage compres- sion in East Germany, the rate of return to education was about the same in East and West Germany in 1988. After unification, the return to education fell slightly in eastern Germany. East Germans who commute to work in the west have performed fairly well in the capitalist economy. German unions have tried to impose a wage structure and bargaining structure on eastern Germany that mimics the western model. Although it is very early in the transition process, we find that the wage structure of the former East Germany is approaching that of West Germany. Most significantly, wage dispersion has increased in eastern Germany, especially at the right tail of the distribution, and interindustry wage differentials now more closely resemble those in the west.
The transition to a market-based economy will probably occur much more quickly in East Germany than in the other East-bloc countries because of the great deal of financial and technical assistance provided by West Germany. Thus, East Germany’s experience to date provides unique insights into the tran- sition process.
The remainder of the paper is organized as follows. Section 12.1 presents a brief summary of relevant institutional features of the East and West German labor markets and education systems. Section 12.2 describes changes in wage- setting institutions in East Germany since 1989. Section 12.3 offers some theo- retical observations on expected changes in the East German labor market due to unification. Section 12.4 describes the data sets we use. Section 12.5 pres- ents a comparison of the wage structures in East Germany, West Germany, and the United States, with particular emphasis on comparing the rate of return to schooling. Section 12.6 examines changes that have taken place in the eastern German labor market since unification.
12.1 Labor Market Institutions
12.1.1 West Germany (FRG)
Collective bargaining is an essential labor market institution in West Ger- many.’ German unions are generally organized nationwide along industry lines. The largest German labor union is the Deutscher Gewerkschaftsbund (DGB), which is an umbrella organization that includes seventeen industry unions. Roughly 80 percent of all unionized workers are members of the DGB. Employers either bargain with the DGB member unions individually or are members of a nationwide employer association that bargains on their behalf. The employer associations are also organized along industry lines. Although wage contracts are ultimately negotiated at the Land or plant level, the national
1. Our description of collective bargaining in West Germany draws heavily on Schmidt (1991) and Burda and Sachs (1988).

407 East and West German Labor Markets
unions publicize their wage demands, which then become a standard for other negotiations. The public-sector and metalworkers’ unions are widely consid- ered important pattern setters.
A significant feature of the West German system is that it is possible for collective bargaining agreements to become “generally binding” for all em- ployees and enterprises in an industry, regardless of whether they belong to the labor union or employer association. Either party to a collective bargaining agreement may petition the labor minister in the Liinder to extend the contract to nonunion enterprises if more than half the employees in the relevant industry are employed by firms that were a party to the negotiated contract. Although only about one-third of German workers are union members, collective bar- gaining may affect as many as 90 percent of German workers because of con- tract extensions and spillovers. Burda and Sachs (1988) note that the process of contract extension compresses regional wage differences.
Because a great many nonunion employees are covered by collective bar- gaining agreements, and because there is a good deal of spillover even to non- union workers who are not covered by legal contracts, the union-nonunion dis- tinction is not particularly relevant in West Germany. As a consequence, researchers have found only a small wage differential between union and non- union members in West Germany, typically ranging between 0 and 5.5 percent (see Schmidt 1991; and Blanchflower and Freeman 1992). Owing to the large role played by unions, one would expect more wage compression and emphasis on seniority in West Germany than in a country with plant-level bargaining and weak unions, such as the United States.
12.1.2 East Germany (GDR)
There was a great deal of centralization in the labor and product markets in East Germany.Z All firms were owned by the state, and an elaborate plan di- rected the allocation of inputs, the distribution of outputs, wage levels, and prices. Only six broad compensation groups existed for production workers. Wage levels for these groups, however, varied by industry. But even within the wage groups there was extensive variation. According to Stephan and Wiede- mann (1990), this variation was quite large and cannot be explained by the official wage norms, with the result that to some extent individual enterprises were able to deviate from the planned targets. Much of the “unplanned” varia- tion comes from bonuses, which accounted for 6 percent of compensation, on average, in East Germany. Enterprises had more discretion over bonuses than over the base wage. East German workers were free to work for whichever firm they chose, but rationed housing may have frequently limited mobility.
East German plants were typically much larger than West German plants. Vortmann (1985) contends that East German enterprises used their discretion-
2. For a discussion of the GDR economy and of the restructuring effort under way, see Siebert and Schmieding (1992).

408 Alan B. Krueger and Jom-Steffen Pischke
ary power to attract the workers they needed. If an industry was at a disadvan- tage owing to the wage targets specified in the government plan, firms could often circumvent the plan. Thus, the East German wage structure should ex- hibit some features that are common in Western economies. Nevertheless, the Communist system operated like a large internal labor market, with rules and party membership playing an important role in the allocation of jobs and wages.3
12.1.3 The Education Systems in Germany
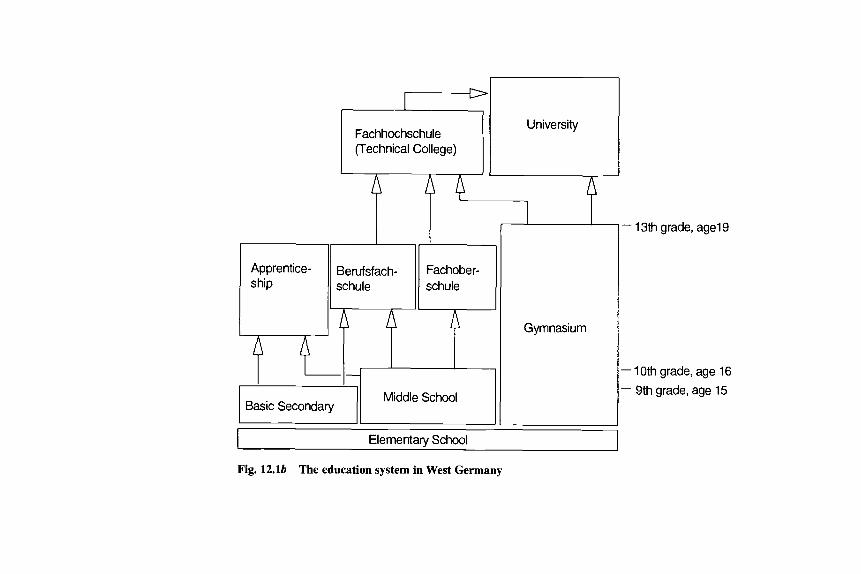
Unlike the United States, the German education systems are characterized by a multitude of different kinds of schools, many of them offering alternative routes to a similar degree. Despite their common history, the education systems in East and West Germany have diverged significantly, making direct compari- sons difficult. Figures 1 2 . 1 ~ and 12.lb contain tree diagrams outlining the edu- cation systems in East and West Germany. The systems are described in detail in the appendix?
For our purposes, the main difference between the education systems is that the average time to completing a higher degree is longer in West Germany than in East Germany. For example, a university degree requires roughly seven years of study in West Germany but only four years of study in East Germany. On the other hand, there were no education fees in either East or West Ger- many. And both countries had an elaborate apprenticeship system that was tied to public schools and widely used. Although East German elementary and sec- ondary schools did devote some time to Communist ideology, the level of in- struction was generally considered to be comparable to that in the west.
12.2 The Eastern German Labor Market in Transition
The wage-setting institutions in eastern Germany have undergone a rapid and dramatic transformation. At midnight on 30 June 1990, formal monetary union took place. At this time, East German wage contracts were converted to West German marks at a rate of one for one, and the legal, tax, and social insurance systems in the two Germanies were harmonized. In the months fol- lowing monetary union, the East German economy sunk into a deep depres- sion, with industrial output quickly falling to roughly half its 1989 level (see Akerlof et al. 1991). Since the collapse of East Germany in late 1989, employ- ment fell from 9.2 million in 1989 to 7.1 million in July 1991.' Unemployment increased from around 1 percent of the labor force to over 10 percent of the labor force. And even these numbers understate the extent of employment ad-
3. This analogy has also been made by VeEernik (1991) in reference to Czechoslovalua. 4. For extensive descriptions of the education systems, see also Waterkamp (1987) on East
5 . An estimated 400,OOO workers migrated to the West or commute to work in the West. They Germany and Fiihr (1989) on West Germany.
are not included in these figures.

409 East and West German Labor Markets
justment because a substantial number of employed workers were put on short- time hours (Kurzurbeit), early retirement, and public works jobs (see Bellman et al. 1992).
Even before monetary union, West German unions aggressively organized East German workers. In early 1990, the West German unions achieved re- markable success in organizing East German workers, in part because the old East German Communist unions were completely discredited. The structure of unions in eastern Germany is now similar to that in the west: unions organize and bargain along Landlindustry lines, although some contracts are being ne- gotiated for all new Liinder simultaneously. The first round of bargaining in the summer of 1990 yielded mostly lump-sum wage increases. However, in some industries (e.g., chemical), large percentage base wage increases were negotiated. The construction industry immediately tied wages in the east to about 60 percent of the western level. Contracts were generally written for short time periods. As in the west, the eastern unions have sought to prevent contract wages from varying with the performance of individual firms.
The second round of negotiations was held in the winter of 1990-91. In this round, many sectors agreed to tie wages to a specified proportion of the west- ern level, and schedules were set so as to gradually achieve parity with the west in 1994 or 1995. There was tremendous variance in the eastlwest wage ratio across industries at this time. For example, cleaning services in East Ber- lin paid 100 percent of the West Berlin level, while the eastern textile industry paid 43 percent of the western level. Most contracts set base wages at 50-60 percent of the western level. This exaggerates the relative size of take-home pay in the east, however, because bonuses and fringe benefits were much lower or nonexistent in the east. Furthermore, work hours are longer in the east and vacation time shorter. Bispinck and WSI-Tarifarchiv (1991) calculate that met- alworkers in Saxony earned 44.8 percent of the hourly wage of Bavarian met- alworkers during the first half of 1991, although the base wage was formally set at a 58.6 percent level.
Many general contracts (Munteltrurifvertr~ge) were also written in 199 1. These contracts set general wage structures for a handful of skill levels. Work- ers were thereby classified into skill groups, causing some friction. Notably, in the public sector, unions initially negotiated a contract that completely elimi- nated seniority pay. Workers went on strike against this contract, and it was subsequently modified. We also note that several firms are believed to deviate from negotiated contract rates.
Another critical development in the east is the process of privatization, car- ried out by the Treuhand. As of November 1991, the Treuhand had sold about 25 percent of eastern German companies to private concerns and was subsidiz- ing a sizable proportion of the remainder (see Economist, 21 March 1992,71). The Treuhand closed down only about 6 percent of east German companies. Akerlof et al. (1991) contend that managers of Treuhand-operated firms have had little incentive or ability to resist union wage demands, a situation that is partly responsible for the fast growth of eastern wages.

Fachschule (Technical College)
4 University University Fachschule (Technical College)
4 years 4
12th grade,
10th grade,
Polytechnische Oberschule (Secondary School)
18
16
Fig. 12.1~ The education system in East Germany
Apprentice- BeNfsfach- Fachober-
Middle School Basic Secondary
Gymnasium
I I
Elementary School
- 13th grade, age1 9
- 10th grade, age 16
- 9th grade, age 15
Fig. 12.lb The education system in West Germany

412 Alan B. Krueger and Jom-Steffen Pischke
12.3 Theoretical Framework
The wage-setting institutions in East Germany under communism are ex- pected to compress wage dispersion greatly. The Communist ideology stressed uniformity in outcomes, irrespective of individual differences in ability or ef- fort. Nevertheless, the East German system clearly allowed firms some discre- tion in wage setting, which should lead the wage structures in East and West Germany to have some similarities. Moreover, wage incentives were used by the government to induce individuals to invest in training and attain higher levels of education. Given the importance of unions in West Germany, we ex- pect wage dispersion to be lower there than in the United States but still greater than in East Germany.
After unification, we expect there to be widescale revaluation of individual characteristics in the former East Germany. Our guiding theoretical principle is that we expect the wage structure in the former East German labor market gradually to approach that in West Germany. We expect the two wage struc- tures to approach each other because there are now free flows of capital and labor between the two lands. Absent rigidities, differences in wage structures should eventually be arbitraged away. Moreover, German unions have vigor- ously pursued a policy of imposing the West German wage structure on eastern Germany. Because the East German population is only about one-quarter as big as the West German population, and because East Germany’s GDP was only about 10 percent as big as West Germany’s, we expect that unification will lead to far greater changes in East Germany than in West Germany.
We also expect that younger workers will make the transition to a market- based economy more easily than older workers. In particular, firms and the government have a greater incentive to invest in younger workers because there is a longer period to recoup the investment. This suggests that experience pro- files will flatten out initially in East Germany. The effect of unification on the return to education is ambiguous. On the one hand, the market-based economy is expected to reward human capital more generously, which would increase the return to education. On the other hand, the education acquired under the Communist regime may not be very valuable in a capitalist economy. In any event, we expect wage variation to increase eventually in the east, as those at the top of the income distribution are free to increase their position and those at the bottom are no longer so vigorously propped up by the government.
Capital and labor flows take time. Workers are reluctant to move far away from their families and friends to find new jobs, and firms are loath to invest large sums of money in new capital until they are certain of the quality of the workforce and existing capital stock. We should stress that our analysis focuses on the early stage of the transition process and that the East German labor market is most likely still in a state of disequilibrium. Nevertheless, the changes in the East German wage structure that we can detect will give us an

413 East and West German Labor Markets
indication of the extent of labor market restructuring that has taken place and of the distance that remains to be traveled.
12.4 DataSets
12.4.1 East Germany
The East German micro data used in this study come from the Survey on Income of Blue- and White-collar Households in the GDR (Einkommens- stichprobe in Arbeiter-und Angestelltenhaushalten). This is a cross-sectional survey that was conducted every two or three years by the Statistical Office of the GDR. The survey was intended to contribute “reliable information on the level and change of the incomes of blue- and white-collar households and about other aspects of the standard of living” in East Germany (Statistisches Amt der DDR 1990). Aggregate results from the survey are published in the Statistical Abstract of the GDR and in other official publications. We were able to obtain an IBM standard label tape containing the survey conducted in September 1988 from the former Statistical Office of the GDR. The survey was conducted in the year before the collapse of the GDR, and it is the last such survey taken before German unification. The survey contains data on seventy-nine thousand individuals in twenty-eight thousand households, or roughly 0.5 percent of the total population of the GDR. Krause and Schwarze (1990) provide an extensive description of the data set.
The survey contains detailed questions on various categories of income of individuals and households. In addition, the survey provides basic demo- graphic and labor force information about each household member. Finally, a set of questions is asked about the households’ ownership of cars and house- hold appliances, such as televisions and dishwashers. A household is defined as an economic unit sharing income and would include a household member who contributes to the household income but lives separately.
The sampling design of the survey is sufficiently different from typical household surveys conducted in Western countries to warrant some elabora- tion. The basic sampling unit is not the residence of the household; it is the employer. Firms were selected by the central Statistical Office to participate in the sample to achieve a representative distribution across regions and indus- tries. Within a selected firm, a random sample of employees was drawn from payroll records. The household of the selected employee became a target household for the sample. The target respondent was contacted early in Sep- tember 1988. At that time, the respondent received a record sheet similar to the questionnaire to prepare for the interview. The interviews took place at the end of September, and the respondent provided the information on all the members of the household (i.e., proxy responses). Earnings for the respondent, however, were supplied by the payroll office of the firm. The interviewer was

414 Alan B. Krueger and Jorn-Steffen Pischke
supposed to have verified the firm-reported income amounts with the respon- dent and to supplement the payroll data if necessary.6 Note that the individual who was interviewed may be someone other than the household head.
The firms selected for the sample are all state-owned enterprises, state- owned farms, and certain cooperatives in the trade sector. Excluded are other cooperatives, private enterprises, and joint ventures. Individuals working in such firms can still be part of the sample if they are members of the household of a target individual. A target household drawn within a sample firm was ex- cluded from the sample if any one of the household members was currently a member of the armed forces or state security or was a full-time employee of the party organization or other mass organizations like unions. A household was also excluded if the target respondent was an apprentice or working in her own home.
The sampling design leads to a number of problems. First, a household is more likely to be drawn for the sample if it has more earners. Thus, the sample is not representative of the households in the GDR and cannot be used for analyses of household characteristics. Second, the exclusion of certain sectors distorts the distribution of workers across industries. Despite these problems, we show below that the sample is reasonably representative of the employed population in East Ge~many.~
To the extent possible, the income variables in the sample refer to monthly income during August 1988. Vortmann (1985) claims that this leads to some distortions in the income measure because August is unrepresentative with re- spect to sick time. Some sources of income, like employment bonuses and interest, accrue only on an annual basis. Respondents were asked to report annual income for 1987 for such categories, which we converted to monthly amounts by dividing by twelve.
12.4.2 West Germany
For West Germany, we use the 1988 wave of the Socioeconomic Panel (SOEP). The SOEP is a longitudinal survey of about six thousand households that has been conducted annually since 1984. All household members sixteen years old or older are interviewed directly; the survey follows sample members if they leave their original household. Proxy interviews are utilized only in rare cases. The panel deliberately oversampled about sixteen hundred households with foreign-born individuals. We exclude this subsample from our analysis.
6. The variance of earnings does not differ between self-respondents and proxy respondents in the survey. Returns to education are slightly lower for proxy respondents, however. Vortmann (1985) claims that the income levels for proxy respondents are underreported.
7. It is interesting to note that there are no missing values in the data set because individuals refused to respond to certain questions. However, the Statistisches Amt der DDR (1990) points out that the survey was voluntary. While the guidelines for the selection of respondents make provisions for the fact that complete refusals will occur, the Statistical Office does not provide statistics on the response rates.

415 East and West German Labor Markets
Owing to attrition, there were about thirty-seven hundred households left in 1988, with seventy-six hundred interviewed individuals. The interviews for the panel are conducted mainly in March and April of each year. Most interviews were conducted in person (about 60 percent); the remainder were conducted by mail and to a lesser extent by telephone.
The survey consists of a household questionnaire and separate question- naires for each individual in the household. The questionnaires include a con- stant set of items asked in each wave. For the household, these are questions concerning living quarters, household income and assets, and noninterviewed children. For the individuals, information is collected on basic demographics, education, labor market participation, unemployment, earnings, taxes and so- cial security contributions, time use, satisfaction with various aspects of life, health, and political preferences. In addition, there are topical modules on each wave.
12.4.3 Eastern Germany in Transition
In 1990, the SOEP initiated a special survey of the former East Germany, the so called SOEP-East. The first wave of the SOEP-East was conducted (mostly) in June 1990, just before monetary union, and a follow-up survey was conducted (mostly) between March and May 1991. The first wave also in- cluded retrospective information on earnings in 1989. The sample consists of households drawn at random from the Central Register of Population. A total of 2,179 households with 4,453 people over age sixteen participated in the survey. Importantly, individuals were included in the follow-up survey even if they had moved to the western section of Germany. Although the SOEP-East was recently made available, the SOEP-West was not available for 1990 and 1991 at the time of writing. We use the SOEP-East to examine the preliminary effects of the transition of the eastern German labor market.
12.4.4 United States
We use the March 1989 Current Population Survey (CPS) to estimate basic wage regressions and to describe income distribution in the United States. The CPS contains information on individuals in a sample of 56,500 households, one-quarter of which are asked questions about weekly earnings and union status. Weekly wages are examined for the United States and monthly wages for the Germanies. We suspect that wage dispersion in the United States would be even greater were monthly instead of weekly earnings used because of vari- ation in weeks worked. In some of our analysis, we also analyze CPS outgoing rotation group files for various years.
416 Alan B. Krueger and Jorn-Steffen Pischke
12.5 Distribution of Earnings and Returns to Education
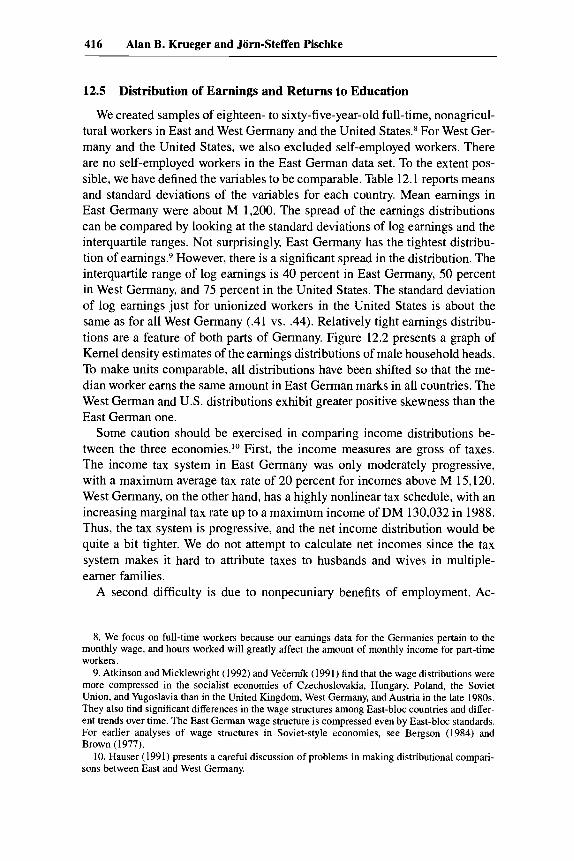
We created samples of eighteen- to sixty-five-year-old full-time, nonagricul- tural workers in East and West Germany and the United States.8 For West Ger- many and the United States, we also excluded self-employed workers. There are no self-employed workers in the East German data set. To the extent pos- sible, we have defined the variables to be comparable. Table 12.1 reports means and standard deviations of the variables for each country. Mean earnings in East Germany were about M 1,200. The spread of the earnings distributions can be compared by looking at the standard deviations of log earnings and the interquartile ranges. Not surprisingly, East Germany has the tightest distribu- tion of earning^.^ However, there is a significant spread in the distribution. The interquartile range of log earnings is 40 percent in East Germany, 50 percent in West Germany, and 75 percent in the United States. The standard deviation of log earnings just for unionized workers in the United States is about the same as for all West Germany (.41 vs. .44). Relatively tight earnings distribu- tions are a feature of both parts of Germany. Figure 12.2 presents a graph of Kernel density estimates of the earnings distributions of male household heads. To make units comparable, all distributions have been shifted so that the me- dian worker earns the same amount in East German marks in all countries. The West German and U.S. distributions exhibit greater positive skewness than the East German one.
Some caution should be exercised in comparing income distributions be- tween the three economies.1o First, the income measures are gross of taxes. The income tax system in East Germany was only moderately progressive, with a maximum average tax rate of 20 percent for incomes above M 15,120. West Germany, on the other hand, has a highly nonlinear tax schedule, with an increasing marginal tax rate up to a maximum income of DM 130,032 in 1988. Thus, the tax system is progressive, and the net income distribution would be quite a bit tighter. We do not attempt to calculate net incomes since the tax system makes it hard to attribute taxes to husbands and wives in multiple- earner families.
A second difficulty is due to nonpecuniary benefits of employment. Ac-
8. We focus on full-time workers because our earnings data for the Germanies pertain to the monthly wage, and hours worked will greatly affect the amount of monthly income for part-time workers.
9. Atkinson and Micklewright (1992) and VeEemk (1991) find that the wage distributions were more compressed in the socialist economies of Czechoslovakia, Hungary, Poland, the Soviet Union, and Yugoslavia than in the United Kingdom, West Germany, and Austria in the late 1980s. They also find significant differences in the wage structures among East-bloc countries and differ- ent trends over time. The East German wage structure is compressed even by East-bloc standards. For earlier analyses of wage structures in Soviet-style economies, see Bergson (1984) and Brown (1977).
10. Hauser (1991) presents a careful discussion of problems in making distributional compari- sons between East and West Germany.

Table 12.1 Descriptive Statistics (means with standard deviations in parentheses)
Variable
Earnings"
Log earnings
Interquaxtile range of
Net monthly family log earnings
income'
Standard deviation of log family income
Years of school
loth grade or less
Completed apprenticeship
Master craftsman
Technical school
University
Age
Experience
Female
Married
White collar
Public servant
Shift work
Sample size
East Germany (1)
1,179. 14b
7.026 (.315)
,389
1,970.3P (746.20)
,402 13.06 (1.78)
.05 1 (.219)
,594 (.491) .056
(.229) ,189
(.391) ,111
(.314)
(359.04)
38.35 (11.30) 19.31
(1 1.35) .463
(.499) ,748
(.434) .493
( S O O ) . . .
.I88 (.390)
43,532
West Germany (2)
United States (3)
3,814.11' (1,798.46)
8.154 (.438)
,492
3,579.7v (2,009.90)
.42 1 12.32 (2.72)
.137 (.343)
,617 (.486) ,087
(.282) ,062
(.241) ,098
(.297) 39.01
(11.57) 20.69
(11.79) ,288
(.453) .641
(.480) .48 1
( . 5 W ,136
(.343) . . .
2,496
425.54d (242.16)
5.914 (527)
,751
3,340.57d (1,889.06)
.648 12.94 (2.68)
. . .
. . .
. . .
,222 (.416)
37.64 (11.57) 18.71
(12.02) .47 1
(.499) ,612
(.487) ,560
(.496)
. . .
8,118
Nore: Data for East Germany are from the 1988 Survey of Blue- and White-collar Households, for West Germany from the 1988 wave of the Socioeconomic Panel, and for the United States from the March 1989 CPS. Samples consist of nonagricultural, full-time employed men and women. For West Germany and the United States, self-employed workers are deleted. "Earnings refers to gross earnings in the month prior to the interview plus one-twelfth of annual bonuses for the previous year for both German data sets. For the United States, earnings is gross weekly earnings on the main job. bEast German marks. (continued)

418 Alan B. Krueger and Jorn-Steffen Pischke
Table 12.1 (continued)
‘West German deutsche marks. dU.S. dollars. ‘Family income is total net monthly family income for August 1988 plus one-twelfth of total annual income for the previous year for the East German data, formed as the sum of the separate income categories. For West Germany it is the answer to the question, “What was the net income of your household last month.” For the United States it is gross total family income for 1988 divided by 12.
cording to anecdotal evidence, one means of transferring additional resources to individuals favored by the East German regime was through greater access to goods. For example, a physician who was regarded as important would be given a house far below the normal cost. Valuing such transfers is difficult because often there was no market for comparable goods. Transfers in kind are not captured by our data, and their inclusion probably would increase the right tail of the income distribution.” Nonpecuniary benefits are also omitted in our analysis of the west.
The third difficulty involves relative prices. Necessities were substantially subsidized in East Germany. For example, rent for a one-bedroom apartment was some seventy-five marks a month (6 percent of the average salary), a local bus ticket twenty pfennigs, etc. On the other hand, luxuries were comparatively expensive; for example, a Czech Skoda car cost M 25,000. Therefore, in terms of real consumption possibilities, earners at the lower end of the distribution spent relatively more of their budget on necessities and were comparatively better off in East Germany than in the Western economies. The opposite is true for the rich. Hence, the “real” income distribution in East Germany was much tighter than suggested by our measures of nominal income.
This last difference between the Germanies, which should be the most im- portant concern, has evaporated with the monetary union beginning in July 1990. Since wage contracts were converted to West German marks at a rate of one to one, the 1988 income distribution would have approximately character- ized the situation at the beginning of the transition process. With the major exceptions of rents, the prices and availability of goods changed quickly after monetary union. Hence, thinking of the distributions as characterizing the situ- ation in the Germanies on the eve of political union in October 1990 is a plausi- ble exercise. (The average exchange rate in 1991 was DM 1.66 per U.S. dollar.)
Return to table 12.1. The similarities between the Germanies are even more striking when comparing the family income distributions. The table reports log standard deviations for total family income. They are computed for the fami- lies in the sample with at least one full-time worker. This is the only group for
11. We have estimated Engle curves for cars and other consumer durables in East Germany. These results indicate that, despite rationing, income was an important determinant of con- sumption.

419 East and West German Labor Markets
0.09-
0.08-
0.07-
0.05
004’
0 01
0 0 500 1000 1500 2000 2500 3000 3500 4000 4500 5 ...___ 111
4000 4500 5 East German Marks
Fig. 12.2 Distribution of earnings: Working male household heads Sources: Data for East Germany are from the 1988 Survey of Blue- and White-collar Households, for West Germany from the 1988 wave of the Socioeconomic Panel; and for the United States from the March 1989 CPS. Samples consist of nonagricultural, full-time employed male household heads. Self-employed workers are deleted for West Germany and the United States. Nore: Kernel density estimates.
which the East German data are roughly representative. The estimates indicate that family incomes in the two Germanies have a very similar level of disper- sion. West Germany stands out as the only country where family income is less variable than individual earnings. Apparently, incomes between spouses there are strongly negatively correlated. Importantly, female labor force partic- ipation in West Germany is quite low (49.6 percent in 1988) compared to the United States (59.2 percent) and especially East Germany (81 percent).
12.5.1 Rate of Return to Schooling
Table 12.1 reports the distribution among five education categories. The re- sults for East Germany correspond closely to the counts from the Labor Mar- kets Monitor, the first labor market survey conducted in the new states after unification (see Bielinski and von Rosenbladt 1991). As described in detail in the appendix, we constructed a continuous years of schooling variable using information on individuals’ highest degree and postsecondary training. We present evidence below that our linearization works well in practice.
According to our continuous education measure, on average, workers in East Germany spend slightly more years in school than their counterparts in West Germany. This is primarily due to the importance of Fuchschulen (technical schools), which were attended by 19 percent of East German workers, whereas only 6 percent of West Germans attended comparable Fuchhochschulen. The somewhat surprising finding that a larger fraction of the East German popula-
420 Alan B. Krueger and Jorn-Steffen Pischke
tion has technical or academic training has also been observed by others. Scheuer (1990) attributes this to the fact that one trains for occupations like nurses at the East German Fuchschufen. Since we included them in the West German count for the “technical school” category, we can discard this explana- tion. Enrollment in higher education grew rapidly in East Germany after World War I1 but leveled off in the 1970s and 1980s; enrollment in higher education in West Germany grew considerably in the 1970s and 1980s, surpassing the East German level.
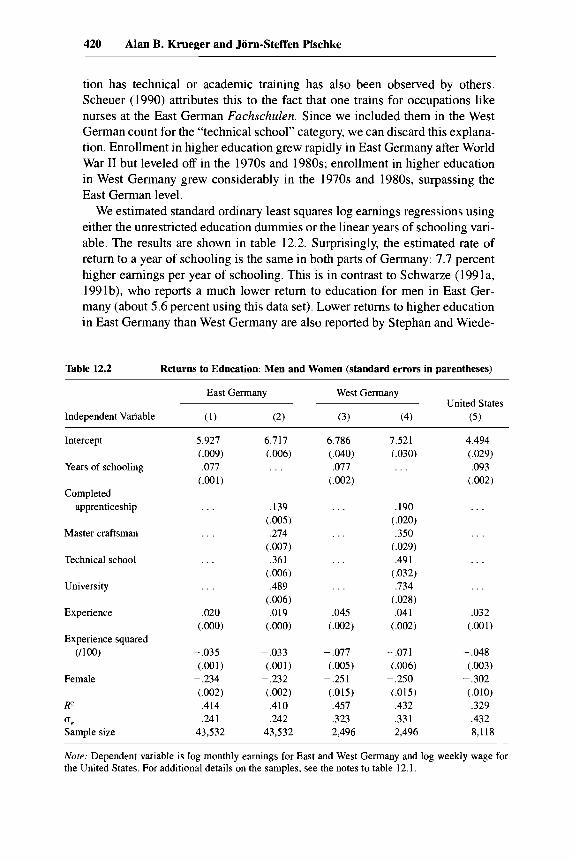
We estimated standard ordinary least squares log earnings regressions using either the unrestricted education dummies or the linear years of schooling vari- able. The results are shown in table 12.2. Surprisingly, the estimated rate of return to a year of schooling is the same in both parts of Germany: 7.7 percent higher earnings per year of schooling, This is in contrast to Schwarze (1991a, 1991b), who reports a much lower return to education for men in East Ger- many (about 5.6 percent using this data set). Lower returns to higher education in East Germany than West Germany are also reported by Stephan and Wiede-
Table 12.2 Returns to Education: Men and Women (standard errors in parentheses)
East Germany West Germany United States
Independent Variable (1) (2) ( 3 ) (4) ( 5 )
Intercept
Years of schooling
Completed apprenticeship
Master craftsman
Technical school
University
Experience
Experience squared (/loo)
Female
R’
u e
Sample size
. . .
.020 (.OOO)
-.035 (.001)
i.002) -.234
,414 ,241
43,532
.139
.274 (.007) ,361
(.006) .489
(.006) ,019
(.OOO)
-.033 i.001)
-.232
.410 ,242
43,532
6.786 (.040) ,077
(.ma
. . .
. . .
,045 (.002)
- .077 ( .005)
(.015) ,457 ,323 2,496
- .25 1
7.521 (.030)
,190 (.020) ,350
i.029) .49 1
(.032) .734
i.028) ,041
(.002)
- .07 1 (.006)
(.015) ,432 ,331 2,496
- ,250
4.494 (.029) ,093
i.002)
. .
. . .
,032 i.001)
- ,048 (.003)
-.302 i.010) .329 .432 8,118
Note: Dependent variable is log monthly earnings for East and West Germany and log weekly wage for the United States. For additional details on the samples, see the notes to table 12.1.

421 East and West German Labor Markets
mann (1990) in a study of payroll data for 1988. Notice that our unrestricted dummy variable specifications (cols. 2 and 4) also find a lower return to post- secondary education in East Germany.
How can these seemingly conflicting results be reconciled? Most important, higher education in West Germany takes longer than in the east. The higher education groups-technical school and university-are the groups that have the most pronounced differences in relative earnings between the east and the west. Our conclusion is that the higher returns to these degrees in the west are just due to longer schooling, not to higher returns per year of schooling. Schwarze (1991a), on the other hand, mechanically assigns the same number of years of schooling to similar groups for both the east and the west. His results therefore have to reflect our dummy variable results.
We consider the continuous schooling measure more informative. For East and West Germans alike, a year of schooling means a year of forgone earnings, so in this respect the schooling coefficient is a measure of the return on a comparable investment.I2 From this perspective, young Germans faced similar budget constraints in both parts of the country. The structure of the East Ger- man labor market apparently did not provide major disincentives for higher education, which is also borne out by the finding of similar mean years of edu- cation.
Furthermore, we provide some evidence in figure 12.3 that the earnings- schooling relation is indeed approximately log linear in both parts of Germany. The figure displays the coefficients on dummy variables for each possible value that the schooling variable can take.13 The graph also shows the lines corre- sponding to the OLS regression estimates for the continuous schooling mea- sure. The linear specification reflects the unrestricted earnings-education rela- tion rather well.
Finally, the continuous schooling measure allows a comparison with the United States, which is shown in column 5 of the table. The rate of return to schooling in the United States was greater than 9 percent in 1989, almost 2 percentage points above the Germanies. The payoff to a year of education was unusually high in the United States in the late 1980s, but even in more typical years the payoff to education was probably higher in the United States than in the Germanies. Given the high cost of college tuition in the United States, it is not surprising that the payoff to a year of education is greater in the United States than in the Germanies, where education is free.
That we observe more schooling on average for the East German sample than for the West German sample, of course, does not mean that the East Ger- mans are necessarily better educated. The results may, for example, reflect the
12. This is one of Mincer's (1974) essential insights. 13. There are nine points shown for East Germany despite the fact that education is coded only
in six separate levels. This is because additional values were created for university graduates under thirty. We also separate out physicians since medical school requires an additional year of study. For other details, see the appendix.

422 Alan B. Krueger and Jorn-Steffen Pischke
8.2! West Germany
8
:r 7.4
7.21
'1 Y
' East Germany
9 10 11 12 13 14 15 16 17 i a 19 Years of Education
Fitted Regression Lines for Continuous Education Measure Shown
Fig. 12.3 Unrestricted log earnings-education relations Sources: 1988 Survey of Blue- and White-Collar Households and 1988 wave of the Socioeconomic Panel.
fact that formal education has been more important in the east while there is more upgrading of skills on the job in the west. This is consistent with the much higher return to experience in West Germany (4 percent in the first year compared to 2 percent in the east). Notice, however, that the experience pro- files in West Germany are also steeper than they are in the United States.
Figure 12.4 presents a plot of unrestricted age-earnings profiles estimated on the basis of dummy variables for three-year age groups in the two Germa- nies. Profiles for unskilled workers and university graduates are shown sepa- rately. Especially for unskilled workers, the East German profile is essentially flat. Figure 12.5 presents age-earnings profiles for men in the Germanies and the United States. Again, the much lower returns to work experience in East Germany are apparent.
The R2's of the regressions in table 12.2 are higher for West Germany than for the United States. This is not surprising since there seems to be more em- phasis on formal educational attainment and seniority compared to individual performance in the German compensation systems. But the RZ is highest for West Germany, around 45 percent, compared to 41 percent for the east. Thus, even in East Germany, there is a good deal of earnings variation left over after accounting for the standard human capital factors. The system apparently left enough room for firm- and/or individual specific factors to influence compen- sation significantly.
It is useful to summarize this information with the ANOVA table for the models in columns 1, 3, and 5 of table 12.2 that is shown in table 12.3. Al- though the total log earnings variance in West Germany is twice that of the

423 East and West German Labor Markets
,p-... \ ,,,' m-.. -E---a..
University Graduates, West
p...-o' - -m
1.2- ,a.. ,,' ,' -m'
I -?m' IZI-'
'i I
1 1
Three Year Age Groups
Fig. 12.4 Age-earnings profiles Sources: 1988 Survey of Blue- and White-collar Households and 1988 wave of the Socioeconomic Panel.
-..
0.6-
0.5-
0.4-
0.3-
0.2-
0.1 -
19 22 25 28 31 34 37 40 43 46 49 52 55 58 61 Three Year Age Groups
Fig. 12.5 Age-earnings profiles: Men Sources: 1988 Survey of Blue- and White-collar Households, 1988 wave of the Socioeconomic Panel, and March 1989 CPS.
east, the same pattern emerges. Slightly less than half the variance is explained by standard human capital factors. This contrasts with the United States, where the human capital variables explain about the same amount of earnings vari- ance as in West Germany. The larger total variance in the United States is entirely due to the higher residual variation.

424 Alan B. Krueger and Jorn-Steffen Pischke
Table 12.3 ANOVA for Simple Earnings Regressions
East Germany West Germany United States
Total variance ,099 ,192 ,278 Explained variance .04 1 .088 .09 1 Residual variance ,058 .I05 ,187
Table 12.4 Returns to Education: Men (standard errors in parentheses)
East Germany West Germany United States
Independent Variable (1) (2) (3) (4) ( 5 )
Intercept
Years of schooling
Completed apprenticeship
Master craftsman
Technical school
University
Experience
Experience squared (1100)
R= Sample size
6.008 (.012) .07 1
(.001)
. . .
. . .
,020 (.001)
-.036 (.@)I) ,305 23,382
6.759 (.oo% . . .
- ,035 (.001) ,300 23,382
6.767 (.042) .075 (.003)
. . .
. . .
,049 (.003)
-.083
.419 1,778
7.497 (.034) . . .
,153 (.024) ,303 (.031) ,515 (.038) ,699 (.032) ,046 (.003)
-.079
,394 1,778
4.473 (.037) .085
. I .
- .06 1 (.004) ,310 4,297
Note: Dependent variable is log monthly earnings for East and West Germany and log weekly wage for the United States. For additional details on the samples, see the notes to table 12.1.
Table 12.2 above also includes a dummy indicating gender; women receive 25-30 percent lower earnings than men in all three countries, other things held constant. Table 12.4 above and table 12.5 report separate wage regressions for men and women. The estimated return to education is greater for women than men in all three countries.
Experience profiles differ little for men and women who work full-time in East Germany: they are flat in both cases. This contrasts sharply with the West- ern countries, where women’s profiles are flatter than men’s. Thus, although the average male-female wage gap is about the same in both parts of Germany (25 percent), the gap varies substantially depending on education and experi- ence, being much greater at high levels of experience in the United States and

425 East and West German Labor Markets
West Germany than in East Germany. One may suspect that this pattern is related to the fact that the labor force attachment of women is much greater in East Germany than in West Germany. On the other hand, the United States has a female labor force participation rate that is much higher than West Germany’s but even greater expansion in the male-female wage gap with experience.
Table 12.6 reports regression results with additional explanatory variables. Columns 1 and 3 add dummy variables for marital status and marital status interacted with gender. There is little effect of marital status on the earnings of either men or women in East Germany, while both West Germany and the United States have a large earnings differential between married men and women.
In column 2, we add a number of additional variables available on the East German data set. White-collar employees earn just 4 percent more than blue- collar workers. This contrasts with the large effects for the Western countries (on the order of 20 percent) and is probably a reflection of Communist ideol- ogy, which was biased against white-collar labor. Additionally, we find a 15 percent premium for workers who work on late shifts in East Germany. Such a positive premium has proved difficult to find with cross-sectional micro data
Table 12.5 Returns to Education: Women (standard errors in parentheses)
East Germany West Germany United States
Independent Variable (1) (2) (3) (4) ( 5 )
Intercept
Years of schooling
Completed apprenticeship
Master craftsman
Technical school
University
Experience
Experience squared (/loo)
R2
Sample size
5.589 (.014) ,085
(.001)
. . .
- ,033 (.001) .294
20,150
6.448 (.009)
,162 (.OW .357
(.016) ,394 (.OW ,582
(.010) .019
(.001)
- ,032
,292 20,150
(.001)
6.523 (.083) ,082
(.006)
. . .
. . .
,042 (.005)
- ,075 (.011) ,283
718
7.298 (.051)
,232 (.039) ,446
(.083) ,430
(.062) ,770
(.063) ,036
(.005)
- ,064 (.011) ,252
718
4.177 (.044) ,103
(.003)
. . .
. . .
,023 (.002)
-.037 (.OOS) ,270 3,821
Note: Dependent variable is log monthly earnings for East and West Germany and log weekly wage for the United States. For details on the samples, see the notes to table 12.1.

426 Alan B. Krueger and Jorn-Steffen Pischke
Table 12.6 Additional Earnings Regressions (standard errors in parentheses)
East Germany West Germany United States
Independent Variable (1) ( 2 ) (3) (4) ( 5 )
Intercept
Years of schooling
Experience
Experience squared (/loo)
Female
Married
Married females
White collar
Civil servant
Public sector
Federal
State and local
Late shift
Union
Black
Other nonwhite
Sample size R2
5.912 (.009) ,077
(.001) ,020
(.OW)
- ,036 (.001)
(.005) ,009
(.004) - ,043 (.005)
-.203
. . .
. . .
. . .
. . .
. . .
. . .
. . .
. . .
. . .
43,532 0.4 15
5.855 (.011) ,077
(.001) ,021
(.OOO)
~ ,038 (.001)
-.I95 (.005) ,014
(.004) - ,044 (.005) ,040
(.003) . . .
. . .
. . .
. . .
. I43 (.003) . . .
. . .
. . .
43,532 0.443
6.770 6.802 i.039) (.040) ,076 ,069
(.002) (.003) .042 ,042
(.002) (.002)
-.075 - ,074 (.005) (.005)
-.I74 - .244 (.022) (.022) .08 1 ,075
(.019) i.018) -.136 - . I 1 8 (.030) (.030) . . . .188
(.015) . . . ,025
(.027) . . . -.036
(.017)
. . . . . .
2,496 2,496 0.462 0.502
4.589 (.029) ,073
(.002) .025
(.001)
~ ,040 i.003) - ,220 (.015) ,162
(.014) -.175 (.019) ,203
(.011) . . .
. . .
,088 (.023)
-.079 (.014) . . .
,221 (.012) - .092 (.015) ,009
(.024) 8,118 0.391
Note: Dependent variable is log monthly earnings for East and West Germany and log weekly earnings for the United States. For further dteails on the samples, see the notes to table 12.1.
for Western countries and may reflect the emphasis on rules in the socialist system.
In summary, these regressions document several differences between the East German, West German, and U.S. wage structures. Nevertheless, the re- sults support Brown’s (1977, 43) conclusion, which is based on casual evi- dence: “The white-collared apart, the most remarkable feature of the compari-

427 East and West German Labor Markets
son between Soviet-type and Western pay structures is their extent of similarity.” We would add, however, that the lower level of residual wage dis- persion in East Germany is also a striking feature of the Soviet-type pay structure.
12.6 Analysis of the East German Labor Market in Transition
One question that immediately arises in studying the economic transforma- tion of the East German labor market is, How should the East German labor market be defined after unification? We choose to define the labor market on the basis of geographic location. Thus, former East Germans who migrated west or commute to work in the west are not included in our sample of eastern Germany. As a practical matter, this is of little significance because migrants and commuters make up only about 0.5 percent of our ~amp1e. l~ On the other hand, it is instructive to study separately former East Germans whom we ob- serve working in the western part of Germany. These workers provide a rough indication of how former East Germans would fare in the West German labor market, although one must be concerned about selective migration and com- muting.
Since so many east German workers were placed on short-time hours (18 percent of our sample in 1991), we include short-time workers in our anal- ysis. The German government subsidized short-time workers, who earned 63-68 percent of their previous pay. Firms were supposed to add another 22 percent to their pay, bringing short-time workers’ pay up to 85-90 percent of their previous level. In our sample, workers on short time worked 32.8 hours per week, on average, compared to 43.1 hours for workers on regular-time hours.
12.6.1 Wage Growth and Dispersion
We turn first to the growth of wages, which Akerlof et al. (1991) and others identify as the main source of the eastern German depression. Table 12.7 sum- marizes the rise in earnings in East Germany since 1988. The table is based on the Survey of Blue- and White-collar Households for 1988, retrospective earnings data from the SOEP-East for 1989, and current wage reports from the SOEP-East for 1990 and 1991. In spite of splicing together different wage se- ries, the 1988 and 1989 data (both years before unification) are remarkably similar, suggesting that the data are comparable. East German wages grew rap- idly between 1989 and 199 1. (The CPI increased by about 6 percent between 1988 and March 1991, so these wage changes can be thought of as mostly real
14. If we include the commuters and migrants in a log wage regression using 1990 data, when they were observed in eastern Germany, their average residual is 0.12. Given the small number of commuters and migrants, this finding suggests that they would not have a large influence on the estimated regression had they remained in eastern Germany.

428 Alan B. Krueger and Jorn-Steffen Pischke
Table 12.7 Summary of Monthly Earnings in Eastern Germany, 1988-91 (standard deviations are in parentheses)
Average Monthly Earnings Measured In:
Year Logs DM Coefficient of Variation: DM
1988 7.03 1,179.1 .30
1989 7.02 1,182.3 .32
1990 7.15 1,331.4 .31
1991 7.35 1,635.2 .35
~ 3 2 ) (359.0)
(.37) (382.8)
(.29) (410.4)
~ 3 2 ) (568.9)
Note: Data for 1989 have been inflated by 6 percent to adjust for bonus payments. The average bonus payment was 6 percent of total compensation in 1988 and 1990. Workers placed on short- time hours are included in 1989-91. 1991 figures exclude east Germans who migrated west or commute to work in the west; if these individuals are included, the mean of log earnings is 7.38 and the standard deviation .35.
changes.)I5 Between 1989 and 1990 the average monthly wage increased by 12.5 percent, and between 1990 and 1991 it increased by another 22.8 percent. Over the period 1989-91 wages grew by 38.3 percent. This growth is even more impressive in view of the fact that nearly one-fifth of workers were placed on short-time hours.
In spite of dramatic growth, wages in the east were still only about 40 per- cent of the west German level in 1991. Nevertheless, the east German real- wage growth stands in marked contrast to that of other former East-bloc coun- tries. For example, in the last quarter of 1991, real wages were lower by 43 percent in Bulgaria, 26 percent in Czechoslovakia, 8 percent in Hungary, 0.2 percent in Poland, and 20 percent in Romania relative to their 1990 level (see Boeri and Keese 1992). Although there was strong nominal wage growth in these countries, extremely high rates of inflation eroded real earnings. The unique relation between eastern and western Germany has clearly cushioned the transition to a market-based economy for East Germany.
For the subsample of individuals who were working in both 1990 and 1991, earnings grew by 24 percent. Wage growth was exceptionally high for individ- uals who changed jobs. Using longitudinal data from the SOEP-East, we can decompose the variability in individuals’ log wage growth between 1990 and 1991 according to the type of job change using the formula
15. One cautionary note is that, although the average CPI was relatively stable between 1988 and 1991, there were wide differences in the rate of inflation for many goods. For example, rental costs jumped 58 percent in January 1991, while food prices increased 15 percent, clothing and shoe prices decreased 30 percent, and furniture prices decreased 20 percent between 1989 and January 1991. The rapidly changing prices of consumer goods are likely to have distributional consequences that go beyond changes in the wage structure.

429 East and West German Labor Markets
where u2 is the total variance of the change in log wage, ut is the variance of the change in log wage for group i, p i is the fraction of the sample belonging to group i, ~1.; is the mean wage change for group i, and p, is the change in the grand mean.
Table 12.8 contains the results of this decomposition. The overall variance in log earnings growth for individuals in East Germany (.056) during this pe- riod of dramatic transformation is lower than the level that Abowd and Card (1989) report for the United States (over .12) but higher than the typical level that we find for West Germany using the SOEP for 1984-89 (.036>.16 (In terms of standard deviations, the figures are .24 for eastern Germany, .35 for the United States, and .19 for West Germany.)
Nearly 85 percent of employed East Germans in 1990 and 1991 remained employed by the same firm, and 77 percent remained on the same job. Ten percent of east German workers reported changing jobs without any interven- ing unemployment. Over two-thirds of the total variance in log earnings growth is due to individuals who remained on the same job. Job changers who did not suffer intervening unemployment contributed 20 percent of the total variance.
Looking cross-sectionally, it is clear from table 12.7 above that earnings variability increased in eastern Germany following unification. The variance of the level of monthly earnings (in deutsche marks) increased each year since 1988 and was 150 percent greater in 1991 than in 1988. Notice also that the coefficient of variation of earnings increased from .30 to .35, in spite of the large increase in mean earnings. However, the standard deviation of log monthly earnings, which was .32 both in 1988 and in 1991, shows no clear trend. The level of wage dispersion in eastern Germany still has a long way to go before it reaches the West German level. In West Germany, the coefficient of variation of monthly earnings was consistently around .44 between 1984 and 1989.
Table 12.9 gives the ratio of various percentiles of the earnings distribution relative to the median for eastern Germany, West Germany, and the United States in selected years. The wage distribution in eastern Germany was notably stable between 1988 and 1990, but the top 20 percent of wage earners gained significantly on the median earner in 199 1. The increase in earnings dispersion in East Germany occurred mainly at the upper tail of the wage distribution. On the other hand, the wage structure in West Germany was conspicuously stable in the 1980s, especially compared to the United States.
To explore changes in the east Germany wage structure further, Figure 12.6 presents a graph of earnings growth between 1988 and 1991 for each percentile of the earnings distribution. That is, the figure gives the percentage wage in- crease for a worker occupying each percentile of the wage distribution in 1991
16. The U.S. figure is based on log annual earnings.
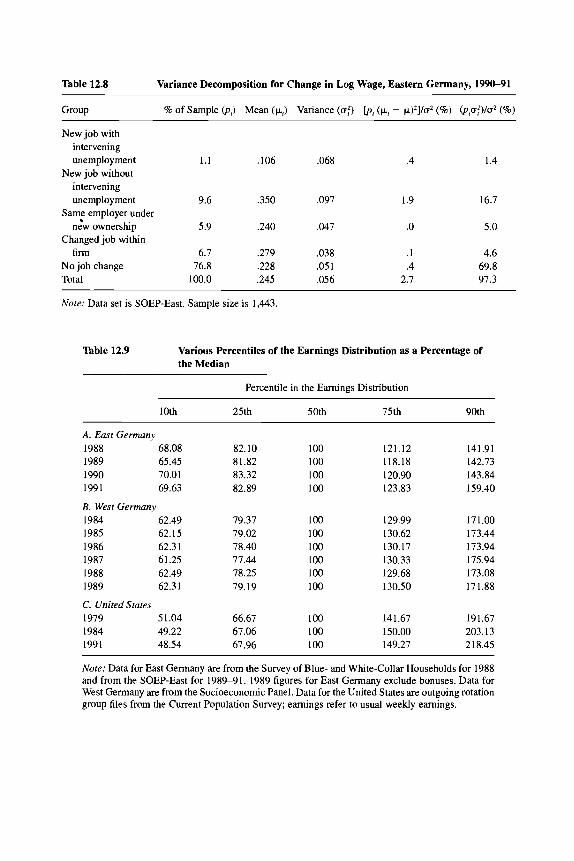
Table 12.8 Variance Decomposition for Change in Log Wage, Eastern Germany, 1990-91
New job with intervening unemployment 1.1 .lo6 ,068 .4 1.4
New job without intervening unemployment 9.6 .350 ,097 1.9 16.7
Same employer under new ownership 5.9 ,240 ,047 .O 5.0
Changed job within firm 6.7 .279 ,038 . I 4.6
No job change 76.8 .228 .05 1 .4 69.8 Total 100.0 ,245 ,056 2.7 97.3
Note: Data set is SOEP-East. Sample size is 1,443.
Table 12.9 Various Percentiles of the Earnings Distribution as a Percentage of the Median
Percentile in the Earnings Distribution
10th 25th 50th 75th 90th
A. East Germany 1988 68.08 82.10 I00 121.12 141.91 1989 65.45 81.82 100 118.18 142.73 1990 70.01 83.32 100 120.90 143.84 1991 69.63 82.89 100 123.83 159.40
B. West Germany 1984 62.49 79.37 100 129.99 171.00 1985 62.15 79.02 100 130.62 173.44 1986 62.3 1 78.40 100 130.17 173.94 1987 61.25 77.44 loo 130.33 175.94 1988 62.49 78.25 100 129.68 173.08 1989 62.3 1 79.19 100 130.50 171.88
C. United States 1979 51.04 66.67 100 141.67 191.67 1984 49.22 67.06 100 150.00 203.13 1991 48.54 67.96 100 149.27 218.45
Note: Data for East Germany are from the Survey of Blue- and White-collar Households for 1988 and from the SOEP-East for 1989-91. 1989 figures for East Germany exclude bonuses. Data for West Germany are from the Socioeconomic Panel. Data for the United States are outgoing rotation group files from the Current Population Survey; earnings refer to usual weekly earnings.

431 East and West German Labor Markets
‘0
Fig. 12.6 Wage increases between 1988 and 1991 by percentile Sources: 1988 Survey of Blue- and White-Collar Households and 1991 wave of the Socioeconomic Panel-East.
relative to a worker occupying the same percentile of the distribution in 1988. It is quite clear that the increase in earnings variability occurred primarily be- cause of an expansion of the right-hand tail of the distribution: the top decile had extraordinary income growth. Recall that figure 12.2 above showed that the right-hand tail of the East German wage distribution in 1988 was unusually short compared to West Germany and the United States.
The left-hand tail of the eastern German wage distribution experienced about average wage growth after unification. This finding is significant because one may suspect that the Communist government in East Germany artificially raised the earnings of low-income workers and that the move to a market econ- omy would have had a greater effect on the low-wage earners. There are two explanations for why the low-wage earners were not especially hurt by unifi- cation. First, figure 12.2 indicates that there was not a great disparity in the left-hand tails of the wage distribution between East and West Germany just before unification. Second, after unification, union contracts and government policies may be maintaining low-skill workers’ wages above their equilibrium level in eastern Germany. As shown below, the fact that the unemployment rate is now much higher for less educated workers in eastern Germany suggests that there may be some merit to this view.
Table 12.10 investigates the extent of year-to-year mobility in workers’ earn- ings in eastern and western Germany.” Workers are cross-classified by quintile
17. The period between 1988 and 1989 coincided with an expansion in West Germany. Mobility was only slightly higher between 1984 and 1985, which was a recessionary period in West Germany.

432 Alan B. Krueger and Jom-Steffen Pischke
Table 12.10 'Ransition Matrix by Quintile of the Earnings Distribution
Eastern Germany, 1990-91: Earnings in 1991 ~~~ ~
Bottom Second Third Fourth TOP
Earnings in 1990: Bottom .581 ,210 ,114 ,066 ,028 Second ,256 ,369 ,239 ,107 .03 1 Third ,107 ,234 .308 ,276 ,072 Fourth .045 ,117 ,242 ,314 ,255 TOP ,010 ,069 .097 ,210 ,614
West Germany, 1988-89: Earnings in 1989
Earnings in 1988: Bottom ,790 ,167 .024 ,011 ,007 Second ,158 ,625 ,171 .045 ,000 Third ,042 .181 ,601 ,172 ,004 Fourth .007 .027 ,196 ,650 ,120 TOP ,002 ,000 .007 .I23 ,869
Note; Data are from the Socioeconomic Panels and refer to full-time employed men and women. Earnings are gross monthly earnings plus one-twelfth of annual bonuses.
of the earnings distribution each year. There is greater earnings mobility in eastern Germany than western Germany, especially for workers in the middle of the earnings distribution. In 199 1, nearly 40 percent of the top fifth of wage earners in eastern Germany were not in this income class in the preceding year, whereas in West Germany only about 13 percent of workers joined the top 20 percent in a typical year.
In table 12.11 we summarize the characteristics of the top 10 percent of wage earners in eastern Germany in 199 1, the group that has undergone the most significant change in relative earnings since unification.'* Compared to the rest of wage earners, the top 10 percent is much more likely to hold profes- sional or executive positions, to have higher education, to work in private firms, to live in a large city (e.g., Berlin, Leipzig, Dresden), to be self-employed, and to work in a newly founded firm. By and large, these are characteristics that are associated with top wage earners in the west. About half the workers in the top 10 percent of the wage distribution in 1991 were in the top 10 percent of the wage distribution in 1990, and the average percentile ranking was almost in the top 20 percent. Earnings grew by over 50 percent between 1990 and 1991 for the top 10 percent of earners, compared to 25 percent for all others. Since the top 10 percent of wage earners still have some distance to go until they are as relatively successful in the east as in the west, the evolution of this group will be especially interesting to track in the future.
18. We included self-employed workers in table 12.11 because of interest in entrepreneurship. Self-employed workers are excluded from all other results.

433 East and West German Labor Markets
Table 12.11 Means of Selected Characteristics of Top 10 Percent and Bottom 90 Percent of Wage Earners, Eastern Germany, 1991
Characteristic Top 10% Bottom 90%
Gross monthly earnings
% of compensation due to bonus Average percentile rank in 1990 distribution Earnings growth, 1990-91 (9%)
Weekly hours
Female (%)
Age
Years of tenure
Years of schooling
Technical school (%) University (%) Short time (%) White collar (%) Professional ("r) Executive (%) Self-employed (%) Private firm (70) Works in newly founded firm (5%) Firm size > 200 (%) City > 100,000 (%) Sample size
2,972 (757)
78.8 52.2
(73.8) 49.5
(10.9) 21.7 43.0 (9.6) 12.3
(12.1) 14.4 (1.7) 32.2 30.7 4.8
72.0 47.6 9.5
12.2 68.8 9.5
51.3 48.7
1.96
189
1,502 (359)
1.59 46.8 25.7
(31.1) 41.8 (8.2) 47.9 38.5
(10.5) 10.8
(10.4) 12.5 (2.2) 17.5 10.1 18.1 48.9 14.1 0.5 3.3
54.9 3.1
53.2 27.7
1,684
Note: Standard deviations are in parentheses. Except for firm size and tenure, the difference be- tween the top 10 percent and the bottom 90 percent is statistically significant at the 1 percent level for each characteristic.
12.6.2 Wage Regressions for Eastern Germany
Table 12.12 presents simple wage regressions using each cross section of the SOEP-East survey. For comparison, the first column reports estimates for East Germany in 1988 and the second column estimates for West Germany in 1988. The 1988 East German survey yields coefficient estimates and an R2 that are very close to the SOEP-East for 1989, again suggesting that the 1988 East German survey is reasonably representative of the workforce."
There are a number of interesting changes in the wage structure in East Germany between 1988 and 1991. First, the rate of return to education fell
19. Oddly, the experience profile is steeper in 1989 than in 1988. On further investigation, we found that this result is due to a few outliers with low experience. The other coefficients are not greatly affected if these outliers are deleted.

Table 12.12 Earnings Equations before and after Unification (standard errors are in parentheses): Dependent Variable, Log Monthly Earnings
East Germany, West Germany, East Germany, East Germany, Eastern Germany, Easterners in West, Independent Variable 1988 1988 1989" 1990 1991 1991b
Intercept
Years of schooling
Experience
Experience squared (/1W
Female
RZ
u, Sample size
-.035 (.001) - ,234 ( . o w ,414 ,241
43,532
- ,077
- .25 1 ( .on) ,457 .323 2,496
5.777 C.041) ,074
(.003) ,037
- ,063 (.005) - ,224 (.012) .414 ,286 2,213
- ,028 ( .04)
-.208 (.010) ,410 ,224 2,246
6.481 ( .045) ,062
(.003) .014
(.002)
- ,020 (.ow
-.198 (.013) ,284 ,272 1,795
7.151 (.217) .065
(.017) .004
(.013)
-.010 (.037)
-.389 (.084) ,273 ,355
117
"Wages have been inflated by 6 percent to adjust for bonuses in 1989. bEasterners in the west includes 20 east Germans who migrated to western Germany and 97 east Germans who commute to work in western Germany.

435 East and West German Labor Markets
160
140
120
100 0
m r f 0)
.- c
(I) 80
4 60
40
20
0 No Training
I8 90 91
rpprentice Master Tech. School Jniversity
Educational Level
Fig. 12.7 Education wage differentials, 1988-91 Sources: 1988 Survey of Blue- and White-collar Households and Labor Markets Monitor for the New German States (Bielinski and von Rosenbladt 1991). Note: Apprenticeship = 100
from .077 to .062, suggesting that education attained under the Communist system is less valuable in the transition period. Official government statistics on earnings, which are summarized in figure 12.7, also show fairly stable edu- cation differentials.20 According to these data, earnings increased by between 31 and 37 percent between 1988 and July 1991, depending on education level. Workers with no training experienced the most earnings growth, followed by university graduates.
Second, the already flat experience profiles in East Germany have become slightly flatter by 1991. We also find very low returns to seniority. Evidently, experience in the Communist labor market is now of less value. Third, the male-female wage gap has narrowed. The labor force participation rate for women in East Germany fell, moving in the direction of West German women, but the rate fell by almost as much for men. Fourth, the explanatory power of
20. The underlying data are from Bielinski and von Rosenbladt (1991) and our tabulations of the 1988 East German survey.

436 Alan B. Krueger and Jorn-Steffen Pischke
the regressions has dropped considerably, with the R2 falling from 41 to 28 percent between 1990 and 1991. Finally, the residual variance increased by 47 percent (from .050 to .074) between 1990 and 1991. These findings suggest that there have been major changes in the valuation of individuals’ characteris- tics since unification.
In other specifications, we have added a dummy variable indicating whether a worker is on short-time hours and a dummy indicating white-collar status. Workers on short-time hours earn about 23 percent less (t-ratio = - 12) than full-time workers, other things being equal. This differential is about what one would expect since firms are required to supplement short-time workers’ pay to 85-90 percent of their previous level. Including the short-time dummy re- duces the return to education slightly and increases the male-female wage gap by about four points.
Interestingly, white-collar workers in the east now earn an 11 percent wage premium over blue-collar workers (t-ratio = 6.2). This may be contrasted with the 4 percent white-collar premium in East Germany in 1988 and the 19 per- cent premium in West Germany in 1988 that we document in table 12.6 above. As far as white-collar work is concerned, the wage structure in East Germany is approaching that in the west.
We have also examined the evolution of industry wage differentials in east- em Germany. Specifically, we added (broad) industry dummy variables to the wage regressions in table 12.2 and estimated industry wage differentials for East and West Germany. We then took deviations of each industry coefficient from the average, assigning a differential of zero to the omitted industry. To
West Germany 1989 West Germony 1989
OLS Regression Line East = 0 oO+ 0 I I West R- square = 0 07 East = 0 00 + 0 51 West R- square = 0 I9
I0041 I 0 301 I0 101(030)
Fig. 12.8 Comparison of industry wage differentials Sources: 1989 wave of the Socioeconomic Panel-West and 1990 and 1991 waves of the Socioeconomc Panel-East.

437 East and West German Labor Markets
illustrate the evolution of industry wage differentials in eastern Germany rela- tive to those in western Germany, figure 12.8 presents graphs of the east Ger- man differentials in 1990 or 1991 versus the West German differentials in 1989. The figures are striking. In 1990, east German industry wage differentials were extremely compressed, ranging less than 15 percent from highest to lowest paid industry; in West Germany the range was about 30 percent. Moreover, the correlation between industry wage differentials in the east and the west was statistically insignificant in 1990.
By 1991, the east German industry wage differentials were far more dis- persed, with a range of 40 percent between the highest- and the lowest-paying industry. Finance, insurance, and real estate increased in position relative to the mean industry by 25 percentage points, while relative pay in the service industry fell by 10 points. Moreover, the pattern of industry differentials in eastern Germany now more closely resembles the west German pattern. The rapid change in the eastern interindustry wage structure is probably due, in large part, to the German unions' success in negotiating industry-level con- tracts that follow a similar pattern to western contracts.
12.6.3 Easterners Who Work in the West
A small number of eastern Germans surveyed in the SOEP-East migrated to the west since the initial wave of the survey was conducted.*' For a sample of twenty migrants, we have complete wage and demographic information. An additional ninety-seven sampled individuals commute to work in the west but live in the east. These 117 easterners who work in the west have virtually the same level of education as easterners who work in the east but are about eight years younger, are much more likely to be men, are less likely to hold white- collar jobs (37 vs. 53 percent), and have much lower tenure (0.8 vs. 11 years). Bielinski and von Rosenbladt (1991) estimate that 28 percent of commuters received on-the-job training in a three-month period in 199 1, as compared to 17 percent of those who do not commute.
The average easterner who works in the west earns DM 2,990 per month, which is 83 percent more per month than the average for easterners who work in the east but about 15 percent less than the average west German. The rela- tively small gap in earnings between easterners who commute or migrated to the west and native west Germans is noteworthy because the commuters/mi- grants have extremely low tenure and do not possess other observable charac- teristics that are particularly highly rewarded in the west German labor market.
Column 6 of table 12.12 presents the estimated log earnings equation for the small sample of eastern Germans who work in the west. Although the esti- mates are extremely imprecise, they reveal some interesting patterns.22 First,
21. For a landmark study of migration between eastem and western Germany, see Akerlof et
22. We found qualitatively similar results for a larger sample of commuters using data from the al. (1991).
1991 Labor Markets Monitor Survey.
438 Alan B. Krueger and Jorn-Steffen Pischke
the return to education for workers who were educated in the east but work in the west is relatively large (.065). Although some caution is warranted because of sampling variance, this finding nonetheless suggests that the high level of education that East Germans received under the Communist system will re- ceive a reasonable payoff as the east approaches a Western-style market econ- omy. Second, the experience profile is virtually flat, again suggesting that work experience gained under the Communist system is of little value. Third, the male-female wage gap is greater for easterners who work in the west. Finally, the residual variance in earnings is quite close to the level for West Germany in 1988.
12.6.4 Unemployment
An important issue in addition to wage structure changes concerns the evolu- tion of unemployment in eastem Germany. Unemployment in eastern Germany soared after unification, as it has in other former East-bloc countries. The prob- ability of being unemployed in eastern Germany is inversely related to educa- tion level. We calculate that, in 1991, the unemployment rate was 6 percent for university graduates, 2 percent for master craftsmen, 10 percent for workers with apprenticeship training, and 33 percent for workers with no postsecond- ary training.23 Similarly, workers with a low level of education were also much more likely to be placed on short-time hours. There was hardly any unemploy- ment in 1988 in East Germany. The unemployment rates by education level in West Germany are much lower, especially at the low end of the education distribution. For example, Abraham and Houseman (chap. 11 in this volume) report that the unemployment rate in West Germany for workers with no post- secondary training in 1989 is 11.6 percent.
The high rate of unemployment for low-educated workers suggests that their wage rate is above the current equilibrium level. On the other hand, the more moderate rates of unemployment for highly skilled workers suggest that the wage structure is not far out of line for these workers. We note, however, that government policies to reduce unemployment (e.g., short-time work subsidies) may mask substantial imbalances in supply and demand.
We also note that, if the unemployed are very different from the employed in terms of unobserved characteristics, truncation bias may affect our regression estimates. On the other hand, this is not likely to be a serious problem because much of the unemployment is due to plant closings and mass layoffs, which affect a wide cross section of workers. Furthermore, we find that the results are qualitatively similar if we estimate the regressions for eastern Germany using just the subsample of individuals who were continuously employed between 1989 and 1991. This finding suggests that the differences in the wage structure that we document between 1989 and 1991 are not due to the changing compo- sition of the samples.
23. We also find that the unemployment rate is almost twice as high for women as it is for men (13 vs. 7.6 percent) and that the probability of being unemployed increases with age.
439 East and West German Labor Markets
12.7 Summary and Conclusion
We can summarize our main conclusions as follows. 1. In 1988, the wage structure was more compressed in East Germany than
in West Germany, even though West Germany has low wage variability by U S . standards.
2. In spite of the considerable wage compression in East Germany, education was relatively highly rewarded. The monetary payoff to a year of education was remarkably similar in East and West Germany. Furthermore, East Germans who migrated or commuted to western Germany after the collapse of East Ger- many appear to earn a comparable return to their education as native West Germans. Since East Germans are highly educated, this finding suggests that the unified Germany will have considerably more human capital.
3. Average earnings of eastern Germans grew rapidly following unifica- tion-by as much as 30-40 percent. Surprisingly, this great leap in wages oc- curred without unusually high variability in earnings growth across individu- als. The cross-sectional variance in earnings growth in eastern Germany in 1990-91 was below the typical level for the United States but above the typical level for West Germany.
4. Wage regressions for 1990 and 1991 already show signs that the East German wage structure is quite different than it was in 1989. White-collar workers in eastern Germany now earn a substantial premium, although not as large a premium as white-collar workers earn in the west. Similarly, the indus- try wage structure in eastern Germany is approaching the West German struc- ture. The remarkably low level of dispersion in earnings that we documented for East Germany in 1988 is gradually increasing, primarily because the right- hand tail of the distribution is stretching out. In addition, exDerience profiles have flattened out, suggesting that work experience gained under the Commu- nist system is now of little value.
5 . Eastern Germans who are observed working in western Germany earn almost as much as native West Germans, and, with the major exception of work experience, they appear to earn similar payoffs to their characteristics as West Germans.
6. The wage structure in eastern Germany, however, still has some distance to go until it mirrors the wage structure in western Germany. In particular, we expect that it will be a long time until the experience-earnings profile becomes as steep in eastern Germany as it is in the west. In addition, industry and occu- pation premiums are still compressed in the east relative to the west. Although wages served mainly a bookkeeping function in the former East Germany, they now serve as signals to firms and workers. The effect of the remaining differ- ences in the wage structures on migration and capital flows between eastern and western Germany seems to us to be a worthy topic of future study.
We think that the facts documented in this paper are consistent with the view that German unions and government policies have maintained wages of low- skill workers above their current equilibrium level. Unions have imposed a

440 Alan B. Krueger and Jorn-Steffen Pischke
wage structure that more closely mirrors the western wage structure. Govern- ment policy has protected low-skill workers. The Treuhandanstalt has pursued a policy of deliberately seeking new owners who would maintain employment, and the introduction of West German labor law has made it difficult to lay off workers or to deviate from union contracts. As a consequence, after unification high-income earners improved their position relative to middle-income earn- ers, but low-income earners did not lose any ground relative to middle-income earners. The unemployment rate soared for low-skill workers, suggesting that employers’ demand for low-skill workers is low at their current level of remu- neration.
What will happen in the future? The German government and employers are providing a great deal of training to former East German workers, which should eventually improve the productivity and employment situation of less educated workers. Furthermore, more and better capital is flowing into eastern Germany, which would further raise productivity and sustain high wages for low-skill workers. Finally, our findings that commuters and migrants are doing quite well in the western German labor market and that the return to education has remained relatively high in eastern Germany suggest that worker skills are not the main problem in eastern Germany. Instead, outdated technology, insufficient capital, and inefficient management may be the main sources of low wages and productivity in the east. In any event, we conclude that the wage structure in eastern Germany has made substantial progress toward a new equilibrium that will eventually more closely resemble the West German wage structure.
Appendix
Description of Education Systems in the Germanies
Primary school in West Germany starts at the age of six and comprises the first four grades. After grade four, the secondary school system branches into three alternative routes. The most basic branch (Huuptschule) lasts up to grade 9 (or grade 10 in some states) and combines general education with certain preparatory courses for more technical or clerical vocations. It is supposed to lead to a subsequent apprenticeship or vocational training. The middle branch (Reulschule) has a different vocational focus than the Huuptschule and offers a larger choice between liberal arts classes and courses with a more practical orientation. This branch ends after grade 10 and may lead to an apprenticeship, further education in vocational schools, or a switch into Gymnasium, which is the third branch of the secondary school system.
The Gymnasium is the most intellectually oriented track and is designed to provide a thorough education in the liberal arts that prepares students for fur-

441 East and West German Labor Markets
ther academic training. Gymnasium ends after grade 13 with a general exam (Abitur) that serves as a prerequisite for access to the university system. The last two years of Gymnasium are roughly comparable to the first years of col- lege in the United States. Since the 1970s, some states have introduced inte- grated secondary schools (Gesamrschulen) combining all three branches and leading to the various secondary school degrees.
University training in West Germany is completely focused on the area of specialization and ends in a Diploma. The average time to completion was 6.9 years in 1987 (Scheuer 1990) and has increased even more since. In addition to academic universities, there is another kind of postsecondary institution known as Fachhochschulen. These institutions offer a more practically ori- ented training, usually in engineering or business disciplines; they are roughly comparable to professional colleges in the United States. Furthermore, the courses of study are generally shorter than in the universities (the average length was 4.4 years in 1987). Fachhochschulen can be entered after the twelfth grade in Gymnasium or after completion of a Fachoberschule. The latter comprises grades 11 and 12 and can be entered with a Realschule degree or the equivalent. It combines practical job-oriented training in workshops with more general education.
Vocational training in West Germany consists usually of an apprenticeship in a business firm combined with part-time schooling at a state run Be- rufsschule. Apprenticeships can last for two to four years, during which time apprentices earn a basic allowance from their employer. Berufsschule provides theoretical foundations for the profession in which an apprentice has trained as well as liberal arts education. A completed apprenticeship is a prerequisite to many skilled jobs in industry, administration, and the service sector. Two to three years after completion, trained workers can enroll in a two-year Fachschule, which enables them to become master craftsmen in their field.
East Germany
Owing to a series of reforms, the education system in East Germany is sim- pler. The main building block is the integrated Polytechnische Oberschule (POS), which is compulsory for everyone up to grade 10. Its quality and scope are generally regarded as comparable to the West German Realschule. Further secondary training is provided in the Erweiterten Obersrufe (EOS) for two more grades, leading to the East German Abitul: Access to the EOS is condi- tional on grades and political factors. In addition, social diversity in student representation is a consideration in admission to the EOS.
Unlike in West Germany, admission to a university is conditional on an addi- tional entry exam. Admitted are EOS graduates, graduates of Fachschulen (see below), young workers who completed a three-year apprenticeship with Abitur, and graduates of the preparatory “Worker and Peasant Faculties” (for details, see Glaessner 1985). These indirect routes to university serve the purpose of creating a student body that reflects the social structure of the population and

442 Alan B. Krueger and Jorn-Steffen Pischke
are quantitatively much more important than in the west. Since the 1970s, three-quarters of the students seeking admission to a university have had some work experience or completed their military training. This has led to the grad- ual introduction of a one-year practical training requirement for EOS graduates without professional training starting in 1976, basically lengthening their edu- cation by a year (Panorama DDR 1984).
Admissions to the various fields are regulated by state plan reflecting the prospective needs of a profession. This planning was apparently not always fully effective: many university graduates were overqualified for their jobs in the 1970s, which led to a reduction in the number of admissions (Scheuer 1990). This trend was reversed somewhat in the 1980s. Most university pro- grams in East Germany are designed to be completed in four years; a one-year extension is granted only in exceptional cases. Only about three-quarters of university courses are devoted to the major field of study; the rest of the cumc- ulum is taken up by courses in Marxism-Leninism, languages, and sports.
Fuchschulen in East Germany are postsecondary institutions comparable to the West German Fuchhochschulen. They mainly train engineers and technical experts and, since the 1970s, nurses. Fuchschulen have three-year programs. They admit graduates of the EOS as well as young men and women who have completed practical training.
Like in the west, vocational training in the east consists of a dual education combining an apprenticeship with vocational school (Berufsschule). These schools are usually part of the enterprise offering the apprenticeship. Most ap- prenticeship programs last two years.
Derivation of Continuous Years of Schooling Variable
For the United States, years of school completed is collected directly in the Current Population Survey. For East Germany and West Germany, years of schooling is inferred from the worker’s degree.
Education in our 1988 East German survey is measured in six discrete cate- gories. The groups are less than tenth grade, completed tenth grade at a POS, apprenticeship training, master craftsmen, technical school (Fuchschule), and university. Unfortunately, this is a rather coarse grouping; in particular, second- ary school degrees and postsecondary qualifications are not coded separately. We report results with four education dummies as well as for a continuous schooling measure. The latter measure was constructed as follows. Nine years of schooling were assumed for workers who did not complete school, ten years if tenth grade was completed. The first group is rather unimportant and was lumped together with the second in the dummy variable regressions (this will be the base group). Two years of apprenticeship training was assumed, al- though a basic allowance is paid during this time by the employer. Four years of training was assumed for master craftsmen. Technical school lasts for three years and requires completion of the EOS or a two-year practical training, yielding a total of fifteen years of education. Finally, university courses last

443 East and West German Labor Markets
usually four years beyond EOS, yielding a total of sixteen. Since the mid- 1970s, an additional one-year practical training requirement was introduced for EOS graduates. Thus, we assumed an additional year of schooling for ev- eryone with university education who is under age thirty.
For the West German survey, we have more complete information on educa- tional attainment. In particular, secondary school degrees and further training are coded separately. Education categories are formed as follows. Anyone who does not report any postsecondary training becomes part of the base group. The second group comprises everybody who completed an apprenticeship, Be- rufsfachschule, or schools for public-sector occupations. The third group com- prises graduates of Fachschulen and anyone who reports holding a position as master craftsman. The next group includes graduates of Fuchhochschulen and everyone who went to nursing school since this group has been trained at East German Fuchschulen since the 1970s. University graduates form the last group.
The continuous schooling measure was constructed using the information on both secondary school degree and postsecondary training. For the group with no postsecondary education, the number of years to complete secondary school was used. Ten years of education were assumed for the category re- porting other degrees (largely special schools) and nine years for anyone with no secondary degree. For completed apprenticeship, Berufsfuchschule, public- sector training, and nursing schools, two years were added. For graduates of Fuchschulen, 3.5 years were added since they must complete an apprentice- ship, which can last for one or two years. We assumed Fuchhochschule to last four years. It can be reached by a variety of different routes. For graduates with Abitur or Fuchhochschulreife, thirteen and twelve years of secondary school were used. For graduates of Hauptschule and Reulschule, three years of schooling beyond secondary school were assumed before Fachhochschule can be entered. Six years of university training were assumed, yielding a total of nineteen years for everyone with Abitul: We used twenty years for everyone who does not report Abitur since they probably reached university on a more roundabout route, for example, by attending Fuchhochschule first.
Some of our assumptions may be debatable. For example, it is unclear whether for a certain degree only the minimum number of years necessary should be counted or a higher number if a more roundabout route was chosen. Helberger (1988) reviews the German literature and discusses these issues in detail without reaching a clear conclusion.
References
Abowd, John M., and David Card. 1989. On the covariance structure of earnings and hours changes. Econornetrica 57:411-45.

444 Alan B. Krueger and Jorn-Steffen Pischke
Akerlof, George A., Andrew K. Rose, Janet L. Yellen, and Helga Hessenius. 199 1. East Germany in from the cold: The economic aftermath of currency union. Brookings Papers on Economic Activity, no. 1:l-87.
Atkinson, Anthony B., and John Micklewright. 1992. Economic transformation in East- ern Europe and the distribution of income. Cambridge: Cambridge University Press.
Bellmann, Lutz, Saul Estrin, Hartmut Lehmann, and Jonathan Wadsworth. 1992. The eastern German labor market in transition: Gross flow estimates from panel data. Discussion Paper no. 102. London: London School of Economics, Centre for Eco- nomic Performance.
Bergson, Abraham. 1984. Income inequality under Soviet socialism. Journal of Eco- nomic Literature 22: 1052-99.
Bielinski, Harald, and Bernhard von Rosenbladt. 1991. Arbeitsmarktmonitor fur die neuen Bundeslander: Umfrage 1990/1991 Tabellenband. Beitrage zur Arbeitsmarkt und Berufsforschung 148.1-148.3. 3 vols. Nurnberg: Institut fur Arbeitsmarkt- und Berufsforschung.
Bispinck, Reinhard, and WSI-Tarifarchiv. 199 1. “Alle D h m e gebrochen”? Die Tarif- politik in den neuen Bundesliindern in 1. Halbjahr 1991. WSI-Mitteilungen
Blanchflower, David G., and Richard B. Freeman. 1992. Unionism in the United States and other advanced OECD countries. In Labor market institutions and the future role ofunions, ed. Mario F. Bognanno and Moms M. Kleiner. Oxford: Blackwell.
Boeri, Tito, and Mark Keese. 1992. Labour markets and the transition in Central and Eastern Europe. OECD Economic Studies 18: 133-63.
Brown, Henry Phelps. 1977. The inequality of pay. Oxford: Oxford University Press. Burda, Michael, and Jeffrey Sachs. 1988. Assessing high unemployment in West Ger-
many. World Economy 11543-63. Fiihr, Christoph. 1989. Schulen und Hochschulen in der Bundesrepublik Deutschland.
Studien und Dokumentationen zur Deutschen Bildungsgeschichte, vol. 39. Co- logne: Bohlau.
Glaessner, Gert-Joachim. 1985. Universitaten und Hochschulen. In DDR Handbuch, vol. 2, ed. Bundesministerium fur Innerdeutsche Beziehungen. Cologne: Verlag Wis- senschaft und Politik.
Hauser, Richard. 1991. Die personelle Einkommensverteilung in den alten und neuen Bundeslandern vor der Vereinigung-Probleme eines empirischen Vergleichs und der Abschatzung von Entwicklungstendenzen. University of Frankfurt. Typescript.
Helberger, Christof. 1988. Eine Uberpriifung der Linearitatsannahme der Humankapi- taltheorie. In Bildung, BeruJ Arbeitsmarkt, ed. Hans-Joachim Bodenhofer. Berlin: Duncker & Humblot.
Krause, Peter, and Johannes Schwarze. 1990. Die Einkommensstichprobe in Arbeiter- und Angestelltenhaushalten in der DDR vom August 1988-Erhebungskonzeption und Datenzugriff. Discussion Paper no. 11. Berlin: Deutsches Institut fur Wirtschaftsforschung.
Mincer, Jacob. 1974. Schooling, experience and earnings. New York: National Bureau of Economic Research.
Panorama DDR. 1984. Students and colleges: Higher education in the German Demo- cratic Republic. Dresden: Zeit im Bild.
Scheuer, Markus. 1990. Ausbildung und Qualifikation der Arbeitskrafte in der DDR. RWI-Mitteilungen 41 :67-79.
Schmidt, Christoph M. 1991. Empirical analyses of the German labor market: Unions, unemployment, and wages. Ph.D. diss., Princeton University.
Schwarze, Johannes. 1991a. Ausbildung und Einkommen von Mannern. Einkommens-
44~466-78.

445 East and West German Labor Markets
funktionsschatzungen fur die ehemalige DDR und die Bundesrepublik Deutschland. Mitteilungen aus der Arbeitsmarkt- und Berufsforschung 24:63-69.
. 1991b. Einkommensverlaufe in der DDR von 1989 bis 1990-Unbeobachtete Heterogenitat und erste Auswirkungen der marktwirtschaftlichen Orientierung. In Lebenslagen im Wandel-Zur Einkommensdynamik in Deutschland seit 1984, ed. Ulrich Rendtel und Gert Wagner. Frankfurt and New York: Campus.
Siebert, Horst, and Holger Schmieding. 1992. Restructuring industry in the GDR. In European industrial restructuring in the 1990s, ed. Karen Cool, Damien Niven, and Ingo Walter. New York: New York University Press.
Statistisches Amt der DDR. 1990. Ubersicht iiber die regelmafiigen reprasentativen Be- volkerungsbefragungen des Statistischen Amtes der DDR. Berlin. Typescript.
Stephan, Helga, and Eberhard Wiedemann. 1990. Lohnstruktur und Lohndifferenzier- ung in der DDR: Ergebnisse der Lohndatenerfassung vom September 1988. Mittei- lungen aus der Arbeitsmarkt- und Berufsforschung 2330-62.
VeEemik, Jig. 199 1. Earnings distribution in Czechoslovakia: Intertemporal changes and international comparison. European Sociological Review 7:237-52.
Vortmann, Heinz. 1985. Geldeinkommen in der DDR von 1955 bis zu Beginn der ach- ziger Jahre. Deutsches Institut fur Wirtschaftsforschung, Beitrage zur Struktur- forschung, vol. 85. Berlin: Duncker & Humblot.
Waterkamp, Dietmar. 1987. Handbuch zum Bildungswesen der DDR. Berlin: A. Spitz.

This Page Intentionally Left Blank