a comparative analysis 2011 update
TRANSCRIPT

Research Department Minnesota House of Representatives
May 2015
Major State Aids and Taxes A Comparative Analysis
2011 Update
The Research Department of the Minnesota House of Representatives is a nonpartisan professional office serving the entire membership of the House and its committees. The department assists all members and committees in
developing, analyzing, drafting, and amending legislation.
The department also conducts in-depth research studies and collects, analyzes, and publishes information regarding public policy issues for use by
all House members.
Research Department Minnesota House of Representatives
600 State Office Building, St. Paul, MN 55155 651-296-6753
May 2015
Major State Aids and Taxes A Comparative Analysis
2011 Update
This report presents a comparative analysis of the major state aids and taxes in Minnesota. It is the latest edition of this report, which has been prepared for over 20 years. Previous updates are available on the House Research website.
This report was prepared by Nina Manzi, legislative analyst in the House Research Department. Questions may be addressed to Nina at 651-296-5204. Ellen Dehmer and Scott Kulzer provided graphics, production, and research assistance.
Copies of this publication may be obtained by calling 651-296-6753. This document can be made available in alternative formats for people with disabilities by calling 651-296-6753 or the Minnesota State Relay Service at 711 or 1-800-627-3529 (TTY). Many House Research Department publications are also available on the Internet at: www.house.mn/hrd/.
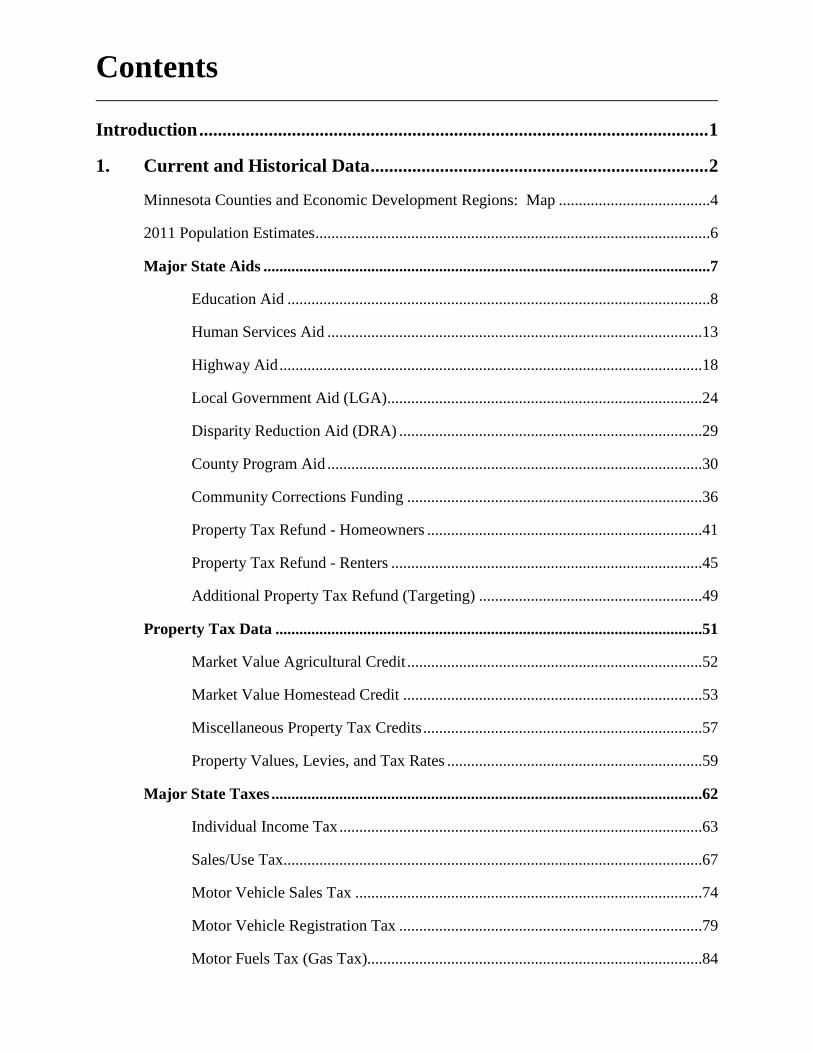
Contents
Introduction .............................................................................................................. 1
1. Current and Historical Data ......................................................................... 2
Minnesota Counties and Economic Development Regions: Map ......................................4
2011 Population Estimates ...................................................................................................6
Major State Aids ................................................................................................................7
Education Aid ..........................................................................................................8
Human Services Aid ..............................................................................................13
Highway Aid ..........................................................................................................18
Local Government Aid (LGA)...............................................................................24
Disparity Reduction Aid (DRA) ............................................................................29
County Program Aid ..............................................................................................30
Community Corrections Funding ..........................................................................36
Property Tax Refund - Homeowners .....................................................................41
Property Tax Refund - Renters ..............................................................................45
Additional Property Tax Refund (Targeting) ........................................................49
Property Tax Data ...........................................................................................................51
Market Value Agricultural Credit ..........................................................................52
Market Value Homestead Credit ...........................................................................53
Miscellaneous Property Tax Credits ......................................................................57
Property Values, Levies, and Tax Rates ................................................................59
Major State Taxes ............................................................................................................62
Individual Income Tax ...........................................................................................63
Sales/Use Tax.........................................................................................................67
Motor Vehicle Sales Tax .......................................................................................74
Motor Vehicle Registration Tax ............................................................................79
Motor Fuels Tax (Gas Tax)....................................................................................84

Corporate Franchise (Income) Tax ........................................................................89
State General Property Tax ....................................................................................94
2. Summary Data ............................................................................................. 99
General Explanation of Tables and Example ...................................................................100
Statewide Summary: Tables 2-1 and 2-2 ........................................................................103
Metro/Nonmetro Data: Tables 2-3 and 2-4 .....................................................................107
3. Regional Data ............................................................................................. 111
Total Aids and Credits (Per Capita): Map ......................................................................112
Total Taxes (Per Capita): Map ........................................................................................113
Personal Income by County (Per Capita): Map ..............................................................114
Personal Income by Economic Development Regions (Per Capita): Map .....................115
Table 3 Compares data from each of the 13 economic development regions with statewide data (13 separate tables) ......................................116
4. County Data ............................................................................................... 129
Table 4 Compares data from each county with statewide data and the economic development region in which the county is located (87 separate tables) ..................................................................130
Appendices ........................................................................................................... 217
A. Education Aids by Home County and by School District, 2010/2011 School Year........................................................................................217
B. Selected Taxes That Are Not Entirely Allocated To Minnesota Counties .......................................................................236
C. 2010 Personal Income by County ........................................................................237
D. Personal Income, Taxes, and Aids/Credits by Economic Development Region ...........................................................................................239
Introduction
This report presents a comparative analysis of the major state aids and taxes in Minnesota. It is a reference document and is NOT INTENDED to be a complete list of all the aids and credits paid by the state and all the taxes collected by the state. The report contains data on:
• Major State Aids including education aid, human services aid, highway aid, local government aid (LGA), disparity reduction aid (DRA), county program aid, community corrections funding, property tax refund, and targeting.
• Property Tax Data including the market value homestead and agricultural credit, miscellaneous property tax credits, property tax levies by type of taxing district, property valuation data, and average tax rates.
• Major State Taxes including individual income tax, sales/use tax, motor vehicle sales tax, motor vehicle registration tax, motor fuels tax, corporate franchise (income) tax, and state property tax.
This report is divided into four major sections.
Section 1 discusses the state aids, property tax data, and state taxes and gives the assumptions and caveats for using the report. It contains current and historical data using graphs, maps, and tables in both total dollars and on a per capita basis.
Section 2 presents STATEWIDE SUMMARY DATA. A sample table with a general explanation introduces the section. The section contains the summary data for the most recent available year on the statewide totals and compares the metro and the nonmetro economic development regions to each other.
Section 3 compares aid and tax data for the most recent available year for each of the 13 ECONOMIC DEVELOPMENT REGIONS to total statewide data.
Section 4 compares aid and tax data for the most recent available year for each COUNTY to total statewide data and to the economic development region in which the county is located.

House Research Department May 2015 Major State Aids and Taxes Page 2
1. Current and Historical Data
Section 1 contains the most recent available data for the major state aids, credits, and taxes and describes the programs under the general categories in the tables of this report. The assumptions and caveats for using the report are mentioned in this section. In addition to information from the most recent year, section 1 also contains historical information. The data is for a five-year time period.
Section 1 is divided into three parts:
• Major state aids • Property tax data • Major state taxes
Some of the data in this section are county-level, while other tables and graphs are by region or groupings of regions. One table and one graph use northern and southern groupings of the 80 nonmetro counties. The groupings were selected for convenience, rather than for any specific analytical purpose. The northern and southern regions are grouped as follows:
Northern Regions Southern Regions
1 Northwest 6E Six East 2 Headwaters 6W Upper Minnesota Valley 3 Arrowhead 7W Central Minnesota 4 West Central 8 Southwest 5 Five 9 Nine 7E East Central 10 Southeastern Minnesota
The seven metro counties are not included in either the northern or southern regions and are region 11.
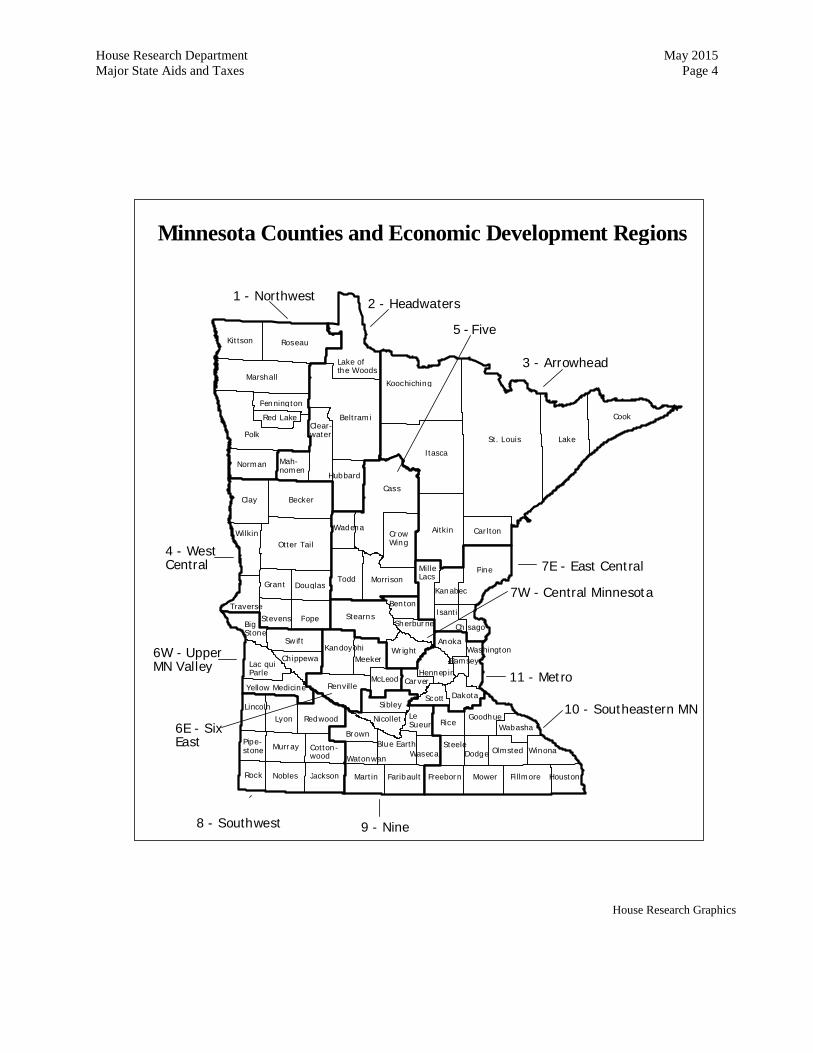
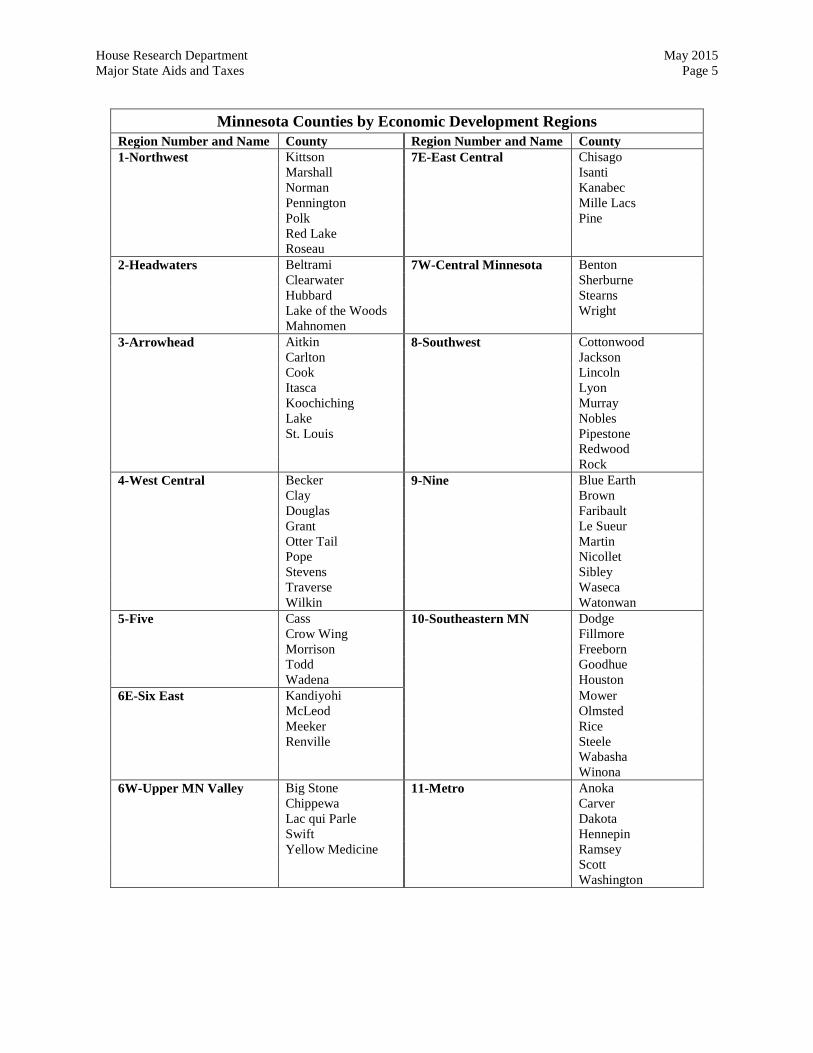
A table on page 6 lists the 2011 county population estimates, which were used to calculate per capita amounts in the report. A map and accompanying table on pages 4 and 5 show the counties and the economic development regions.
The standard format for each aid or tax consists of four or five pages of information. The first page or two contains information for the latest available year, followed by two maps and a page with historical data.

House Research Department May 2015 Major State Aids and Taxes Page 3 Program Description: The first one to two pages provide a program description of the aid or tax. They also provide the statewide amount for the most recent available year, any relevant reporting information, and the source of the data. In some cases, summary tables itemizing the data in different ways (e.g., by program totals) are included. Any recent law changes that affect the program and are important in analyzing the data are noted on these pages.
Maps: The next two pages contain maps showing the per capita distribution of the aid or tax by county for the most recent year and by economic development region (EDR) for the most recent year. 2011 population is used to calculate per capita amounts throughout this report, even if 2010 is the most recent year for which data for a particular aid or tax is available. The 2011 population estimates used in this report are from the Minnesota State Demographer.
The counties were grouped by dividing the data range for each aid and tax into three ranges. The map legend shows the size of the ranges, the per capita amount received or paid by the average county or economic development region, the range from lowest to highest amount per capita, and the overall statewide per capita amount. In some cases, a small number of counties may have per capita aid or tax amounts much higher or lower than all other counties. For purposes of comparability, the groupings constructed on the county data ranges were also used for maps presenting data by economic development region.
All maps are on a per capita basis for comparability among counties. For some aids and taxes, however, other measures would probably be more appropriate. For example, a measure incorporating per pupil units could provide insight into the distribution of education aid. Construction of such measures on a county basis is beyond the scope of this report due to time and data limitations. Where appropriate, footnotes are provided suggesting alternatives.
Historical Data: The last page has a table containing the historical data for the state and the geographic areas of the state. The right-hand column shows a percentage change for the time period presented, calculated using current dollars (i.e., not adjusted for inflation). Hennepin and Ramsey counties are shown separately from the rest of the metro counties on this page because of their greater size, and because each contains a city of the first class.
At the bottom of this page is a statewide graph containing a trend of the data in current (actual) dollars and in constant (inflation-adjusted) dollars. This is the only place where amounts presented are adjusted for inflation.
House Research Department May 2015 Major State Aids and Taxes Page 4
House Research Graphics
M i n n e s o t a C o u n t i e s a n d E c o n o m i c D e v e l o p m e n t R e g i o n s
K i t t s o n R o s e a u
M a r s h a l l L a k e
o f t h e W o o d s
P o l k
P e n n i n g t o n R e d
L a k e B e l t r a m i
K o o c h i c h i n g
N o r m a n M a h - n o m e n
C l e a r - w a t e r
H u b b a r d I t a s c a
S t . L o u i s L a k e
C o o k
C l a y B e c k e r
W i l k i n O t t e r
T a i l
C a s s
W a d e n a C r o w W i n g
A i t k i n C a r l t o n
T r a v e r s e G r a n t D o u g l a s T o d d M o r r i s o n
M i l l e L a c s
K a n a b e c P i n e
I s a n t i C h i s a g o S t e v e n s P o p e S t e a r n s
B e n t o n S h e r b u r n e B i g
S t o n e S w i f t
L a c q u i P a r l e
C h i p p e w a K a n d o y o h i
M e e k e r W r i g h t
Y e l l o w M e d i c i n e R e n v i l l e M c L e o d
A n o k a W a s h i n g t o n
H e n n e p i n C a r v e r
R a m s e y
S c o t t D a k o t a L i n c o l n
L y o n R e d w o o d P i p e - s t o n e M u r r a y C o t t o n -
w o o d R o c k N o b l e s J a c k s o n
S i b l e y N i c o l l e t
B r o w n L e S u e u r
W a t o n w a n B l u e
E a r t h W a s e c a M a r t i n F a r i b a u l t
R i c e G o o d h u e W a b a s h a
S t e e l e D o d g e O l m s t e d W i n o n a
F r e e b o r n M o w e r F i l l m o r e H o u s t o n
1 - N o r t h w e s t 2 - H e a d w a t e r s
3 - A r r o w h e a d
5 - F i v e
4 - W e s t C e n t r a l
7 W - C e n t r a l M i n n e s o t a
7 E - E a s t C e n t r a l
1 1 - M e t r o
1 0 - S o u t h e a s t e r n M N
9 - N i n e
6 W - U p p e r M N V a l l e y
6 E - S i x E a s t
8 - S o u t h w e s t
House Research Department May 2015 Major State Aids and Taxes Page 5
Minnesota Counties by Economic Development Regions Region Number and Name County Region Number and Name County 1-Northwest Kittson 7E-East Central Chisago Marshall Isanti Norman Kanabec Pennington Mille Lacs Polk Pine Red Lake Roseau 2-Headwaters Beltrami 7W-Central Minnesota Benton Clearwater Sherburne Hubbard Stearns Lake of the Woods Wright Mahnomen 3-Arrowhead Aitkin 8-Southwest Cottonwood Carlton Jackson Cook Lincoln Itasca Lyon Koochiching Murray Lake Nobles St. Louis Pipestone Redwood Rock 4-West Central Becker 9-Nine Blue Earth Clay Brown Douglas Faribault Grant Le Sueur Otter Tail Martin Pope Nicollet Stevens Sibley Traverse Waseca Wilkin Watonwan 5-Five Cass 10-Southeastern MN Dodge Crow Wing Fillmore Morrison Freeborn Todd Goodhue Wadena Houston 6E-Six East Kandiyohi Mower McLeod Olmsted Meeker Rice Renville Steele Wabasha Winona 6W-Upper MN Valley Big Stone 11-Metro Anoka Chippewa Carver Lac qui Parle Dakota Swift Hennepin Yellow Medicine Ramsey Scott Washington
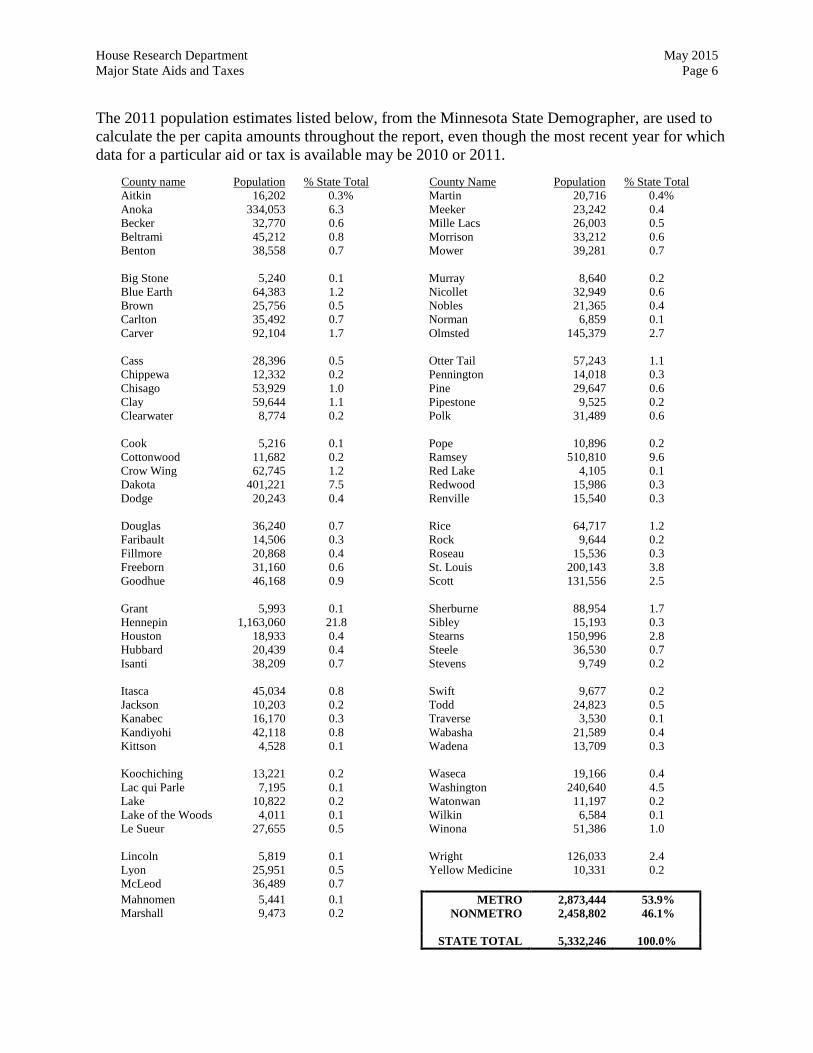
House Research Department May 2015 Major State Aids and Taxes Page 6 The 2011 population estimates listed below, from the Minnesota State Demographer, are used to calculate the per capita amounts throughout the report, even though the most recent year for which data for a particular aid or tax is available may be 2010 or 2011.
County name Population % State Total County Name Population % State Total Aitkin 16,202 0.3% Martin 20,716 0.4% Anoka 334,053 6.3 Meeker 23,242 0.4 Becker 32,770 0.6 Mille Lacs 26,003 0.5 Beltrami 45,212 0.8 Morrison 33,212 0.6 Benton 38,558 0.7 Mower 39,281 0.7 Big Stone 5,240 0.1 Murray 8,640 0.2 Blue Earth 64,383 1.2 Nicollet 32,949 0.6 Brown 25,756 0.5 Nobles 21,365 0.4 Carlton 35,492 0.7 Norman 6,859 0.1 Carver 92,104 1.7 Olmsted 145,379 2.7 Cass 28,396 0.5 Otter Tail 57,243 1.1 Chippewa 12,332 0.2 Pennington 14,018 0.3 Chisago 53,929 1.0 Pine 29,647 0.6 Clay 59,644 1.1 Pipestone 9,525 0.2 Clearwater 8,774 0.2 Polk 31,489 0.6 Cook 5,216 0.1 Pope 10,896 0.2 Cottonwood 11,682 0.2 Ramsey 510,810 9.6 Crow Wing 62,745 1.2 Red Lake 4,105 0.1 Dakota 401,221 7.5 Redwood 15,986 0.3 Dodge 20,243 0.4 Renville 15,540 0.3 Douglas 36,240 0.7 Rice 64,717 1.2 Faribault 14,506 0.3 Rock 9,644 0.2 Fillmore 20,868 0.4 Roseau 15,536 0.3 Freeborn 31,160 0.6 St. Louis 200,143 3.8 Goodhue 46,168 0.9 Scott 131,556 2.5 Grant 5,993 0.1 Sherburne 88,954 1.7 Hennepin 1,163,060 21.8 Sibley 15,193 0.3 Houston 18,933 0.4 Stearns 150,996 2.8 Hubbard 20,439 0.4 Steele 36,530 0.7 Isanti 38,209 0.7 Stevens 9,749 0.2 Itasca 45,034 0.8 Swift 9,677 0.2 Jackson 10,203 0.2 Todd 24,823 0.5 Kanabec 16,170 0.3 Traverse 3,530 0.1 Kandiyohi 42,118 0.8 Wabasha 21,589 0.4 Kittson 4,528 0.1 Wadena 13,709 0.3 Koochiching 13,221 0.2 Waseca 19,166 0.4 Lac qui Parle 7,195 0.1 Washington 240,640 4.5 Lake 10,822 0.2 Watonwan 11,197 0.2 Lake of the Woods 4,011 0.1 Wilkin 6,584 0.1 Le Sueur 27,655 0.5 Winona 51,386 1.0 Lincoln 5,819 0.1 Wright 126,033 2.4 Lyon 25,951 0.5 Yellow Medicine 10,331 0.2 McLeod 36,489 0.7 Mahnomen 5,441 0.1 METRO 2,873,444 53.9% Marshall 9,473 0.2 NONMETRO 2,458,802 46.1% STATE TOTAL 5,332,246 100.0%
Major State Aids
House Research Department May 2015 Major State Aids and Taxes Page 8
Education Aid
Program Description
Education aid is the total amount of state aid paid to school districts for all K-12 educational purposes. This amount includes state aid for general education, special education, transportation, community education, capital expenditure, secondary vocational, and other miscellaneous programs. About 84 percent of the total aid (including aid to charter schools) is general education aid.
Aid Amount and Reporting
2010/2011 Education Aid: $6.7 billion
The total education aid for the 2010/2011 school year is $6,728,023,608. This total includes $368,621,914 that went to the 148 charter schools that received funding in the 2010/2011 school year. The amounts received by school districts for property tax credits (i.e., homestead market value credit, agricultural market value credit, taconite homestead credit, disparity reduction credit, etc.) are not included in this amount since they are itemized elsewhere in the report.
Education aid is paid to school districts, many of which operate in more than one county. Beginning with the 2009 update, this report uses a new method of assigning education aid to counties. Education aid paid to school districts that operate in more than one county is apportioned to the various counties based on each county’s share of total residential market value in the school district. For example, if one-fifth of the residential market value of a school district is in County A, two-fifths in County B, and the remaining two-fifths in County C, then one-fifth of the school district’s education aid is apportioned to County A, two-fifths to County B, and two-fifths to County C. Aid to charter schools is reported in the county in which each school is located. Appendix A lists education aid by school district for 2010/2011 and lists the counties in which each school district operates.
Prior to the 2009 update, this report allocated education aid to each school district’s home county, that is, the county where the school district’s administrative headquarters is located. For comparability across years, the historical data on page 12 for aid paid for the 2006/2007 and 2007/2008 school years has been reapportioned using the new residential market value apportionment method.
The 2010/2011 education aid total does not include amounts paid to entities other than school districts:
• $74.9 million to intermediate school districts1
1 An intermediate school district is an educational cooperative authorized by statute and voluntarily created by participating school districts. Intermediate school districts offer special education services, vocational services, alternative learning programs, and administrative services for member school districts. Beginning in the 2007/2008

House Research Department May 2015 Major State Aids and Taxes Page 9
• $43.1 million to cooperative school organizations • $24.8 million to colleges participating in the postsecondary enrollment options (PSEO)
program • $19.1 million to Head Start programs • $7.6 million to nonprofits operating adult basic education • $2.3 million to the Faribault Academies for the Deaf and Blind • $1.5 million to four tribal contract schools • $1 million to South Dakota school districts
Education aid by home county by school district was obtained from the Minnesota Department of Education.
Recent Law Changes
The state aid share of school district revenue that is promised to the school district through Minnesota’s school finance formulas is called the “aid entitlement.” This report shows the school state aid entitlement amounts for each district (these are listed in Appendix A). The amount actually paid to school districts by the state during each fiscal year is called the “appropriation.” Since school districts use the accrual method of accounting, the full amount of the aid entitlement owed to the district for a fiscal year is booked by the school district as revenue for that year, regardless of when the state aid is actually received. The state, on the other hand, uses a cash-based system of accounting. As a result, the “cost” to the state of school aid is only the actual appropriation for a particular school year, not the aid entitlement.
Payment shifts have been used to address state budget shortfalls since the early 1980s. For fiscal years 2010 to 2012, the school aid payment shifts were reinstated and portions of school aid payments were delayed until the following fiscal year. The amounts of school aid shown in this document are the state aid entitlements (the amount of state aid received by the school district for the relevant fiscal year). The property tax recognition shift and the aid payment shift have no effect on the amounts shown in this report.
In fiscal year 2010, the state received about $500 million in federal aid for education under the American Recovery and Reinvestment Act of 2009 (ARRA). The ARRA aid replaced state education aid, accounting for a large share of the state aid decrease from the 2008/2009 school year to the 2009/2010 school year, followed by an increase to the 2010/2011 school year.
school year, some special education aid began to be paid directly to intermediate districts, rather than paid through school districts, resulting in less aid to school districts and more to intermediate districts.
House Research Department May 2015 Major State Aids and Taxes Page 10
House Research Graphics
Education Aid
less than $1,150
$1,150 to $1,350
over $1,350
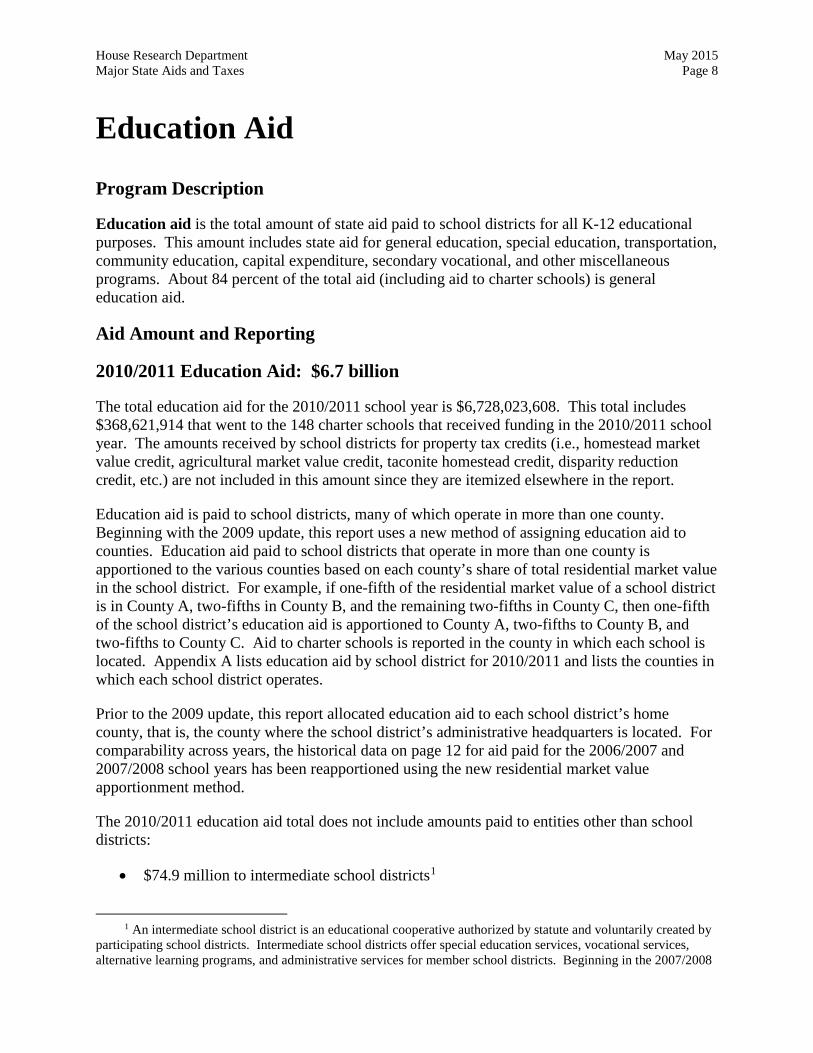
Average County: $1,267Range: $805 to $1,718State per capita: $1,262
Education Aid per capita, 2010-2011 by County*
* Education aid is more often displayed on a per pupil basis (particularly since most education aids are generated on a per pupil basis). The data here is displayed on a per capita basis to remain consistent with other maps in this publication.

House Research Department May 2015 Major State Aids and Taxes Page 11
House Research Graphics
Education Aid
less than $1,150
$1,150 to $1,350
over $1,350
Average EDR: $1,254Range: $1,075 to $1,444State per capita: $1,262
Education Aid per capita, 2010-2011 by Economic Development Region
House Research Department May 2015 Major State Aids and Taxes Page 12
2008/2009 2010/20112006/2007 2007/2008 2009/2010
Actual dollars
2011 Inflation-adjusted dollars
$0
$1,000
$3,000
$5,000
Dollars (millions)
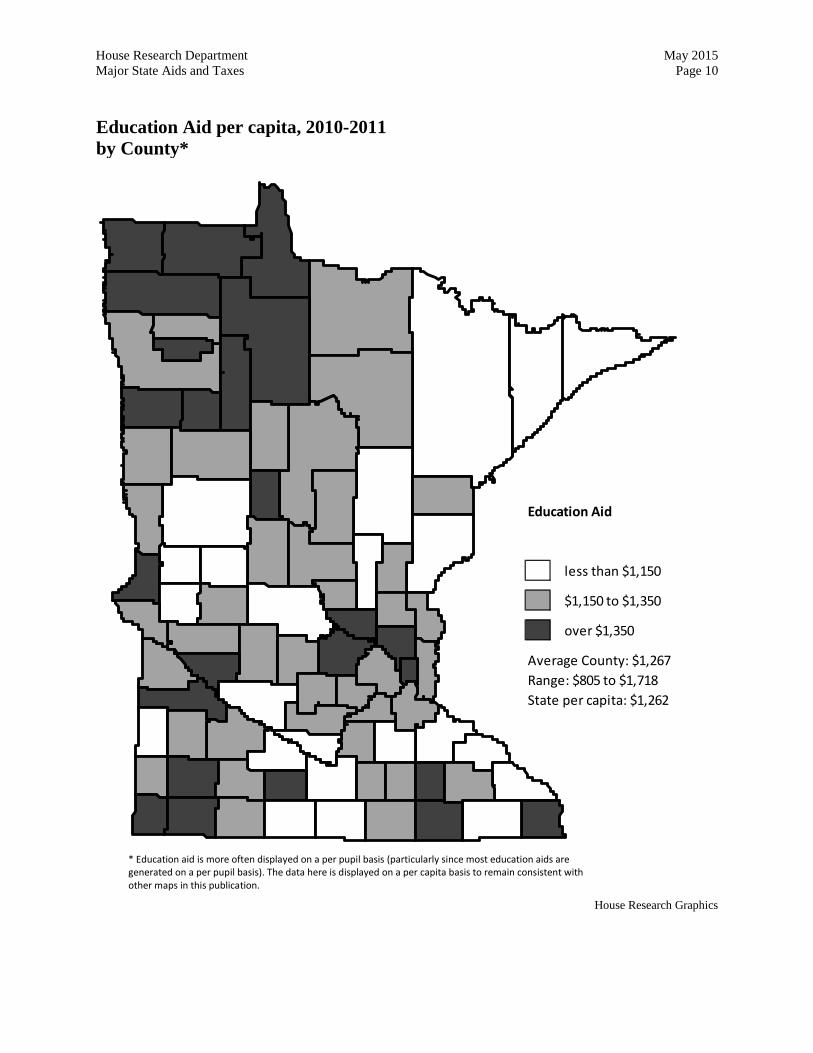
Expenditures decreased 7.9% over five-yearperiod, after adjusting for inflation
$6,728$7,000
$8,000
$6,000
$4,000
$2,000
The Past Five Years of Education Aid
The table below shows the distribution of education aid in thousands of dollars for the past five years for the state and economic development regions. The graph shows total dollars of education aid for that same time period in current (actual) and constant (inflation-adjusted) dollars.
Education Aid: 2006/2007 School Year to 2010/2011 School Year Current dollars, in thousands
2006/2007 2007/2008 2008/2009 2009/2010 2010/2011 5-Yr. Chg. id State $6,433,214 $6,732,188 $6,741,000 $6,145,177 $6,728,024 5%
Northern Regions Northwest (1) 123,012 125,978 124,937 111,814 120,871 -2 Headwaters (2) 117,290 121,723 121,417 111,196 121,080 3 Arrowhead (3) 354,385 366,312 364,734 328,502 360,156 2 West Central (4) 253,864 259,950 259,577 235,590 257,768 2 Five (5) 203,476 212,860 209,864 188,824 207,312 2 East Central (7E) 192,293 200,353 198,318 176,971 193,245 0 Southern Regions Six East (6E) 146,512 150,253 148,861 135,836 145,180 -1 Upper MN Valley (6W) 62,825 65,145 63,471 56,717 60,329 -4 Central MN (7W) 468,947 495,273 499,608 460,902 510,613 9 Southwest (8) 150,884 158,379 160,731 146,373 157,480 4 Nine (9) 244,104 253,748 253,383 229,082 248,843 2 Southeastern MN (10) 560,638 584,894 589,531 536,471 588,819 5 Total Nonmetro $2,878,229 $2,994,867 $2,994,430 $2,718,278 $2,971,694 3% Metro Region Hennepin County 1,358,276 1,435,626 1,429,970 1,309,909 1,429,907 5 Ramsey County 688,724 711,251 721,013 659,088 730,511 6 Remaining Metro 1,507,984 1,590,445 1,595,586 1,457,902 1,595,912 6 Total Metro $3,554,985 $3,737,322 $3,746,570 $3,426,899 $3,756,329 6%
Statewide Education Aid
House Research Graphics

House Research Department May 2015 Major State Aids and Taxes Page 13
Human Services Aid Program Description
Human services aid is the total amount of state aid for human services programs, including all income maintenance and social service programs. Although the federal government and the counties contribute money to programs in varying degrees, the amounts in this report reflect only the state’s share of the human services costs.
Aid Amount and Reporting
2011 Human Services Aid: $4.4 billion The state’s share of the human services expenditures for calendar year 2011 is $4,421,573,847.
Type of Program Amount Percent Medical Assistance (MA) $2,827,887,220 64.0%
Minnesota Family Investment Program (MFIP) 76,772,183 1.7 General Assistance (GA) 49,673,975 1.1
General Assistance Medical Care (GAMC) -8,453,143 -0.2 Social Services (including CSSA) 1,316,027,266 29.8
Miscellaneous: Minnesota Supplemental Assistance 35,822,370 0.8
Group Residential Housing 119,774,809 2.7 Food Stamp Delivery 1,149,948 0.0
Title IV Child Support 2,919,219 0.1 Total $4,421,573,847 100.0%
State MFIP spending shown in this report is before offsetting any current year child support collections applied against current and prior years’ MFIP payments. In calendar year 2011, MFIP spending in Minnesota totaled $401.3 million ($296.2 million federal, $76.8 million state, $28.4 million county), and offsetting child support collections totaled $46.7 million, one-half offset federal costs and one-half offset state costs. GAMC ended partway through 2010, with a portion of outstanding GAMC claims redirected to MA in 2011. This results in a negative total for GAMC in 2011, while MA is increased by the same amount.
The human services amounts are not available by county in two cases:
• Region VIII N—Lincoln, Lyon, and Murray • Human Service Board—Faribault and Martin
In these two groups, human services aid is administered through a “home” county: Lyon in Region VIII N and Faribault in the Human Service Board. The total human service amount for Region VIII N is $34.9 million and for the Human Service Board, $33.3 million. An estimated amount based on population for the five counties appear in the county tables. Human services aid data was obtained from the Department of Human Services, Financial Management Division.
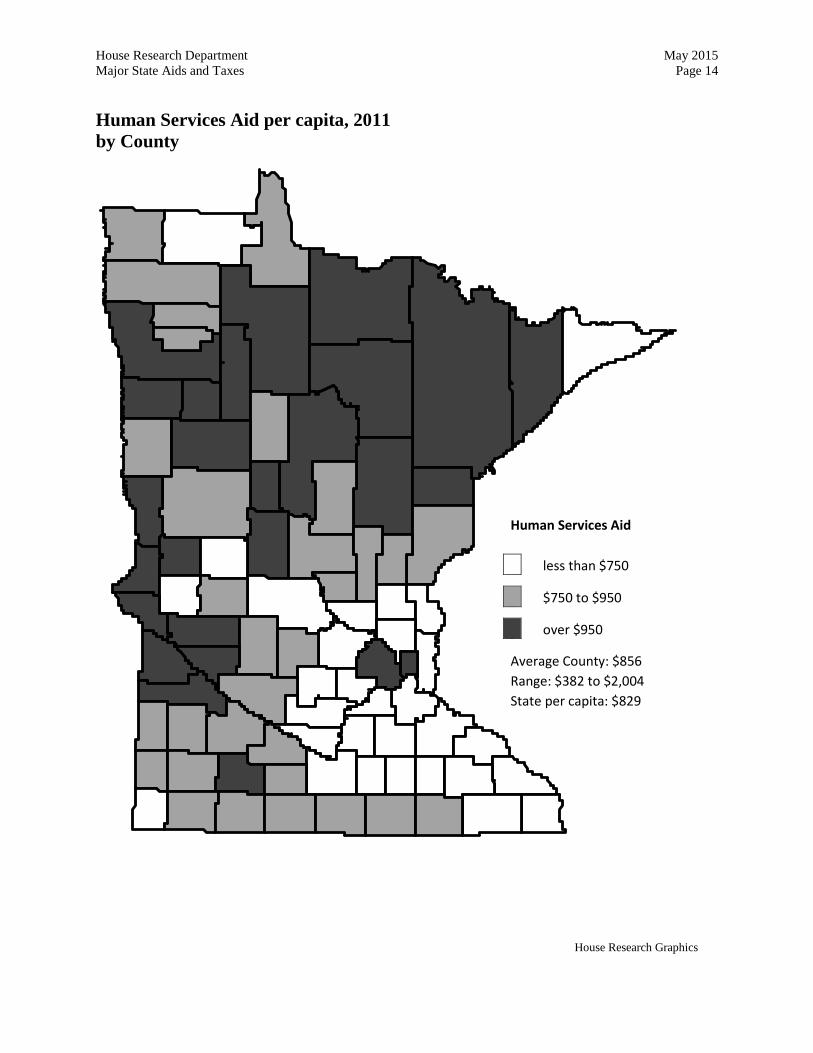
House Research Department May 2015 Major State Aids and Taxes Page 14 Human Services Aid per capita, 2011 by County
House Research Graphics
Human Services Aid
less than $750
$750 to $950
over $950
Average County: $856 Range: $382 to $2,004 State per capita: $829
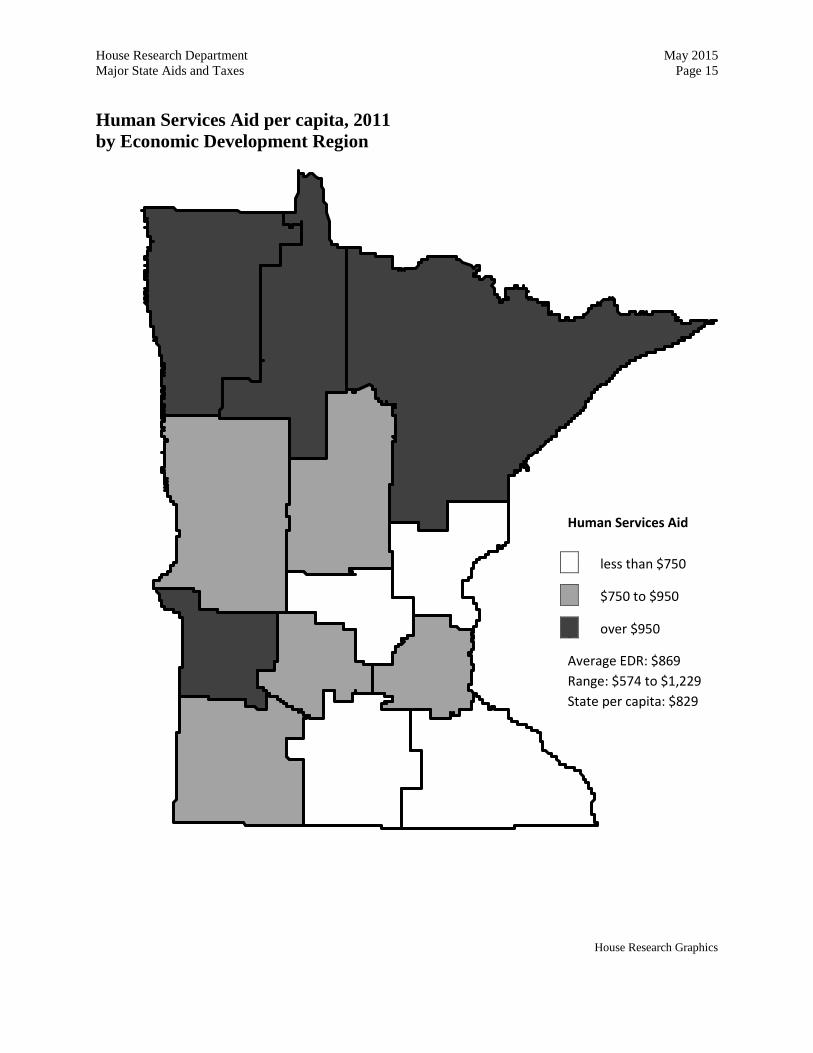
House Research Department May 2015 Major State Aids and Taxes Page 15 Human Services Aid per capita, 2011 by Economic Development Region
House Research Graphics
Human Services Aid
less than $750
$750 to $950
over $950
Average EDR: $869 Range: $574 to $1,229 State per capita: $829

House Research Department May 2015 Major State Aids and Taxes Page 16 The Past Five Years of Human Services Aid
The table below shows the distribution of human services aid in thousands of dollars for the past five years for the state and economic development regions. The graph shows total dollars of human services aid for that same time period in current (actual) and constant (inflation-adjusted) dollars.
Human Services Aid: Calendar Years 2007 to 2011 Current dollars, in thousands
2007 2008 2009 2010 2011 5-Yr. Chg. Aid State $3,858,365 $4,165,895 $4,296,679 $3,606,669 $4,421,574 15% Northern Regions Northwest (1) 80,259 83,584 83,746 70,660 83,098 4 Headwaters (2) 88,738 102,022 106,043 87,075 103,115 16 Arrowhead (3) 313,524 331,697 336,703 276,408 336,562 7 West Central (4) 176,462 186,918 190,367 161,081 193,339 10 Five (5) 135,615 141,532 146,461 122,370 151,366 12 East Central (7E) 104,724 113,723 117,975 99,912 121,407 16 Southern Regions Six East (6E) 83,213 89,333 89,598 76,159 92,283 11 Upper MN Valley (6W) 44,013 46,345 45,560 37,899 45,930 4 Central MN (7W) 187,253 205,342 214,462 185,647 232,269 24 Southwest (8) 94,396 98,675 101,030 86,130 101,853 8 Nine (9) 156,510 165,478 165,933 141,349 170,509 9 Southeastern MN (10) 313,545 334,876 336,714 290,590 345,632 10 Total Nonmetro $1,778,254 $1,899,526 $1,934,594 $1,635,279 $1,977,362 11% Metro Region Hennepin County 1,048,293 1,128,295 1,178,006 963,540 1,185,473 13 Ramsey County 503,496 552,318 580,373 488,554 614,297 22 Remaining Metro 528,321 585,756 603,707 519,296 644,442 22 Total Metro $2,080,111 $2,266,369 $2,362,086 $1,971,390 $2,444,211 18%
Statewide Human Services Aid
House Research Graphic
2009 20112007 2008 2010
Actual dollars
2011 Inflation-adjusted dollars
$0
$1,000
$2,000
$3,000
Dollars (millions)
Expenditures increased 2.7% over five-yearperiod, after adjusting for inflation
$4,422$4,000
$5,000

House Research Department May 2015 Major State Aids and Taxes Page 18
Highway Aid
Program Description
Highway aid is the total amount of state aid distributed to counties, cities, and towns for highway purposes. It includes three basic types of aid: (1) amounts distributed according to constitutional formula to all counties and eligible cities; (2) amounts distributed to counties, cities, and towns from state bond proceeds; and (3) amounts distributed to towns for town roads and bridges. The sources of these funds are the Highway User Tax Distribution Fund (from a portion of the motor fuels tax, motor vehicle registration tax, and motor vehicle sales tax revenues) and proceeds from state bonds.
Aid Amount and Reporting
2011 Highway Aid: $652.6 million
The total state highway aid paid in calendar year 2011 to the counties, cities (i.e., municipal), and towns is shown below by category. Bridge bond funding amounts are the totals awarded during 2011.
Type of Highway Aid Amount Total County Aid County State Aid $441,394,374 County Bridge Bond Funding 28,438,093 Local Road Bond Funding 493,476 County $470,325,943 Municipal Aid Municipal State Aid $139,081,139 Municipal Bridge Bond Funding 8,637,484 Municipal $147,718,623 Township Aid Town Road Account $25,239,424 Town Bridge Account2 9,268,247 Town Bridge Bond Funding 0 Township $34,507,671 Total Highway Aid $652,552,238
County and municipal turnback account money (excluding the money in the town road and town bridge accounts shown above) is not included in the above totals. Counties and municipalities use this money to maintain former state highways that have been “turned back” to counties and municipalities. In 2011, the state allocated approximately $42.7 million to the county turnback account and $1.6 million to the municipal turnback account. Of these amounts, disbursements of
2 The Department of Transportation sets aside a portion of Town Bridge Account funding for flexible distribution as needed throughout the state. Amounts in this special Town Bridge Account are not always spent within the calendar year and are not included in this report.
House Research Department May 2015 Major State Aids and Taxes Page 19 $51.3 million to counties and $4.8 million to municipalities from the turnback accounts were used for maintenance.3 The amount spent in each county is not readily available.
Highway aid data was obtained from the Department of Transportation.
Recent Law Changes
The 2008 Legislature made two basic changes (effective July 1, 2009) to the allocation of flexible highway account funds. It:
(1) reallocated a portion of the funds to metropolitan area counties, and
(2) modified allowable uses of the funds to:
• eliminate funds for the trunk highway system,
• allow funds to be used for “safety improvements on county highways, municipal highways, streets, or town roads,” and
• allow funds to go to routes of regional significance.
Also in 2008, the legislature modified the mechanism for distributing aid to counties by establishing a second formula to allocate a portion of Highway User Tax Distribution Fund revenues.
The legislature has regularly authorized bonding for local roads and bridges. This totaled $10 million in 2009, $66 million in 2010 (with additional authorizations for disaster relief), and $43 million in 2011. This report shows local road and bridge bonding amounts in the year the bonds were awarded, which may lag behind when they were authorized.
3 County allocation and disbursement amounts include amounts resulting from the 2008 motor fuels tax increase, referred to as “excess sum amounts.”
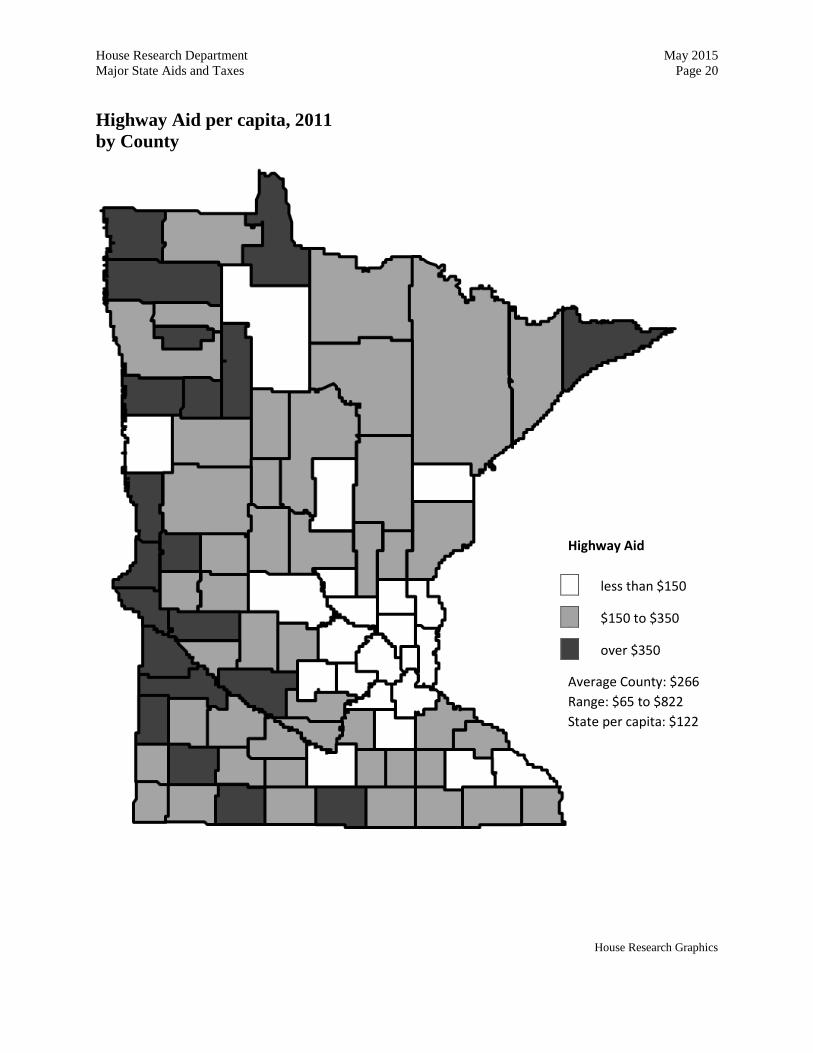
House Research Department May 2015 Major State Aids and Taxes Page 20 Highway Aid per capita, 2011 by County
House Research Graphics
Highway Aid
less than $150
$150 to $350
over $350
Average County: $266 Range: $65 to $822 State per capita: $122

House Research Department May 2015 Major State Aids and Taxes Page 21 Highway Aid per capita, 2011 by Economic Development Region
House Research Graphics
Highway Aid
less than $150
$150 to $350
over $350
Average EDR: $209 Range: $71 to $396 State per capita: $122

House Research Department May 2015 Major State Aids and Taxes Page 22 The Past Five Years of Highway Aid
The table below shows the distribution of highway aid in thousands of dollars for the past five years for the state and economic development regions. The graph shows total dollars of highway aid for that same time period in current (actual) and constant (inflation-adjusted) dollars.
Highway Aid: Calendar Years 2007 to 2011 Current dollars, in thousands
2007 2008 2009 2010 2011 5-Yr. Chg. Aid
State $519,681 $541,026 $579,749 $590,755 $652,552 26% Northern Regions Northwest (1) 30,938 32,584 30,317 31,059 34,023 10 Headwaters (2) 16,532 17,819 17,924 17,868 19,102 16 Arrowhead (3) 52,638 54,500 54,689 57,441 64,766 23 West Central (4) 39,563 41,943 40,357 43,415 48,113 22 Five (5) 21,015 22,437 23,030 24,254 25,802 23 East Central (7E) 18,839 20,053 21,303 23,033 24,806 32 Southern Regions Six East (6E) 17,548 18,511 18,772 20,069 20,861 19 Upper MN Valley (6W) 16,185 15,204 14,984 16,513 16,843 4 Central MN (7W) 26,874 29,071 30,919 33,777 37,764 41 Southwest (8) 33,573 34,241 33,591 35,678 36,770 10 Nine (9) 37,444 39,346 40,879 40,690 45,682 22 Southeastern MN (10) 61,414 60,585 61,858 64,946 73,465 20 Total Nonmetro $372,563 $386,294 $388,623 $408,744 $447,998 20% Metro Region Hennepin County 56,840 59,982 84,800 68,877 83,803 47 Ramsey County 25,402 26,494 30,036 32,868 33,034 30 Remaining Metro 64,876 68,256 76,290 80,265 87,717 35 Total Metro $147,118 $154,733 $191,126 $182,010 $204,555 39%
State Highway Aid
2009 20112007 2008 2010
$653
Actual dollars
2011 Inflation-adjusted dollars
$0
$250
$750
Dollars (millions)
$500Expenditures increased 12.5% over five-yearperiod, after adjusting for inflation
$1,000
House Research Graphics

House Research Department May 2015 Major State Aids and Taxes Page 24
Local Government Aid (LGA)
Local government aid (LGA) is a state program that provides property tax relief by giving general purpose financial support to cities. “Ability to pay” and “need” are the measures used in the formula. Ability to pay is the city’s adjusted net tax capacity for all cities, regardless of population.
• For cities with population of 2,500 or more, need is determined by five characteristics: population decline, age of the housing stock, if the city is in the seven-county metro area, average number of vehicular accidents over the most recent three-year period, and household size.
• For cities with population less than 2,500, need is determined by population decline, age of housing stock, percent of the property in the city classified as commercial or industrial, and a population adjustment factor.
Additional aid is also given to cities with a population less than 5,000 based on population, and to cities with a population of 5,000 or more based on the ratio of jobs to population in the city.
Aid Amount and Reporting
2011 Local Government Aid: $425.3 million, after $101.8 million reduction
The 2011 certified LGA total was $527.1 million. The 2011 Legislature reduced 2011 aid by $101.8 million as part of the fiscal year 2012-2013 budget. Net 2011 LGA distributed to cities was $425.3 million.
LGA data was obtained from the Department of Revenue.
Recent Law Changes
Below is an overview of the changes made to city LGA.
City LGA
2008 aid changes: The December 2008 LGA payments were reduced by $53.5 million due to Gov. Pawlenty’s unallotment.
2009 aid changes: In response to criticism that the LGA formula was (1) too volatile, (2) didn’t recognize needs of certain cities, and (3) was underfunded, the 2008 Legislature modified the program as follows, with the changes taking effect in 2009:
House Research Department May 2015 Major State Aids and Taxes Page 25
• Beginning with 2009 aids, maximum annual reductions to individual cities were lowered to limit volatility.
• Beginning with 2009 aids, the extra aid to cities with a population less than 5,000 was increased from $6 per capita to $8.50 per capita but moved from the city aid base and included in the LGA formula. A new aid for cities with 5,000 or more in population was added to the formula, based on a city’s jobs per capita. A city’s small city aid or city jobs aid is reduced if its “need” is less than its “ability to pay” measure.
• Beginning with 2009 aids, taconite aid was removed from the “ability to pay” measure for all cities.
• Beginning with 2010 aids, volatility is further reduced by (1) using data available as of January 1 of the year in which the aid is certified to calculate need, and (2) using the average of two years of “unmet need” (need minus ability to raise revenue) to calculate aid each year.
• The LGA appropriation was increased to $526 million for 2009, by an additional 2 percent in 2010, and another 4 percent in 2011. These increases were subsequently eliminated due to unallotment and legislative action in 2009 and 2010.
2009 to 2011 aid reductions:
• The actual LGA payment in 2009 for cities with a population of 1,000 or more was reduced by $44.6 million from $526.1 million to $481.5 million through unallotment by the governor that was later ratified retroactively in the 2010 special session.
• The Pay 2010 aid reductions consisted of two parts—$102 million in the governor’s unallotments, ratified retroactively in the 2010 special session, and $7.8 million in additional reductions enacted in the regular 2010 session. The first reduction again only applied to cities with a population greater than 1,000.
• The certified 2011 LGA amounts of $527.1 million were reduced by $101.9 million to actual payments of $425.2 million.
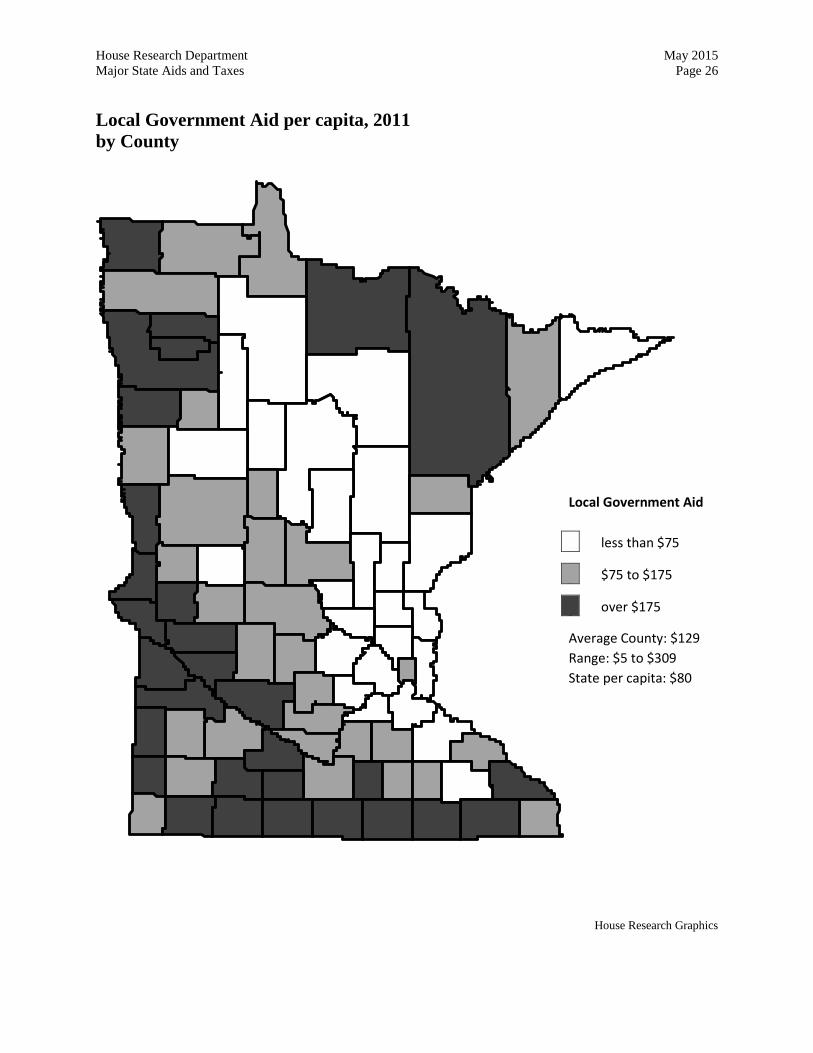
House Research Department May 2015 Major State Aids and Taxes Page 26 Local Government Aid per capita, 2011 by County
House Research Graphics
Local Government Aid
less than $75
$75 to $175
over $175
Average County: $129 Range: $5 to $309 State per capita: $80
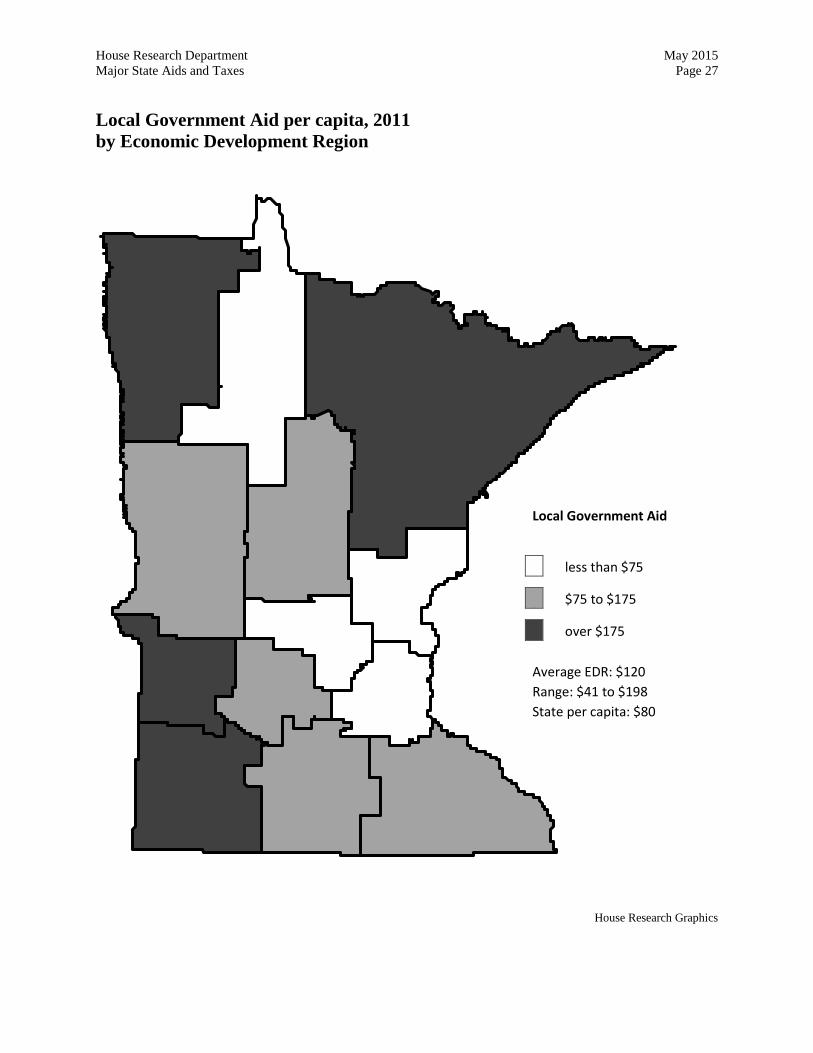
House Research Department May 2015 Major State Aids and Taxes Page 27 Local Government Aid per capita, 2011 by Economic Development Region
House Research Graphics
Local Government Aid
less than $75
$75 to $175
over $175
Average EDR: $120 Range: $41 to $198 State per capita: $80
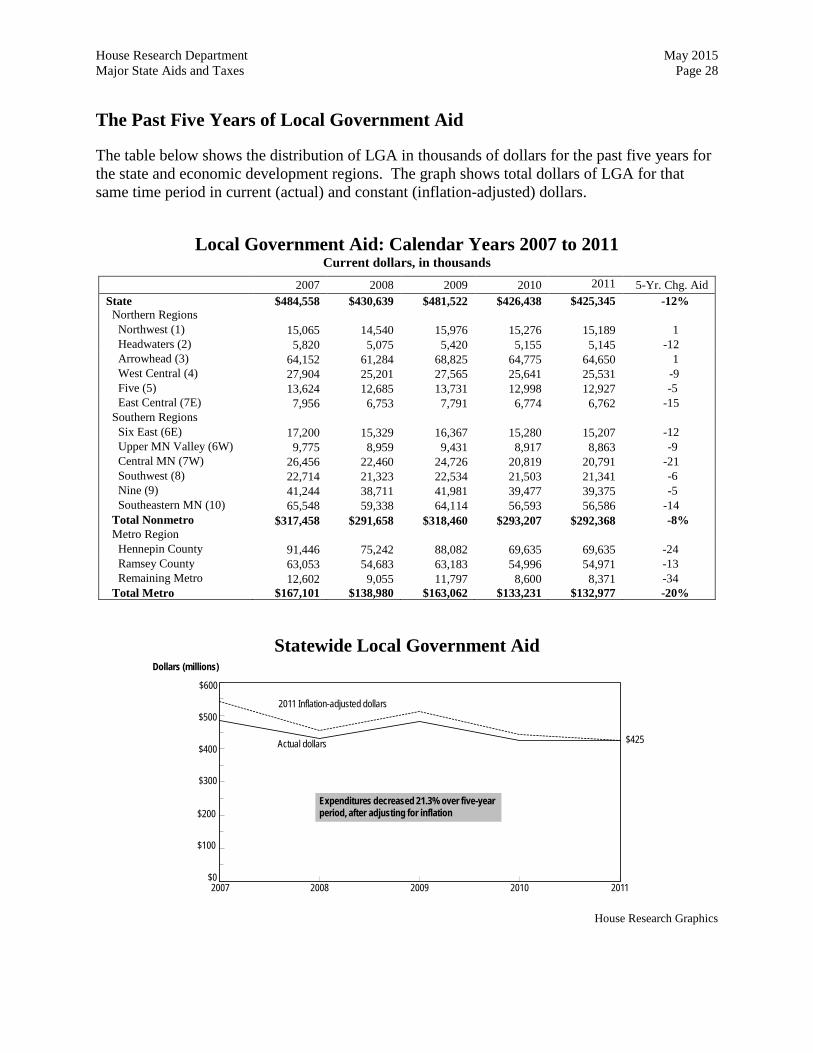
House Research Department May 2015 Major State Aids and Taxes Page 28 The Past Five Years of Local Government Aid
The table below shows the distribution of LGA in thousands of dollars for the past five years for the state and economic development regions. The graph shows total dollars of LGA for that same time period in current (actual) and constant (inflation-adjusted) dollars.
Local Government Aid: Calendar Years 2007 to 2011 Current dollars, in thousands
2007 2008 2009 2010 2011 5-Yr. Chg. Aid State $484,558 $430,639 $481,522 $426,438 $425,345
-12%
Northern Regions Northwest (1) 15,065 14,540 15,976 15,276 15,189 1 Headwaters (2) 5,820 5,075 5,420 5,155 5,145 -12 Arrowhead (3) 64,152 61,284 68,825 64,775 64,650 1 West Central (4) 27,904 25,201 27,565 25,641 25,531 -9 Five (5) 13,624 12,685 13,731 12,998 12,927 -5 East Central (7E) 7,956 6,753 7,791 6,774 6,762 -15 Southern Regions Six East (6E) 17,200 15,329 16,367 15,280 15,207 -12 Upper MN Valley (6W) 9,775 8,959 9,431 8,917 8,863 -9 Central MN (7W) 26,456 22,460 24,726 20,819 20,791 -21 Southwest (8) 22,714 21,323 22,534 21,503 21,341 -6 Nine (9) 41,244 38,711 41,981 39,477 39,375 -5 Southeastern MN (10) 65,548 59,338 64,114 56,593 56,586 -14 Total Nonmetro $317,458 $291,658 $318,460 $293,207 $292,368 -8% Metro Region Hennepin County 91,446 75,242 88,082 69,635 69,635 -24 Ramsey County 63,053 54,683 63,183 54,996 54,971 -13 Remaining Metro 12,602 9,055 11,797 8,600 8,371 -34 Total Metro $167,101 $138,980 $163,062 $133,231 $132,977 -20%
Statewide Local Government Aid
2009 20112007 2008 2010
$425Actual dollars
2011 Inflation-adjusted dollars
$0
$100
$200
$300
$500
Dollars (millions)
Expenditures decreased 21.3% over five-yearperiod, after adjusting for inflation
$400
$600
House Research Graphics
House Research Department May 2015 Major State Aids and Taxes Page 29
Disparity Reduction Aid (DRA)
Program Description and Aid Amount and Reporting
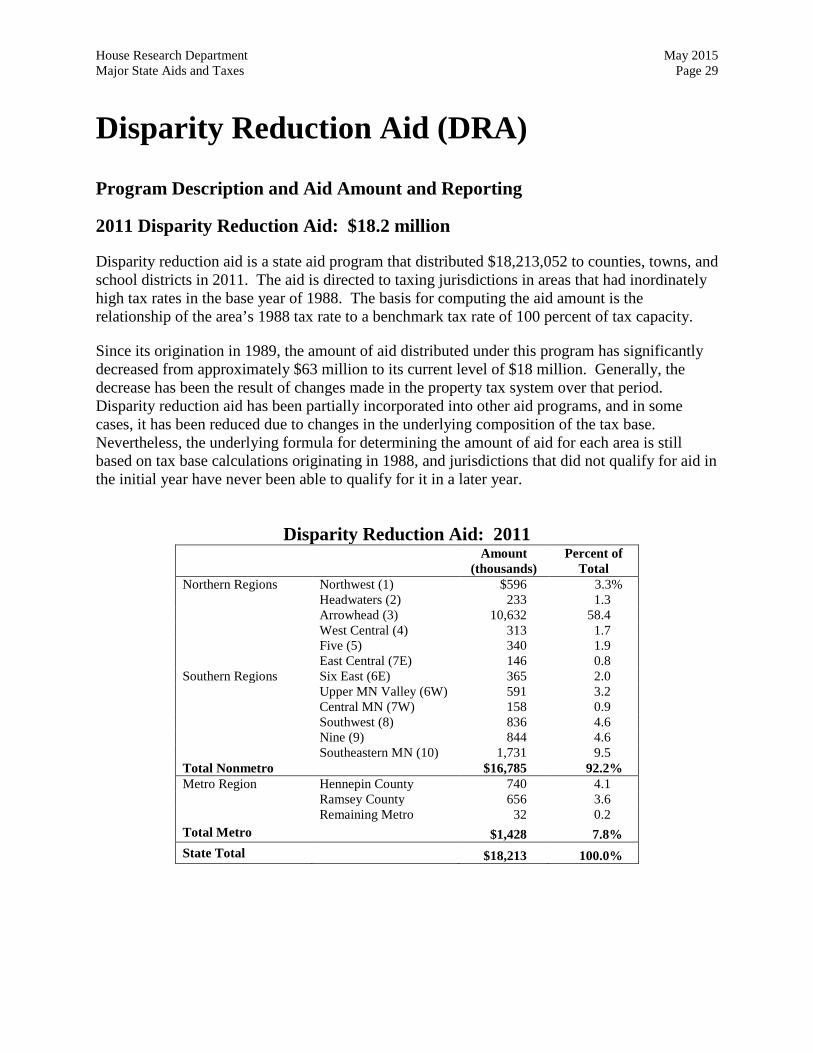
2011 Disparity Reduction Aid: $18.2 million
Disparity reduction aid is a state aid program that distributed $18,213,052 to counties, towns, and school districts in 2011. The aid is directed to taxing jurisdictions in areas that had inordinately high tax rates in the base year of 1988. The basis for computing the aid amount is the relationship of the area’s 1988 tax rate to a benchmark tax rate of 100 percent of tax capacity.
Since its origination in 1989, the amount of aid distributed under this program has significantly decreased from approximately $63 million to its current level of $18 million. Generally, the decrease has been the result of changes made in the property tax system over that period. Disparity reduction aid has been partially incorporated into other aid programs, and in some cases, it has been reduced due to changes in the underlying composition of the tax base. Nevertheless, the underlying formula for determining the amount of aid for each area is still based on tax base calculations originating in 1988, and jurisdictions that did not qualify for aid in the initial year have never been able to qualify for it in a later year.
Disparity Reduction Aid: 2011
Amount
(thousands) Percent of
Total Northern Regions Northwest (1) $596 3.3% Headwaters (2) 233 1.3 Arrowhead (3) 10,632 58.4 West Central (4) 313 1.7 Five (5) 340 1.9 East Central (7E) 146 0.8 Southern Regions Six East (6E) 365 2.0 Upper MN Valley (6W) 591 3.2 Central MN (7W) 158 0.9 Southwest (8) 836 4.6 Nine (9) 844 4.6 Southeastern MN (10) 1,731 9.5 Total Nonmetro $16,785 92.2% Metro Region Hennepin County 740 4.1 Ramsey County 656 3.6 Remaining Metro 32 0.2 Total Metro $1,428 7.8% State Total $18,213 100.0%
House Research Department May 2015 Major State Aids and Taxes Page 30
County Program Aid
Program Description
One-half of the funding for county program aid is distributed based on each county’s relative shares of (1) persons receiving food stamps, (2) age-adjusted population (population weighted more heavily for the number of persons over age 65), and (3) the reported number of Part I (serious) crimes. The other half is distributed based on a formula that takes into account each county’s population and its property wealth. This distribution encompasses some of the distribution factors from the four programs that county program aid replaced in 2004: homestead and agricultural credit aid (HACA), county criminal justice aid, family preservation aid, and attached machinery aid.
Aid Amount and Reporting
2011 County Program Aid: $161.1 million, after $36.4 million unallotment
The total amount of county program aid certified for taxes payable in 2011 was $197.5 million. The certified amount was reduced in the budget enacted in the 2011 special session by $36.4 million, with the net aid paid totaling $161.1 million. This total is after subtraction of $500,000 to pay for court-ordered counsel and $214,000 to pay for preparation of local impact notes.
The county program aid data was obtained from the Department of Revenue.
Recent Law Changes
In the 2003 legislative session, county general-purpose aids were restructured into a single program called county program aid. County program aid replaced four individual aid programs:
• Homestead and agricultural credit aid (HACA) was a state aid program that originated in 1990 to compensate taxing jurisdictions for major structural changes in the property tax base made in 1988 and 1989. From 1990 through 2001, county government HACA payments increased modestly each year based on the county’s growth in number of households; in addition, HACA payments were permanently increased in some years to compensate counties for legislatively determined tax base reductions. In some years, HACA payments were permanently reduced when the state took over certain local government financing responsibilities (such as court financing). In its last year of full funding (2002), the total amount of county HACA payments statewide was $204.8 million.
• County criminal justice aid (CCJA) was a state aid to county governments originated in 1993 to reduce the reliance of criminal justice and corrections programs on property taxes. One-half of the aid was distributed to each county based on the county’s population; the other half was distributed to each county based on the reported number of serious (“Part I”) crimes committed in the county. The appropriation for CCJA increased

House Research Department May 2015 Major State Aids and Taxes Page 31
each year based on the rate of inflation. In its last year of full funding (2002), the total amount of CCJA payments statewide was $31.5 million.
• Family preservation aid (FPA) was a state aid to county governments to reduce the reliance of out-of-home placement costs on property taxes. The initial allocation of FPA in 1995 among counties was based on two factors—each county’s share of total children in out-of-home placement in the state and each county’s share of income maintenance cases in the state. After 1995 each county’s aid increased or decreased based on the change in its relative share of income maintenance caseloads in the state. The appropriation for FPA increased each year based on the rate of inflation. In its last year of full funding (2002), the total amount of FPA payments statewide was $23.4 million.
• Attached machinery aid (AMA) was a state aid to county governments to compensate counties for removing industrial attached machinery from the property tax base in the early 1970s. Only the 13 counties having the most attached machinery as a share of their property tax base received aid under the program; the amounts were static from year to year. In its last year of full funding (2002), the total amount of AMA payments statewide was $2.4 million.
For 2004, approximately $112 million was distributed based on the distribution formulas of the aid programs that were eliminated, minus the substantial aid cuts enacted during the 2003 legislative session.
For 2005 through 2008, about $205 million was allocated according to the new county program aid formula, except that in 2008 aids were reduced by $43.9 million after the initial allocation through unallotment.
For 2009 and 2010, the initial allocation was increased to $227 million (2009) and $232 million (2010), except that in both years the actual payments were reduced by unallotment, eventually ratified by legislative enactment.
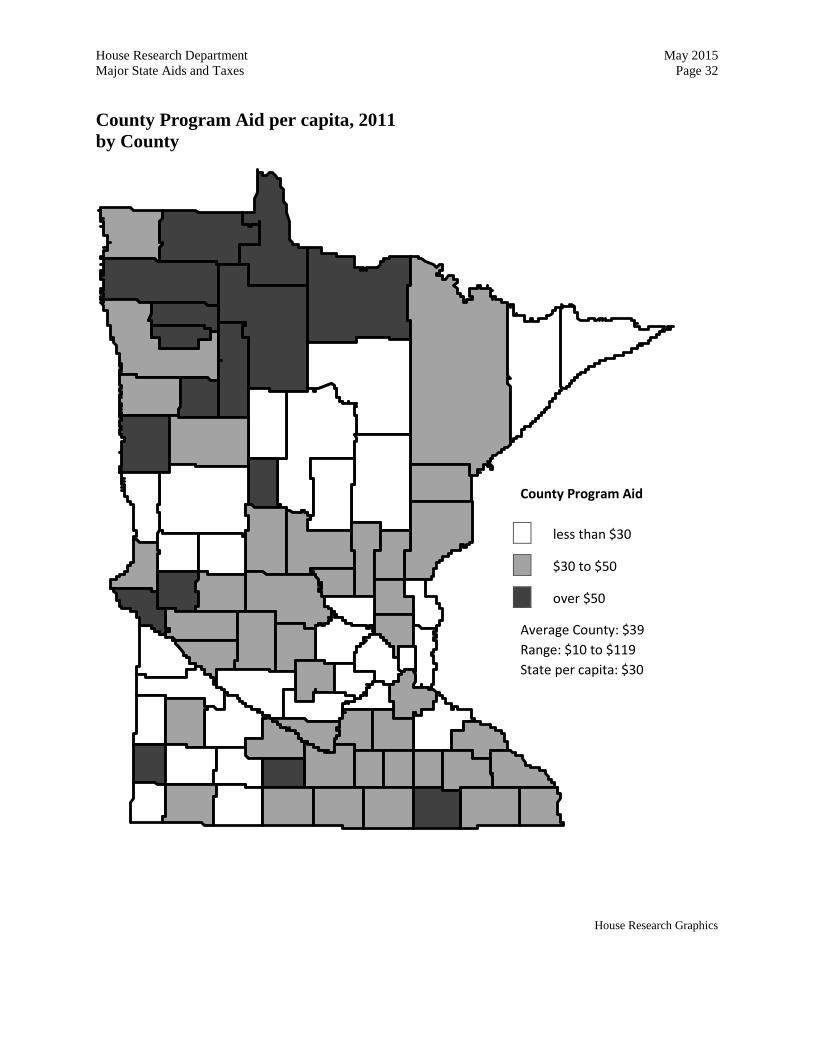
House Research Department May 2015 Major State Aids and Taxes Page 32 County Program Aid per capita, 2011 by County
House Research Graphics
County Program Aid
less than $30
$30 to $50
over $50
Average County: $39 Range: $10 to $119 State per capita: $30
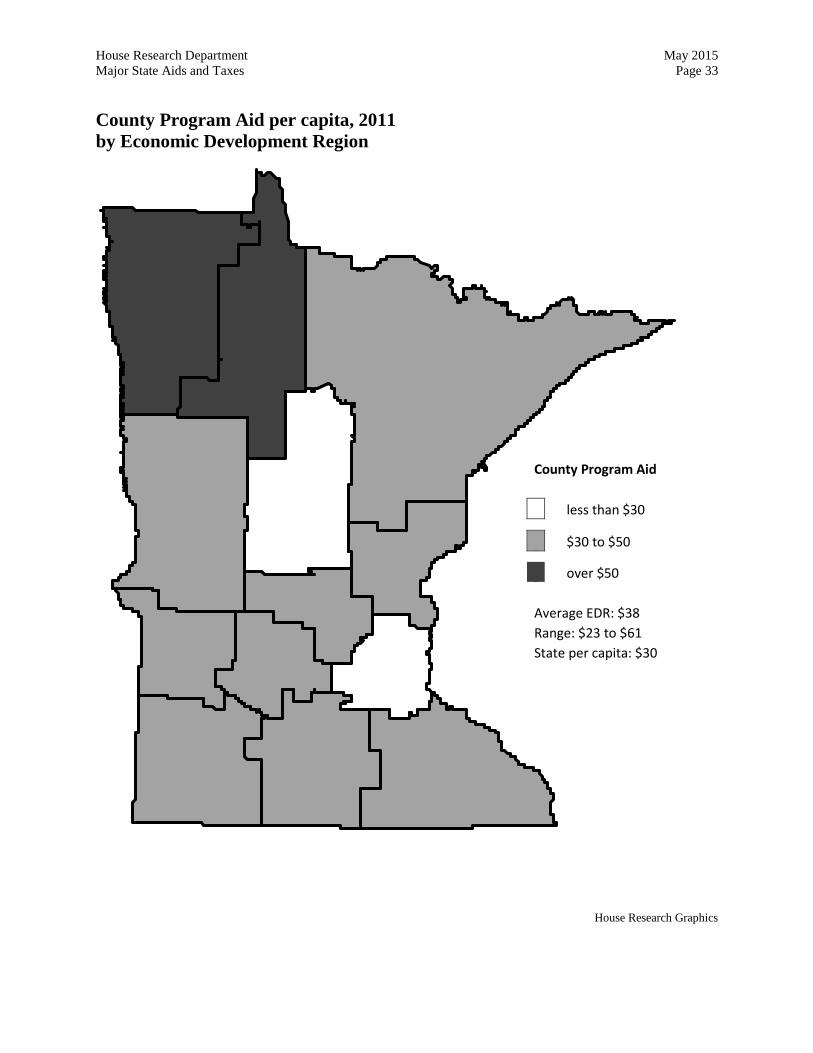
House Research Department May 2015 Major State Aids and Taxes Page 33 County Program Aid per capita, 2011 by Economic Development Region
House Research Graphics
County Program Aid
less than $30
$30 to $50
over $50
Average EDR: $38 Range: $23 to $61 State per capita: $30
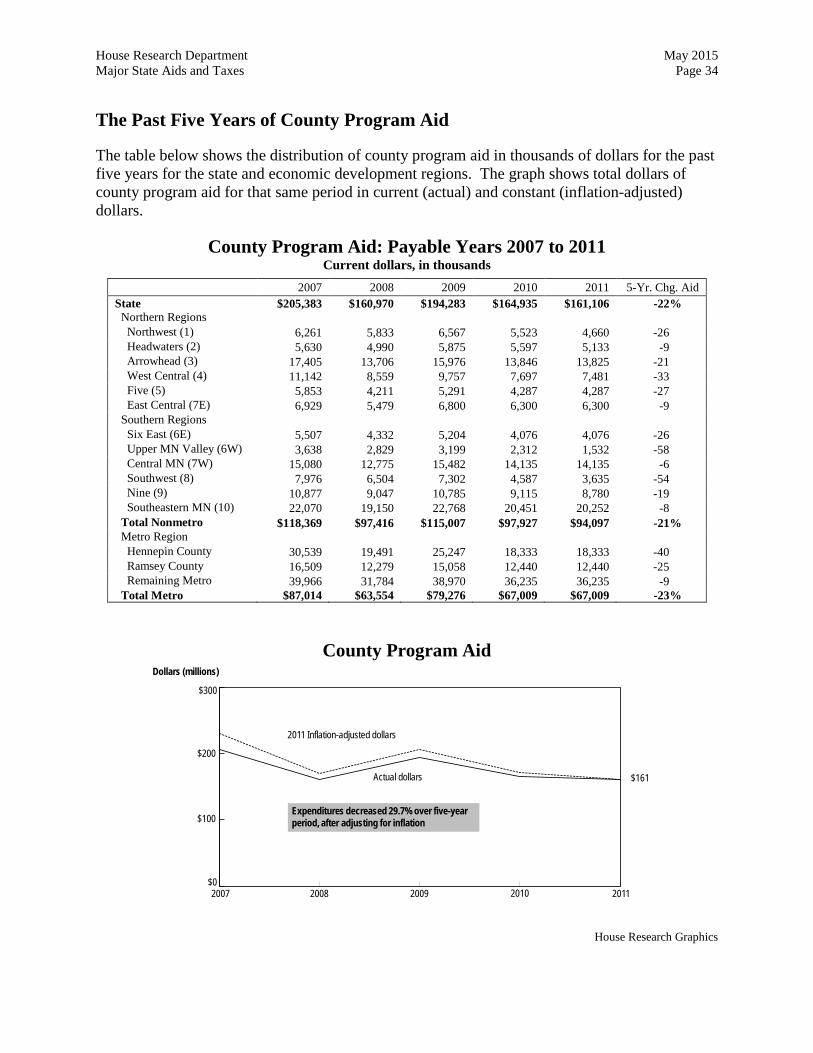
House Research Department May 2015 Major State Aids and Taxes Page 34 The Past Five Years of County Program Aid
The table below shows the distribution of county program aid in thousands of dollars for the past five years for the state and economic development regions. The graph shows total dollars of county program aid for that same period in current (actual) and constant (inflation-adjusted) dollars.
County Program Aid: Payable Years 2007 to 2011 Current dollars, in thousands
2007 2008 2009 2010 2011 5-Yr. Chg. Aid State $205,383 $160,970 $194,283 $164,935 $161,106 -22% Northern Regions Northwest (1) 6,261 5,833 6,567 5,523 4,660 -26 Headwaters (2) 5,630 4,990 5,875 5,597 5,133 -9 Arrowhead (3) 17,405 13,706 15,976 13,846 13,825 -21 West Central (4) 11,142 8,559 9,757 7,697 7,481 -33 Five (5) 5,853 4,211 5,291 4,287 4,287 -27 East Central (7E) 6,929 5,479 6,800 6,300 6,300 -9 Southern Regions Six East (6E) 5,507 4,332 5,204 4,076 4,076 -26 Upper MN Valley (6W) 3,638 2,829 3,199 2,312 1,532 -58 Central MN (7W) 15,080 12,775 15,482 14,135 14,135 -6 Southwest (8) 7,976 6,504 7,302 4,587 3,635 -54 Nine (9) 10,877 9,047 10,785 9,115 8,780 -19 Southeastern MN (10) 22,070 19,150 22,768 20,451 20,252 -8 Total Nonmetro $118,369 $97,416 $115,007 $97,927 $94,097 -21% Metro Region Hennepin County 30,539 19,491 25,247 18,333 18,333 -40 Ramsey County 16,509 12,279 15,058 12,440 12,440 -25 Remaining Metro 39,966 31,784 38,970 36,235 36,235 -9 Total Metro $87,014 $63,554 $79,276 $67,009 $67,009 -23%
County Program Aid
2007 20092008
$161Actual dollars
2011 Inflation-adjusted dollars
$0
$100
$200
$300
Dollars (millions)
Expenditures decreased 29.7% over five-yearperiod, after adjusting for inflation
20112010
House Research Graphics


House Research Department May 2015 Major State Aids and Taxes Page 36
Community Corrections Funding
Program Description
Although counties assume much of the cost of their community correctional services, the state provides direct funding and in-kind services. Counties choose to receive funding from one of three basic funding systems: the community corrections act (CCA), county probation officer (CPO), and the Department of Corrections (DOC). For 2011, they are as follows:
• Thirty-two counties are CCA counties. This group contains about 70 percent of the state’s population, including most of the Twin Cities metropolitan area.
• Fifty-five counties are non-CCA counties. Although the DOC provides adult felony supervision to all 55 of these counties, they differ and are generally referenced as follows:
o Twenty-seven counties (called “CPO” counties) provide their own juvenile and adult misdemeanant supervision
o Twenty-eight counties (called “DOC” counties) have their juvenile and adult misdemeanant supervision provided by the DOC
To keep the counties on a comparable basis, the dollar amount of in-kind services provided by the DOC is included in this report, even though these counties do not receive an “aid payment” per se from the state.
Aid Amount and Reporting
2011 Community Corrections Funding: $83.3 million
In 2011, the state funding was $83,296,392.4 The table below lists the calendar year 2011 statewide total amounts for the various community corrections funding programs.
Program Amount Percent CCA aid $37,505,000 45.0% CPO reimbursement aid 4,848,990 5.8 DOC field services 15,626,311 18.8 Adult felony caseload reduction 956,000 1.1 Caseload/workload reduction 14,319,998 17.2 Intensive supervision 6,235,161 7.5 Enhanced supervision of adult sex offenders 3,804,932 4.6 Total Aid and In-kind Services $83,296,392 100.0%
4 An additional $11.0 million, not included in this report, was distributed for miscellaneous categorical services.
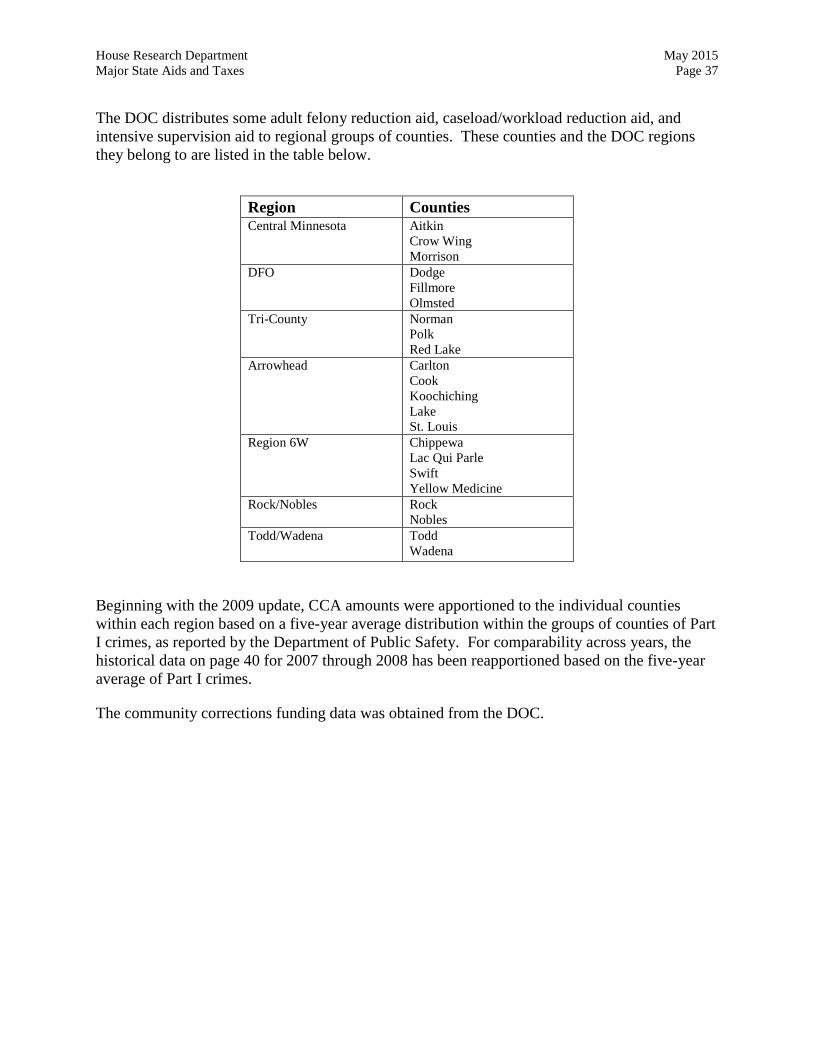
House Research Department May 2015 Major State Aids and Taxes Page 37 The DOC distributes some adult felony reduction aid, caseload/workload reduction aid, and intensive supervision aid to regional groups of counties. These counties and the DOC regions they belong to are listed in the table below.
Region Counties Central Minnesota Aitkin
Crow Wing Morrison
DFO Dodge Fillmore Olmsted
Tri-County Norman Polk Red Lake
Arrowhead Carlton Cook Koochiching Lake St. Louis
Region 6W Chippewa Lac Qui Parle Swift Yellow Medicine
Rock/Nobles Rock Nobles
Todd/Wadena Todd Wadena
Beginning with the 2009 update, CCA amounts were apportioned to the individual counties within each region based on a five-year average distribution within the groups of counties of Part I crimes, as reported by the Department of Public Safety. For comparability across years, the historical data on page 40 for 2007 through 2008 has been reapportioned based on the five-year average of Part I crimes.
The community corrections funding data was obtained from the DOC.
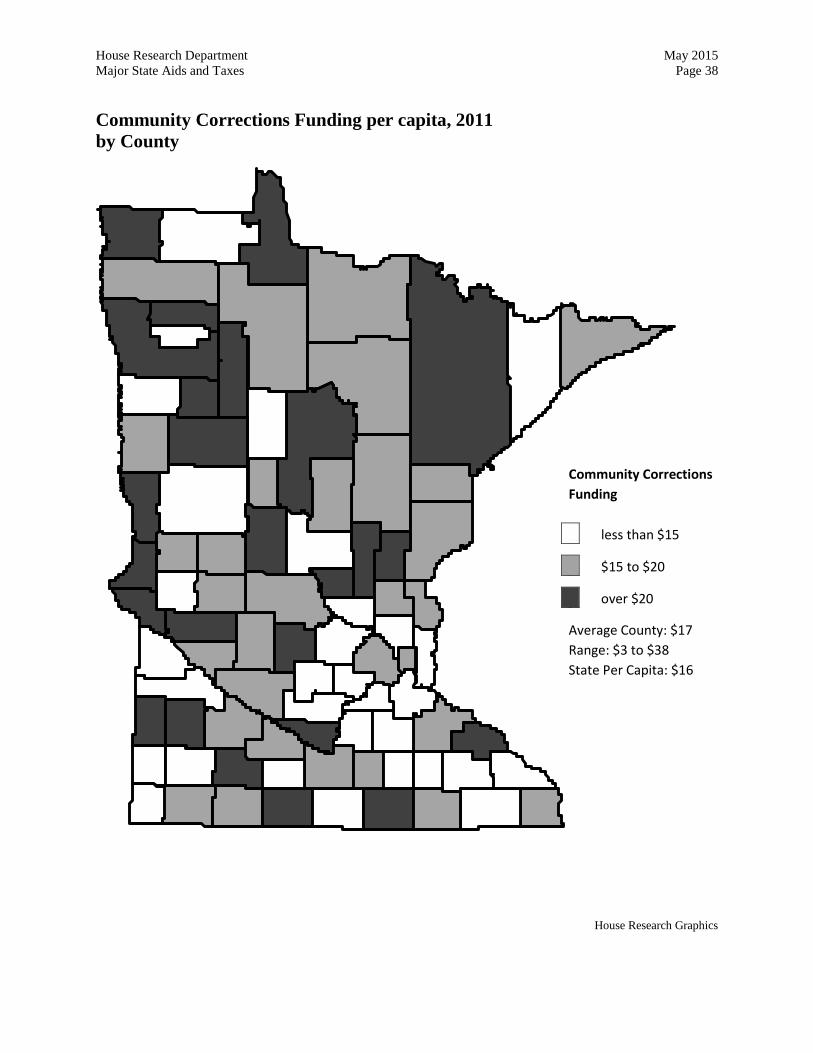
House Research Department May 2015 Major State Aids and Taxes Page 38 Community Corrections Funding per capita, 2011 by County
House Research Graphics
Community Corrections Funding
less than $15
$15 to $20
over $20
Average County: $17 Range: $3 to $38 State Per Capita: $16
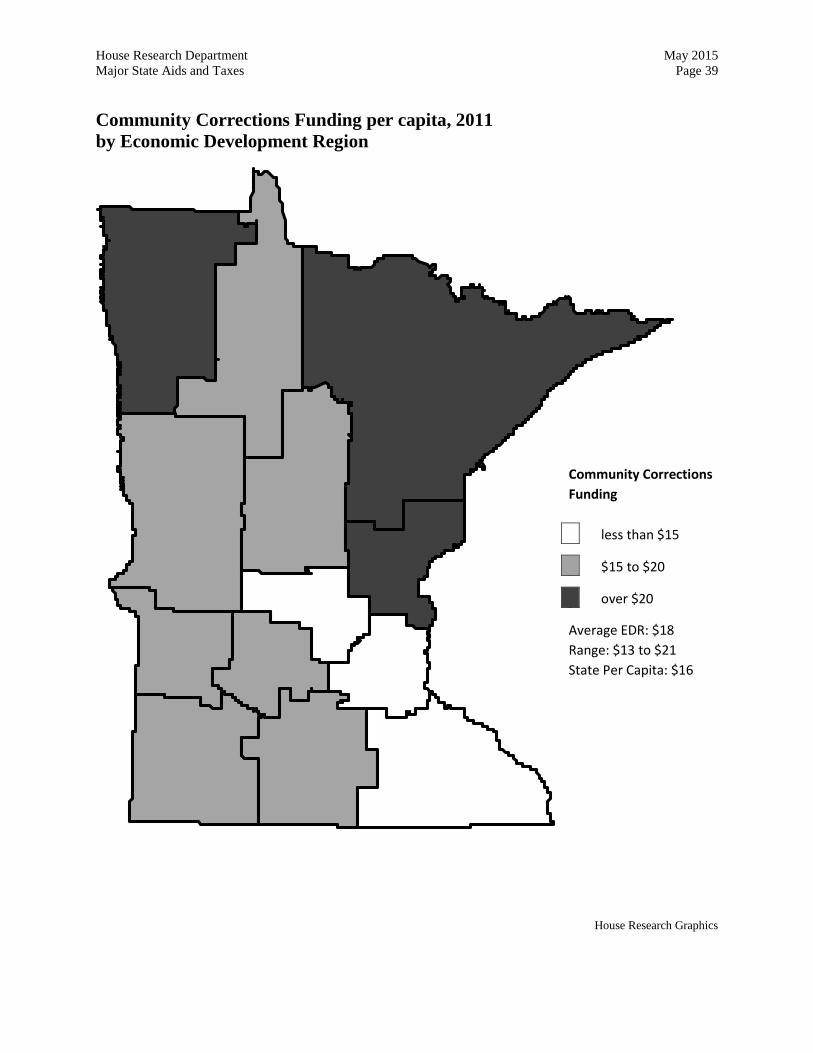
House Research Department May 2015 Major State Aids and Taxes Page 39 Community Corrections Funding per capita, 2011 by Economic Development Region
House Research Graphics
Community Corrections Funding
less than $15
$15 to $20
over $20
Average EDR: $18 Range: $13 to $21 State Per Capita: $16
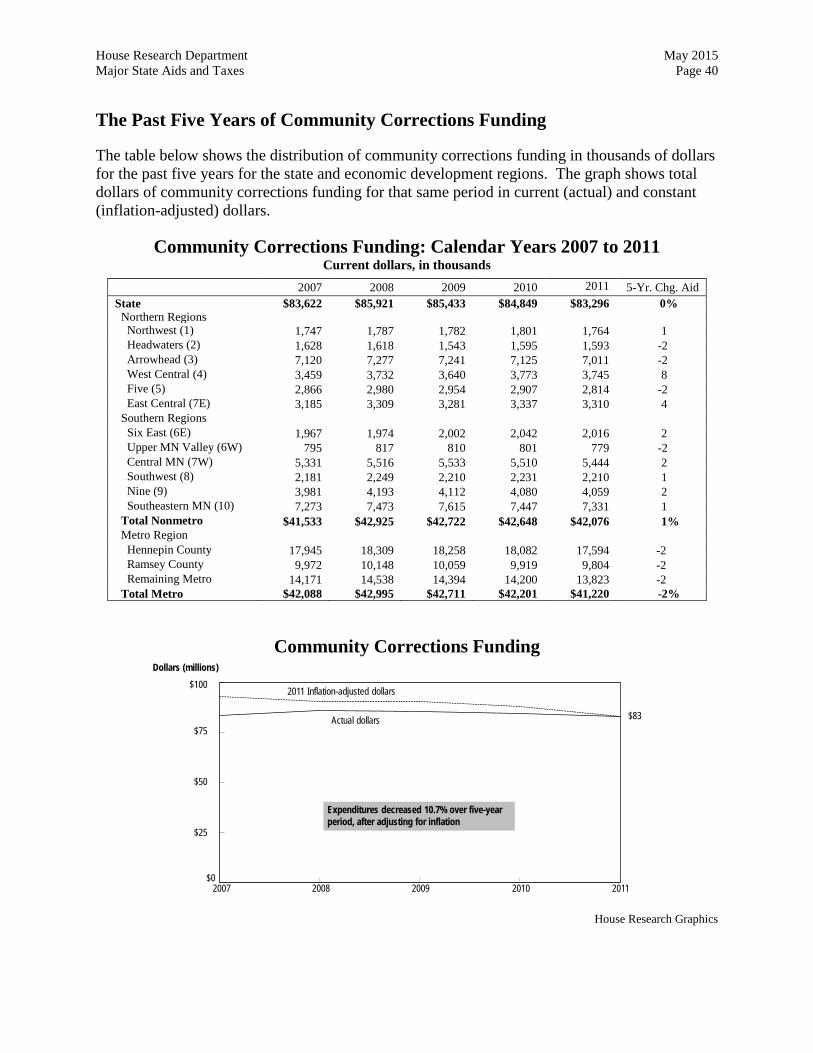
House Research Department May 2015 Major State Aids and Taxes Page 40 The Past Five Years of Community Corrections Funding
The table below shows the distribution of community corrections funding in thousands of dollars for the past five years for the state and economic development regions. The graph shows total dollars of community corrections funding for that same period in current (actual) and constant (inflation-adjusted) dollars.
Community Corrections Funding: Calendar Years 2007 to 2011 Current dollars, in thousands
2007 2008 2009 2010 2011 5-Yr. Chg. Aid State $83,622 $85,921 $85,433 $84,849 $83,296 0% Northern Regions Northwest (1) 1,747 1,787 1,782 1,801 1,764 1 Headwaters (2) 1,628 1,618 1,543 1,595 1,593 -2 Arrowhead (3) 7,120 7,277 7,241 7,125 7,011 -2 West Central (4) 3,459 3,732 3,640 3,773 3,745 8 Five (5) 2,866 2,980 2,954 2,907 2,814 -2 East Central (7E) 3,185 3,309 3,281 3,337 3,310 4 Southern Regions Six East (6E) 1,967 1,974 2,002 2,042 2,016 2 Upper MN Valley (6W) 795 817 810 801 779 -2 Central MN (7W) 5,331 5,516 5,533 5,510 5,444 2 Southwest (8) 2,181 2,249 2,210 2,231 2,210 1 Nine (9) 3,981 4,193 4,112 4,080 4,059 2 Southeastern MN (10) 7,273 7,473 7,615 7,447 7,331 1 Total Nonmetro $41,533 $42,925 $42,722 $42,648 $42,076 1% Metro Region Hennepin County 17,945 18,309 18,258 18,082 17,594 -2 Ramsey County 9,972 10,148 10,059 9,919 9,804 -2 Remaining Metro 14,171 14,538 14,394 14,200 13,823 -2 Total Metro $42,088 $42,995 $42,711 $42,201 $41,220 -2%
Community Corrections Funding
2009 20112007 2008 2010
$83Actual dollars
2011 Inflation-adjusted dollars
$0
$25
$50
$75
Dollars (millions)
Expenditures decreased 10.7% over five-yearperiod, after adjusting for inflation
$100
House Research Graphics
House Research Department May 2015 Major State Aids and Taxes Page 41
Property Tax Refund - Homeowners
Program Description
The property tax refund for homeowners, also called the “circuit breaker,” is a program in which the state partially reimburses homeowners for part of their property taxes if the taxes exceed a percentage of household income. Generally, the higher the property tax and the lower the income, the higher the refund. The legislature establishes the income and property tax thresholds, reimbursement rates, and maximum refund amounts for the program. Each qualifying homeowner must apply directly to the state for a refund.
Aid Amount and Reporting
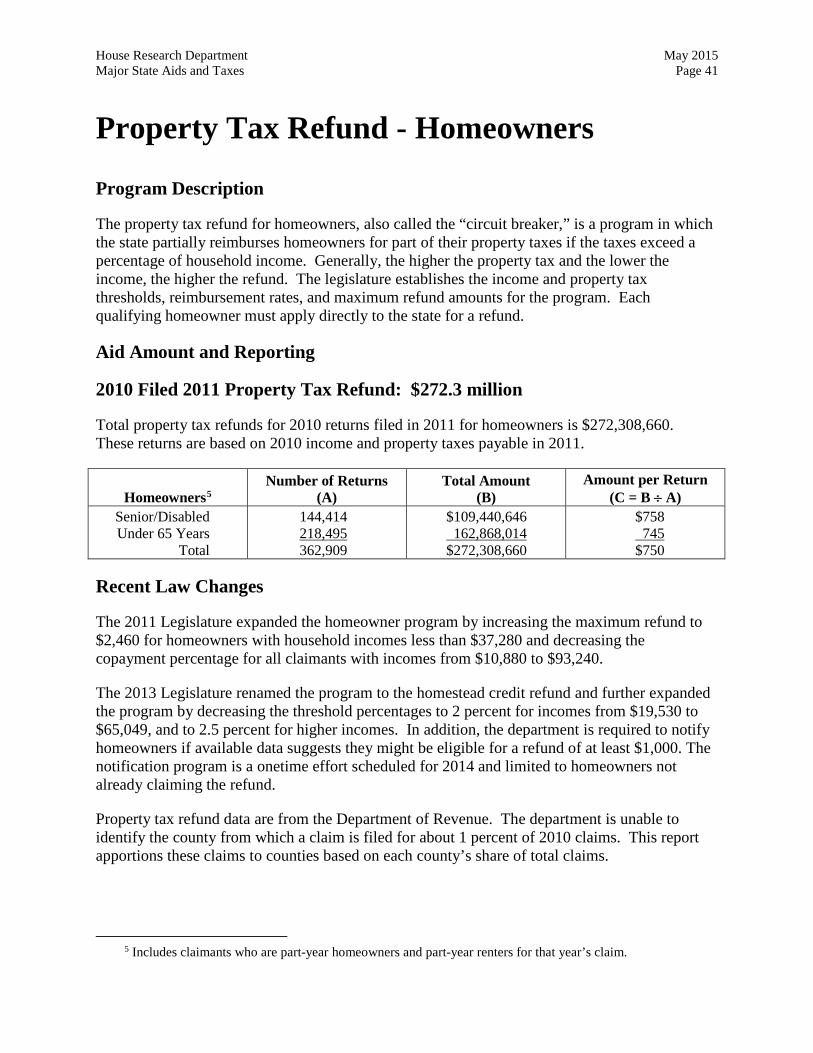
2010 Filed 2011 Property Tax Refund: $272.3 million
Total property tax refunds for 2010 returns filed in 2011 for homeowners is $272,308,660. These returns are based on 2010 income and property taxes payable in 2011.
Homeowners5 Number of Returns
(A) Total Amount
(B) Amount per Return
(C = B ÷ A) Senior/Disabled Under 65 Years
Total
144,414 218,495 362,909
$109,440,646 162,868,014 $272,308,660
$758 745 $750
Recent Law Changes
The 2011 Legislature expanded the homeowner program by increasing the maximum refund to $2,460 for homeowners with household incomes less than $37,280 and decreasing the copayment percentage for all claimants with incomes from $10,880 to $93,240.
The 2013 Legislature renamed the program to the homestead credit refund and further expanded the program by decreasing the threshold percentages to 2 percent for incomes from $19,530 to $65,049, and to 2.5 percent for higher incomes. In addition, the department is required to notify homeowners if available data suggests they might be eligible for a refund of at least $1,000. The notification program is a onetime effort scheduled for 2014 and limited to homeowners not already claiming the refund.
Property tax refund data are from the Department of Revenue. The department is unable to identify the county from which a claim is filed for about 1 percent of 2010 claims. This report apportions these claims to counties based on each county’s share of total claims.
5 Includes claimants who are part-year homeowners and part-year renters for that year’s claim.

House Research Department May 2015 Major State Aids and Taxes Page 42
Property Tax Refund for Homeowners per capita, 2010 (filed 2011) by County
House Research Department
Property Tax Refund
less than $20
$20 to $35
over $35
Average County: $30 Range: $3 to $82 State per capita: $51
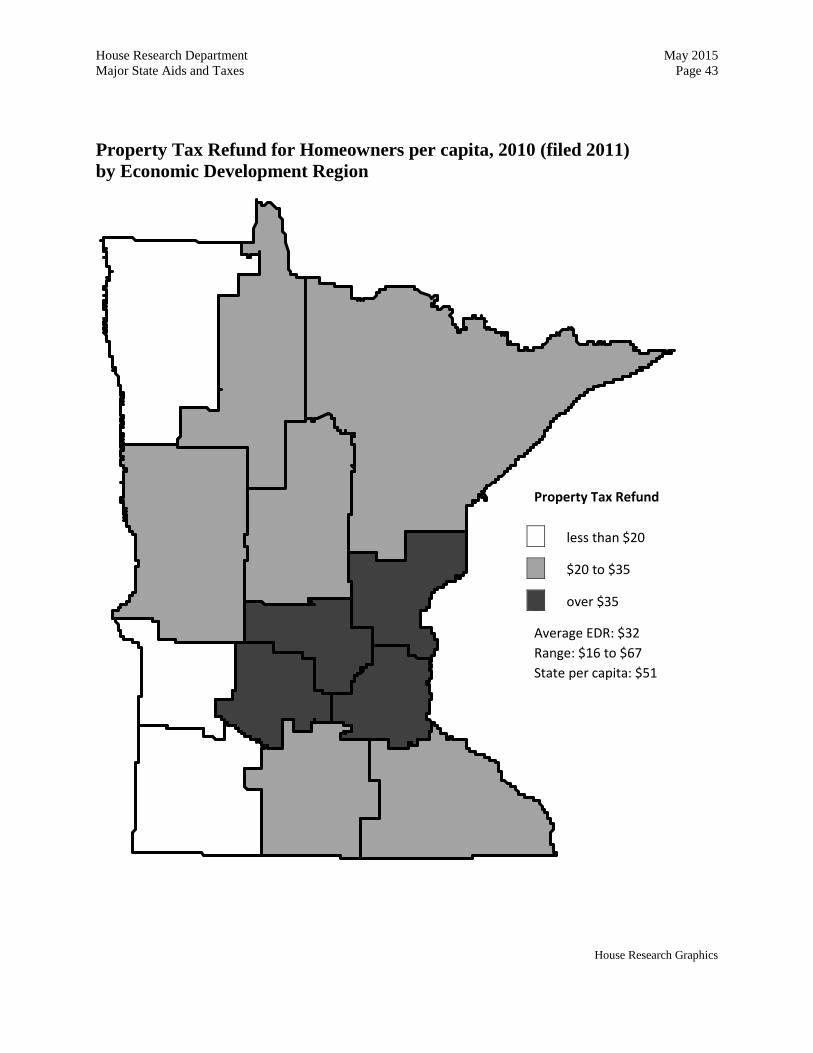
House Research Department May 2015 Major State Aids and Taxes Page 43
Property Tax Refund for Homeowners per capita, 2010 (filed 2011) by Economic Development Region
House Research Graphics
Property Tax Refund
less than $20
$20 to $35
over $35
Average EDR: $32 Range: $16 to $67 State per capita: $51

House Research Department May 2015 Major State Aids and Taxes Page 44 The Past Five Years of Property Tax Refund for Homeowners
The table below shows the distribution of the property tax refund for homeowners in thousands of dollars for the past five years for the state and economic development regions. The graph shows total dollars of the property tax refund for homeowners for that same time period in current (actual) and constant (inflation-adjusted) dollars. The property tax refund for homeowners historical data on this page excludes any targeting data.
Property Tax Refund for Homeowners: 2006 (filed 2007) to 2010 (filed 2011) Current dollars, in thousands
2006 2007 2008 2009 2010 5-Yr. Chg. Aid
State $212,908 $234,123 $269,315 $273,991 $272,309 28% Northern Regions Northwest (1) 1,264 1,515 1,697 1,555 1,498 18 Headwaters (2) 1,559 1,766 1,925 1,842 1,792 15 Arrowhead (3) 6,330 7,063 8,264 8,738 8,487 34 West Central (4) 3,961 4,925 5,654 5,545 5,883 49 Five (5) 4,789 5,108 5,847 5,696 5,330 11 East Central (7E) 7,411 8,429 9,238 8,980 8,515 15 Southern Regions Six East (6E) 3,702 4,037 4,851 5,116 4,706 27 Upper MN Valley (6W) 639 693 745 741 695 9 Central MN (7W) 13,387 15,401 18,944 18,913 18,757 40 Southwest (8) 1,604 1,984 2,278 2,075 2,061 29 Nine (9) 5,169 5,656 6,501 6,497 6,177 19 Southeastern MN (10) 12,675 14,364 16,614 16,955 16,657 31 Total Nonmetro $62,491 $70,940 $82,559 $82,653 $80,557 29% Metro Region Hennepin County 72,135 76,209 90,539 93,902 94,936 32 Ramsey County 25,768 27,414 29,915 28,674 31,259 21 Remaining Metro 52,515 59,561 66,303 68,763 65,556 25 Total Metro $150,417 $163,183 $186,756 $191,339 $191,751 27%
Statewide Property Tax Refund for Homeowners
2008 20102006 2007 2009
$272
Actual dollars
2010 Inflation-adjusted dollars
$0
$100
$200
$300
Dollars (millions)
Expenditures increased 12.6% over five-yearperiod, after adjusting for inflation
$400
House Research Graphics

House Research Department May 2015 Major State Aids and Taxes Page 45
Property Tax Refund - Renters
Program Description
The property tax refund for renters, also called the “renters’ credit,” is a program in which the state partially reimburses renters for part of their qualifying property taxes if the taxes exceed a percentage of household income. Generally, the higher the property tax and the lower the income, the higher the refund. The legislature establishes the income and property tax thresholds, reimbursement rates, and maximum refund amounts for the program and sets the amount of rent deemed to represent property taxes. Each renter must apply directly to the state for a refund.
Aid Amount and Reporting
2010 Filed 2011 Property Tax Refund for Renters: $195.4 million
The total property tax refunds for 2010 returns filed in 2011 for renters is $195,386,756. These returns are based on 2010 income and rent paid in 2010.
Renters Number of Returns
(A) Total Amount
(B) Amount per Return
(C = B ÷ A) Senior/Disabled Under 65 Years
Total
86,350 223,050 309,400
$58,367,746 137,019,010 $195,386,756
$676 614 $632
Recent Law Changes
The 2010 Legislature reduced the percent of rent considered to represent property taxes from 19 percent to 15 percent, for refunds based on rent paid in 2009 only. This put into law the change made in Governor Pawlenty’s 2009 unallotment, which reduced the percentage from 19 to 15 for refunds based on rent paid in 2009. A 2010 decision of the Minnesota Supreme Court invalidated other portions of the unallotment and suggested that the entire unallotment was likely invalid. For refunds based on rent paid in 2010, the percentage reverted to 19 percent.
The 2011 Legislature reduced the percentage of rent considered property taxes from 19 percent to 17 percent, effective beginning with refunds based on rent paid in 2011.
The 2013 Legislature expanded both the homeowner and renter property tax refunds. The legislature decreased the threshold percentages for renters to be no higher than those for homeowners and increased the maximum refund for renters to $2,000.
Property tax refund data are from the Department of Revenue. The department is unable to identify the county from which a claim is filed for about 5 percent of 2010 claims. This report apportions these claims to counties based on each county’s share of total claims.
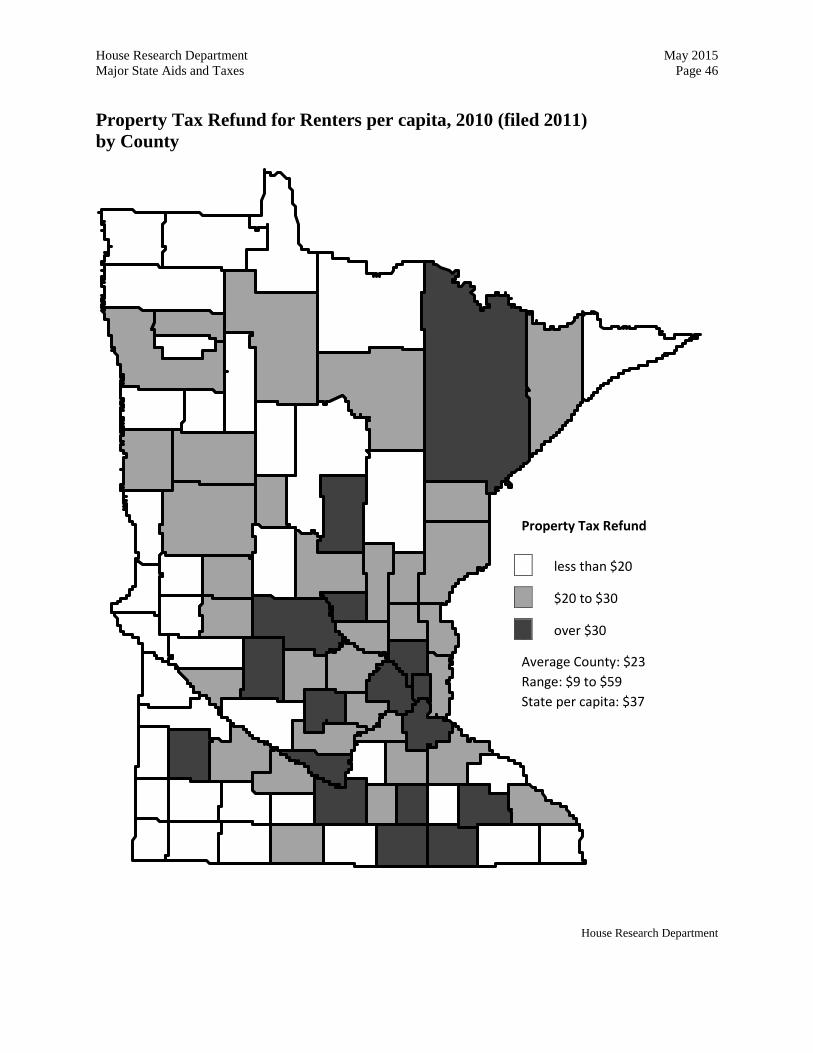
House Research Department May 2015 Major State Aids and Taxes Page 46 Property Tax Refund for Renters per capita, 2010 (filed 2011) by County
House Research Department
Property Tax Refund
less than $20
$20 to $30
over $30
Average County: $23 Range: $9 to $59 State per capita: $37
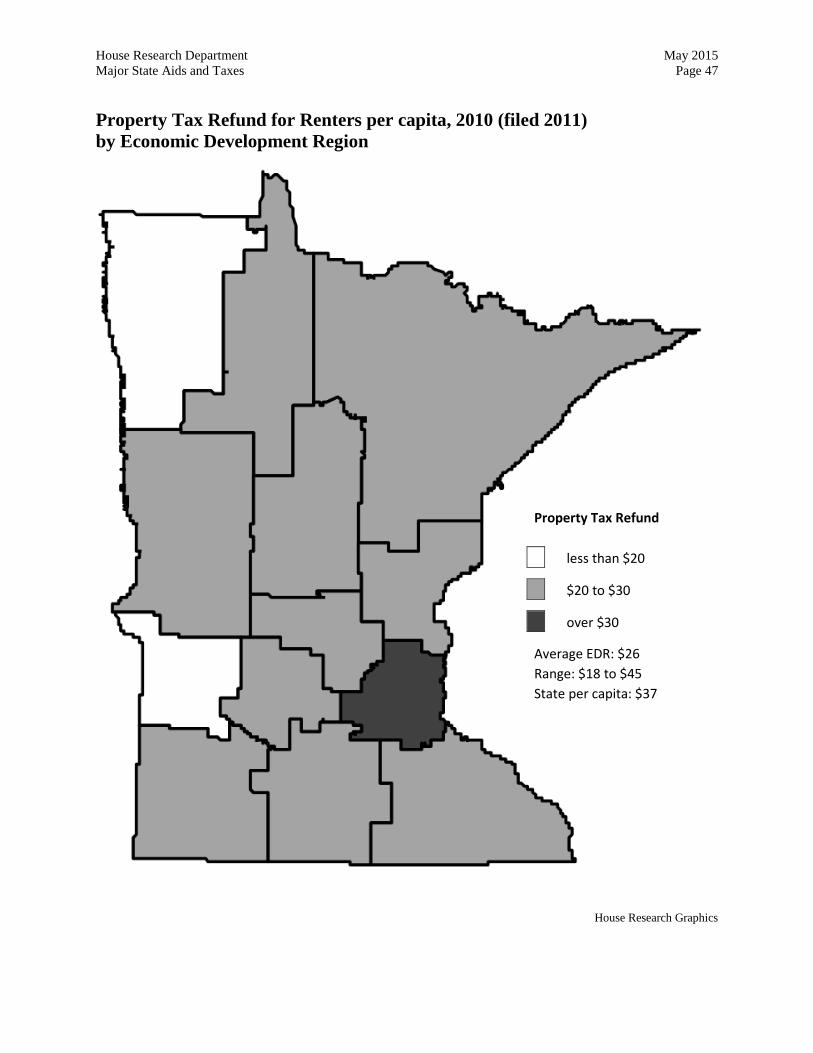
House Research Department May 2015 Major State Aids and Taxes Page 47 Property Tax Refund for Renters per capita, 2010 (filed 2011) by Economic Development Region
House Research Graphics
Property Tax Refund
less than $20
$20 to $30
over $30
Average EDR: $26 Range: $18 to $45 State per capita: $37
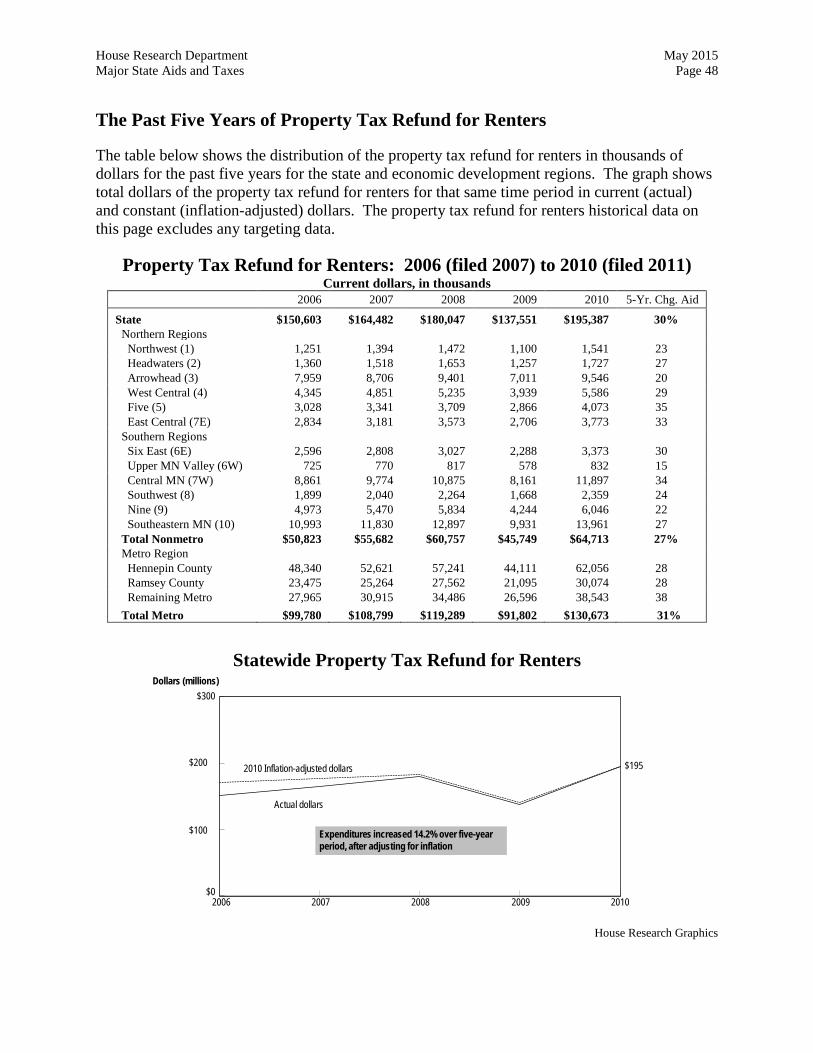
House Research Department May 2015 Major State Aids and Taxes Page 48 The Past Five Years of Property Tax Refund for Renters
The table below shows the distribution of the property tax refund for renters in thousands of dollars for the past five years for the state and economic development regions. The graph shows total dollars of the property tax refund for renters for that same time period in current (actual) and constant (inflation-adjusted) dollars. The property tax refund for renters historical data on this page excludes any targeting data.
Property Tax Refund for Renters: 2006 (filed 2007) to 2010 (filed 2011) Current dollars, in thousands
2006 2007 2008 2009 2010 5-Yr. Chg. Aid
State $150,603 $164,482 $180,047 $137,551 $195,387 30% Northern Regions Northwest (1) 1,251 1,394 1,472 1,100 1,541 23 Headwaters (2) 1,360 1,518 1,653 1,257 1,727 27 Arrowhead (3) 7,959 8,706 9,401 7,011 9,546 20 West Central (4) 4,345 4,851 5,235 3,939 5,586 29 Five (5) 3,028 3,341 3,709 2,866 4,073 35 East Central (7E) 2,834 3,181 3,573 2,706 3,773 33 Southern Regions Six East (6E) 2,596 2,808 3,027 2,288 3,373 30 Upper MN Valley (6W) 725 770 817 578 832 15 Central MN (7W) 8,861 9,774 10,875 8,161 11,897 34 Southwest (8) 1,899 2,040 2,264 1,668 2,359 24 Nine (9) 4,973 5,470 5,834 4,244 6,046 22 Southeastern MN (10) 10,993 11,830 12,897 9,931 13,961 27 Total Nonmetro $50,823 $55,682 $60,757 $45,749 $64,713 27% Metro Region Hennepin County 48,340 52,621 57,241 44,111 62,056 28 Ramsey County 23,475 25,264 27,562 21,095 30,074 28 Remaining Metro 27,965 30,915 34,486 26,596 38,543 38 Total Metro $99,780 $108,799 $119,289 $91,802 $130,673 31%
Statewide Property Tax Refund for Renters
2008 20102006 2007 2009
$195
Actual dollars
2010 Inflation-adjusted dollars
$0
$100
$200
Dollars (millions)
Expenditures increased 14.2% over five-yearperiod, after adjusting for inflation
$300
House Research Graphics
House Research Department May 2015 Major State Aids and Taxes Page 49
Additional Property Tax Refund (Targeting)
Program Description
“Targeting” is an additional property tax refund. The refund targets property tax relief to those homeowners whose property tax increase over the previous year exceeds a threshold percentage set by the legislature. The property tax refund return (M1PR) contains a separate schedule for the targeting refund. The taxpayer files for this refund at the same time and in the same manner as for the regular property tax refund. However, unlike the regular property tax refund, all homeowners qualify for targeting regardless of their household income if the tax increase exceeds the specified percentage.
Aid Amount and Reporting
2011 Targeting Refunds: $1.9 million
For returns filed in 2011 (for property taxes payable in 2011), the state paid 60 percent of the property tax increase over 12 percent (i.e., the taxpayer had to pay the first 12 percent increase over the previous year before qualifying for a refund), provided that the increase was greater than $100. There were 23,016 returns filed in 2011 for a total amount of $1,901,731. The average refund per return was $83. (The maximum refund is $1,000.) The amount of the targeting refund is listed separately on all of the tables in this report, directly after the regular property tax refund amounts.
Targeting refund amounts can change greatly from one year to the next in any given county. Factors resulting in large fluctuations in refunds in recent years include net tax changes due to volatility in the housing market and the phaseout of limited market value.
Fourteen counties reported fewer than four claims for targeted refunds filed in 2011 by senior/disabled claimants and by nonsenior/nondisabled claimants (Clearwater, Faribault, Lac qui Parle, Lake of the Woods, Mahnomen, Marshall, Norman, Red Lake, Roseau, Sibley, Stevens, Traverse, Waseca, and Wilkin). To protect taxpayer confidentiality, the Department of Revenue is unable to provide detailed counts for these counties. These refunds were included in the totals for “county undesignated.”
The total for which the county is undesignated represents less than 2 percent of all claims. This report apportions these claims to the 87 counties based on each county’s share of refunds.
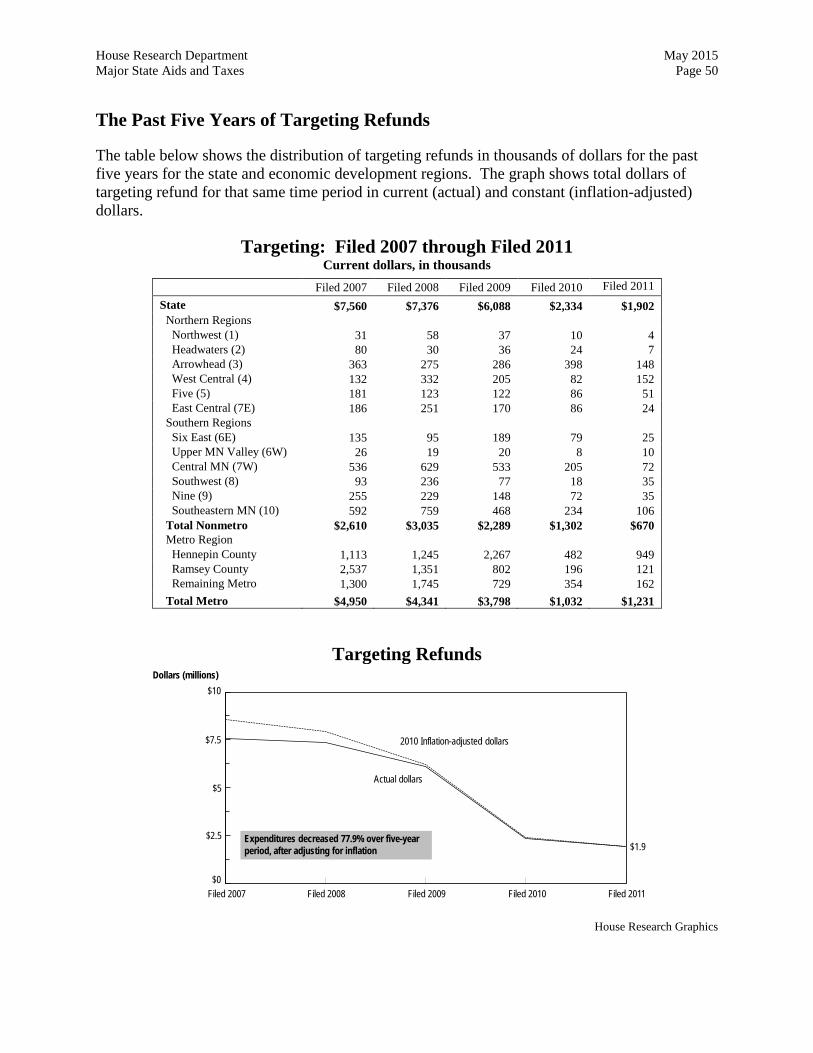
House Research Department May 2015 Major State Aids and Taxes Page 50 The Past Five Years of Targeting Refunds
The table below shows the distribution of targeting refunds in thousands of dollars for the past five years for the state and economic development regions. The graph shows total dollars of targeting refund for that same time period in current (actual) and constant (inflation-adjusted) dollars.
Targeting: Filed 2007 through Filed 2011 Current dollars, in thousands
Filed 2007 Filed 2008 Filed 2009 Filed 2010 Filed 2011 State $7,560 $7,376 $6,088 $2,334 $1,902 Northern Regions Northwest (1) 31 58 37 10 4 Headwaters (2) 80 30 36 24 7 Arrowhead (3) 363 275 286 398 148 West Central (4) 132 332 205 82 152 Five (5) 181 123 122 86 51 East Central (7E) 186 251 170 86 24 Southern Regions Six East (6E) 135 95 189 79 25 Upper MN Valley (6W) 26 19 20 8 10 Central MN (7W) 536 629 533 205 72 Southwest (8) 93 236 77 18 35 Nine (9) 255 229 148 72 35 Southeastern MN (10) 592 759 468 234 106 Total Nonmetro $2,610 $3,035 $2,289 $1,302 $670 Metro Region Hennepin County 1,113 1,245 2,267 482 949 Ramsey County 2,537 1,351 802 196 121 Remaining Metro 1,300 1,745 729 354 162 Total Metro $4,950 $4,341 $3,798 $1,032 $1,231
Targeting Refunds
Filed 2007 Filed 2008
$1.9
Actual dollars
2010 Inflation-adjusted dollars
$0
$5
Dollars (millions)
Expenditures decreased 77.9% over five-yearperiod, after adjusting for inflation
Filed 2009 Filed 2010 Filed 2011
$2.5
$10
$7.5
House Research Graphics
Property Tax Data
House Research Department May 2015 Major State Aids and Taxes Page 52
Market Value Agricultural Credit
Program Description
The 2001 Legislature created a new market value agricultural credit for all agricultural homestead property. The credit took effect for taxes payable in 2002 and was enhanced by the 2002 Legislature for taxes payable in 2003 and thereafter.
For agricultural homestead property with a taxable market value of $115,000 or less, the credit is equal to 0.3 percent of the taxable market value of the property. For agricultural homestead property with a value between $115,000 and $345,000, the credit is equal to $345 minus 0.05 percent of the value over $115,000. For property with a value over $345,000, the credit is equal to $230. This credit does not apply to the value of the house, garage, and one acre of agricultural homestead property.
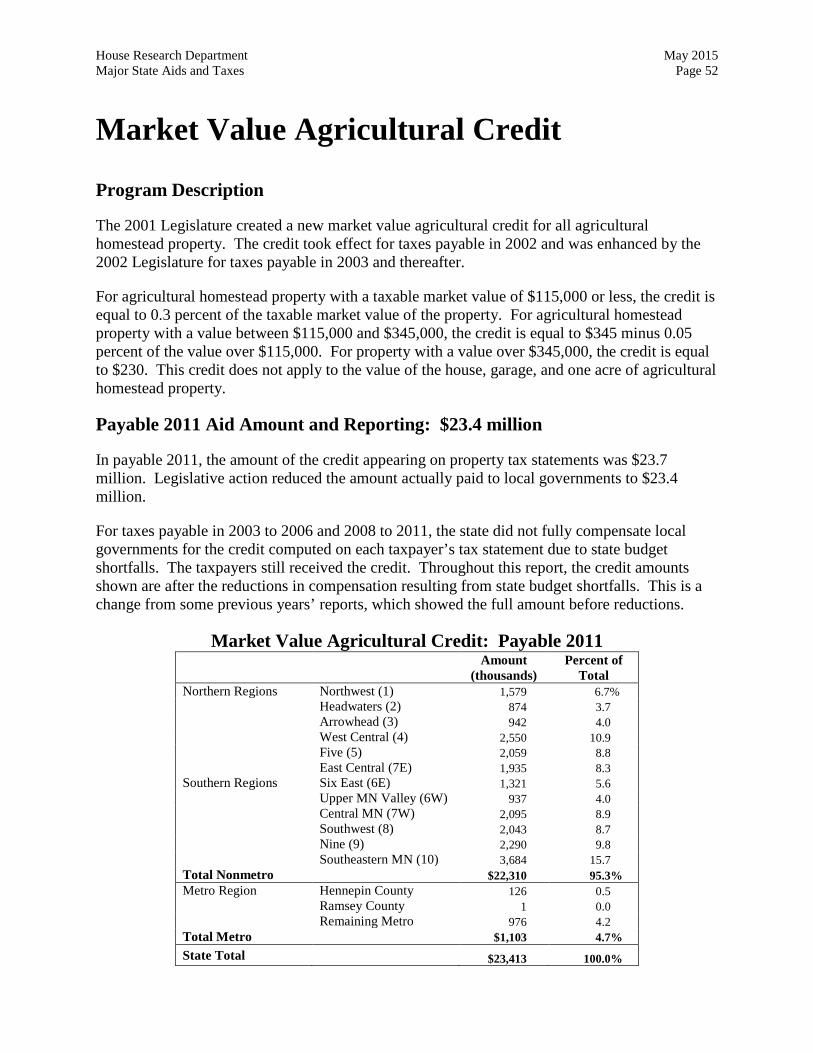
Payable 2011 Aid Amount and Reporting: $23.4 million
In payable 2011, the amount of the credit appearing on property tax statements was $23.7 million. Legislative action reduced the amount actually paid to local governments to $23.4 million.
For taxes payable in 2003 to 2006 and 2008 to 2011, the state did not fully compensate local governments for the credit computed on each taxpayer’s tax statement due to state budget shortfalls. The taxpayers still received the credit. Throughout this report, the credit amounts shown are after the reductions in compensation resulting from state budget shortfalls. This is a change from some previous years’ reports, which showed the full amount before reductions.
Market Value Agricultural Credit: Payable 2011 Amount
(thousands) Percent of
Total Northern Regions Northwest (1) 1,579 6.7% Headwaters (2) 874 3.7 Arrowhead (3) 942 4.0 West Central (4) 2,550 10.9 Five (5) 2,059 8.8 East Central (7E) 1,935 8.3 Southern Regions Six East (6E) 1,321 5.6 Upper MN Valley (6W) 937 4.0 Central MN (7W) 2,095 8.9 Southwest (8) 2,043 8.7 Nine (9) 2,290 9.8 Southeastern MN (10) 3,684 15.7 Total Nonmetro $22,310 95.3% Metro Region Hennepin County 126 0.5 Ramsey County 1 0.0 Remaining Metro 976 4.2 Total Metro $1,103 4.7% State Total $23,413 100.0%

House Research Department May 2015 Major State Aids and Taxes Page 53
Market Value Homestead Credit
Program Description
As part of property tax reform measures, the 2001 Legislature enacted the market value homestead credit effective for taxes payable in 2002 and thereafter.
The credit applies to each homestead property and appears on the tax statement as a subtraction from gross tax. For a homestead with a taxable market value of $76,000 or less, the credit is 0.4 percent of the taxable market value. For a homestead with a taxable market value over $76,000, the credit is $304 minus 0.09 percent of the value over $76,000. Under this formula, homesteads valued over $414,000 receive no market value homestead credit. For taxes payable in 2003 to 2006, and 2008 to 2011, the state did not fully compensate local governments for the credit computed on each taxpayer’s tax statement due to state budget shortfalls. The taxpayers still received the credit. Throughout this report, the credit amounts shown are the amounts paid by the state to local governments after any reductions due to state budget shortfalls or unallotments. Some previous years’ reports showed the full amount before reductions.
For agricultural homesteads, this credit applies only to the value of the house, garage, and one acre of land.
The market value homestead credits discussed in this section are listed on the property tax statement. The property’s tax minus any applicable property tax credits equals the net tax that the taxpayer must pay to the county for distribution to local governmental units.
Credit Amount and Reporting
Payable 2011 Aid Market Value Homestead Credit: $156.5 million
In payable 2011, the amount of the credit appearing on property tax statements was $291.2 million. Legislative action reduced the amount actually paid to local governments to $156.5 million. Recent Law Changes
In 2011 the homestead market value credit was repealed and replaced with a valuation exclusion. The last year the credit was in effect was for taxes payable in 2011; this is the last version of this report that will show the credit.
For comparability across years, the historical data on page 56 show amounts actually paid.

House Research Department May 2015 Major State Aids and Taxes Page 54 Market Value Homestead Credit per capita, 2011 by County
House Research Graphics
Market Value Credit
less than $35
$35 to $50
over $50
Average County: $42 Range: $16 to $59 State per capita: $29
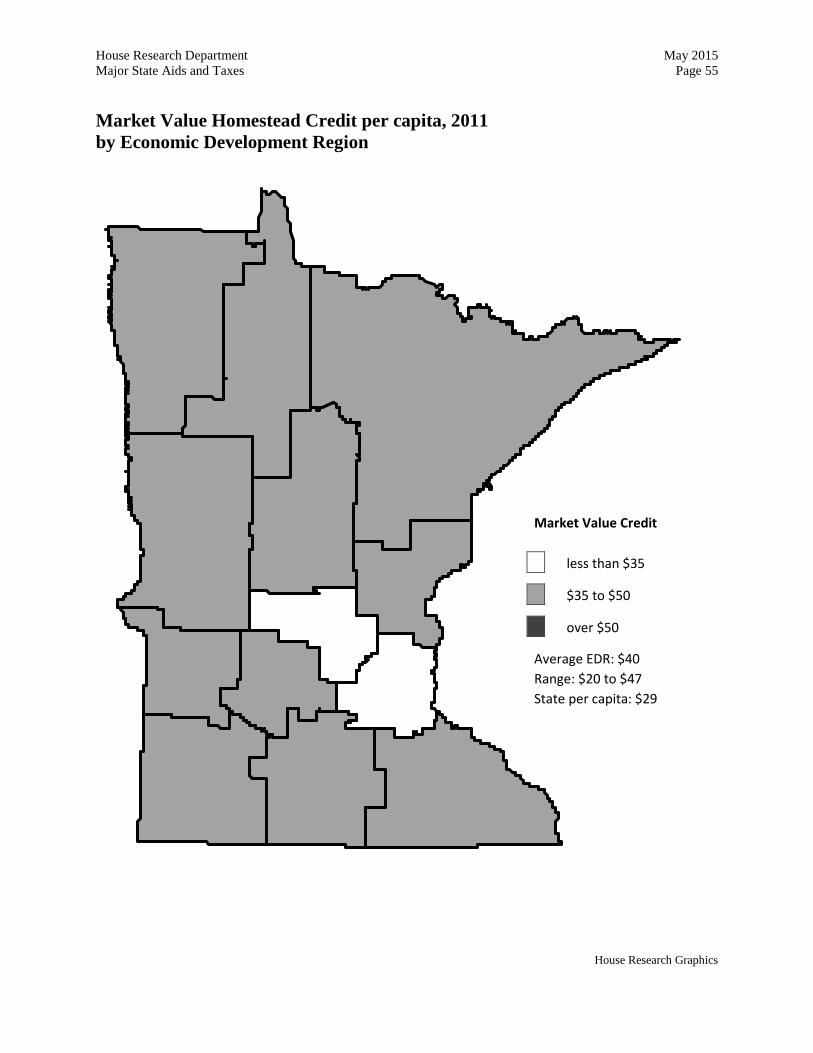
House Research Department May 2015 Major State Aids and Taxes Page 55 Market Value Homestead Credit per capita, 2011 by Economic Development Region
House Research Graphics
Market Value Credit
less than $35
$35 to $50
over $50
Average EDR: $40 Range: $20 to $47 State per capita: $29
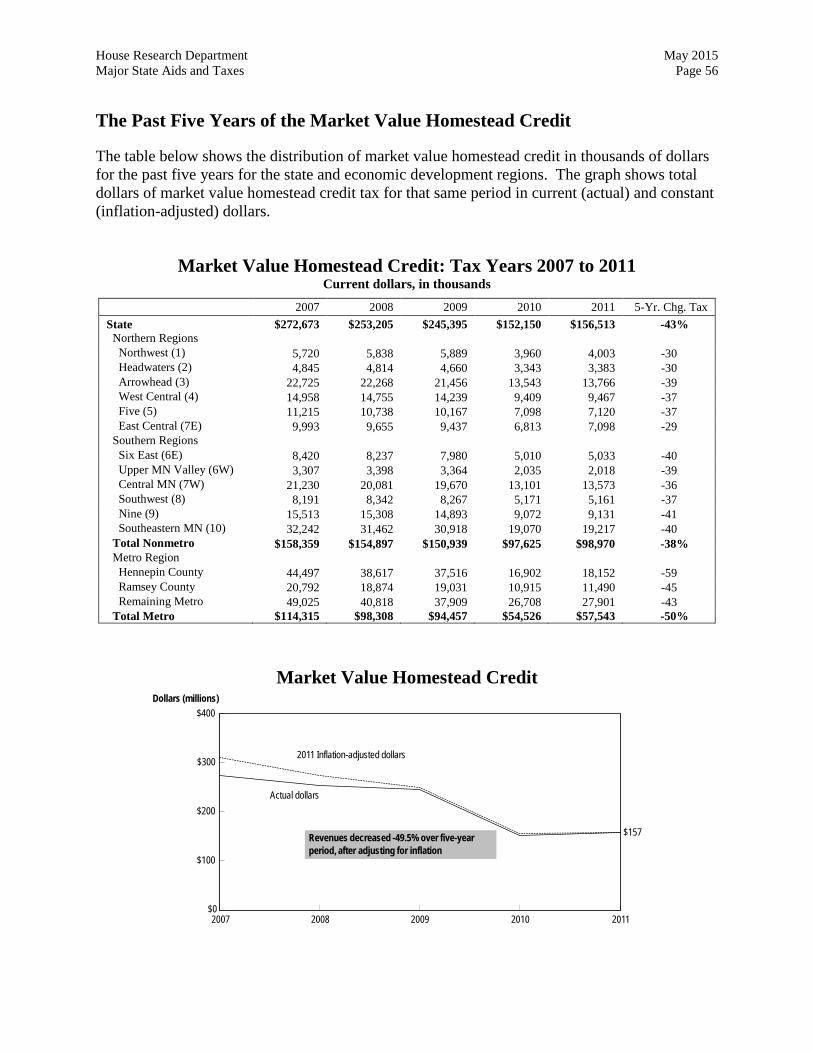
House Research Department May 2015 Major State Aids and Taxes Page 56 The Past Five Years of the Market Value Homestead Credit
The table below shows the distribution of market value homestead credit in thousands of dollars for the past five years for the state and economic development regions. The graph shows total dollars of market value homestead credit tax for that same period in current (actual) and constant (inflation-adjusted) dollars.
Market Value Homestead Credit: Tax Years 2007 to 2011
Current dollars, in thousands
2007 2008 2009 2010 2011 5-Yr. Chg. Tax State $272,673 $253,205 $245,395 $152,150 $156,513 -43% Northern Regions Northwest (1) 5,720 5,838 5,889 3,960 4,003 -30 Headwaters (2) 4,845 4,814 4,660 3,343 3,383 -30 Arrowhead (3) 22,725 22,268 21,456 13,543 13,766 -39 West Central (4) 14,958 14,755 14,239 9,409 9,467 -37 Five (5) 11,215 10,738 10,167 7,098 7,120 -37 East Central (7E) 9,993 9,655 9,437 6,813 7,098 -29 Southern Regions Six East (6E) 8,420 8,237 7,980 5,010 5,033 -40 Upper MN Valley (6W) 3,307 3,398 3,364 2,035 2,018 -39 Central MN (7W) 21,230 20,081 19,670 13,101 13,573 -36 Southwest (8) 8,191 8,342 8,267 5,171 5,161 -37 Nine (9) 15,513 15,308 14,893 9,072 9,131 -41 Southeastern MN (10) 32,242 31,462 30,918 19,070 19,217 -40 Total Nonmetro $158,359 $154,897 $150,939 $97,625 $98,970 -38% Metro Region Hennepin County 44,497 38,617 37,516 16,902 18,152 -59 Ramsey County 20,792 18,874 19,031 10,915 11,490 -45 Remaining Metro 49,025 40,818 37,909 26,708 27,901 -43 Total Metro $114,315 $98,308 $94,457 $54,526 $57,543 -50%
Market Value Homestead Credit
2009 20112007 2008 2010
Actual dollars
2011 Inflation-adjusted dollars
$0
$100
$200
Dollars (millions)
$157Revenues decreased -49.5% over five-yearperiod, after adjusting for inflation
$300
$400
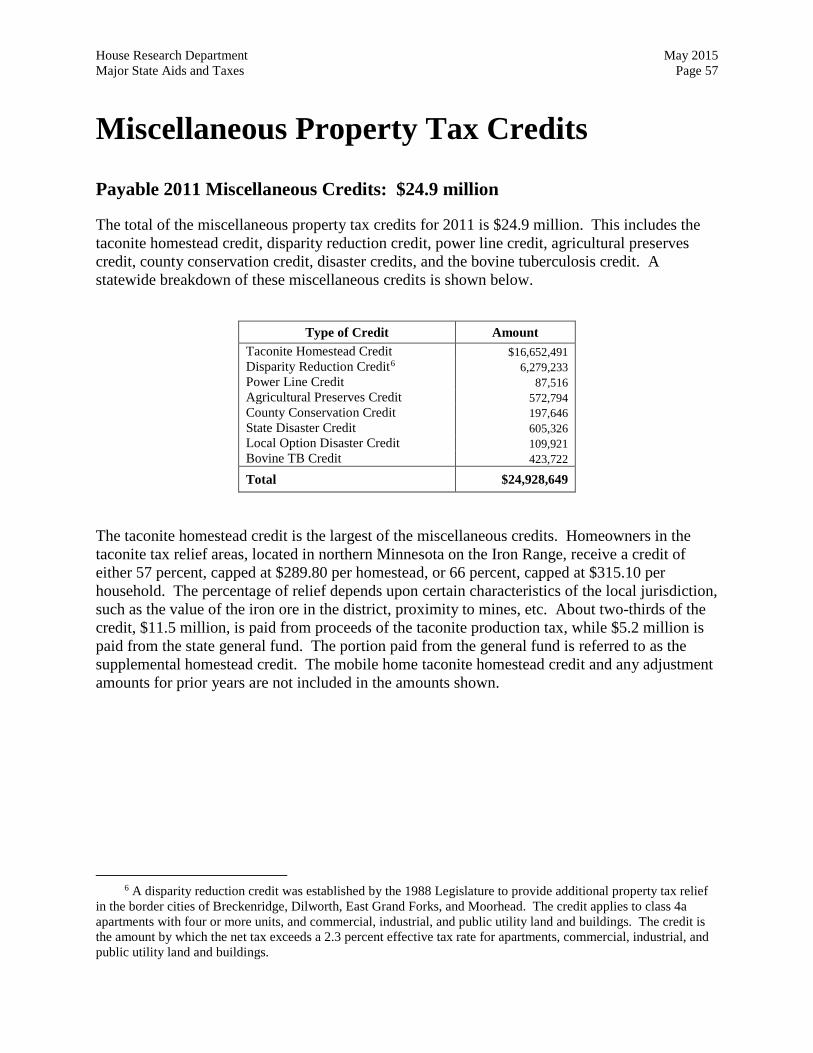
House Research Department May 2015 Major State Aids and Taxes Page 57
Miscellaneous Property Tax Credits
Payable 2011 Miscellaneous Credits: $24.9 million
The total of the miscellaneous property tax credits for 2011 is $24.9 million. This includes the taconite homestead credit, disparity reduction credit, power line credit, agricultural preserves credit, county conservation credit, disaster credits, and the bovine tuberculosis credit. A statewide breakdown of these miscellaneous credits is shown below.
Type of Credit Amount Taconite Homestead Credit $16,652,491 Disparity Reduction Credit6 6,279,233 Power Line Credit 87,516 Agricultural Preserves Credit 572,794 County Conservation Credit 197,646 State Disaster Credit 605,326 Local Option Disaster Credit 109,921 Bovine TB Credit 423,722
Total $24,928,649
The taconite homestead credit is the largest of the miscellaneous credits. Homeowners in the taconite tax relief areas, located in northern Minnesota on the Iron Range, receive a credit of either 57 percent, capped at $289.80 per homestead, or 66 percent, capped at $315.10 per household. The percentage of relief depends upon certain characteristics of the local jurisdiction, such as the value of the iron ore in the district, proximity to mines, etc. About two-thirds of the credit, $11.5 million, is paid from proceeds of the taconite production tax, while $5.2 million is paid from the state general fund. The portion paid from the general fund is referred to as the supplemental homestead credit. The mobile home taconite homestead credit and any adjustment amounts for prior years are not included in the amounts shown.
6 A disparity reduction credit was established by the 1988 Legislature to provide additional property tax relief in the border cities of Breckenridge, Dilworth, East Grand Forks, and Moorhead. The credit applies to class 4a apartments with four or more units, and commercial, industrial, and public utility land and buildings. The credit is the amount by which the net tax exceeds a 2.3 percent effective tax rate for apartments, commercial, industrial, and public utility land and buildings.
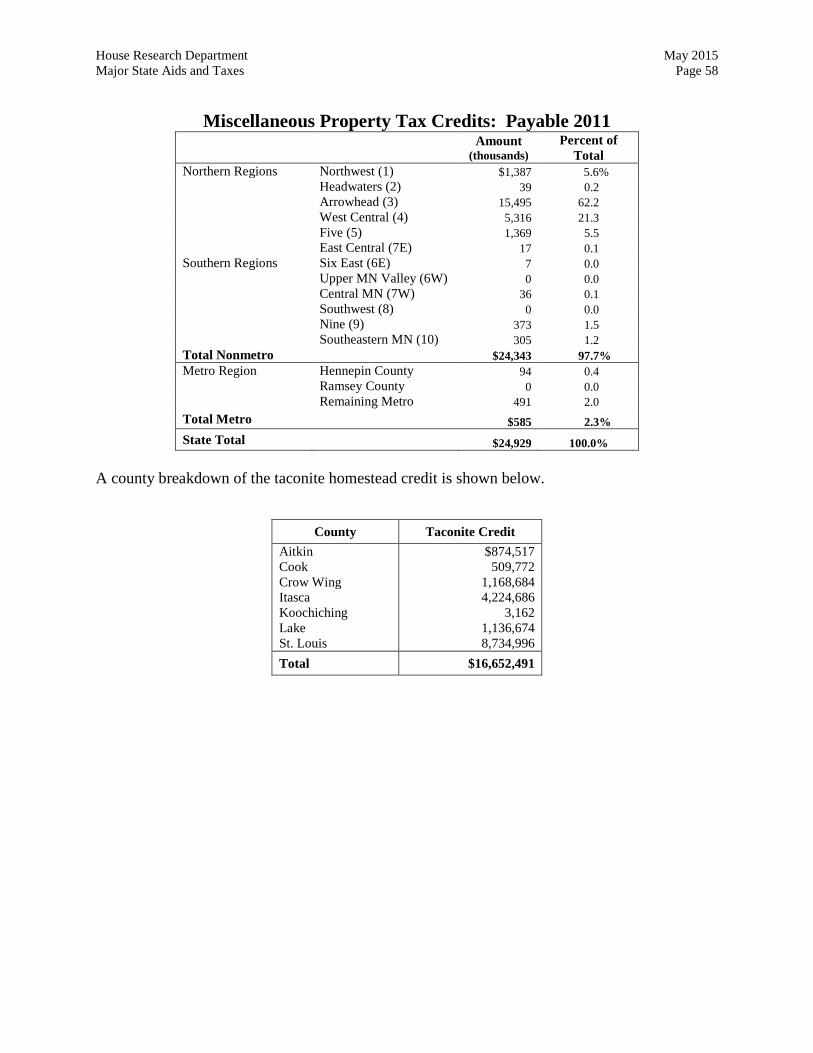
House Research Department May 2015 Major State Aids and Taxes Page 58
Miscellaneous Property Tax Credits: Payable 2011 Amount
(thousands) Percent of
Total Northern Regions Northwest (1) $1,387 5.6% Headwaters (2) 39 0.2 Arrowhead (3) 15,495 62.2 West Central (4) 5,316 21.3 Five (5) 1,369 5.5 East Central (7E) 17 0.1 Southern Regions Six East (6E) 7 0.0 Upper MN Valley (6W) 0 0.0 Central MN (7W) 36 0.1 Southwest (8) 0 0.0 Nine (9) 373 1.5 Southeastern MN (10) 305 1.2 Total Nonmetro $24,343 97.7% Metro Region Hennepin County 94 0.4 Ramsey County 0 0.0 Remaining Metro 491 2.0 Total Metro $585 2.3% State Total $24,929 100.0%
A county breakdown of the taconite homestead credit is shown below.
County Taconite Credit Aitkin $874,517 Cook 509,772 Crow Wing 1,168,684 Itasca 4,224,686 Koochiching 3,162 Lake 1,136,674 St. Louis 8,734,996 Total $16,652,491
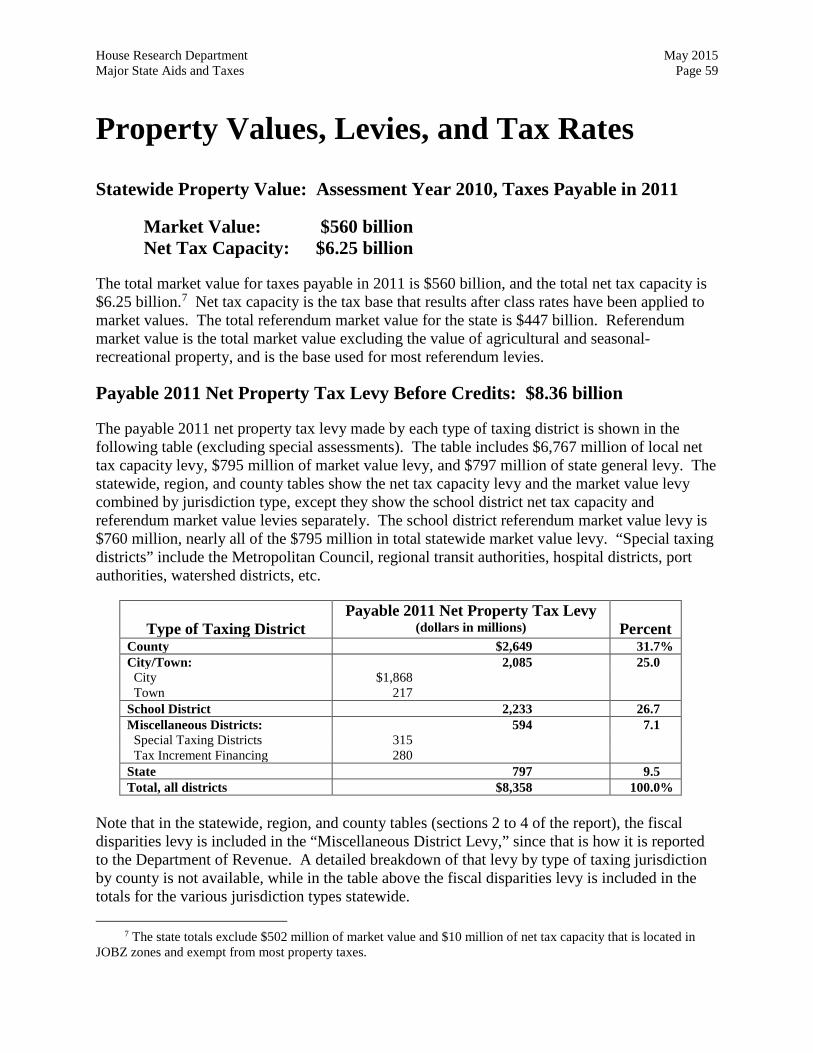
House Research Department May 2015 Major State Aids and Taxes Page 59
Property Values, Levies, and Tax Rates
Statewide Property Value: Assessment Year 2010, Taxes Payable in 2011
Market Value: $560 billion Net Tax Capacity: $6.25 billion
The total market value for taxes payable in 2011 is $560 billion, and the total net tax capacity is $6.25 billion.7 Net tax capacity is the tax base that results after class rates have been applied to market values. The total referendum market value for the state is $447 billion. Referendum market value is the total market value excluding the value of agricultural and seasonal-recreational property, and is the base used for most referendum levies.
Payable 2011 Net Property Tax Levy Before Credits: $8.36 billion
The payable 2011 net property tax levy made by each type of taxing district is shown in the following table (excluding special assessments). The table includes $6,767 million of local net tax capacity levy, $795 million of market value levy, and $797 million of state general levy. The statewide, region, and county tables show the net tax capacity levy and the market value levy combined by jurisdiction type, except they show the school district net tax capacity and referendum market value levies separately. The school district referendum market value levy is $760 million, nearly all of the $795 million in total statewide market value levy. “Special taxing districts” include the Metropolitan Council, regional transit authorities, hospital districts, port authorities, watershed districts, etc.
Type of Taxing District
Payable 2011 Net Property Tax Levy (dollars in millions)
Percent
County $2,649 31.7% City/Town: 2,085 25.0 City $1,868 Town 217 School District 2,233 26.7 Miscellaneous Districts: 594 7.1 Special Taxing Districts 315 Tax Increment Financing 280 State 797 9.5 Total, all districts $8,358 100.0%
Note that in the statewide, region, and county tables (sections 2 to 4 of the report), the fiscal disparities levy is included in the “Miscellaneous District Levy,” since that is how it is reported to the Department of Revenue. A detailed breakdown of that levy by type of taxing jurisdiction by county is not available, while in the table above the fiscal disparities levy is included in the totals for the various jurisdiction types statewide.
7 The state totals exclude $502 million of market value and $10 million of net tax capacity that is located in JOBZ zones and exempt from most property taxes.
House Research Department May 2015 Major State Aids and Taxes Page 60
Payable 2011 Net Property Taxes Payable: $8.15 billion
“Net property tax levy” is the amount levied before reductions for state-paid property tax credits. The net property tax payable, which is the amount that appears on property tax statements, is $8,154 million, which is the total levy of $8,359 million minus property tax credits of $205 million.
Payable 2011 Average Tax Rate Calculations
The average net tax capacity rate is computed by dividing the total net tax capacity levy excluding special assessments by the total net tax capacity, then multiplying by 100.
The tables show separate average tax rates for the net tax capacity levy and the referendum market value levy.
For purposes of the net tax capacity tax rate calculation:
• “levy” includes the tax increment financing levy and the fiscal disparities contribution levy; and
• “tax capacity” includes the total net tax capacity before the subtraction of the tax increment financing captured net tax capacity and before any fiscal disparities adjustments.
This rate represents the average local net tax capacity rate of taxation on all property.
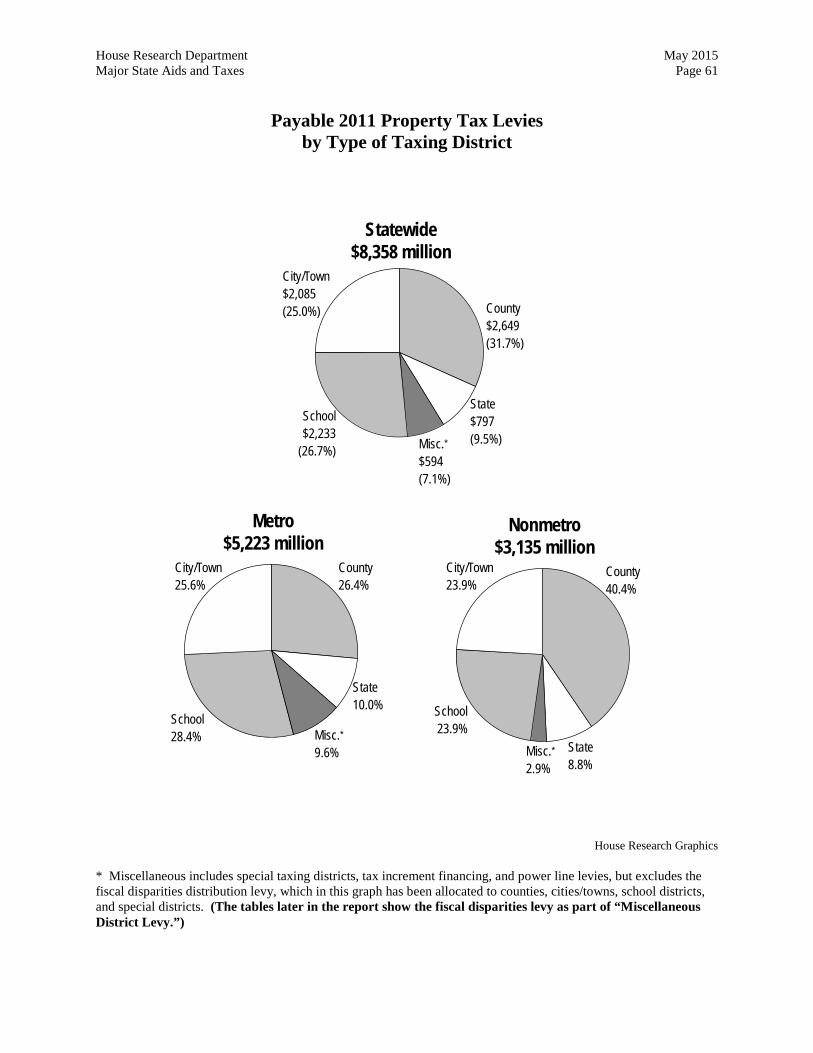
House Research Department May 2015 Major State Aids and Taxes Page 61
Payable 2011 Property Tax Levies by Type of Taxing District
Statewide$8,358 million
City/Town25.6%
School28.4%
State10.0%
County40.4%
City/Town23.9%
School23.9%
Misc.*2.9%
County$2,649(31.7%)
City/Town$2,085(25.0%)
School$2,233
(26.7%) Misc.*$594(7.1%)
Metro$5,223 million
Nonmetro$3,135 million
County26.4%
State$797(9.5%)
Misc.*9.6% State
8.8%
House Research Graphics
* Miscellaneous includes special taxing districts, tax increment financing, and power line levies, but excludes the fiscal disparities distribution levy, which in this graph has been allocated to counties, cities/towns, school districts, and special districts. (The tables later in the report show the fiscal disparities levy as part of “Miscellaneous District Levy.”)
Major State Taxes
House Research Department May 2015 Major State Aids and Taxes Page 63
Individual Income Tax
Program Description
Individual income tax is a tax imposed by the state upon (1) the income of Minnesota residents and (2) the income, derived from Minnesota sources, of nonresident individuals. The 2010 tax base (filed in 2011) is federal taxable income with minor modifications, including the addition of interest earned on bonds issued by non-Minnesota state and local governments, and subtractions for military pay, charitable contributions of nonitemizers, and certain dependent education expenses. Rates applied in 2010 ranged from 5.35 percent to 7.85 percent. In 2010, Minnesota allowed a refundable dependent care credit of up to $720 for one child and $1,440 for two or more children, a refundable credit of up to $1,000 per child for K-12 education expenses, and a working family credit tied to the federal earned income credit. The maximum working family credit was $1,762.
Tax Amount and Reporting
2010 Filed 2011 Individual Income Tax: $6.9 billion $6.5 billion from residents
The total amount of the 2010 individual income tax returns filed in 2011 is $6,899.6 million. The tax shown is net tax (after refunds) reported on the basis of the filer’s county of residence. The state total includes $368.9 million of individual income taxes collected from returns filed by nonresident taxpayers, which was not allocated to the counties in this report, resulting in a net amount of $6,530.7 million collected from Minnesota residents.
Individual income tax data was obtained from the Department of Revenue.
Recent Law Changes
Minnesota has conformed with all major changes made in the federal tax code through tax year 2014, except that Minnesota does not allow the additional standard deduction amount for married filers for tax years 2011 to 2013. Instead, Minnesota taxpayers were required to add the additional deduction amount to state taxable income.
Effective in tax year 2013, Minnesota added a fourth rate of 9.85 percent. The new rate applies to taxable income in excess of $250,000 for married joint filers, $150,000 for single filers, and $200,000 for head of household filers.
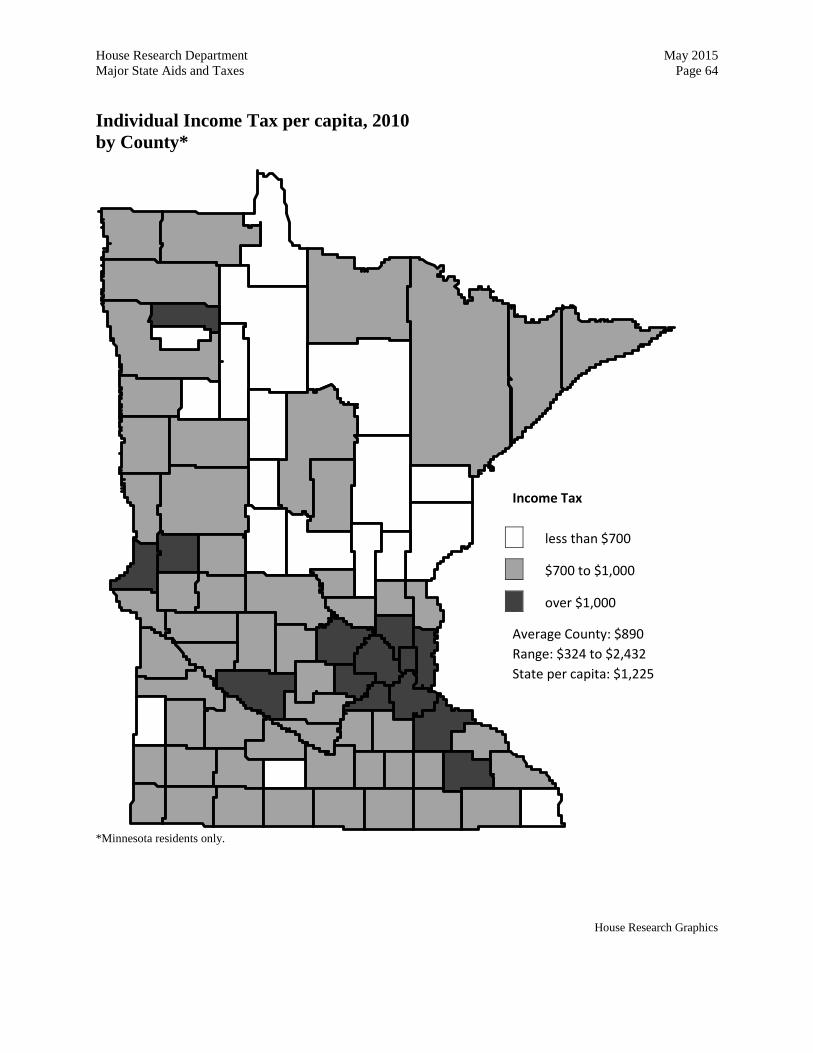
House Research Department May 2015 Major State Aids and Taxes Page 64 Individual Income Tax per capita, 2010 by County*
*Minnesota residents only.
House Research Graphics
Income Tax
less than $700
$700 to $1,000
over $1,000
Average County: $890 Range: $324 to $2,432 State per capita: $1,225
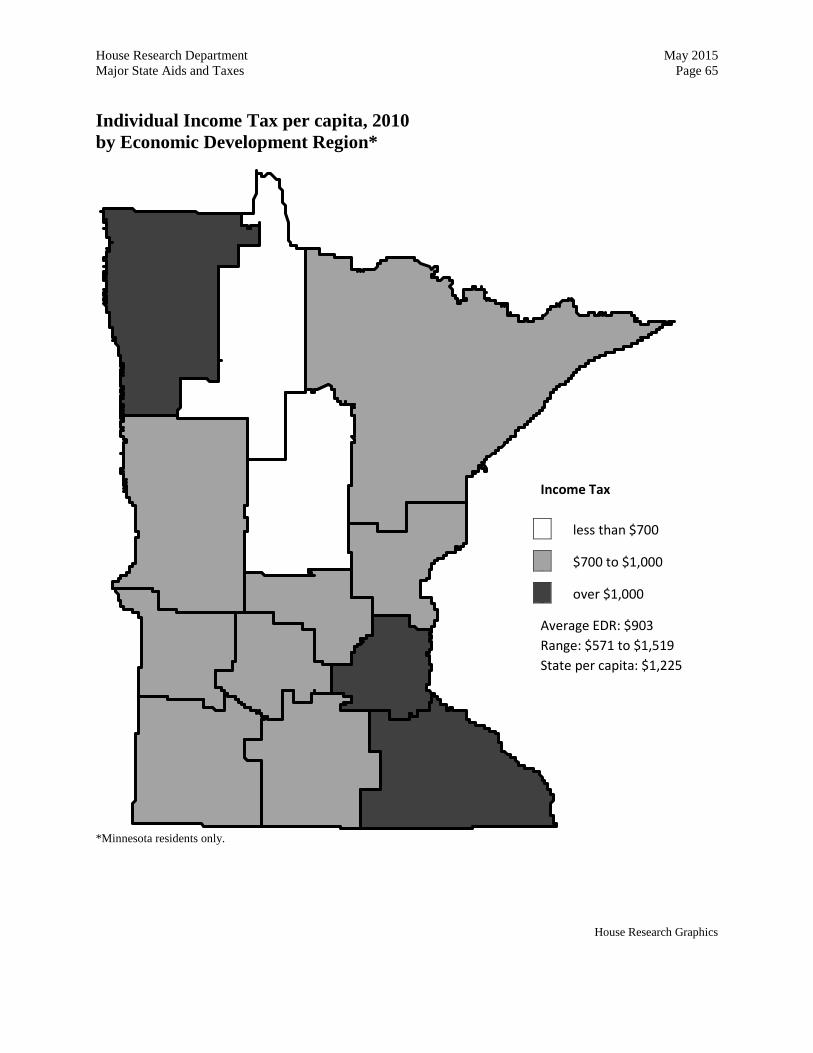
House Research Department May 2015 Major State Aids and Taxes Page 65 Individual Income Tax per capita, 2010 by Economic Development Region*
*Minnesota residents only.
House Research Graphics
Income Tax
less than $700
$700 to $1,000
over $1,000
Average EDR: $903 Range: $571 to $1,519 State per capita: $1,225
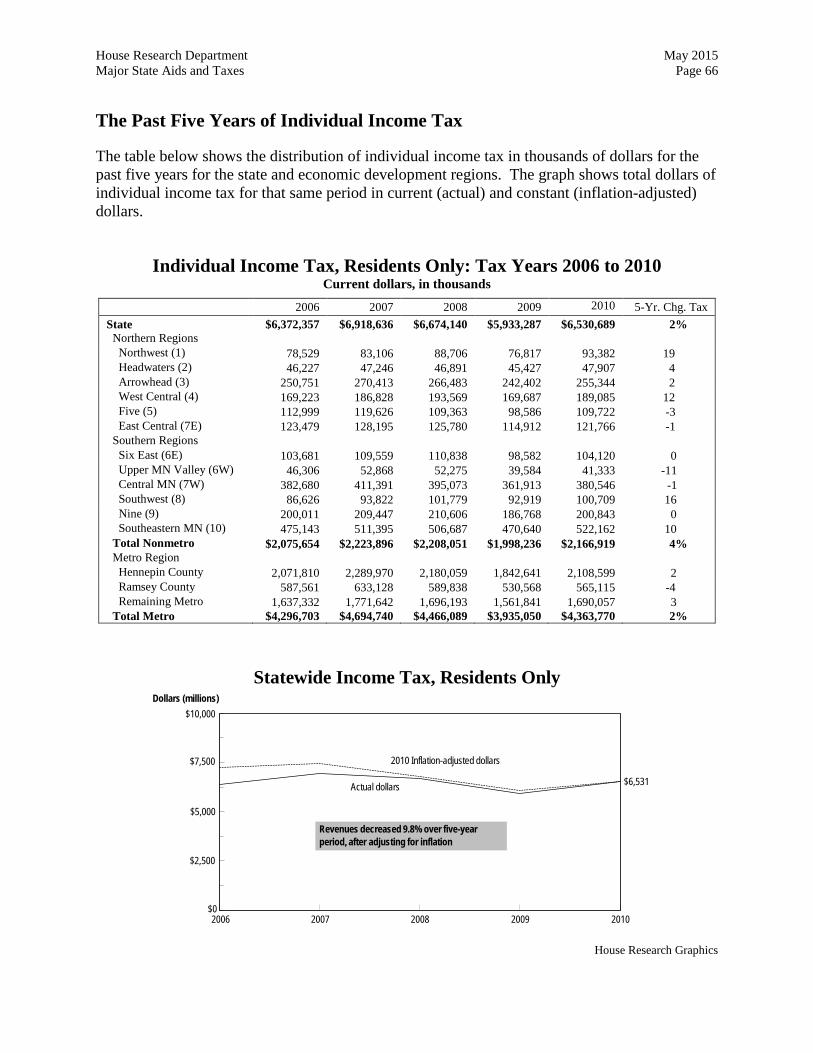
House Research Department May 2015 Major State Aids and Taxes Page 66 The Past Five Years of Individual Income Tax
The table below shows the distribution of individual income tax in thousands of dollars for the past five years for the state and economic development regions. The graph shows total dollars of individual income tax for that same period in current (actual) and constant (inflation-adjusted) dollars.
Individual Income Tax, Residents Only: Tax Years 2006 to 2010
Current dollars, in thousands
2006 2007 2008 2009 2010 5-Yr. Chg. Tax State $6,372,357 $6,918,636 $6,674,140 $5,933,287 $6,530,689 2% Northern Regions Northwest (1) 78,529 83,106 88,706 76,817 93,382 19 Headwaters (2) 46,227 47,246 46,891 45,427 47,907 4 Arrowhead (3) 250,751 270,413 266,483 242,402 255,344 2 West Central (4) 169,223 186,828 193,569 169,687 189,085 12 Five (5) 112,999 119,626 109,363 98,586 109,722 -3 East Central (7E) 123,479 128,195 125,780 114,912 121,766 -1 Southern Regions Six East (6E) 103,681 109,559 110,838 98,582 104,120 0 Upper MN Valley (6W) 46,306 52,868 52,275 39,584 41,333 -11 Central MN (7W) 382,680 411,391 395,073 361,913 380,546 -1 Southwest (8) 86,626 93,822 101,779 92,919 100,709 16 Nine (9) 200,011 209,447 210,606 186,768 200,843 0 Southeastern MN (10) 475,143 511,395 506,687 470,640 522,162 10 Total Nonmetro $2,075,654 $2,223,896 $2,208,051 $1,998,236 $2,166,919 4% Metro Region Hennepin County 2,071,810 2,289,970 2,180,059 1,842,641 2,108,599 2 Ramsey County 587,561 633,128 589,838 530,568 565,115 -4 Remaining Metro 1,637,332 1,771,642 1,696,193 1,561,841 1,690,057 3 Total Metro $4,296,703 $4,694,740 $4,466,089 $3,935,050 $4,363,770 2%
Statewide Income Tax, Residents Only
2008 20102006 2007 2009
Actual dollars
2010 Inflation-adjusted dollars
$0
$2,500
$5,000
Dollars (millions)
$6,531
Revenues decreased 9.8% over five-yearperiod, after adjusting for inflation
$7,500
$10,000
House Research Graphics
House Research Department May 2015 Major State Aids and Taxes Page 67
Sales/Use Tax
Program Description
Sales tax is imposed by the state on the gross receipts of all persons who sell, lease, or rent tangible personal property at retail or provide taxable services. The use tax complements the sales tax and is imposed at the same rate on the storage, use, or consumption in Minnesota of taxable, tangible personal property and taxable services purchased from any retailer, unless the Minnesota sales tax was already paid on these items. Since July 1, 2009, the state sales and use rate has been 6.875 percent.
Major exemptions include: food consumption off premises, clothing, prescribed and nonprescribed drugs and medications, gasoline and special fuels taxed under the motor fuels excise tax, publications issued at intervals of three months or less (except over-the-counter magazines), motor vehicle purchases subject to the 6.5 percent sales tax on motor vehicles, materials used or consumed in agricultural or industrial production, textbooks, residential heating fuels and water services, and industrial capital equipment.
Tax Amount and Reporting
Calendar Year 2011 Sales/Use Tax: $4.9 billion (gross) $4.7 billion (net after refunds) $4.0 billion from residents and in-state sellers
A total of $4,924.7 million in state sales/use taxes was collected during calendar year 2011. The net amount of sales/use tax after the reduction of capital equipment refunds of $190.1 million8 was $4,734.6 million. Of the $4.7 billion in net sales taxes, about $759 million was collected from returns filed by out-of-state vendors, resulting in $4.0 billion allocated to Minnesota.
The amounts shown in the statewide tables are net of the capital equipment refund; the amounts shown by geographic region in the maps are also net of the total remitted by out-of-state sellers.
The sales tax amounts contained in this report exclude any local sales taxes that cities impose. Local sales taxes are used primarily to support specific capital projects. As of December 2011, the cities of Albert Lea, Austin, Baxter, Bemidji, Brainerd, Clearwater, Hermantown, Mankato, Minneapolis, New Ulm, North Mankato, Proctor, Rochester, St. Paul, Two Harbors, Willmar, Worthington, and St. Cloud-area cities imposed a 0.5 percent general sales tax. The city of Duluth and Cook County imposed a 1 percent general sales tax; Hennepin County imposed a 0.15 percent general sales tax; and a Transit Improvement Area consisting of Anoka, Dakota, Hennepin, Ramsey, and Washington counties imposed a 0.25 percent general sales tax.
8 This includes refunds paid on other exempt purchases where the tax is paid at the time of purchase and then refunded, mainly for some specific capital projects.
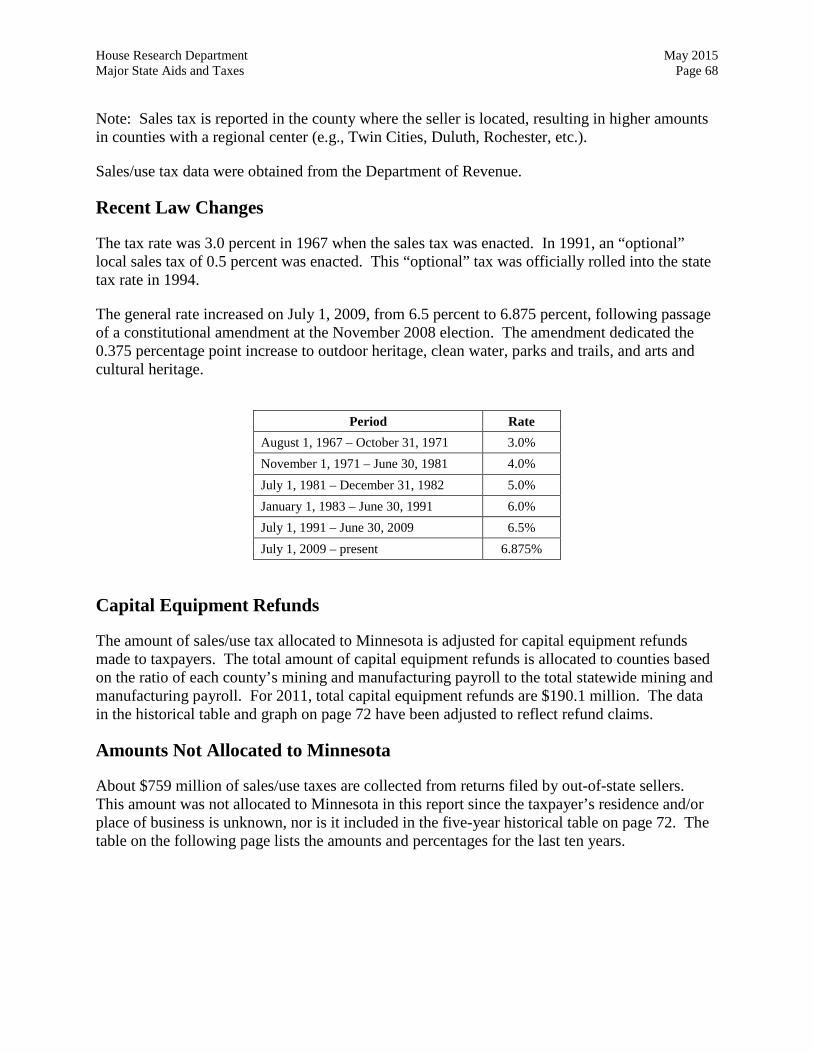
House Research Department May 2015 Major State Aids and Taxes Page 68 Note: Sales tax is reported in the county where the seller is located, resulting in higher amounts in counties with a regional center (e.g., Twin Cities, Duluth, Rochester, etc.).
Sales/use tax data were obtained from the Department of Revenue.
Recent Law Changes
The tax rate was 3.0 percent in 1967 when the sales tax was enacted. In 1991, an “optional” local sales tax of 0.5 percent was enacted. This “optional” tax was officially rolled into the state tax rate in 1994.
The general rate increased on July 1, 2009, from 6.5 percent to 6.875 percent, following passage of a constitutional amendment at the November 2008 election. The amendment dedicated the 0.375 percentage point increase to outdoor heritage, clean water, parks and trails, and arts and cultural heritage.
Period Rate August 1, 1967 – October 31, 1971 3.0% November 1, 1971 – June 30, 1981 4.0% July 1, 1981 – December 31, 1982 5.0% January 1, 1983 – June 30, 1991 6.0% July 1, 1991 – June 30, 2009 6.5% July 1, 2009 – present 6.875%
Capital Equipment Refunds
The amount of sales/use tax allocated to Minnesota is adjusted for capital equipment refunds made to taxpayers. The total amount of capital equipment refunds is allocated to counties based on the ratio of each county’s mining and manufacturing payroll to the total statewide mining and manufacturing payroll. For 2011, total capital equipment refunds are $190.1 million. The data in the historical table and graph on page 72 have been adjusted to reflect refund claims.
Amounts Not Allocated to Minnesota
About $759 million of sales/use taxes are collected from returns filed by out-of-state sellers. This amount was not allocated to Minnesota in this report since the taxpayer’s residence and/or place of business is unknown, nor is it included in the five-year historical table on page 72. The table on the following page lists the amounts and percentages for the last ten years.
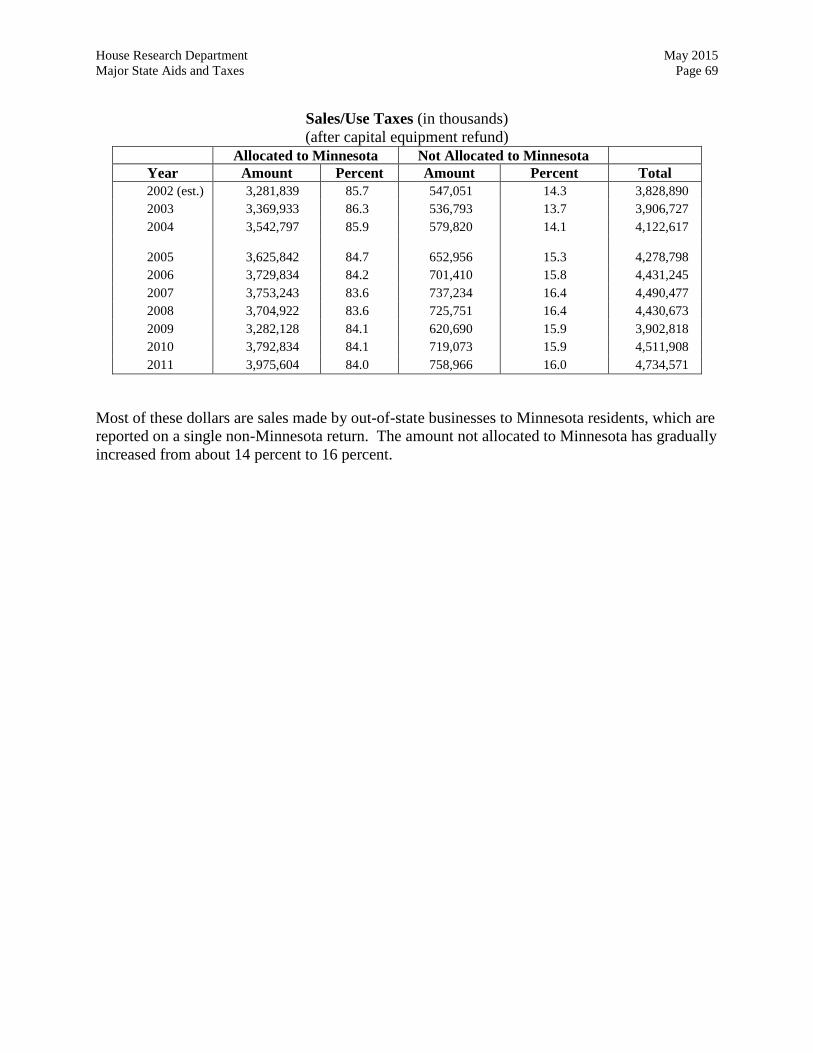
House Research Department May 2015 Major State Aids and Taxes Page 69
Sales/Use Taxes (in thousands) (after capital equipment refund)
Allocated to Minnesota Not Allocated to Minnesota Year Amount Percent Amount Percent Total 2002 (est.) 3,281,839 85.7 547,051 14.3 3,828,890 2003 3,369,933 86.3 536,793 13.7 3,906,727 2004 3,542,797 85.9 579,820 14.1 4,122,617
2005 3,625,842 84.7 652,956 15.3 4,278,798 2006 3,729,834 84.2 701,410 15.8 4,431,245 2007 3,753,243 83.6 737,234 16.4 4,490,477 2008 3,704,922 83.6 725,751 16.4 4,430,673 2009 3,282,128 84.1 620,690 15.9 3,902,818 2010 3,792,834 84.1 719,073 15.9 4,511,908 2011 3,975,604 84.0 758,966 16.0 4,734,571
Most of these dollars are sales made by out-of-state businesses to Minnesota residents, which are reported on a single non-Minnesota return. The amount not allocated to Minnesota has gradually increased from about 14 percent to 16 percent.
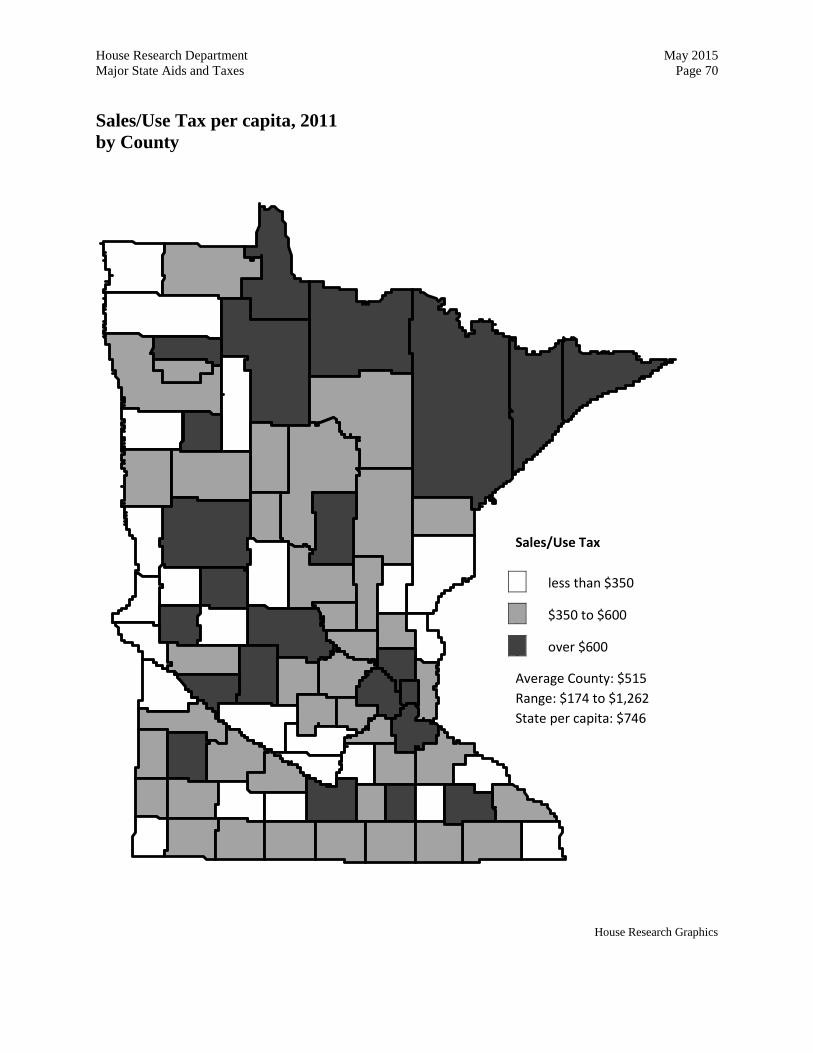
House Research Department May 2015 Major State Aids and Taxes Page 70 Sales/Use Tax per capita, 2011 by County
House Research Graphics
Sales/Use Tax
less than $350
$350 to $600
over $600
Average County: $515 Range: $174 to $1,262 State per capita: $746

House Research Department May 2015 Major State Aids and Taxes Page 71 Sales/Use Tax per capita, 2011 by Economic Development Region
House Research Graphics
Sales/Use Tax
less than $350
$350 to $600
over $600
Average EDR: $582 Range: $362 to $888 State per capita: $746
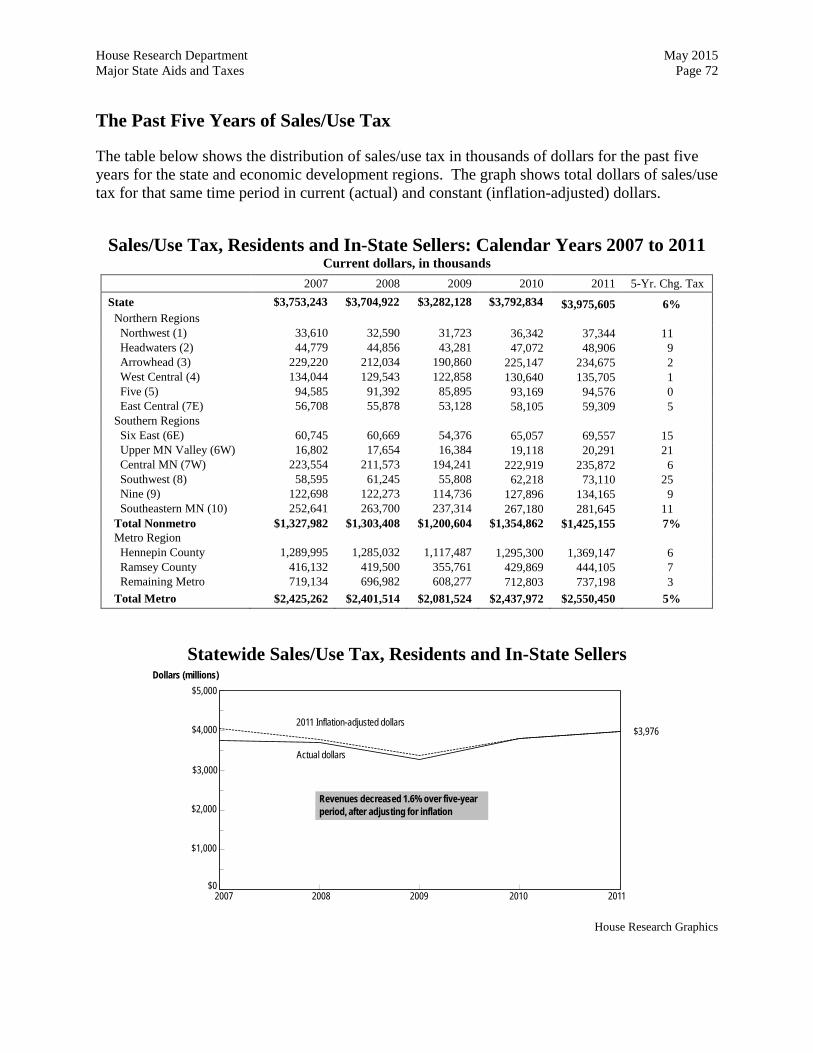
House Research Department May 2015 Major State Aids and Taxes Page 72 The Past Five Years of Sales/Use Tax
The table below shows the distribution of sales/use tax in thousands of dollars for the past five years for the state and economic development regions. The graph shows total dollars of sales/use tax for that same time period in current (actual) and constant (inflation-adjusted) dollars.
Sales/Use Tax, Residents and In-State Sellers: Calendar Years 2007 to 2011 Current dollars, in thousands
2007 2008 2009 2010 2011 5-Yr. Chg. Tax State $3,753,243 $3,704,922 $3,282,128 $3,792,834 $3,975,605 6% Northern Regions Northwest (1) 33,610 32,590 31,723 36,342 37,344 11 Headwaters (2) 44,779 44,856 43,281 47,072 48,906 9 Arrowhead (3) 229,220 212,034 190,860 225,147 234,675 2 West Central (4) 134,044 129,543 122,858 130,640 135,705 1 Five (5) 94,585 91,392 85,895 93,169 94,576 0 East Central (7E) 56,708 55,878 53,128 58,105 59,309 5 Southern Regions Six East (6E) 60,745 60,669 54,376 65,057 69,557 15 Upper MN Valley (6W) 16,802 17,654 16,384 19,118 20,291 21 Central MN (7W) 223,554 211,573 194,241 222,919 235,872 6 Southwest (8) 58,595 61,245 55,808 62,218 73,110 25 Nine (9) 122,698 122,273 114,736 127,896 134,165 9 Southeastern MN (10) 252,641 263,700 237,314 267,180 281,645 11 Total Nonmetro $1,327,982 $1,303,408 $1,200,604 $1,354,862 $1,425,155 7% Metro Region Hennepin County 1,289,995 1,285,032 1,117,487 1,295,300 1,369,147 6 Ramsey County 416,132 419,500 355,761 429,869 444,105 7 Remaining Metro 719,134 696,982 608,277 712,803 737,198 3 Total Metro $2,425,262 $2,401,514 $2,081,524 $2,437,972 $2,550,450 5%
Statewide Sales/Use Tax, Residents and In-State Sellers
2009 20112007 2008 2010
$3,976
Actual dollars
2011 Inflation-adjusted dollars
$0
$2,000
$4,000
Dollars (millions)
$1,000
Revenues decreased 1.6% over five-yearperiod, after adjusting for inflation
$3,000
$5,000
House Research Graphics

House Research Department May 2015 Major State Aids and Taxes Page 74
Motor Vehicle Sales Tax
Program Description
The motor vehicle sales tax is imposed on new and used motor vehicles at the time of sale. It is in lieu of the general state sales tax and is imposed on the sale price of motor vehicles, minus any trade-in allowance. (A flat fee of $10 is imposed upon most motor vehicles that are ten or more years old in lieu of the motor vehicle sales tax.) The rate is 6.5 percent, the rate of the general state sales tax prior to the 2008 passage of the constitutional amendment that increased the general sales tax rate to 6.875 percent, with the increase dedicated to outdoor heritage, clean water, parks and trails, and arts and cultural heritage. The increase did not apply to the motor vehicle sales tax.
The table below lists the allocation of the motor vehicle sales tax revenues from fiscal year 2004 through fiscal year 2012 and following years.
Allocation of Motor Vehicle Sales Tax Revenues FY
2004-2007 FY
2008 FY
2009 FY
2010 FY
2011 FY
2012+ Highway user tax distribution fund 30.00% 38.25% 44.25% 47.50% 54.50% 60.00% County state-aid highway fund 0.65 Municipal state-aid highway fund 0.17 Metropolitan transit 21.50 24.00 27.75 31.50 35.25 36.00 Greater Minnesota transit 1.43 1.50 1.75 4.75 4.00 4.00 General fund 46.25 36.25 26.25 16.25 6.25 0.00 Note: Allocations for transit in fiscal years 2010-11 are capped at fixed dollar amounts, with any excess under the percentage allocations going to the highway user tax distribution fund.
Tax Amount and Reporting
Calendar Year 2011 Motor Vehicle Sales Tax: $538.5 million
The total 2011 motor vehicle sales tax is $538.5 million. The Department of Public Safety collects the motor vehicle sales tax. Due to the method of collection, the amount of actual tax liability from each county is not available. However, since the motor vehicle sales tax is an important revenue source for the state, an estimate was made on how much the taxpayers in each county paid.
Two factors are used in determining an estimated tax amount for each county. First, the number of passenger vehicles and pickup trucks registered in each county in 2011 was obtained from the Department of Public Safety. Registrations within each county are a good indicator of where the owners of the vehicles live. No weighting was attempted based upon the differences in the market value of the vehicles among counties.
Second, the distribution of motor vehicle registration tax by county as provided by the
House Research Department May 2015 Major State Aids and Taxes Page 75 Department of Public Safety was used as a proxy for the value of vehicles purchased.
A percent distribution was made on each of the two factors (i.e., registrations and registration tax), comparing each county to the state. The results of each distribution were then weighted equally to allocate the $538.5 million tax revenue to the 87 counties.
Motor vehicle sales tax data was obtained from the Department of Revenue.
Recent Law Changes
2005 Laws: The 2005 omnibus transportation bill proposed a constitutional amendment providing for the phase-in of the full dedication of the motor vehicle sales tax to transportation purposes.9
At the 2006 general election, the voters approved the constitutional amendment dedicating all motor vehicle sales tax revenue to transportation purposes. The amendment specified that 63.75 percent must be dedicated to transportation purposes in fiscal year 2008, growing by 10 percentage points per year until it reaches 100 percent in fiscal year 2012.
The constitutional language also requires that “no more than 60 percent” of the revenue go to the Highway User Tax Distribution (HUTD) fund and “not less than 40 percent” go to public transit assistance (Minn. Const. art. XIV, sec. 13). These distribution limits, which establish a ceiling for allocation to highways and a floor for the allocation to transit, are referred to as the “60/40 split.” Within the distribution limits, the Constitution allows legislation to set the actual division between highways and transit.
2007 Laws: 2007 legislation established a motor vehicle sales tax phase-in schedule, shown in the table on the preceding page. In fiscal year 2012, after the phase-in is fully completed, the revenues will be distributed 60 percent to highways and 40 percent to transit, with the transit portion divided 36 percent for the metropolitan area and 4 percent for greater Minnesota.
2009 Laws: As part of the 2010-2011 budget, the motor vehicle sales tax phase-in schedule was adjusted to provide additional funds to both metropolitan and greater Minnesota transit.
9 The 2005 transportation bill (Laws 2005, ch. 88) was vetoed by Gov. Pawlenty, but since constitutional amendments are not subject to veto, the amendment was put before the voters in November 2006.
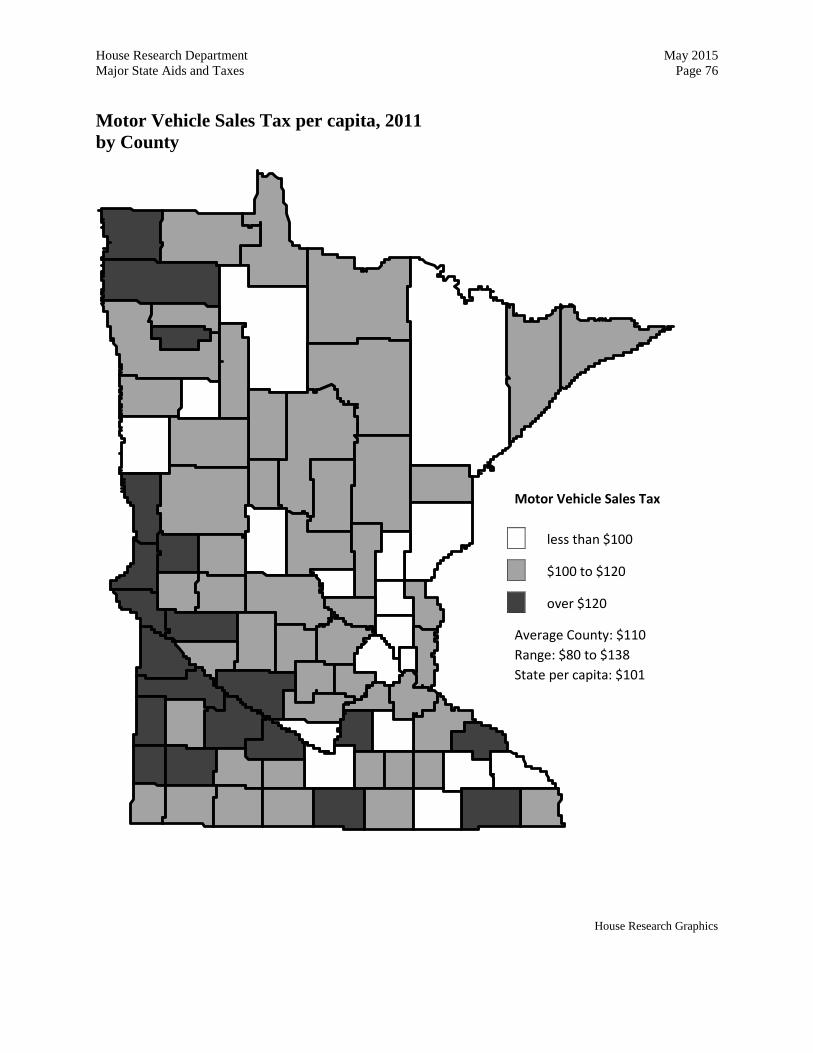
House Research Department May 2015 Major State Aids and Taxes Page 76 Motor Vehicle Sales Tax per capita, 2011 by County
House Research Graphics
Motor Vehicle Sales Tax
less than $100
$100 to $120
over $120
Average County: $110 Range: $80 to $138 State per capita: $101
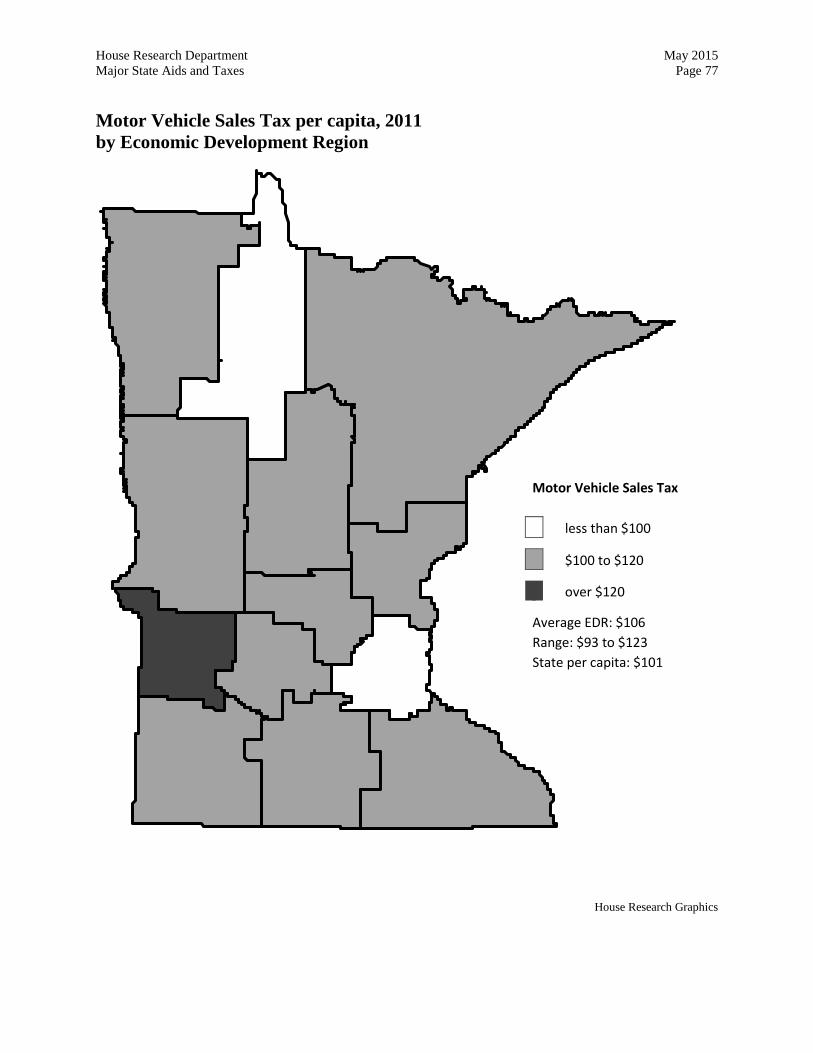
House Research Department May 2015 Major State Aids and Taxes Page 77 Motor Vehicle Sales Tax per capita, 2011 by Economic Development Region
House Research Graphics
Motor Vehicle Sales Tax
less than $100
$100 to $120
over $120
Average EDR: $106 Range: $93 to $123 State per capita: $101
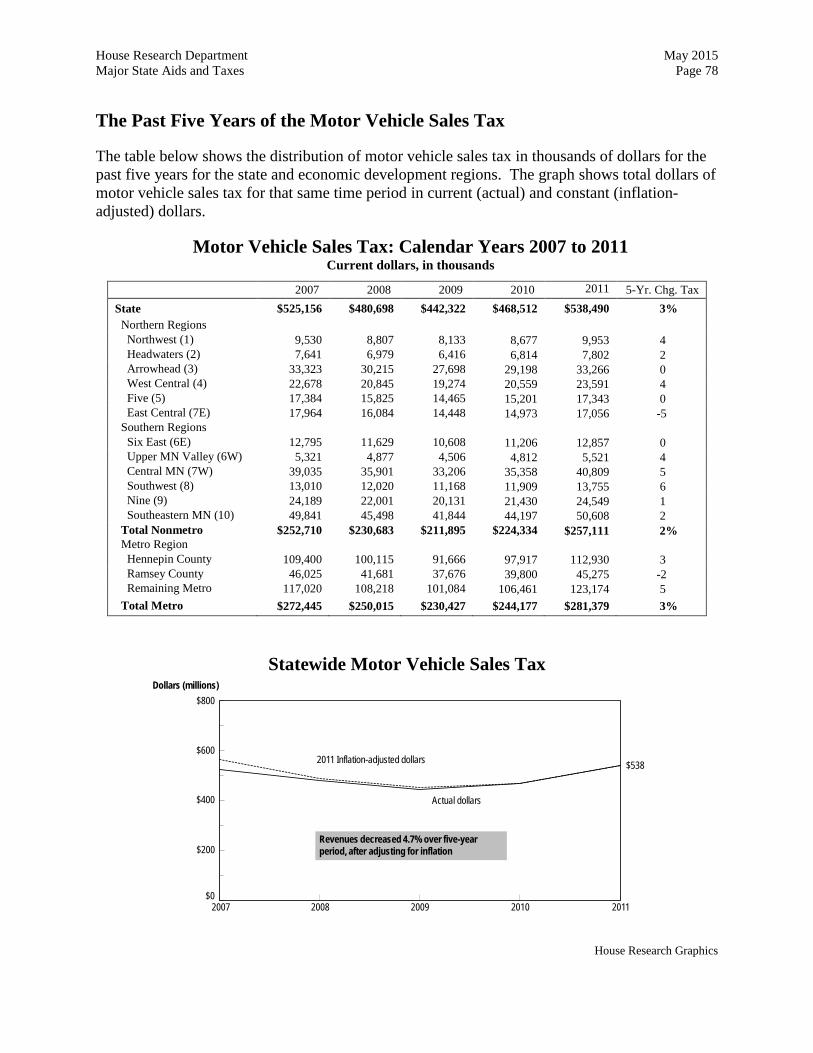
House Research Department May 2015 Major State Aids and Taxes Page 78 The Past Five Years of the Motor Vehicle Sales Tax
The table below shows the distribution of motor vehicle sales tax in thousands of dollars for the past five years for the state and economic development regions. The graph shows total dollars of motor vehicle sales tax for that same time period in current (actual) and constant (inflation-adjusted) dollars.
2007 2008 2009 2010 2011 5-Yr. Chg. Tax
State $525,156 $480,698 $442,322 $468,512 $538,490 3% Northern Regions Northwest (1) 9,530 8,807 8,133 8,677 9,953 4 Headwaters (2) 7,641 6,979 6,416 6,814 7,802 2 Arrowhead (3) 33,323 30,215 27,698 29,198 33,266 0 West Central (4) 22,678 20,845 19,274 20,559 23,591 4 Five (5) 17,384 15,825 14,465 15,201 17,343 0 East Central (7E) 17,964 16,084 14,448 14,973 17,056 -5 Southern Regions Six East (6E) 12,795 11,629 10,608 11,206 12,857 0 Upper MN Valley (6W) 5,321 4,877 4,506 4,812 5,521 4 Central MN (7W) 39,035 35,901 33,206 35,358 40,809 5 Southwest (8) 13,010 12,020 11,168 11,909 13,755 6 Nine (9) 24,189 22,001 20,131 21,430 24,549 1 Southeastern MN (10) 49,841 45,498 41,844 44,197 50,608 2 Total Nonmetro $252,710 $230,683 $211,895 $224,334 $257,111 2% Metro Region Hennepin County 109,400 100,115 91,666 97,917 112,930 3 Ramsey County 46,025 41,681 37,676 39,800 45,275 -2 Remaining Metro 117,020 108,218 101,084 106,461 123,174 5 Total Metro $272,445 $250,015 $230,427 $244,177 $281,379 3%
Statewide Motor Vehicle Sales Tax
2009 20112007 2008 2010
$538
Actual dollars
2011 Inflation-adjusted dollars
$0
$400
Dollars (millions)
$200Revenues decreased 4.7% over five-yearperiod, after adjusting for inflation
$800
$600
House Research Graphics
Motor Vehicle Sales Tax: Calendar Years 2007 to 2011 Current dollars, in thousands
House Research Department May 2015 Major State Aids and Taxes Page 79
Motor Vehicle Registration Tax
Program Description
The motor vehicle registration tax is imposed annually on each motor vehicle registered in Minnesota to use the public streets and highways. The tax on passenger cars, pickup trucks, and vans is equal to a $10 flat tax, plus an additional tax of 1.25 percent of a base value that is adjusted using a decreasing percentage of the vehicle’s original value as the vehicle gets older (decreasing to a $25 flat tax for older vehicles).
The tax on trucks, tractors, and buses is based upon the type, weight, and age of the vehicle. A minimum tax applies to each type of vehicle. There is also a flat tax on motorcycles and mopeds. The tax is paid when the vehicle is first registered in Minnesota to use the public streets and annually thereafter when it is re-registered.
Tax Amount and Reporting
Calendar Year 2011 Motor Vehicle Registration Tax: $574.4 million
The total motor vehicle registration tax for calendar year 2011 was $574.4 million. The tax is collected by the Department of Public Safety. The amount of actual tax liability from each county is not available. The statewide total was allocated to counties based on Department of Public Safety estimates of the amount actually remitted from each county.
Revenue from this tax is deposited in the Highway User Tax Distribution Fund. The Minnesota Constitution sets the distribution formula for 95 percent of the money in the fund: of the 95 percent, 29 percent to the County State-Aid Highway Fund, 9 percent to the Municipal State-Aid Street Fund for cities with populations over 5,000, and 62 percent to the state Trunk Highway Fund. Allocation of the remaining 5 percent of the fund is determined by the legislature. In 2011 about half of the set-aside was used for town roads and town bridges. The rest went into a “flexible account” that was used for county and city roads, including improvements to former state highways that reverted to local jurisdiction.
The statewide motor vehicle registration tax amount came from the Department of Revenue.
Recent Law Changes
The 2008 Legislature restructured the registration tax for passenger vehicles by:
• eliminating the maximum of $189 in the first renewal and $99 in subsequent renewals; • amending the vehicle depreciation schedule for a vehicle’s valuation; and • restricting the tax changes so that the amount owed for vehicles previously registered in
Minnesota does not increase from the amount paid in previous years.
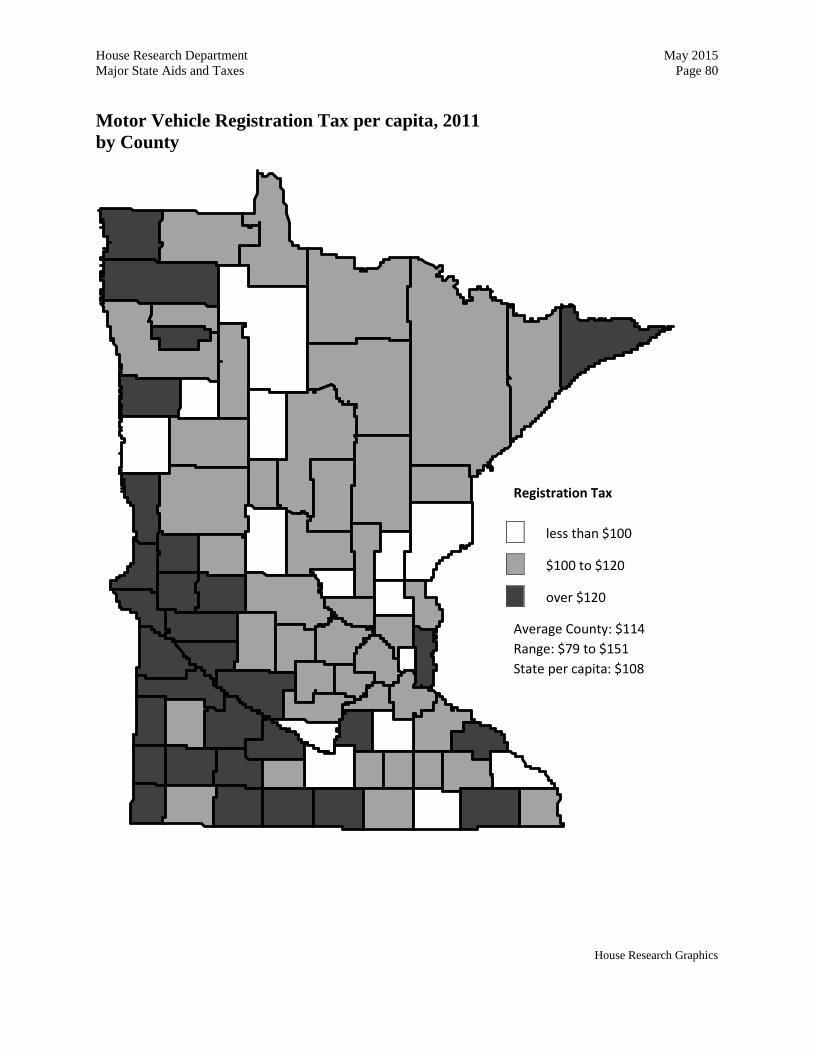
House Research Department May 2015 Major State Aids and Taxes Page 80 Motor Vehicle Registration Tax per capita, 2011 by County
House Research Graphics
Registration Tax
less than $100
$100 to $120
over $120
Average County: $114 Range: $79 to $151 State per capita: $108
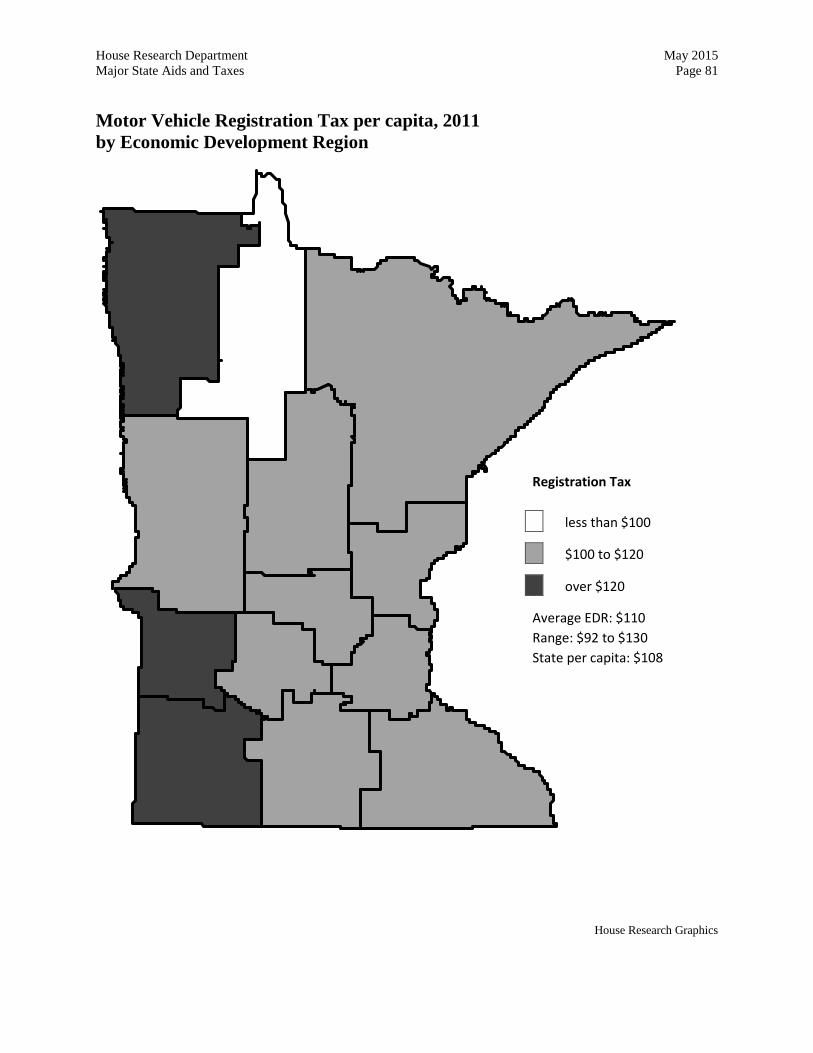
House Research Department May 2015 Major State Aids and Taxes Page 81 Motor Vehicle Registration Tax per capita, 2011 by Economic Development Region
House Research Graphics
Registration Tax
less than $100
$100 to $120
over $120
Average EDR: $110 Range: $92 to $130 State per capita: $108

House Research Department May 2015 Major State Aids and Taxes Page 82 The Past Five Years of the Motor Vehicle Registration Tax
The table below shows the distribution of the motor vehicle registration tax in thousands of dollars for the past five years for the state and economic development regions. The graph shows total dollars of the motor vehicle registration tax for that same time period in current (actual) and constant (inflation-adjusted) dollars.
Motor Vehicle Registration Tax: Calendar Years 2007 to 2011 Current dollars, in thousands
2007 2008 2009 2010 2011 5-Yr. Chg. Tax State $489,540 $485,511 $512,352 $539,733 $574,395 17% Northern Regions Northwest (1) 8,368 8,482 9,055 9,697 10,314 23 Headwaters (2) 6,692 6,591 6,927 7,327 7,741 16 Arrowhead (3) 30,138 29,474 30,922 32,403 34,028 13 West Central (4) 20,126 20,117 21,457 22,872 24,290 21 Five (5) 15,329 15,040 15,676 16,252 17,046 11 East Central (7E) 15,967 15,296 15,509 15,782 16,548 4 Southern Regions Six East (6E) 11,388 11,198 11,730 12,387 13,190 16 Upper MN Valley (6W) 4,705 4,728 5,066 5,452 5,836 24 Central MN (7W) 35,999 35,704 37,819 39,952 42,682 19 Southwest (8) 11,474 11,617 12,533 13,424 14,471 26 Nine (9) 21,663 21,349 22,413 23,939 25,520 18 Southeastern MN (10) 45,236 44,716 47,215 49,561 52,526 16 Total Nonmetro $227,084 $224,312 $236,322 $249,047 $264,192 16% Metro Region Hennepin County 105,774 105,157 110,188 117,535 125,915 19 Ramsey County 43,393 42,458 43,502 45,557 47,602 10 Remaining Metro 113,290 113,584 122,340 127,593 136,686 21 Total Metro $262,456 $261,199 $276,030 $290,686 $310,203 18%
Statewide Motor Vehicle Registration Tax
2009 20112007 2008 2010
$574
Actual dollars
2011 Inflation-adjusted dollars
$0
$300
$400
Dollars (millions)
$100
$200
$600
Revenues increased 5.1% over five-yearperiod, after adjusting for inflation
$500
$700
House Research Graphics

House Research Department May 2015 Major State Aids and Taxes Page 84
Motor Fuels Tax (Gas Tax)
Program Description
The motor fuels tax is imposed on gasoline, diesel fuel, and other motor fuels used by vehicles on public highways. Aviation fuel purchased, stored, or withdrawn from storage in Minnesota is also subject to the tax. Starting July 1, 2012, the rate on highway motor fuels10 increased to 28.5 cents per gallon. The highway motor fuels rate was 20 cents per gallon from 1988 to April 1, 2008, with a rate increase phased in from April 1, 2008, to July 1, 2012.
Tax Amount and Reporting
Calendar Year 2011 Motor Fuels Tax: $846.7 million
The total net amount after refunds of the motor fuels tax for calendar year 2011 was $846.7 million. This is the gross amount before distributions (based on motor fuel use attributed to nonhighway use) to snowmobile, motorboat, forest roads, and all-terrain vehicles (ATV) accounts.11
The motor fuels tax goes into the Highway User Tax Distribution Fund and is dedicated for highway use. (See page 79 for description of the allocation of the Highway User Tax Distribution Fund.)
The highway aids listed in the tables estimate how much each area received from the above distribution. Like both the motor vehicle excise tax and the motor vehicle registration tax, the amount of motor fuels tax paid by taxpayers in each county is unknown. For purposes of this report, an estimate was made for each county based on the total number of vehicle miles traveled in each county in 2011 as a proportion of the total vehicle miles traveled within the state in 2011.
The statewide motor fuels tax amount was obtained from the Department of Revenue.
Recent Law Changes
The 2008 transportation finance act provided for a phased-in increase in the motor fuels tax. The tax increased by 2 cents to 22 cents per gallon on April 1, 2008, and the rate phased in to 28.5 cents per gallon on July 1, 2012, as shown in the following table. In 2009 only, low-income individuals were eligible to claim a refundable income tax credit of $25 to offset the motor fuels tax increase. The credit was repealed in 2010.
The following table contains the phase-in schedule of motor fuel tax rates. The $846.7 million in
10 Alternative fuels, such as liquefied natural gas and high-alcohol gasoline, are taxed at rates proportional to relative energy content.
11 Previous years’ reports indicated that the total was the net after distributions, but the reporting changed several years ago so the amount shown was actually the gross.

House Research Department May 2015 Major State Aids and Taxes Page 85 motor fuels tax for 2011 includes tax collected on all fuels shown in the table.
Motor Fuel Tax Phase-in Rates (cents)
Type of Fuel Through 3/31/08
4/1/08 – 7/31/08
8/1/08 – 9/30/08
10/1/08 – 6/30/09
7/1/09 – 6/30/10
7/1/10 – 6/30/11
7/1/11 – 6/30/12
7/1/12 & After
Gasoline 20.0 22.00 22.50 25.50 27.10 27.50 28.00 28.50 E85 14.2 15.62 15.98 18.11 19.24 19.53 19.88 20.24 M85 11.4 12.54 12.83 14.54 15.45 15.68 15.96 16.25 Diesel 20.0 22.00 22.50 25.50 27.10 27.50 28.00 28.50 Liquefied petroleum gas (LPG) 15.0 16.50 16.88 19.13 20.33 20.63 21.00 21.38 Liquefied natural gas (LNG) 12.0 13.20 13.50 15.30 16.26 16.50 16.80 17.10 Compressed natural gas (CNG) 1.739 1.1913* 1.235* 2.217 2.356 2.391 2.435 2.478 Other special fuel 20.0 22.00 22.50 25.50 27.10 27.50 28.00 28.50 * Rate change is not proportional due to a drafting error. Amounts include tax-rate increases and debt service surcharge; amounts for CNG are per 1,000 cubic feet

House Research Department May 2015 Major State Aids and Taxes Page 86 Motor Fuels Tax per capita, 2011 by County
House Research Graphics
Fuels Tax
less than $170
$170 to $210
over $210
Average County: $195 Range: $131 to $377 State per capita: $159
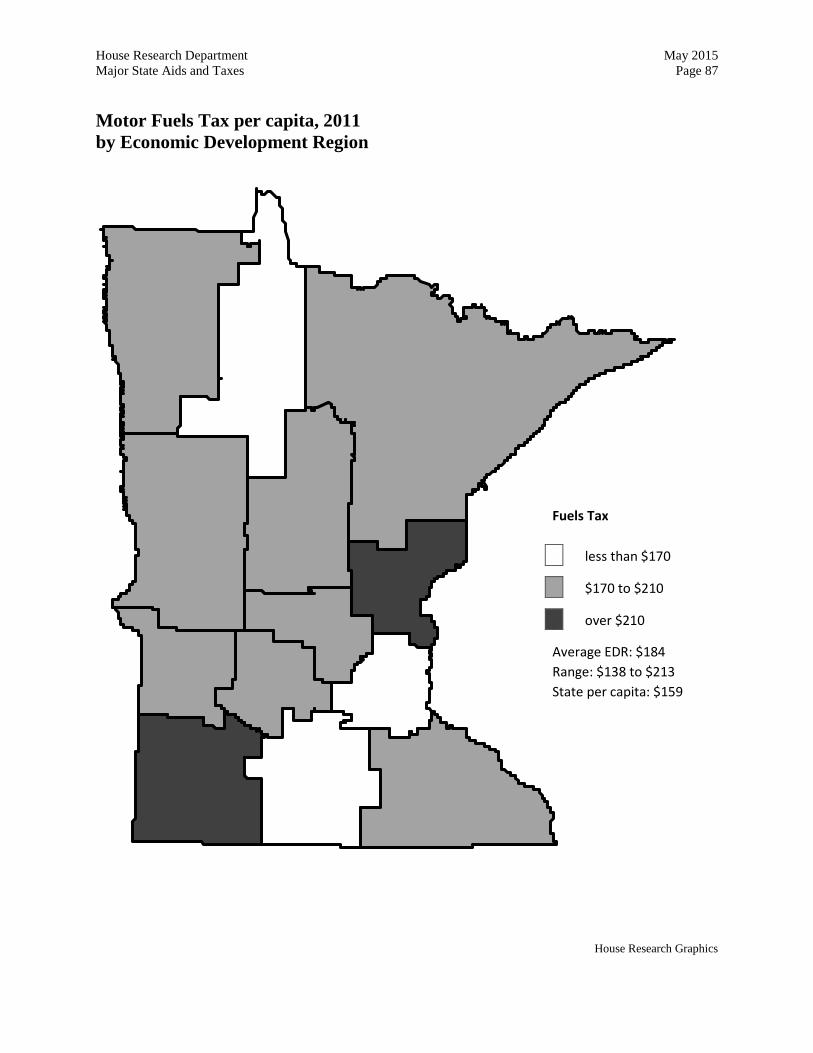
House Research Department May 2015 Major State Aids and Taxes Page 87 Motor Fuels Tax per capita, 2011 by Economic Development Region
House Research Graphics
Fuels Tax
less than $170
$170 to $210
over $210
Average EDR: $184 Range: $138 to $213 State per capita: $159
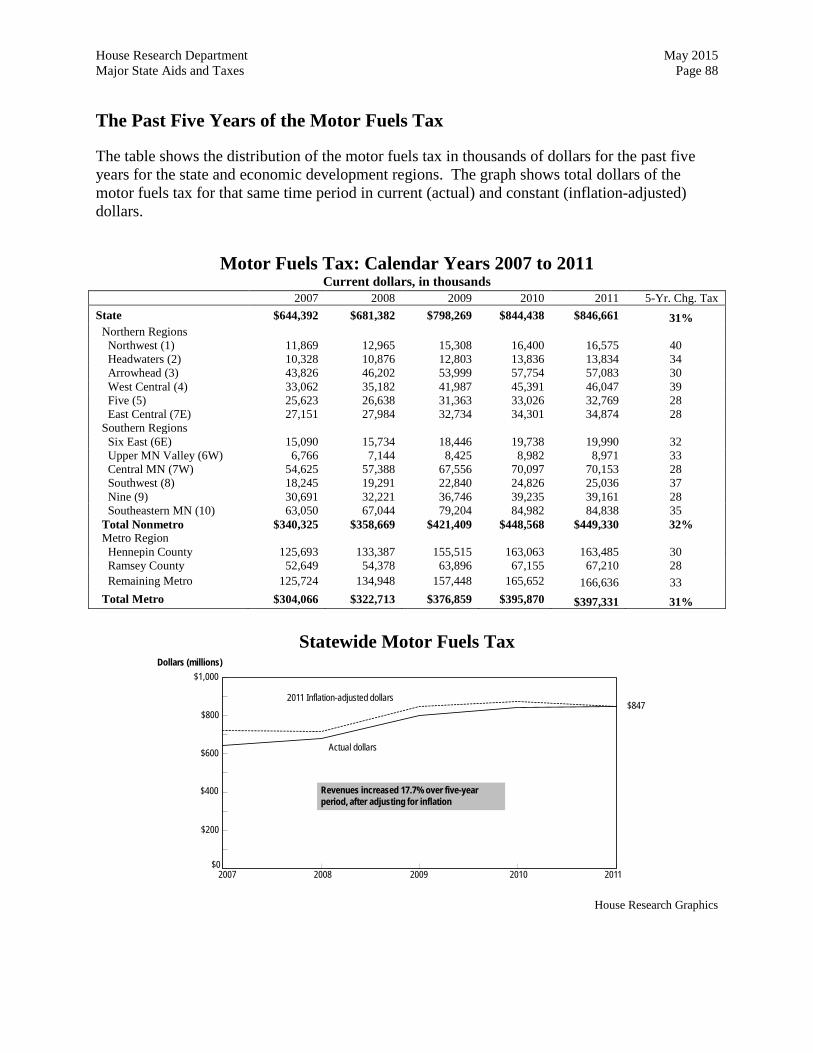
House Research Department May 2015 Major State Aids and Taxes Page 88 The Past Five Years of the Motor Fuels Tax
The table shows the distribution of the motor fuels tax in thousands of dollars for the past five years for the state and economic development regions. The graph shows total dollars of the motor fuels tax for that same time period in current (actual) and constant (inflation-adjusted) dollars.
Motor Fuels Tax: Calendar Years 2007 to 2011 Current dollars, in thousands
Statewide Motor Fuels Tax
2009 20112007 2008 2010
$847
Actual dollars
2011 Inflation-adjusted dollars
$0
$400
Dollars (millions)
$200
$600
Revenues increased 17.7% over five-yearperiod, after adjusting for inflation
$800
$1,000
House Research Graphics
2007 2008 2009 2010 2011 5-Yr. Chg. Tax State $644,392 $681,382 $798,269 $844,438 $846,661 31% Northern Regions Northwest (1) 11,869 12,965 15,308 16,400 16,575 40 Headwaters (2) 10,328 10,876 12,803 13,836 13,834 34 Arrowhead (3) 43,826 46,202 53,999 57,754 57,083 30 West Central (4) 33,062 35,182 41,987 45,391 46,047 39 Five (5) 25,623 26,638 31,363 33,026 32,769 28 East Central (7E) 27,151 27,984 32,734 34,301 34,874 28 Southern Regions Six East (6E) 15,090 15,734 18,446 19,738 19,990 32 Upper MN Valley (6W) 6,766 7,144 8,425 8,982 8,971 33 Central MN (7W) 54,625 57,388 67,556 70,097 70,153 28 Southwest (8) 18,245 19,291 22,840 24,826 25,036 37 Nine (9) 30,691 32,221 36,746 39,235 39,161 28 Southeastern MN (10) 63,050 67,044 79,204 84,982 84,838 35 Total Nonmetro $340,325 $358,669 $421,409 $448,568 $449,330 32% Metro Region Hennepin County 125,693 133,387 155,515 163,063 163,485 30 Ramsey County 52,649 54,378 63,896 67,155 67,210 28 Remaining Metro 125,724 134,948 157,448 165,652 166,636 33 Total Metro $304,066 $322,713 $376,859 $395,870 $397,331 31%


House Research Department May 2015 Major State Aids and Taxes Page 90
Corporate Franchise (Income) Tax
Program Description
Corporate franchise (income) tax is imposed on the net income of corporations. The rate of the tax is 9.8 percent. The tax base is federal taxable income with a variety of Minnesota adjustments. Corporations that do business both inside and outside of Minnesota apportion their income using a three-factor formula based on the share of the corporation’s total property, payroll, and sales that are in Minnesota. Prior to 2007, the formula weighted sales 75 percent and property and payroll 12.5 percent each. Beginning in 2007, the formula gradually phases in 100 percent sales apportionment, reaching that percentage in 2014.
An alternative minimum tax (AMT) applies to federal alternative minimum taxable income, if it would result in a higher tax than the regular corporate franchise tax. This tax rate is 5.8 percent. A minimum fee is imposed on corporations (including S corporations) and partnerships in addition to the regular tax or the AMT. The minimum fee ranges from $100 to $5,000, depending upon the corporation’s sales, property, and payroll in Minnesota.12
Tax Amount and Reporting
2011 Corporate Income Tax: $782.5 million
The amounts presented in this report were tabulated from all Minnesota corporate income tax returns filed during the calendar year ending December 31, 2011. (Primarily, returns for tax year 2010 were filed in calendar year 2011.) The total statewide amount of $782.5 million includes taxes collected from corporations whose main offices are in other states and foreign countries. It does not include any taxes or minimum fees paid by S corporations or partnerships.
The corporate income tax data was obtained from the Department of Revenue. The location of each corporation’s home office is not available. Instead each county’s total sales, reported in the U.S. Census Bureau’s 2007 Survey of Business Owners,13 is used as an indicator of the source or location of the corporate tax and to allocate the $782.5 million to counties. The 2007 Census data was adjusted for the change in gross sales from year to year in Department of Revenue data on gross sales of businesses reporting sales tax.
Prior years’ reports allocated corporate tax liability based on payroll in each county, as reported in County Business Patterns. With Minnesota moving to 100 percent sales apportionment in 2014, it’s appropriate to allocate the tax on sales rather than payroll.
12 Beginning in tax year 2013, the minimum fee amounts increase to $190 to $9,340 and are indexed for inflation in following years.
13 2007 sales for Lake of the Woods County were unavailable. 2007 sales in Lake of the Woods County were estimated by increasing 2002 sales in Lake of the Woods County by the same percentage that sales increased statewide.
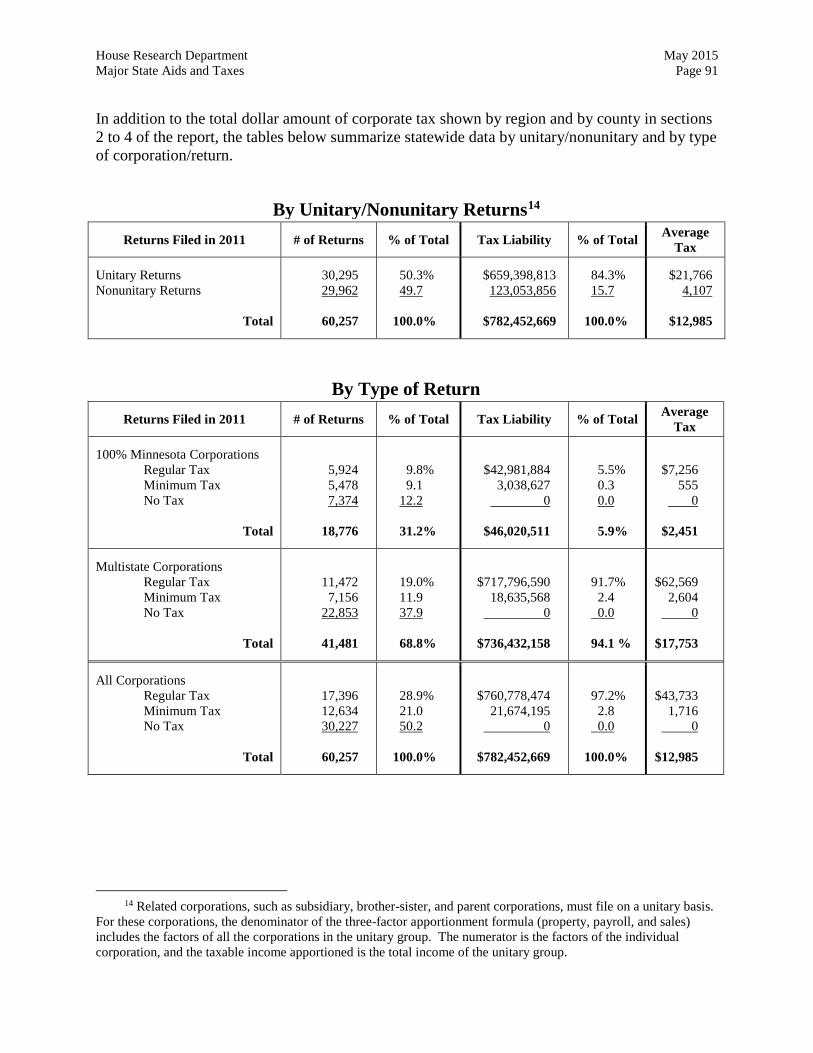
House Research Department May 2015 Major State Aids and Taxes Page 91 In addition to the total dollar amount of corporate tax shown by region and by county in sections 2 to 4 of the report, the tables below summarize statewide data by unitary/nonunitary and by type of corporation/return.
By Unitary/Nonunitary Returns14
Returns Filed in 2011 # of Returns % of Total Tax Liability % of Total Average Tax
Unitary Returns Nonunitary Returns
Total
30,295 29,962
60,257
50.3% 49.7
100.0%
$659,398,813 123,053,856
$782,452,669
84.3% 15.7
100.0%
$21,766 4,107
$12,985
By Type of Return Returns Filed in 2011 # of Returns % of Total Tax Liability % of Total Average
Tax
100% Minnesota Corporations Regular Tax Minimum Tax No Tax
Total
5,924 5,478 7,374
18,776
9.8% 9.1
12.2
31.2%
$42,981,884
3,038,627 0
$46,020,511
5.5% 0.3 0.0
5.9%
$7,256
555 0
$2,451
Multistate Corporations Regular Tax Minimum Tax No Tax
Total
11,472 7,156
22,853
41,481
19.0% 11.9 37.9
68.8%
$717,796,590
18,635,568 0
$736,432,158
91.7%
2.4 0.0
94.1 %
$62,569
2,604 0
$17,753
All Corporations Regular Tax Minimum Tax No Tax
Total
17,396 12,634 30,227
60,257
28.9% 21.0 50.2
100.0%
$760,778,474
21,674,195 0
$782,452,669
97.2%
2.8 0.0
100.0%
$43,733
1,716 0
$12,985
14 Related corporations, such as subsidiary, brother-sister, and parent corporations, must file on a unitary basis. For these corporations, the denominator of the three-factor apportionment formula (property, payroll, and sales) includes the factors of all the corporations in the unitary group. The numerator is the factors of the individual corporation, and the taxable income apportioned is the total income of the unitary group.

House Research Department May 2015 Major State Aids and Taxes Page 92 Corporate Tax per capita, 2011 by County
House Research Graphics
Corporate Tax
less than $80
$80 to $130
over $130
Average County: $105 Range: $17 to $393 State per capita: $147
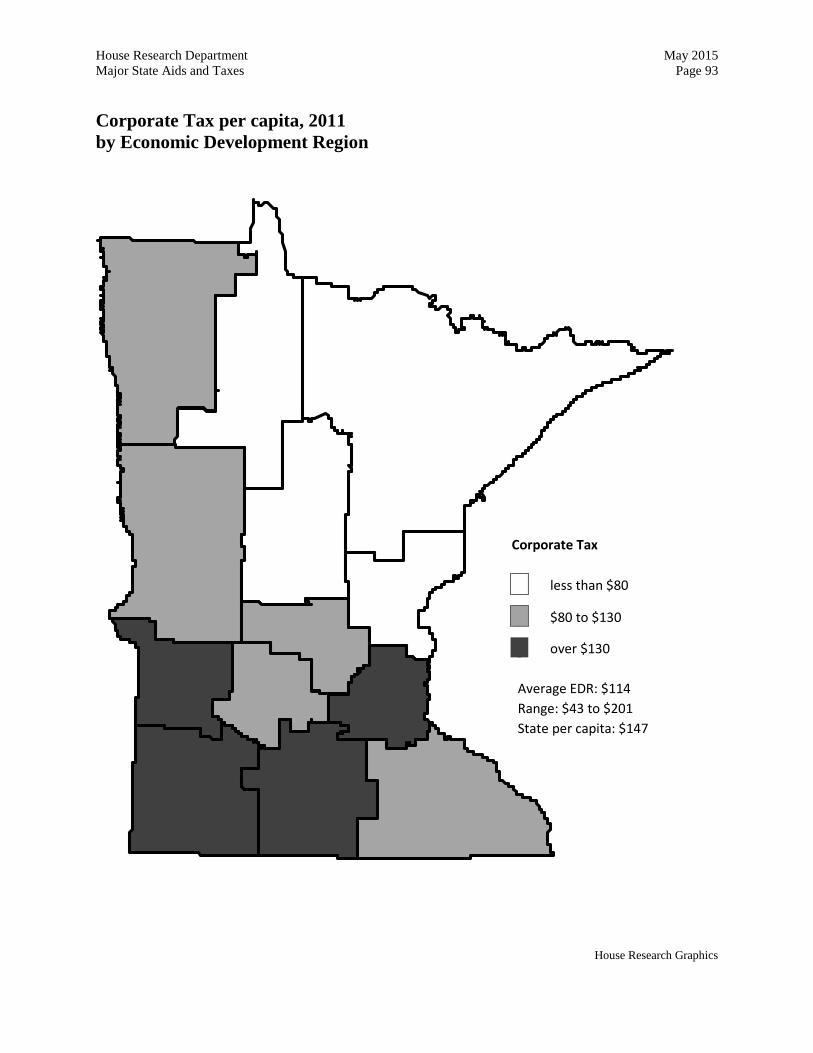
House Research Department May 2015 Major State Aids and Taxes Page 93 Corporate Tax per capita, 2011 by Economic Development Region
House Research Graphics
Corporate Tax
less than $80
$80 to $130
over $130
Average EDR: $114 Range: $43 to $201 State per capita: $147
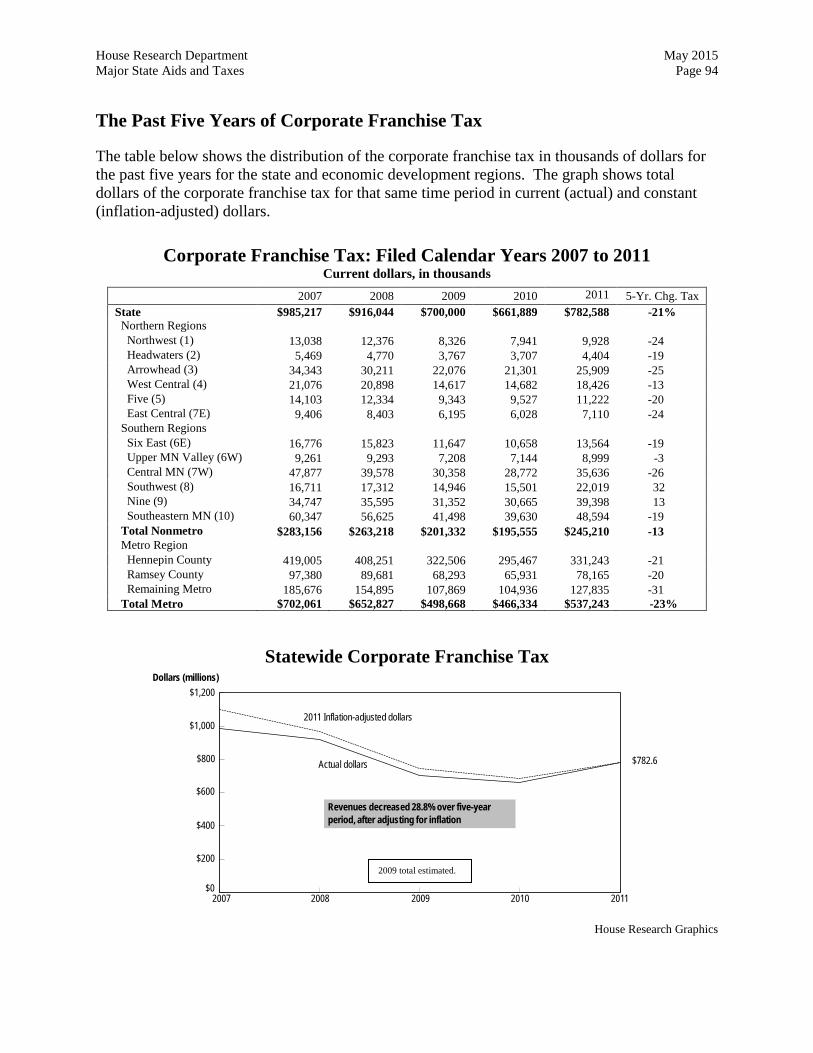
House Research Department May 2015 Major State Aids and Taxes Page 94 The Past Five Years of Corporate Franchise Tax
The table below shows the distribution of the corporate franchise tax in thousands of dollars for the past five years for the state and economic development regions. The graph shows total dollars of the corporate franchise tax for that same time period in current (actual) and constant (inflation-adjusted) dollars.
Corporate Franchise Tax: Filed Calendar Years 2007 to 2011 Current dollars, in thousands
2007 2008 2009 2010 2011 5-Yr. Chg. Tax State $985,217 $916,044 $700,000 $661,889 $782,588 -21% Northern Regions Northwest (1) 13,038 12,376 8,326 7,941 9,928 -24 Headwaters (2) 5,469 4,770 3,767 3,707 4,404 -19 Arrowhead (3) 34,343 30,211 22,076 21,301 25,909 -25 West Central (4) 21,076 20,898 14,617 14,682 18,426 -13 Five (5) 14,103 12,334 9,343 9,527 11,222 -20 East Central (7E) 9,406 8,403 6,195 6,028 7,110 -24 Southern Regions Six East (6E) 16,776 15,823 11,647 10,658 13,564 -19 Upper MN Valley (6W) 9,261 9,293 7,208 7,144 8,999 -3 Central MN (7W) 47,877 39,578 30,358 28,772 35,636 -26 Southwest (8) 16,711 17,312 14,946 15,501 22,019 32 Nine (9) 34,747 35,595 31,352 30,665 39,398 13 Southeastern MN (10) 60,347 56,625 41,498 39,630 48,594 -19 Total Nonmetro $283,156 $263,218 $201,332 $195,555 $245,210 -13 Metro Region Hennepin County 419,005 408,251 322,506 295,467 331,243 -21 Ramsey County 97,380 89,681 68,293 65,931 78,165 -20 Remaining Metro 185,676 154,895 107,869 104,936 127,835 -31 Total Metro $702,061 $652,827 $498,668 $466,334 $537,243 -23%
Statewide Corporate Franchise Tax
2009 20112007 2008 2010
$782.6Actual dollars
2011 Inflation-adjusted dollars
$0
$200
$400
$600
$1,000
Dollars (millions)
Revenues decreased 28.8% over five-yearperiod, after adjusting for inflation
$800
$1,200
House Research Graphics
2009 total estimated.
House Research Department May 2015 Major State Aids and Taxes Page 95
State General Property Tax
Program Description
A state general property tax was instituted as part of the overall property tax reform adopted during the 2001 legislative session. Ninety-five percent of the state general tax is levied on commercial/industrial property (including public utility), and the remaining 5 percent is levied on seasonal recreational property. That portion of public utility property consisting of attached machinery used in the generation of electrical energy is exempt from the state general property tax, as well as the property at the Minneapolis-St. Paul International Airport and the St. Paul intermediate airport.
For its first year in taxes payable 2002, the state general levy amount was $592 million. Each subsequent year’s amount is increased from the previous year’s amount by the increase in the implicit price deflator for government consumption expenditures and gross investments published by the U.S. Bureau of Economic Analysis (an index of inflation).
Tax Amount and Reporting
Payable Year 2011 State General Property Tax: $796.6 million
The total state general property tax for taxes payable in 2011 was $796.6 million.
For taxes payable in 2011, the state tax rate was 49.043 percent for commercial-industrial/public utility property and 19.145 percent for seasonal recreational property, which yielded revenues of $756.8 million and $39.8 million respectively.15
The tax rates are computed by the Department of Revenue.
15 The actual levy was $796.6 million due to changes made in the tax base after the rate was established. In addition to the amount formally levied, an additional amount of approximately $2.2 million is collected from properties that are not included in the abstract of assessment (i.e., the majority of the tax is on certain transmission and distribution line property). This amount is not included in this report because its distribution is unknown.

House Research Department May 2015 Major State Aids and Taxes Page 96 State General Property Tax per capita, 2011 by County
House Research Graphics
State Property Tax
less than $75
$75 to $125
over $125
Average County: $111 Range: $30 to $402 State Per Capita: $149
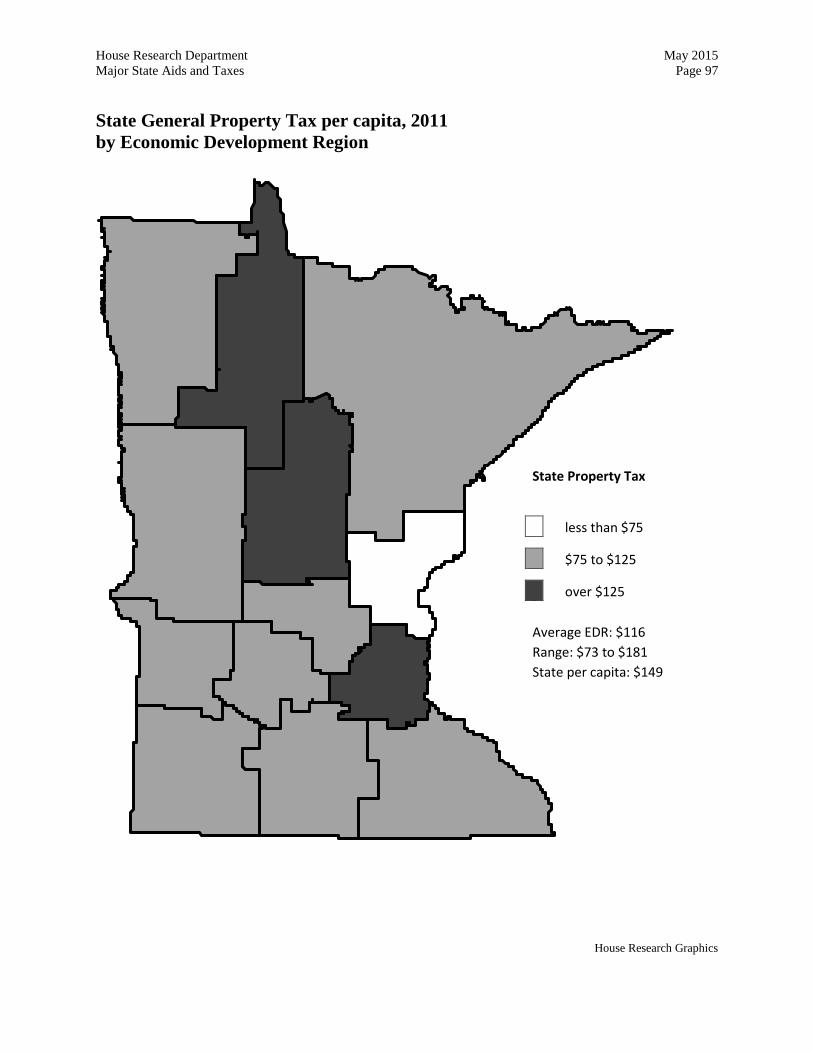
House Research Department May 2015 Major State Aids and Taxes Page 97 State General Property Tax per capita, 2011 by Economic Development Region
House Research Graphics
State Property Tax
less than $75
$75 to $125
over $125
Average EDR: $116 Range: $73 to $181 State per capita: $149
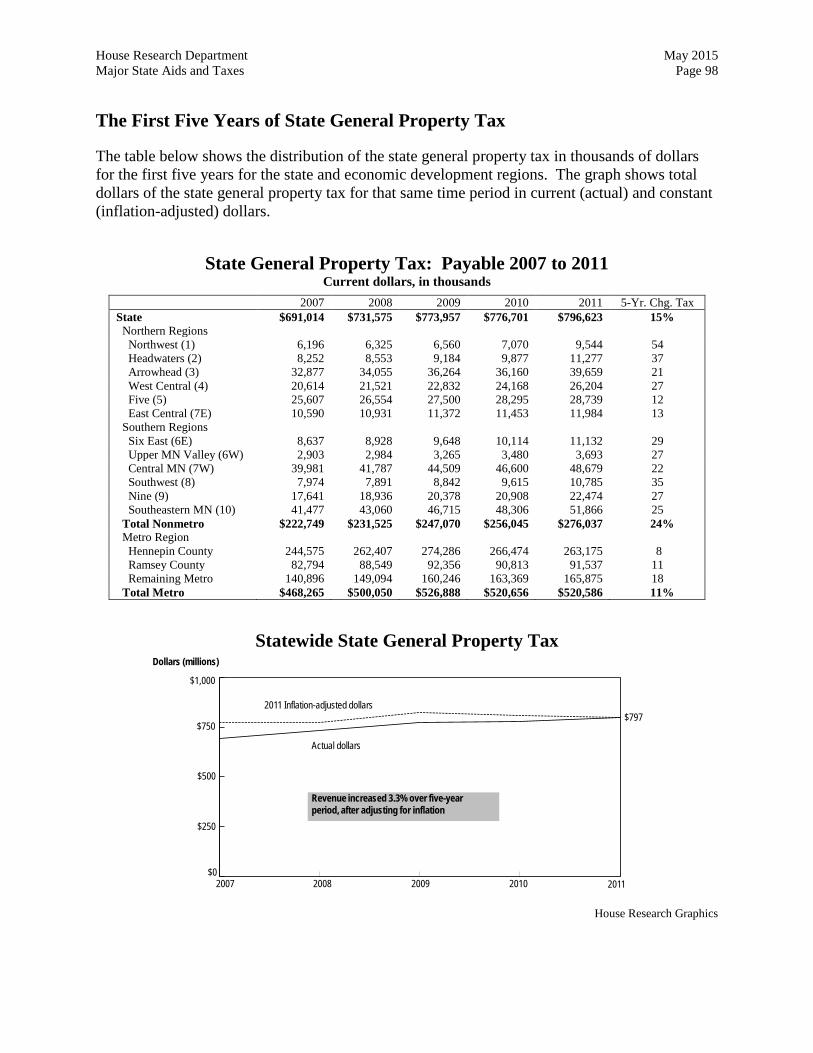
House Research Department May 2015 Major State Aids and Taxes Page 98 The First Five Years of State General Property Tax
The table below shows the distribution of the state general property tax in thousands of dollars for the first five years for the state and economic development regions. The graph shows total dollars of the state general property tax for that same time period in current (actual) and constant (inflation-adjusted) dollars.
State General Property Tax: Payable 2007 to 2011 Current dollars, in thousands
2007 2008 2009 2010 2011 5-Yr. Chg. Tax State $691,014 $731,575 $773,957 $776,701 $796,623 15% Northern Regions Northwest (1) 6,196 6,325 6,560 7,070 9,544 54 Headwaters (2) 8,252 8,553 9,184 9,877 11,277 37 Arrowhead (3) 32,877 34,055 36,264 36,160 39,659 21 West Central (4) 20,614 21,521 22,832 24,168 26,204 27 Five (5) 25,607 26,554 27,500 28,295 28,739 12 East Central (7E) 10,590 10,931 11,372 11,453 11,984 13 Southern Regions Six East (6E) 8,637 8,928 9,648 10,114 11,132 29 Upper MN Valley (6W) 2,903 2,984 3,265 3,480 3,693 27 Central MN (7W) 39,981 41,787 44,509 46,600 48,679 22 Southwest (8) 7,974 7,891 8,842 9,615 10,785 35 Nine (9) 17,641 18,936 20,378 20,908 22,474 27 Southeastern MN (10) 41,477 43,060 46,715 48,306 51,866 25 Total Nonmetro $222,749 $231,525 $247,070 $256,045 $276,037 24% Metro Region Hennepin County 244,575 262,407 274,286 266,474 263,175 8 Ramsey County 82,794 88,549 92,356 90,813 91,537 11 Remaining Metro 140,896 149,094 160,246 163,369 165,875 18 Total Metro $468,265 $500,050 $526,888 $520,656 $520,586 11%
Statewide State General Property Tax
2007 20092008
$797
Actual dollars
2011 Inflation-adjusted dollars
$0
$250
$500
$1,000
Dollars (millions)
Revenue increased 3.3% over five-yearperiod, after adjusting for inflation
2010 2011
$750
House Research Graphics

House Research Department May 2015 Major State Aids and Taxes Page 99
2. Summary Data This section contains summary data for the most recent available year on
• statewide totals • the seven metro and the 80 nonmetro counties • the 13 economic development regions
A sample table and a general explanation of the tables in sections 2, 3, and 4 of the report precede the data.
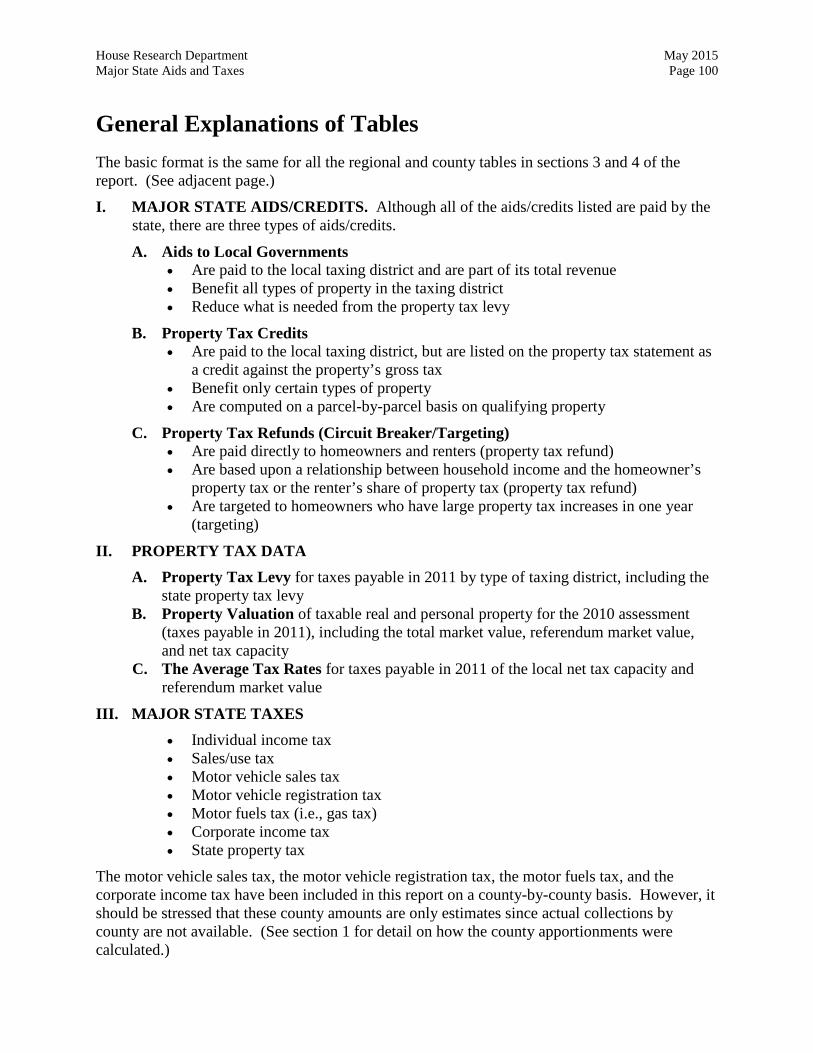
House Research Department May 2015 Major State Aids and Taxes Page 100
General Explanations of Tables The basic format is the same for all the regional and county tables in sections 3 and 4 of the report. (See adjacent page.)
I. MAJOR STATE AIDS/CREDITS. Although all of the aids/credits listed are paid by the state, there are three types of aids/credits.
A. Aids to Local Governments • Are paid to the local taxing district and are part of its total revenue • Benefit all types of property in the taxing district • Reduce what is needed from the property tax levy
B. Property Tax Credits • Are paid to the local taxing district, but are listed on the property tax statement as
a credit against the property’s gross tax • Benefit only certain types of property • Are computed on a parcel-by-parcel basis on qualifying property
C. Property Tax Refunds (Circuit Breaker/Targeting) • Are paid directly to homeowners and renters (property tax refund) • Are based upon a relationship between household income and the homeowner’s
property tax or the renter’s share of property tax (property tax refund) • Are targeted to homeowners who have large property tax increases in one year
(targeting)
II. PROPERTY TAX DATA A. Property Tax Levy for taxes payable in 2011 by type of taxing district, including the
state property tax levy B. Property Valuation of taxable real and personal property for the 2010 assessment
(taxes payable in 2011), including the total market value, referendum market value, and net tax capacity
C. The Average Tax Rates for taxes payable in 2011 of the local net tax capacity and referendum market value
III. MAJOR STATE TAXES • Individual income tax • Sales/use tax • Motor vehicle sales tax • Motor vehicle registration tax • Motor fuels tax (i.e., gas tax) • Corporate income tax • State property tax
The motor vehicle sales tax, the motor vehicle registration tax, the motor fuels tax, and the corporate income tax have been included in this report on a county-by-county basis. However, it should be stressed that these county amounts are only estimates since actual collections by county are not available. (See section 1 for detail on how the county apportionments were calculated.)
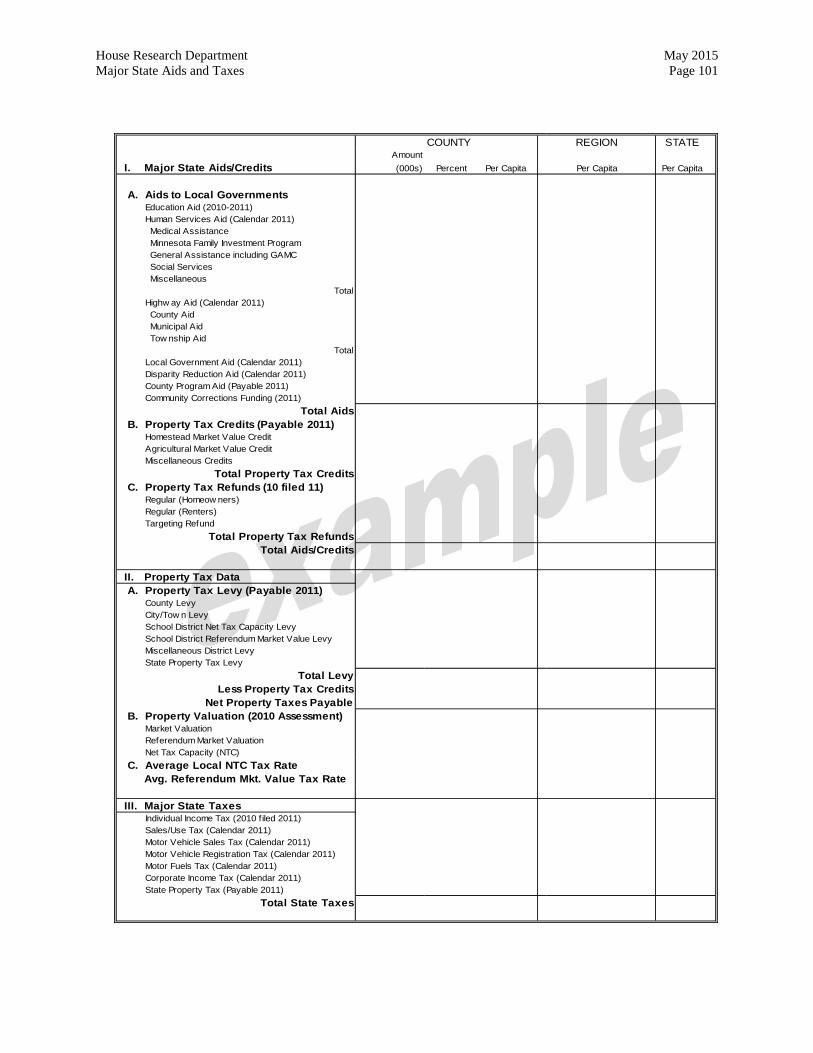
House Research Department May 2015 Major State Aids and Taxes Page 101
COUNTY REGION STATEAmount
I. Major State Aids/Credits (000s) Percent Per Capita Per Capita Per Capita
A. Aids to Local Governments Education Aid (2010-2011) Human Services Aid (Calendar 2011) Medical Assistance Minnesota Family Investment Program General Assistance including GAMC Social Services Miscellaneous
Total Highw ay Aid (Calendar 2011) County Aid Municipal Aid Tow nship Aid
Total Local Government Aid (Calendar 2011) Disparity Reduction Aid (Calendar 2011) County Program Aid (Payable 2011) Community Corrections Funding (2011)
Total Aids B. Property Tax Credits (Payable 2011) Homestead Market Value Credit Agricultural Market Value Credit Miscellaneous Credits
Total Property Tax Credits C. Property Tax Refunds (10 filed 11) Regular (Homeow ners) Regular (Renters) Targeting Refund
Total Property Tax Refunds Total Aids/Credits
II. Property Tax Data A. Property Tax Levy (Payable 2011) County Levy City/Tow n Levy School District Net Tax Capacity Levy School District Referendum Market Value Levy Miscellaneous District Levy State Property Tax Levy
Total Levy Less Property Tax Credits
Net Property Taxes Payable B. Property Valuation (2010 Assessment) Market Valuation Referendum Market Valuation Net Tax Capacity (NTC) C. Average Local NTC Tax Rate Avg. Referendum Mkt. Value Tax Rate
III. Major State Taxes Individual Income Tax (2010 f iled 2011) Sales/Use Tax (Calendar 2011) Motor Vehicle Sales Tax (Calendar 2011) Motor Vehicle Registration Tax (Calendar 2011) Motor Fuels Tax (Calendar 2011) Corporate Income Tax (Calendar 2011) State Property Tax (Payable 2011)
Total State Taxes

House Research Department May 2015 Major State Aids and Taxes Page 103 Statewide Summary Tables 2-1 and 2-2 contain the statewide totals of all the state aids and taxes presented in this report. Table 2-1 summarizes the total amounts for Minnesota residents only, whereas the amounts in Table 2-2 also include those dollars paid by nonresidents.
2011 population is used to calculate per capita amounts in the tables and maps throughout this report, even if 2010 is the most recent year for which data for a particular aid or tax is available, except for Appendix C and the maps on pages 114 and 115.
The total state aids and credits contained in this report equal about $13.2 billion, whereas the total of the eight major taxes listed in this report equal $14.0 billion paid by residents and an additional $1.2 billion paid by nonresidents (for a total tax amount of $15.2 billion).
The total taxes presented in this report are not the total of all taxes collected by the state. The total state net tax receipts were about $16.2 billion in fiscal year 2010 and $17.9 billion in fiscal year 2011. Furthermore, the taxes presented in this report are not for a specific time period but rather are the latest available data and/or the next data in sequence to the 2010 Update report (published June 2014). Therefore, the $15.2 billion total taxes listed in this report (residents and nonresidents) is about 89 percent of the total taxes actually collected over that period.
The taxes not contained in this report include estate, mortgage registry and deed, insurance gross premiums, MinnesotaCare, mineral, cigarette and tobacco products, lawful gambling, and alcoholic beverages. The collections from some of these taxes are dedicated for specific purposes.

House Research Department May 2015Table 2-1 Page 104
STATEWIDE SUMMARY - RESIDENTS ONLYAmount
I. Major State Aids/Credits (000s) Percent Per Capita
A. Aids to Local Governments Education Aid (2010-2011) $6,728,024 53.9% $1,262 Human Services Aid (Calendar 2011) Medical Assistance 2,827,887 22.6 530 Minnesota Family Investment Program 76,772 0.6 14 General Assistance including GAMC 41,221 0.3 8 Social Services 1,316,027 10.5 247 Miscellaneous 159,666 1.3 30
Total 4,421,574 35.4 829 Highway Aid (Calendar 2011) County Aid 470,326 3.8 88 Municipal Aid 147,719 1.2 28 Township Aid 34,508 0.3 6
Total 652,552 5.2 122 Local Government Aid (Calendar 2011) 425,345 3.4 80 Disparity Reduction Aid (Calendar 2011) 18,213 0.1 3 County Program Aid (Payable 2011) 161,106 1.3 30 Community Corrections Funding (2011) 83,296 0.7 16
Total Aids 12,490,110 100.0 2,342 B. Property Tax Credits (Payable 2011) Homestead Market Value Credit 156,513 76.4 29 Agricultural Market Value Credit 23,413 11.4 4 Miscellaneous Credits 24,929 12.2 5
Total Property Tax Credits 204,854 100.0 38 C. Property Tax Refunds (10 filed 11) Regular (Homeowners) 272,309 58.0 51 Regular (Renters) 195,387 41.6 37 Targeting Refund 1,902 0.4 0
Total Property Tax Refunds 469,597 100.0 88 Total Aids/Credits $13,164,561 100.0% $2,469
II. Property Tax Data A. Property Tax Levy (Payable 2011) County Levy $2,482,289 29.7% $466 City/Town Levy 1,915,713 22.9 359 School District Net Tax Capacity Levy 1,293,852 15.5 243 School District Referendum Market Value Levy 759,580 9.1 142 Miscellaneous District Levy 1,110,516 13.3 208 State Property Tax Levy 796,623 9.5 149
Total Levy $8,358,573 100.0% $1,568 Less Property Tax Credits 204,854 38
Net Property Taxes Payable 8,153,718 1,529 B. Property Valuation (2010 Assessment) Market Valuation $560,005,009 $105,022 Referendum Market Valuation 446,868,189 83,805 Net Tax Capacity (NTC) 6,245,082 1,171 C. Average Local NTC Tax Rate 108.350 Avg. Referendum Mkt. Value Tax Rate 0.178
III. Major State Taxes Individual Income Tax (2010 filed 2011) $6,530,689 46.5% $1,225 Sales/Use Tax (Calendar 2011) 3,975,605 28.3 746 Motor Vehicle Sales Tax (Calendar 2011) 538,490 3.8 101 Motor Vehicle Registration Tax (Calendar 2011) 574,395 4.1 108 Motor Fuels Tax (Calendar 2011) 846,661 6.0 159 Corporate Income Tax (Calendar 2011) 782,453 5.6 147 State General Property Tax (Payable 2011) 796,623 5.7 149
Total State Taxes $14,044,914 100.0% $2,634
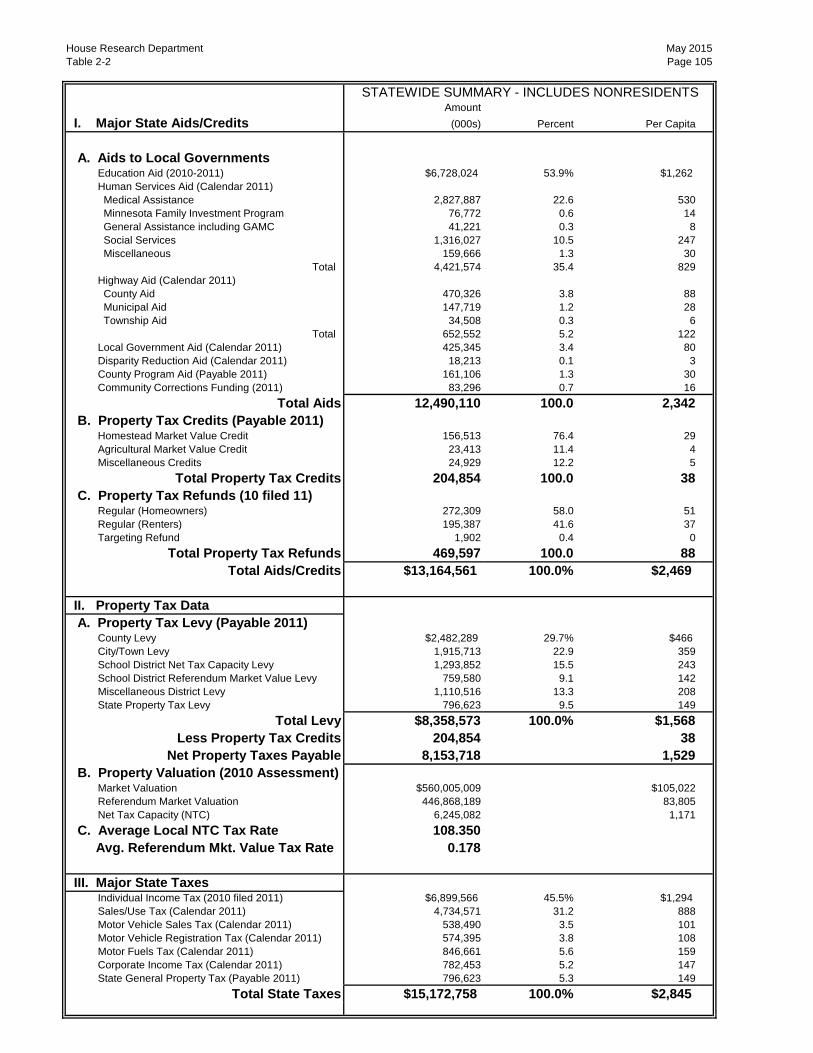
House Research Department May 2015Table 2-2 Page 105
STATEWIDE SUMMARY - INCLUDES NONRESIDENTSAmount
I. Major State Aids/Credits (000s) Percent Per Capita
A. Aids to Local Governments Education Aid (2010-2011) $6,728,024 53.9% $1,262 Human Services Aid (Calendar 2011) Medical Assistance 2,827,887 22.6 530 Minnesota Family Investment Program 76,772 0.6 14 General Assistance including GAMC 41,221 0.3 8 Social Services 1,316,027 10.5 247 Miscellaneous 159,666 1.3 30
Total 4,421,574 35.4 829 Highway Aid (Calendar 2011) County Aid 470,326 3.8 88 Municipal Aid 147,719 1.2 28 Township Aid 34,508 0.3 6
Total 652,552 5.2 122 Local Government Aid (Calendar 2011) 425,345 3.4 80 Disparity Reduction Aid (Calendar 2011) 18,213 0.1 3 County Program Aid (Payable 2011) 161,106 1.3 30 Community Corrections Funding (2011) 83,296 0.7 16
Total Aids 12,490,110 100.0 2,342 B. Property Tax Credits (Payable 2011) Homestead Market Value Credit 156,513 76.4 29 Agricultural Market Value Credit 23,413 11.4 4 Miscellaneous Credits 24,929 12.2 5
Total Property Tax Credits 204,854 100.0 38 C. Property Tax Refunds (10 filed 11) Regular (Homeowners) 272,309 58.0 51 Regular (Renters) 195,387 41.6 37 Targeting Refund 1,902 0.4 0
Total Property Tax Refunds 469,597 100.0 88 Total Aids/Credits $13,164,561 100.0% $2,469
II. Property Tax Data A. Property Tax Levy (Payable 2011) County Levy $2,482,289 29.7% $466 City/Town Levy 1,915,713 22.9 359 School District Net Tax Capacity Levy 1,293,852 15.5 243 School District Referendum Market Value Levy 759,580 9.1 142 Miscellaneous District Levy 1,110,516 13.3 208 State Property Tax Levy 796,623 9.5 149
Total Levy $8,358,573 100.0% $1,568 Less Property Tax Credits 204,854 38
Net Property Taxes Payable 8,153,718 1,529 B. Property Valuation (2010 Assessment) Market Valuation $560,005,009 $105,022 Referendum Market Valuation 446,868,189 83,805 Net Tax Capacity (NTC) 6,245,082 1,171 C. Average Local NTC Tax Rate 108.350 Avg. Referendum Mkt. Value Tax Rate 0.178
III. Major State Taxes Individual Income Tax (2010 filed 2011) $6,899,566 45.5% $1,294 Sales/Use Tax (Calendar 2011) 4,734,571 31.2 888 Motor Vehicle Sales Tax (Calendar 2011) 538,490 3.5 101 Motor Vehicle Registration Tax (Calendar 2011) 574,395 3.8 108 Motor Fuels Tax (Calendar 2011) 846,661 5.6 159 Corporate Income Tax (Calendar 2011) 782,453 5.2 147 State General Property Tax (Payable 2011) 796,623 5.3 149
Total State Taxes $15,172,758 100.0% $2,845

House Research Department May 2015 Major State Aids and Taxes Page 107
Metro/Nonmetro Data Tables 2-3 and 2-4 contain data comparing the metro and nonmetro counties. The metro counties are the Twin Cities seven metropolitan counties—Anoka, Carver, Dakota, Hennepin, Ramsey, Scott, and Washington. The nonmetro counties are the remaining 80 counties in the state.
Table 2-3 has the metro and nonmetro dollar amounts of aids and taxes and a per capita comparison.
Table 2-4 presents a statewide breakdown of metro versus nonmetro for each of the categories. Each item adds across to 100 percent; for example 55.8 percent of the education aid goes to metro counties and 44.2 percent goes to nonmetro counties.
2010 population is used to calculate per capita amounts in the tables and maps throughout this report, even if 2009 is the most recent year for which data for a particular aid or tax is available, except for Appendix C and the maps on pages 114 and 115.
Note: The metro and nonmetro totals add to the state totals in Table 2-1, which include only Minnesota residents.
The additional amounts paid by out-of-state taxpayers have not been allocated to any county. The amount of sales and income taxes which is unallocated to Minnesota is about $1.0 billion. Appendix B has a list of the type of tax and amounts not entirely allocated to Minnesota counties.

House Research Department May 2015Table 2-3 Page 108
METRO NONMETROAmount Amount
I. Major State Aids/Credits (000s) Percent Per Capita (000s) Percent Per Capita
A. Aids to Local Governments Education Aid (2010-2011) $3,756,329 56.5% $1,307 $2,971,694 50.9% $1,209 Human Services Aid (Calendar 2011) Medical Assistance 1,556,584 23.4 542 1,271,303 21.8 517 Minnesota Family Investment Program 50,160 0.8 17 26,612 0.5 11 General Assistance including GAMC 29,892 0.4 10 11,329 0.2 5 Social Services 705,546 10.6 246 610,481 10.4 248 Miscellaneous 102,029 1.5 36 57,637 1.0 23
Total 2,444,211 36.8 851 1,977,362 33.8 804 Highway Aid (Calendar 2011) County Aid 109,674 1.6 38 360,652 6.2 147 Municipal Aid 94,021 1.4 33 53,697 0.9 22 Township Aid 860 0.0 0 33,648 0.6 14
Total 204,555 3.1 71 447,998 7.7 182 Local Government Aid (Calendar 2011) 132,977 2.0 46 292,368 5.0 119 Disparity Reduction Aid (Calendar 2011) 1,428 0.0 0 16,785 0.3 7 County Program Aid (Payable 2011) 67,009 1.0 23 94,097 1.6 38 Community Corrections Funding (2011) 41,220 0.6 14 42,076 0.7 17
Total Aids 6,647,729 100.0 2,314 5,842,381 100.0 2,376 B. Property Tax Credits (Payable 2011) Homestead Market Value Credit 57,543 97.1 20 98,970 68.0 40 Agricultural Market Value Credit 1,103 1.9 0 22,310 15.3 9 Miscellaneous Credits 585 1.0 0 24,343 16.7 10
Total Property Tax Credits 59,231 100.0 21 145,623 100.0 59 C. Property Tax Refunds (10 filed 11) Regular (Homeowners) 191,751 59.2 67 80,557 55.2 33 Regular (Renters) 130,673 40.4 45 64,713 44.3 26 Targeting Refund 1,231 0.4 0 670 0.5 0
Total Property Tax Refunds 323,656 100.0 113 145,941 100.0 59 Total Aids/Credits $7,030,616 100.0% $2,447 $6,133,945 100.0% $2,495
II. Property Tax Data A. Property Tax Levy (Payable 2011) County Levy $1,217,348 23.3% $424 $1,264,941 40.3% $514 City/Town Levy 1,169,088 22.4 407 746,626 23.8 304 School District Net Tax Capacity Levy 767,794 14.7 267 526,058 16.8 214 School District Referendum Market Value Levy 536,331 10.3 187 223,248 7.1 91 Miscellaneous District Levy 1,011,935 19.4 352 98,581 3.1 40 State Property Tax Levy 520,586 10.0 181 276,037 8.8 112
Total Levy $5,223,082 100.0% $1,818 $3,135,490 100.0% $1,275 Less Property Tax Credits 59,231 21 145,623 59
Net Property Taxes Payable 5,163,851 1,797 2,989,867 1,216 B. Property Valuation (2010 Assessment) Market Valuation $290,961,355 $101,259 $269,043,653 $109,421 Referendum Market Valuation 286,252,860 99,620 160,615,329 65,323 Net Tax Capacity (NTC) 3,502,971 1,219 2,742,111 1,115 C. Average Local NTC Tax Rate 118.074 95.927 Avg. Referendum Mkt. Value Tax Rate 0.198 0.143
III. Major State Taxes Individual Income Tax (2010 filed 2011) $4,363,770 48.7% $1,519 $2,166,919 42.6% $881 Sales/Use Tax (Calendar 2011) 2,550,450 28.5 888 1,425,155 28.0 580 Motor Vehicle Sales Tax (Calendar 2011) 281,379 3.1 98 257,111 5.1 105 Motor Vehicle Registration Tax (Calendar 2011) 310,203 3.5 108 264,192 5.2 107 Motor Fuels Tax (Calendar 2011) 397,331 4.4 138 449,330 8.8 183 Corporate Income Tax (Calendar 2011) 537,243 6.0 187 245,210 4.8 100 State General Property Tax (Payable 2011) 520,586 5.8 181 276,037 5.4 112
Total State Taxes $8,960,962 100.0% $3,119 $5,083,953 100.0% $2,068
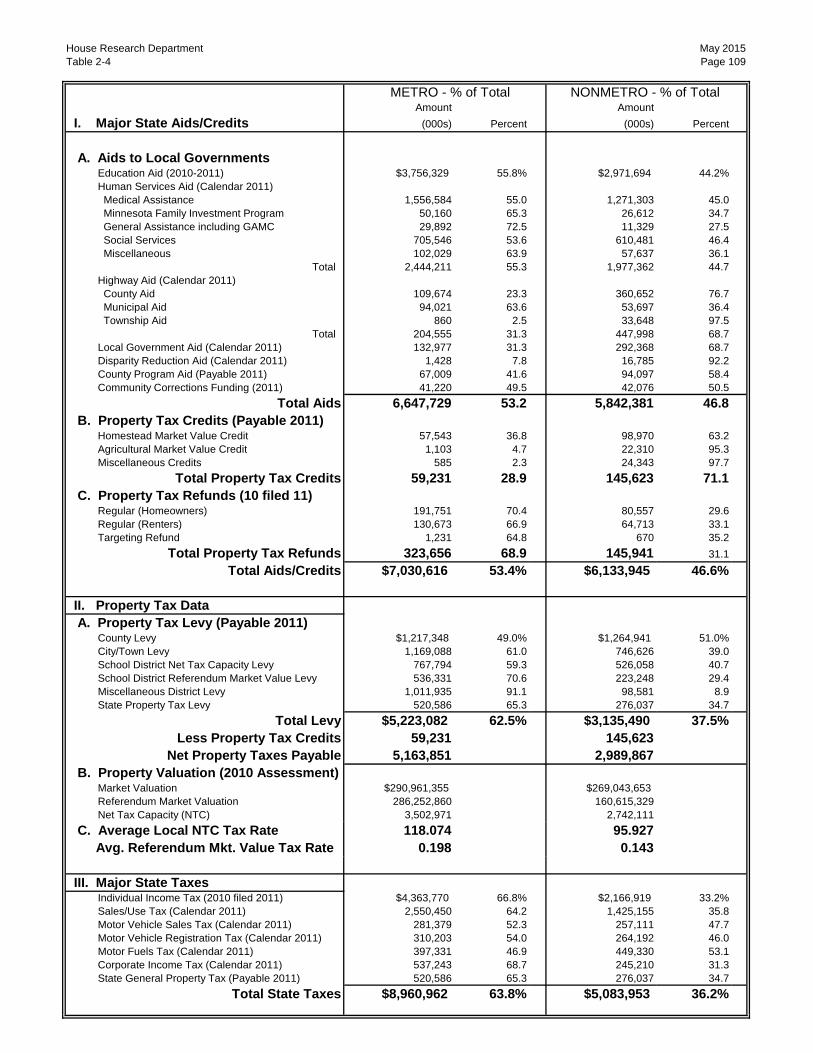
House Research Department May 2015Table 2-4 Page 109
METRO - % of Total NONMETRO - % of TotalAmount Amount
I. Major State Aids/Credits (000s) Percent (000s) Percent
A. Aids to Local Governments Education Aid (2010-2011) $3,756,329 55.8% $2,971,694 44.2% Human Services Aid (Calendar 2011) Medical Assistance 1,556,584 55.0 1,271,303 45.0 Minnesota Family Investment Program 50,160 65.3 26,612 34.7 General Assistance including GAMC 29,892 72.5 11,329 27.5 Social Services 705,546 53.6 610,481 46.4 Miscellaneous 102,029 63.9 57,637 36.1
Total 2,444,211 55.3 1,977,362 44.7 Highway Aid (Calendar 2011) County Aid 109,674 23.3 360,652 76.7 Municipal Aid 94,021 63.6 53,697 36.4 Township Aid 860 2.5 33,648 97.5
Total 204,555 31.3 447,998 68.7 Local Government Aid (Calendar 2011) 132,977 31.3 292,368 68.7 Disparity Reduction Aid (Calendar 2011) 1,428 7.8 16,785 92.2 County Program Aid (Payable 2011) 67,009 41.6 94,097 58.4 Community Corrections Funding (2011) 41,220 49.5 42,076 50.5
Total Aids 6,647,729 53.2 5,842,381 46.8 B. Property Tax Credits (Payable 2011) Homestead Market Value Credit 57,543 36.8 98,970 63.2 Agricultural Market Value Credit 1,103 4.7 22,310 95.3 Miscellaneous Credits 585 2.3 24,343 97.7
Total Property Tax Credits 59,231 28.9 145,623 71.1 C. Property Tax Refunds (10 filed 11) Regular (Homeowners) 191,751 70.4 80,557 29.6 Regular (Renters) 130,673 66.9 64,713 33.1 Targeting Refund 1,231 64.8 670 35.2
Total Property Tax Refunds 323,656 68.9 145,941 31.1 Total Aids/Credits $7,030,616 53.4% $6,133,945 46.6%
II. Property Tax Data A. Property Tax Levy (Payable 2011) County Levy $1,217,348 49.0% $1,264,941 51.0% City/Town Levy 1,169,088 61.0 746,626 39.0 School District Net Tax Capacity Levy 767,794 59.3 526,058 40.7 School District Referendum Market Value Levy 536,331 70.6 223,248 29.4 Miscellaneous District Levy 1,011,935 91.1 98,581 8.9 State Property Tax Levy 520,586 65.3 276,037 34.7
Total Levy $5,223,082 62.5% $3,135,490 37.5% Less Property Tax Credits 59,231 145,623
Net Property Taxes Payable 5,163,851 2,989,867 B. Property Valuation (2010 Assessment) Market Valuation $290,961,355 $269,043,653 Referendum Market Valuation 286,252,860 160,615,329 Net Tax Capacity (NTC) 3,502,971 2,742,111 C. Average Local NTC Tax Rate 118.074 95.927 Avg. Referendum Mkt. Value Tax Rate 0.198 0.143
III. Major State Taxes Individual Income Tax (2010 filed 2011) $4,363,770 66.8% $2,166,919 33.2% Sales/Use Tax (Calendar 2011) 2,550,450 64.2 1,425,155 35.8 Motor Vehicle Sales Tax (Calendar 2011) 281,379 52.3 257,111 47.7 Motor Vehicle Registration Tax (Calendar 2011) 310,203 54.0 264,192 46.0 Motor Fuels Tax (Calendar 2011) 397,331 46.9 449,330 53.1 Corporate Income Tax (Calendar 2011) 537,243 68.7 245,210 31.3 State General Property Tax (Payable 2011) 520,586 65.3 276,037 34.7
Total State Taxes $8,960,962 63.8% $5,083,953 36.2%

House Research Department May 2015 Major State Aids and Taxes Page 111
3. Regional Data There are four statewide maps comparing various tax/aid factors.
• Map on page 112 is total per capita aid and credits by economic development region
• Map on page 113 is total per capita taxes (residents only) by economic development region
• Map on page 114 is per capita personal income by county
• Map on page 115 is per capita personal income by economic development region
Table 3 compares the state aid/tax data for each of the 13 regions with the statewide totals. There is a separate table for each region.
Statewide per capita amounts exclude income and sales taxes paid by nonresidents of Minnesota.
The map of Minnesota on page 4 and table on page 5 show the counties that are located in each of the 13 economic development regions.
2011 population is used to calculate per capita amounts in the tables and maps throughout this report, even if 2010 is the most recent year for which data for a particular aid or tax is available, except for Appendix C and the maps on pages 114 and 115.
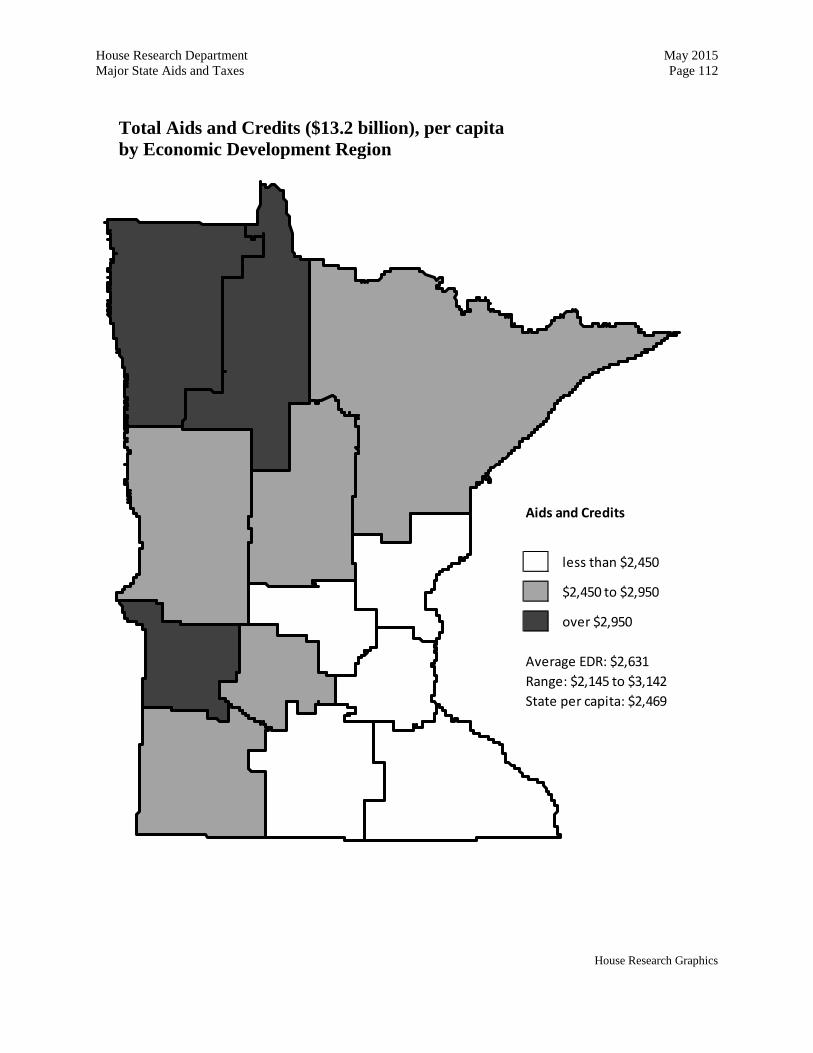
House Research Department May 2015 Major State Aids and Taxes Page 112
House Research Graphics
Aids and Credits
less than $2,450
$2,450 to $2,950
over $2,950
Average EDR: $2,631Range: $2,145 to $3,142State per capita: $2,469
Total Aids and Credits ($13.2 billion), per capita by Economic Development Region
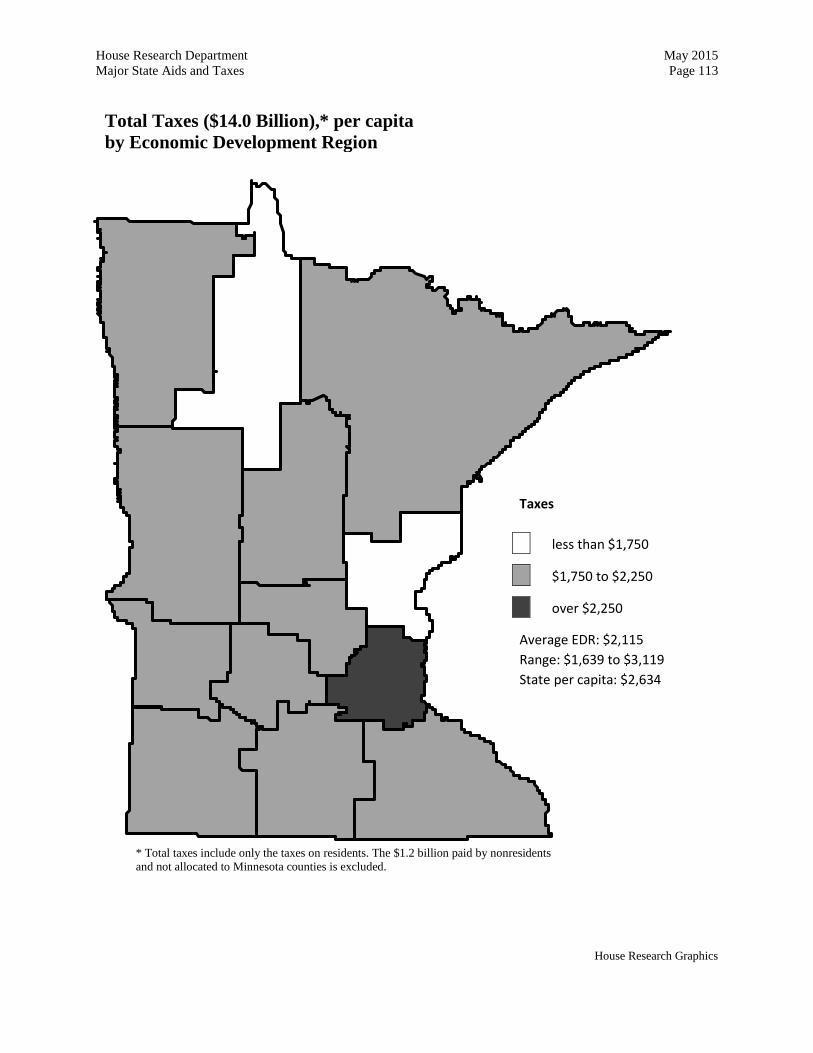
House Research Department May 2015 Major State Aids and Taxes Page 113
House Research Graphics
Taxes
less than $1,750
$1,750 to $2,250
over $2,250
Average EDR: $2,115 Range: $1,639 to $3,119 State per capita: $2,634
Total Taxes ($14.0 Billion),* per capita by Economic Development Region
* Total taxes include only the taxes on residents. The $1.2 billion paid by nonresidents and not allocated to Minnesota counties is excluded.
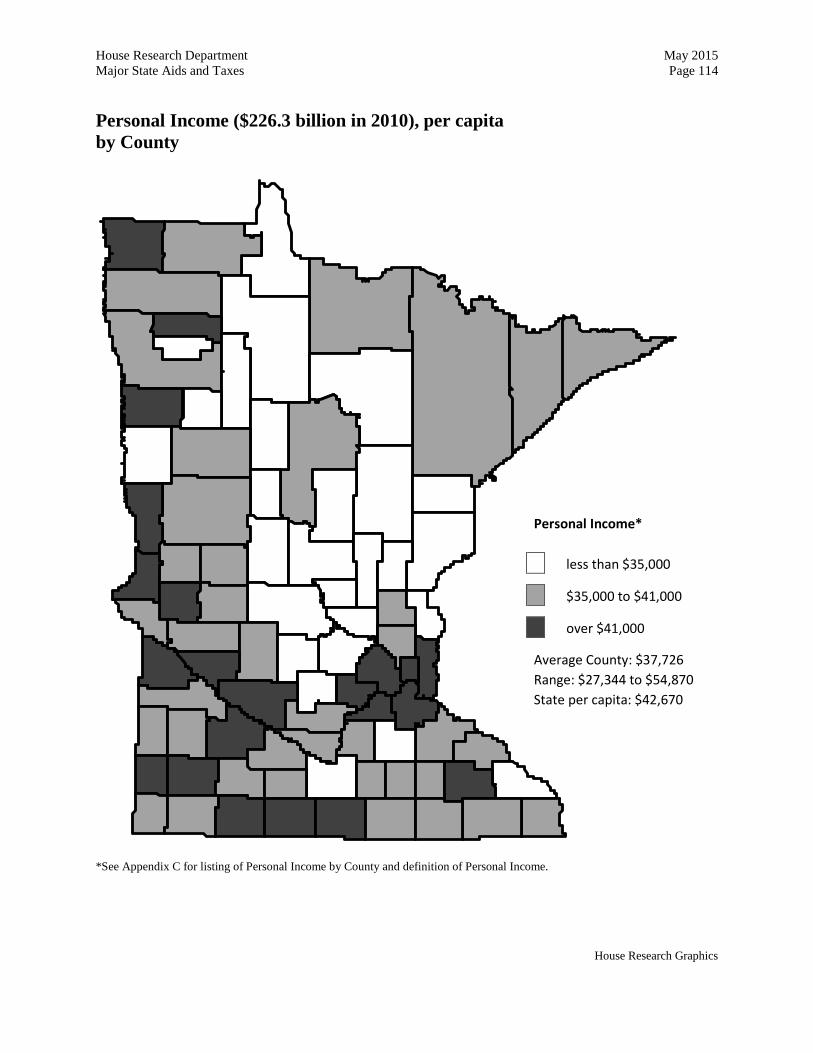
House Research Department May 2015 Major State Aids and Taxes Page 114 Personal Income ($226.3 billion in 2010), per capita by County
*See Appendix C for listing of Personal Income by County and definition of Personal Income.
House Research Graphics
Personal Income*
less than $35,000
$35,000 to $41,000
over $41,000
Average County: $37,726 Range: $27,344 to $54,870 State per capita: $42,670
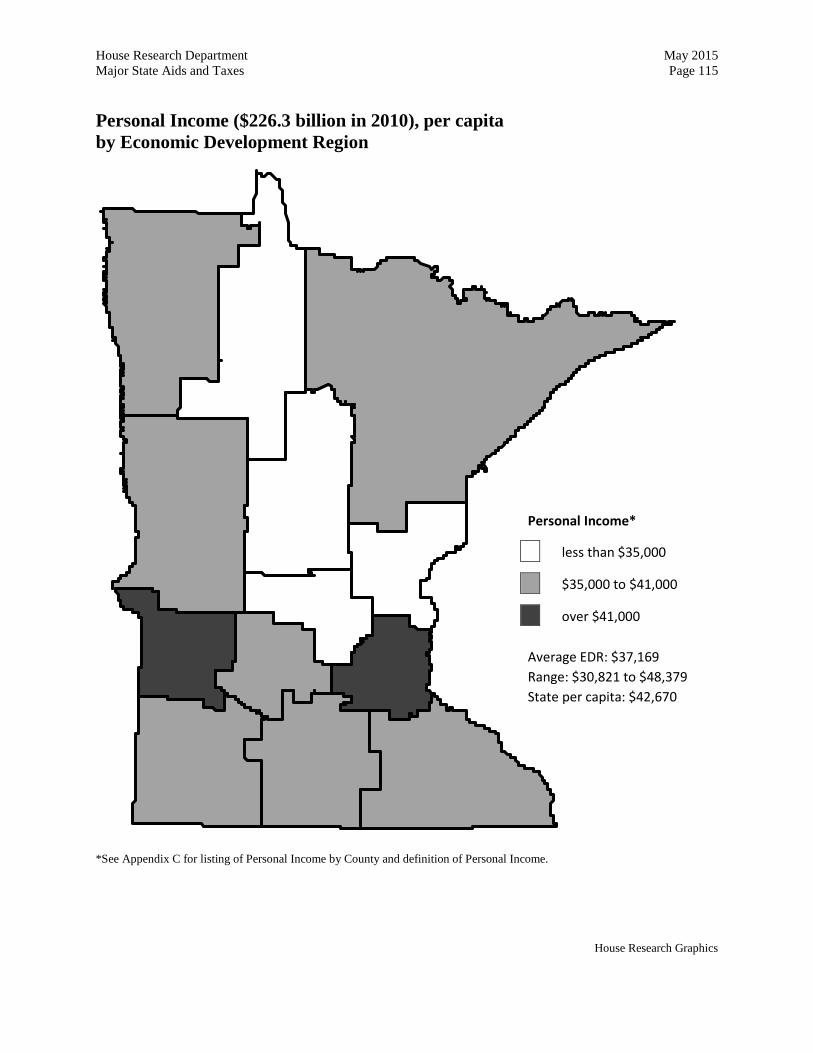
House Research Department May 2015 Major State Aids and Taxes Page 115 Personal Income ($226.3 billion in 2010), per capita by Economic Development Region
*See Appendix C for listing of Personal Income by County and definition of Personal Income.
House Research Graphics
Personal Income*
less than $35,000
$35,000 to $41,000
over $41,000
Average EDR: $37,169 Range: $30,821 to $48,379 State per capita: $42,670
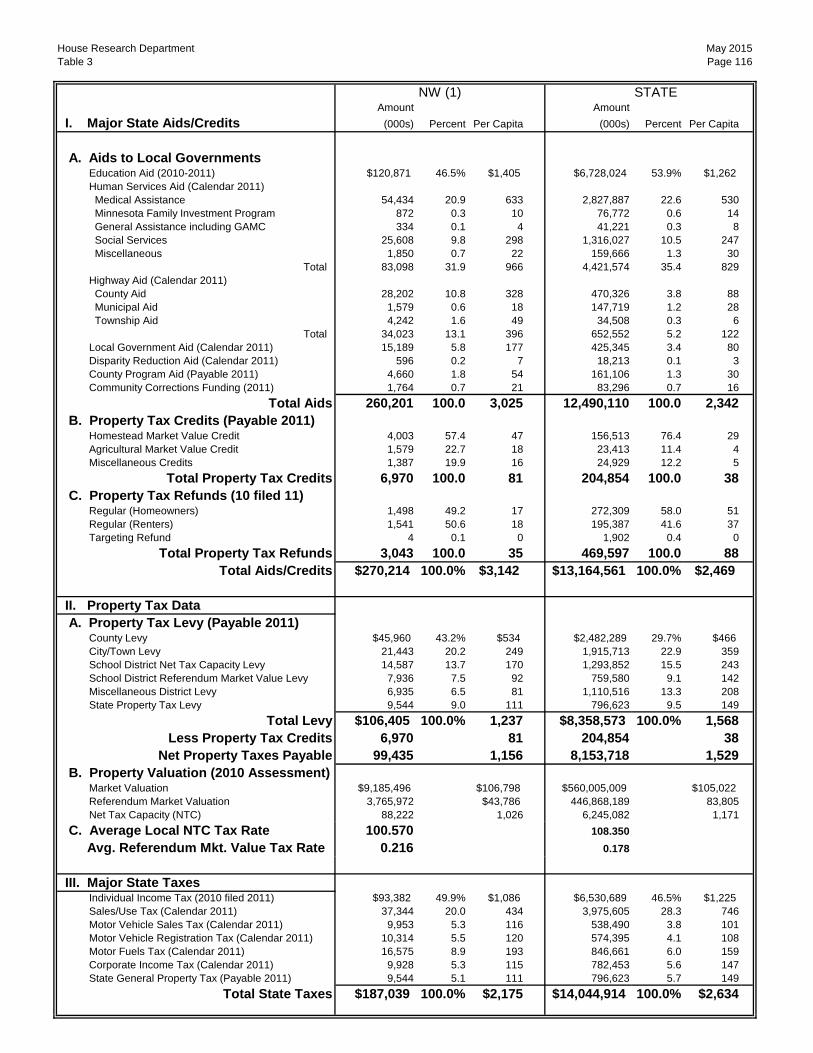
House Research Department May 2015Table 3 Page 116
NW (1) STATEAmount Amount
I. Major State Aids/Credits (000s) Percent Per Capita (000s) Percent Per Capita
A. Aids to Local Governments Education Aid (2010-2011) $120,871 46.5% $1,405 $6,728,024 53.9% $1,262 Human Services Aid (Calendar 2011) Medical Assistance 54,434 20.9 633 2,827,887 22.6 530 Minnesota Family Investment Program 872 0.3 10 76,772 0.6 14 General Assistance including GAMC 334 0.1 4 41,221 0.3 8 Social Services 25,608 9.8 298 1,316,027 10.5 247 Miscellaneous 1,850 0.7 22 159,666 1.3 30
Total 83,098 31.9 966 4,421,574 35.4 829 Highway Aid (Calendar 2011) County Aid 28,202 10.8 328 470,326 3.8 88 Municipal Aid 1,579 0.6 18 147,719 1.2 28 Township Aid 4,242 1.6 49 34,508 0.3 6
Total 34,023 13.1 396 652,552 5.2 122 Local Government Aid (Calendar 2011) 15,189 5.8 177 425,345 3.4 80 Disparity Reduction Aid (Calendar 2011) 596 0.2 7 18,213 0.1 3 County Program Aid (Payable 2011) 4,660 1.8 54 161,106 1.3 30 Community Corrections Funding (2011) 1,764 0.7 21 83,296 0.7 16
Total Aids 260,201 100.0 3,025 12,490,110 100.0 2,342 B. Property Tax Credits (Payable 2011) Homestead Market Value Credit 4,003 57.4 47 156,513 76.4 29 Agricultural Market Value Credit 1,579 22.7 18 23,413 11.4 4 Miscellaneous Credits 1,387 19.9 16 24,929 12.2 5
Total Property Tax Credits 6,970 100.0 81 204,854 100.0 38 C. Property Tax Refunds (10 filed 11) Regular (Homeowners) 1,498 49.2 17 272,309 58.0 51 Regular (Renters) 1,541 50.6 18 195,387 41.6 37 Targeting Refund 4 0.1 0 1,902 0.4 0
Total Property Tax Refunds 3,043 100.0 35 469,597 100.0 88 Total Aids/Credits $270,214 100.0% $3,142 $13,164,561 100.0% $2,469
II. Property Tax Data A. Property Tax Levy (Payable 2011) County Levy $45,960 43.2% $534 $2,482,289 29.7% $466 City/Town Levy 21,443 20.2 249 1,915,713 22.9 359 School District Net Tax Capacity Levy 14,587 13.7 170 1,293,852 15.5 243 School District Referendum Market Value Levy 7,936 7.5 92 759,580 9.1 142 Miscellaneous District Levy 6,935 6.5 81 1,110,516 13.3 208 State Property Tax Levy 9,544 9.0 111 796,623 9.5 149
Total Levy $106,405 100.0% 1,237 $8,358,573 100.0% 1,568 Less Property Tax Credits 6,970 81 204,854 38
Net Property Taxes Payable 99,435 1,156 8,153,718 1,529 B. Property Valuation (2010 Assessment) Market Valuation $9,185,496 $106,798 $560,005,009 $105,022 Referendum Market Valuation 3,765,972 $43,786 446,868,189 83,805 Net Tax Capacity (NTC) 88,222 1,026 6,245,082 1,171 C. Average Local NTC Tax Rate 100.570 108.350 Avg. Referendum Mkt. Value Tax Rate 0.216 0.178
III. Major State Taxes Individual Income Tax (2010 filed 2011) $93,382 49.9% $1,086 $6,530,689 46.5% $1,225 Sales/Use Tax (Calendar 2011) 37,344 20.0 434 3,975,605 28.3 746 Motor Vehicle Sales Tax (Calendar 2011) 9,953 5.3 116 538,490 3.8 101 Motor Vehicle Registration Tax (Calendar 2011) 10,314 5.5 120 574,395 4.1 108 Motor Fuels Tax (Calendar 2011) 16,575 8.9 193 846,661 6.0 159 Corporate Income Tax (Calendar 2011) 9,928 5.3 115 782,453 5.6 147 State General Property Tax (Payable 2011) 9,544 5.1 111 796,623 5.7 149
Total State Taxes $187,039 100.0% $2,175 $14,044,914 100.0% $2,634

House Research Department May 2015Table 3 Page 117
HEADWATERS (2) STATEAmount Amount
I. Major State Aids/Credits (000s) Percent Per Capita (000s) Percent Per Capita
A. Aids to Local Governments Education Aid (2010-2011) $121,080 47.4% $1,444 $6,728,024 53.9% $1,262 Human Services Aid (Calendar 2011) Medical Assistance 74,324 29.1 886 2,827,887 22.6 530 Minnesota Family Investment Program 3,452 1.4 41 76,772 0.6 14 General Assistance including GAMC 528 0.2 6 41,221 0.3 8 Social Services 22,853 8.9 272 1,316,027 10.5 247 Miscellaneous 1,958 0.8 23 159,666 1.3 30
Total 103,115 40.4 1,229 4,421,574 35.4 829 Highway Aid (Calendar 2011) County Aid 17,433 6.8 208 470,326 3.8 88 Municipal Aid 496 0.2 6 147,719 1.2 28 Township Aid 1,173 0.5 14 34,508 0.3 6
Total 19,102 7.5 228 652,552 5.2 122 Local Government Aid (Calendar 2011) 5,145 2.0 61 425,345 3.4 80 Disparity Reduction Aid (Calendar 2011) 233 0.1 3 18,213 0.1 3 County Program Aid (Payable 2011) 5,133 2.0 61 161,106 1.3 30 Community Corrections Funding (2011) 1,593 0.6 19 83,296 0.7 16
Total Aids 255,400 100.0 3,045 12,490,110 100.0 2,342 B. Property Tax Credits (Payable 2011) Homestead Market Value Credit 3,383 78.7 40 156,513 76.4 29 Agricultural Market Value Credit 874 20.4 10 23,413 11.4 4 Miscellaneous Credits 39 0.9 0 24,929 12.2 5
Total Property Tax Credits 4,297 100.0 51 204,854 100.0 38 C. Property Tax Refunds (10 filed 11) Regular (Homeowners) 1,792 50.8 21 272,309 58.0 51 Regular (Renters) 1,727 49.0 21 195,387 41.6 37 Targeting Refund 7 0.2 0 1,902 0.4 0
Total Property Tax Refunds 3,527 100.0 42 469,597 100.0 88 Total Aids/Credits $263,224 100.0% $3,138 $13,164,561 100.0% $2,469
II. Property Tax Data A. Property Tax Levy (Payable 2011) County Levy $39,511 41.9% $471 $2,482,289 29.7% $466 City/Town Levy 17,696 18.8 211 1,915,713 22.9 359 School District Net Tax Capacity Levy 17,857 18.9 213 1,293,852 15.5 243 School District Referendum Market Value Levy 5,198 5.5 62 759,580 9.1 142 Miscellaneous District Levy 2,828 3.0 34 1,110,516 13.3 208 State Property Tax Levy 11,277 12.0 134 796,623 9.5 149
Total Levy $94,369 100.0% 1,125 $8,358,573 100.0% 1,568 Less Property Tax Credits 4,297 51 204,854 38
Net Property Taxes Payable 90,072 1,074 8,153,718 1,529 B. Property Valuation (2010 Assessment) Market Valuation $8,447,704 $100,715 $560,005,009 $105,022 Referendum Market Valuation 4,796,782 $57,188 446,868,189 83,805 Net Tax Capacity (NTC) 88,967 1,061 6,245,082 1,171 C. Average Local NTC Tax Rate 87.553 108.350 Avg. Referendum Mkt. Value Tax Rate 0.108 0.178
III. Major State Taxes Individual Income Tax (2010 filed 2011) $47,907 33.8% $571 $6,530,689 46.5% $1,225 Sales/Use Tax (Calendar 2011) 48,906 34.5 583 3,975,605 28.3 746 Motor Vehicle Sales Tax (Calendar 2011) 7,802 5.5 93 538,490 3.8 101 Motor Vehicle Registration Tax (Calendar 2011) 7,741 5.5 92 574,395 4.1 108 Motor Fuels Tax (Calendar 2011) 13,834 9.8 165 846,661 6.0 159 Corporate Income Tax (Calendar 2011) 4,404 3.1 53 782,453 5.6 147 State General Property Tax (Payable 2011) 11,277 7.9 134 796,623 5.7 149
Total State Taxes $141,871 100.0% $1,691 $14,044,914 100.0% $2,634
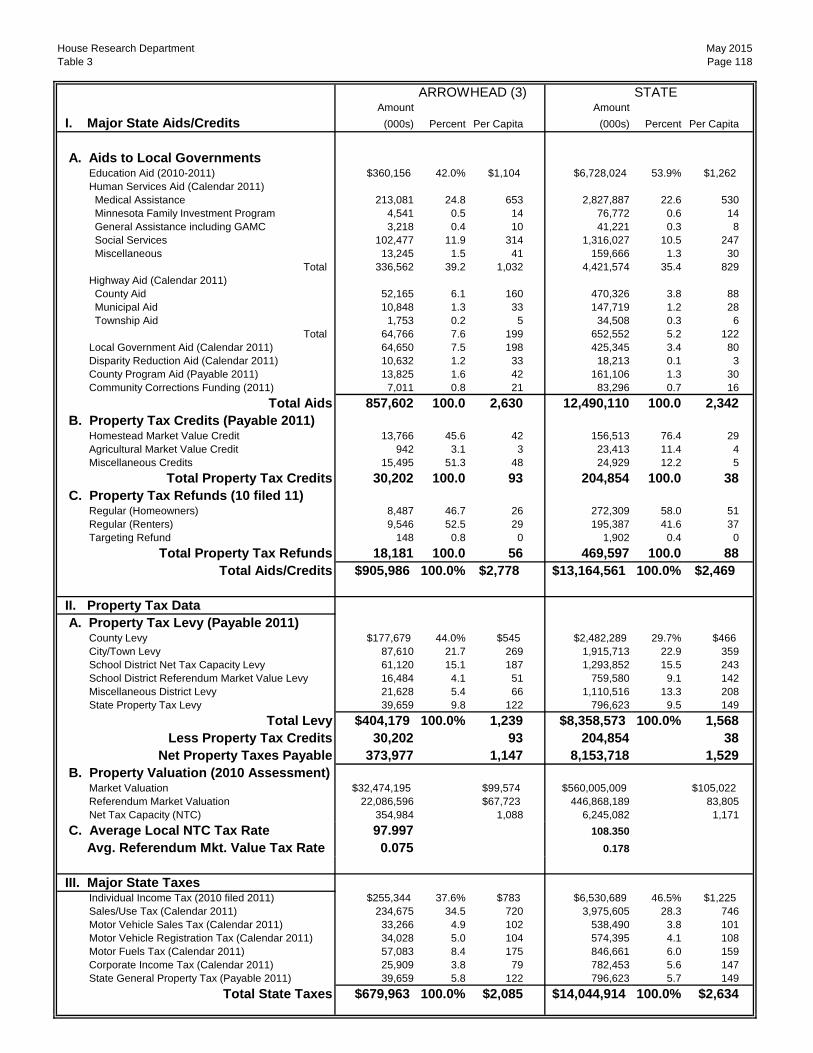
House Research Department May 2015Table 3 Page 118
ARROWHEAD (3) STATEAmount Amount
I. Major State Aids/Credits (000s) Percent Per Capita (000s) Percent Per Capita
A. Aids to Local Governments Education Aid (2010-2011) $360,156 42.0% $1,104 $6,728,024 53.9% $1,262 Human Services Aid (Calendar 2011) Medical Assistance 213,081 24.8 653 2,827,887 22.6 530 Minnesota Family Investment Program 4,541 0.5 14 76,772 0.6 14 General Assistance including GAMC 3,218 0.4 10 41,221 0.3 8 Social Services 102,477 11.9 314 1,316,027 10.5 247 Miscellaneous 13,245 1.5 41 159,666 1.3 30
Total 336,562 39.2 1,032 4,421,574 35.4 829 Highway Aid (Calendar 2011) County Aid 52,165 6.1 160 470,326 3.8 88 Municipal Aid 10,848 1.3 33 147,719 1.2 28 Township Aid 1,753 0.2 5 34,508 0.3 6
Total 64,766 7.6 199 652,552 5.2 122 Local Government Aid (Calendar 2011) 64,650 7.5 198 425,345 3.4 80 Disparity Reduction Aid (Calendar 2011) 10,632 1.2 33 18,213 0.1 3 County Program Aid (Payable 2011) 13,825 1.6 42 161,106 1.3 30 Community Corrections Funding (2011) 7,011 0.8 21 83,296 0.7 16
Total Aids 857,602 100.0 2,630 12,490,110 100.0 2,342 B. Property Tax Credits (Payable 2011) Homestead Market Value Credit 13,766 45.6 42 156,513 76.4 29 Agricultural Market Value Credit 942 3.1 3 23,413 11.4 4 Miscellaneous Credits 15,495 51.3 48 24,929 12.2 5
Total Property Tax Credits 30,202 100.0 93 204,854 100.0 38 C. Property Tax Refunds (10 filed 11) Regular (Homeowners) 8,487 46.7 26 272,309 58.0 51 Regular (Renters) 9,546 52.5 29 195,387 41.6 37 Targeting Refund 148 0.8 0 1,902 0.4 0
Total Property Tax Refunds 18,181 100.0 56 469,597 100.0 88 Total Aids/Credits $905,986 100.0% $2,778 $13,164,561 100.0% $2,469
II. Property Tax Data A. Property Tax Levy (Payable 2011) County Levy $177,679 44.0% $545 $2,482,289 29.7% $466 City/Town Levy 87,610 21.7 269 1,915,713 22.9 359 School District Net Tax Capacity Levy 61,120 15.1 187 1,293,852 15.5 243 School District Referendum Market Value Levy 16,484 4.1 51 759,580 9.1 142 Miscellaneous District Levy 21,628 5.4 66 1,110,516 13.3 208 State Property Tax Levy 39,659 9.8 122 796,623 9.5 149
Total Levy $404,179 100.0% 1,239 $8,358,573 100.0% 1,568 Less Property Tax Credits 30,202 93 204,854 38
Net Property Taxes Payable 373,977 1,147 8,153,718 1,529 B. Property Valuation (2010 Assessment) Market Valuation $32,474,195 $99,574 $560,005,009 $105,022 Referendum Market Valuation 22,086,596 $67,723 446,868,189 83,805 Net Tax Capacity (NTC) 354,984 1,088 6,245,082 1,171 C. Average Local NTC Tax Rate 97.997 108.350 Avg. Referendum Mkt. Value Tax Rate 0.075 0.178
III. Major State Taxes Individual Income Tax (2010 filed 2011) $255,344 37.6% $783 $6,530,689 46.5% $1,225 Sales/Use Tax (Calendar 2011) 234,675 34.5 720 3,975,605 28.3 746 Motor Vehicle Sales Tax (Calendar 2011) 33,266 4.9 102 538,490 3.8 101 Motor Vehicle Registration Tax (Calendar 2011) 34,028 5.0 104 574,395 4.1 108 Motor Fuels Tax (Calendar 2011) 57,083 8.4 175 846,661 6.0 159 Corporate Income Tax (Calendar 2011) 25,909 3.8 79 782,453 5.6 147 State General Property Tax (Payable 2011) 39,659 5.8 122 796,623 5.7 149
Total State Taxes $679,963 100.0% $2,085 $14,044,914 100.0% $2,634

House Research Department May 2015Table 3 Page 119
W CENTRAL (4) STATEAmount Amount
I. Major State Aids/Credits (000s) Percent Per Capita (000s) Percent Per Capita
A. Aids to Local Governments Education Aid (2010-2011) $257,768 48.1% $1,158 $6,728,024 53.9% $1,262 Human Services Aid (Calendar 2011) Medical Assistance 125,565 23.4 564 2,827,887 22.6 530 Minnesota Family Investment Program 2,044 0.4 9 76,772 0.6 14 General Assistance including GAMC 1,216 0.2 5 41,221 0.3 8 Social Services 59,296 11.1 266 1,316,027 10.5 247 Miscellaneous 5,218 1.0 23 159,666 1.3 30
Total 193,339 36.1 868 4,421,574 35.4 829 Highway Aid (Calendar 2011) County Aid 37,802 7.0 170 470,326 3.8 88 Municipal Aid 5,755 1.1 26 147,719 1.2 28 Township Aid 4,556 0.8 20 34,508 0.3 6
Total 48,113 9.0 216 652,552 5.2 122 Local Government Aid (Calendar 2011) 25,531 4.8 115 425,345 3.4 80 Disparity Reduction Aid (Calendar 2011) 313 0.1 1 18,213 0.1 3 County Program Aid (Payable 2011) 7,481 1.4 34 161,106 1.3 30 Community Corrections Funding (2011) 3,745 0.7 17 83,296 0.7 16
Total Aids 536,291 100.0 2,409 12,490,110 100.0 2,342 B. Property Tax Credits (Payable 2011) Homestead Market Value Credit 9,467 54.6 43 156,513 76.4 29 Agricultural Market Value Credit 2,550 14.7 11 23,413 11.4 4 Miscellaneous Credits 5,316 30.7 24 24,929 12.2 5
Total Property Tax Credits 17,333 100.0 78 204,854 100.0 38 C. Property Tax Refunds (10 filed 11) Regular (Homeowners) 5,883 50.6 26 272,309 58.0 51 Regular (Renters) 5,586 48.1 25 195,387 41.6 37 Targeting Refund 152 1.3 1 1,902 0.4 0
Total Property Tax Refunds 11,620 100.0 52 469,597 100.0 88 Total Aids/Credits $565,244 100.0% $2,539 $13,164,561 100.0% $2,469
II. Property Tax Data A. Property Tax Levy (Payable 2011) County Levy $125,382 43.0% $563 $2,482,289 29.7% $466 City/Town Levy 61,144 21.0 275 1,915,713 22.9 359 School District Net Tax Capacity Levy 45,465 15.6 204 1,293,852 15.5 243 School District Referendum Market Value Levy 21,459 7.4 96 759,580 9.1 142 Miscellaneous District Levy 11,653 4.0 52 1,110,516 13.3 208 State Property Tax Levy 26,204 9.0 118 796,623 9.5 149
Total Levy $291,306 100.0% 1,308 $8,358,573 100.0% 1,568 Less Property Tax Credits 17,333 78 204,854 38
Net Property Taxes Payable 273,973 1,231 8,153,718 1,529 B. Property Valuation (2010 Assessment) Market Valuation $29,549,372 $132,717 $560,005,009 $105,022 Referendum Market Valuation 14,818,807 $66,557 446,868,189 83,805 Net Tax Capacity (NTC) 291,793 1,311 6,245,082 1,171 C. Average Local NTC Tax Rate 83.412 108.350 Avg. Referendum Mkt. Value Tax Rate 0.147 0.178
III. Major State Taxes Individual Income Tax (2010 filed 2011) $189,085 40.8% $849 $6,530,689 46.5% $1,225 Sales/Use Tax (Calendar 2011) 135,705 29.3 610 3,975,605 28.3 746 Motor Vehicle Sales Tax (Calendar 2011) 23,591 5.1 106 538,490 3.8 101 Motor Vehicle Registration Tax (Calendar 2011) 24,290 5.2 109 574,395 4.1 108 Motor Fuels Tax (Calendar 2011) 46,047 9.9 207 846,661 6.0 159 Corporate Income Tax (Calendar 2011) 18,426 4.0 83 782,453 5.6 147 State General Property Tax (Payable 2011) 26,204 5.7 118 796,623 5.7 149
Total State Taxes $463,348 100.0% $2,081 $14,044,914 100.0% $2,634

House Research Department May 2015Table 3 Page 120
FIVE (5) STATEAmount Amount
I. Major State Aids/Credits (000s) Percent Per Capita (000s) Percent Per Capita
A. Aids to Local Governments Education Aid (2010-2011) $207,312 51.2% $1,273 $6,728,024 53.9% $1,262 Human Services Aid (Calendar 2011) Medical Assistance 104,535 25.8 642 2,827,887 22.6 530 Minnesota Family Investment Program 1,771 0.4 11 76,772 0.6 14 General Assistance including GAMC 553 0.1 3 41,221 0.3 8 Social Services 40,255 9.9 247 1,316,027 10.5 247 Miscellaneous 4,253 1.1 26 159,666 1.3 30
Total 151,366 37.4 929 4,421,574 35.4 829 Highway Aid (Calendar 2011) County Aid 21,438 5.3 132 470,326 3.8 88 Municipal Aid 2,314 0.6 14 147,719 1.2 28 Township Aid 2,050 0.5 13 34,508 0.3 6
Total 25,802 6.4 158 652,552 5.2 122 Local Government Aid (Calendar 2011) 12,927 3.2 79 425,345 3.4 80 Disparity Reduction Aid (Calendar 2011) 340 0.1 2 18,213 0.1 3 County Program Aid (Payable 2011) 4,287 1.1 26 161,106 1.3 30 Community Corrections Funding (2011) 2,814 0.7 17 83,296 0.7 16
Total Aids 404,848 100.0 2,485 12,490,110 100.0 2,342 B. Property Tax Credits (Payable 2011) Homestead Market Value Credit 7,120 67.5 44 156,513 76.4 29 Agricultural Market Value Credit 2,059 19.5 13 23,413 11.4 4 Miscellaneous Credits 1,369 13.0 8 24,929 12.2 5
Total Property Tax Credits 10,548 100.0 65 204,854 100.0 38 C. Property Tax Refunds (10 filed 11) Regular (Homeowners) 5,330 56.4 33 272,309 58.0 51 Regular (Renters) 4,073 43.1 25 195,387 41.6 37 Targeting Refund 51 0.5 0 1,902 0.4 0
Total Property Tax Refunds 9,454 100.0 58 469,597 100.0 88 Total Aids/Credits $424,849 100.0% $2,608 $13,164,561 100.0% $2,469
II. Property Tax Data A. Property Tax Levy (Payable 2011) County Levy $91,407 40.5% $561 $2,482,289 29.7% $466 City/Town Levy 53,738 23.8 330 1,915,713 22.9 359 School District Net Tax Capacity Levy 36,397 16.1 223 1,293,852 15.5 243 School District Referendum Market Value Levy 10,799 4.8 66 759,580 9.1 142 Miscellaneous District Levy 4,741 2.1 29 1,110,516 13.3 208 State Property Tax Levy 28,739 12.7 176 796,623 9.5 149
Total Levy $225,821 100.0% 1,386 $8,358,573 100.0% 1,568 Less Property Tax Credits 10,548 65 204,854 38
Net Property Taxes Payable 215,273 1,322 8,153,718 1,529 B. Property Valuation (2010 Assessment) Market Valuation $24,519,714 $150,534 $560,005,009 $105,022 Referendum Market Valuation 12,503,439 $76,762 446,868,189 83,805 Net Tax Capacity (NTC) 253,583 1,557 6,245,082 1,171 C. Average Local NTC Tax Rate 73.449 108.350 Avg. Referendum Mkt. Value Tax Rate 0.087 0.178
III. Major State Taxes Individual Income Tax (2010 filed 2011) $109,722 35.2% $674 $6,530,689 46.5% $1,225 Sales/Use Tax (Calendar 2011) 94,576 30.4 581 3,975,605 28.3 746 Motor Vehicle Sales Tax (Calendar 2011) 17,343 5.6 106 538,490 3.8 101 Motor Vehicle Registration Tax (Calendar 2011) 17,046 5.5 105 574,395 4.1 108 Motor Fuels Tax (Calendar 2011) 32,769 10.5 201 846,661 6.0 159 Corporate Income Tax (Calendar 2011) 11,222 3.6 69 782,453 5.6 147 State General Property Tax (Payable 2011) 28,739 9.2 176 796,623 5.7 149
Total State Taxes $311,418 100.0% $1,912 $14,044,914 100.0% $2,634

House Research Department May 2015Table 3 Page 121
SIX EAST (6E) STATEAmount Amount
I. Major State Aids/Credits (000s) Percent Per Capita (000s) Percent Per Capita
A. Aids to Local Governments Education Aid (2010-2011) $145,180 51.9% $1,237 $6,728,024 53.9% $1,262 Human Services Aid (Calendar 2011) Medical Assistance 60,967 21.8 519 2,827,887 22.6 530 Minnesota Family Investment Program 1,113 0.4 9 76,772 0.6 14 General Assistance including GAMC 460 0.2 4 41,221 0.3 8 Social Services 27,604 9.9 235 1,316,027 10.5 247 Miscellaneous 2,139 0.8 18 159,666 1.3 30
Total 92,283 33.0 786 4,421,574 35.4 829 Highway Aid (Calendar 2011) County Aid 17,169 6.1 146 470,326 3.8 88 Municipal Aid 1,950 0.7 17 147,719 1.2 28 Township Aid 1,743 0.6 15 34,508 0.3 6
Total 20,861 7.5 178 652,552 5.2 122 Local Government Aid (Calendar 2011) 15,207 5.4 130 425,345 3.4 80 Disparity Reduction Aid (Calendar 2011) 365 0.1 3 18,213 0.1 3 County Program Aid (Payable 2011) 4,076 1.5 35 161,106 1.3 30 Community Corrections Funding (2011) 2,016 0.7 17 83,296 0.7 16
Total Aids 279,988 100.0 2,385 12,490,110 100.0 2,342 B. Property Tax Credits (Payable 2011) Homestead Market Value Credit 5,033 79.1 43 156,513 76.4 29 Agricultural Market Value Credit 1,321 20.8 11 23,413 11.4 4 Miscellaneous Credits 7 0.1 0 24,929 12.2 5
Total Property Tax Credits 6,361 100.0 54 204,854 100.0 38 C. Property Tax Refunds (10 filed 11) Regular (Homeowners) 4,706 58.1 40 272,309 58.0 51 Regular (Renters) 3,373 41.6 29 195,387 41.6 37 Targeting Refund 25 0.3 0 1,902 0.4 0
Total Property Tax Refunds 8,103 100.0 69 469,597 100.0 88 Total Aids/Credits $294,452 100.0% $2,508 $13,164,561 100.0% $2,469
II. Property Tax Data A. Property Tax Levy (Payable 2011) County Levy $69,460 44.6% $592 $2,482,289 29.7% $466 City/Town Levy 37,348 24.0 318 1,915,713 22.9 359 School District Net Tax Capacity Levy 20,361 13.1 173 1,293,852 15.5 243 School District Referendum Market Value Levy 14,026 9.0 119 759,580 9.1 142 Miscellaneous District Levy 3,374 2.2 29 1,110,516 13.3 208 State Property Tax Levy 11,132 7.1 95 796,623 9.5 149
Total Levy $155,701 100.0% 1,326 $8,358,573 100.0% 1,568 Less Property Tax Credits 6,361 54 204,854 38
Net Property Taxes Payable 149,340 1,272 8,153,718 1,529 B. Property Valuation (2010 Assessment) Market Valuation $14,328,130 $122,057 $560,005,009 $105,022 Referendum Market Valuation 7,393,935 $62,987 446,868,189 83,805 Net Tax Capacity (NTC) 137,435 1,171 6,245,082 1,171 C. Average Local NTC Tax Rate 94.985 108.350 Avg. Referendum Mkt. Value Tax Rate 0.190 0.178
III. Major State Taxes Individual Income Tax (2010 filed 2011) $104,120 42.6% $887 $6,530,689 46.5% $1,225 Sales/Use Tax (Calendar 2011) 69,557 28.5 593 3,975,605 28.3 746 Motor Vehicle Sales Tax (Calendar 2011) 12,857 5.3 110 538,490 3.8 101 Motor Vehicle Registration Tax (Calendar 2011) 13,190 5.4 112 574,395 4.1 108 Motor Fuels Tax (Calendar 2011) 19,990 8.2 170 846,661 6.0 159 Corporate Income Tax (Calendar 2011) 13,564 5.5 116 782,453 5.6 147 State General Property Tax (Payable 2011) 11,132 4.6 95 796,623 5.7 149
Total State Taxes $244,410 100.0% $2,082 $14,044,914 100.0% $2,634

House Research Department May 2015Table 3 Page 122
MN VALLEY (6W) STATEAmount Amount
I. Major State Aids/Credits (000s) Percent Per Capita (000s) Percent Per Capita
A. Aids to Local Governments Education Aid (2010-2011) $60,329 44.7% $1,347 $6,728,024 53.9% $1,262 Human Services Aid (Calendar 2011) Medical Assistance 31,142 23.1 696 2,827,887 22.6 530 Minnesota Family Investment Program 344 0.3 8 76,772 0.6 14 General Assistance including GAMC 114 0.1 3 41,221 0.3 8 Social Services 13,396 9.9 299 1,316,027 10.5 247 Miscellaneous 934 0.7 21 159,666 1.3 30
Total 45,930 34.1 1,026 4,421,574 35.4 829 Highway Aid (Calendar 2011) County Aid 14,032 10.4 313 470,326 3.8 88 Municipal Aid 220 0.2 5 147,719 1.2 28 Township Aid 2,590 1.9 58 34,508 0.3 6
Total 16,843 12.5 376 652,552 5.2 122 Local Government Aid (Calendar 2011) 8,863 6.6 198 425,345 3.4 80 Disparity Reduction Aid (Calendar 2011) 591 0.4 13 18,213 0.1 3 County Program Aid (Payable 2011) 1,532 1.1 34 161,106 1.3 30 Community Corrections Funding (2011) 779 0.6 17 83,296 0.7 16
Total Aids 134,866 100.0 3,012 12,490,110 100.0 2,342 B. Property Tax Credits (Payable 2011) Homestead Market Value Credit 2,018 68.3 45 156,513 76.4 29 Agricultural Market Value Credit 937 31.7 21 23,413 11.4 4 Miscellaneous Credits 0 0.0 0 24,929 12.2 5
Total Property Tax Credits 2,955 100.0 66 204,854 100.0 38 C. Property Tax Refunds (10 filed 11) Regular (Homeowners) 695 45.2 16 272,309 58.0 51 Regular (Renters) 832 54.1 19 195,387 41.6 37 Targeting Refund 10 0.7 0 1,902 0.4 0
Total Property Tax Refunds 1,538 100.0 34 469,597 100.0 88 Total Aids/Credits $139,358 100.0% $3,112 $13,164,561 100.0% $2,469
II. Property Tax Data A. Property Tax Levy (Payable 2011) County Levy $31,180 47.0% $696 $2,482,289 29.7% $466 City/Town Levy 16,143 24.3 361 1,915,713 22.9 359 School District Net Tax Capacity Levy 9,404 14.2 210 1,293,852 15.5 243 School District Referendum Market Value Levy 4,354 6.6 97 759,580 9.1 142 Miscellaneous District Levy 1,602 2.4 36 1,110,516 13.3 208 State Property Tax Levy 3,693 5.6 82 796,623 9.5 149
Total Levy $66,376 100.0% 1,482 $8,358,573 100.0% 1,568 Less Property Tax Credits 2,955 66 204,854 38
Net Property Taxes Payable 63,421 1,416 8,153,718 1,529 B. Property Valuation (2010 Assessment) Market Valuation $7,961,031 $177,801 $560,005,009 $105,022 Referendum Market Valuation 1,868,601 $41,733 446,868,189 83,805 Net Tax Capacity (NTC) 68,360 1,527 6,245,082 1,171 C. Average Local NTC Tax Rate 84.903 108.350 Avg. Referendum Mkt. Value Tax Rate 0.248 0.178
III. Major State Taxes Individual Income Tax (2010 filed 2011) $41,333 43.7% $923 $6,530,689 46.5% $1,225 Sales/Use Tax (Calendar 2011) 20,291 21.4 453 3,975,605 28.3 746 Motor Vehicle Sales Tax (Calendar 2011) 5,521 5.8 123 538,490 3.8 101 Motor Vehicle Registration Tax (Calendar 2011) 5,836 6.2 130 574,395 4.1 108 Motor Fuels Tax (Calendar 2011) 8,971 9.5 200 846,661 6.0 159 Corporate Income Tax (Calendar 2011) 8,999 9.5 201 782,453 5.6 147 State General Property Tax (Payable 2011) 3,693 3.9 82 796,623 5.7 149
Total State Taxes $94,643 100.0% $2,114 $14,044,914 100.0% $2,634

House Research Department May 2015Table 3 Page 123
E CENTRAL (7E) STATEAmount Amount
I. Major State Aids/Credits (000s) Percent Per Capita (000s) Percent Per Capita
A. Aids to Local Governments Education Aid (2010-2011) $193,245 54.3% $1,179 $6,728,024 53.9% $1,262 Human Services Aid (Calendar 2011) Medical Assistance 80,899 22.7 493 2,827,887 22.6 530 Minnesota Family Investment Program 1,411 0.4 9 76,772 0.6 14 General Assistance including GAMC 680 0.2 4 41,221 0.3 8 Social Services 35,764 10.0 218 1,316,027 10.5 247 Miscellaneous 2,654 0.7 16 159,666 1.3 30
Total 121,407 34.1 740 4,421,574 35.4 829 Highway Aid (Calendar 2011) County Aid 21,435 6.0 131 470,326 3.8 88 Municipal Aid 2,086 0.6 13 147,719 1.2 28 Township Aid 1,284 0.4 8 34,508 0.3 6
Total 24,806 7.0 151 652,552 5.2 122 Local Government Aid (Calendar 2011) 6,762 1.9 41 425,345 3.4 80 Disparity Reduction Aid (Calendar 2011) 146 0.0 1 18,213 0.1 3 County Program Aid (Payable 2011) 6,300 1.8 38 161,106 1.3 30 Community Corrections Funding (2011) 3,310 0.9 20 83,296 0.7 16
Total Aids 355,976 100.0 2,171 12,490,110 100.0 2,342 B. Property Tax Credits (Payable 2011) Homestead Market Value Credit 7,098 78.4 43 156,513 76.4 29 Agricultural Market Value Credit 1,935 21.4 12 23,413 11.4 4 Miscellaneous Credits 17 0.2 0 24,929 12.2 5
Total Property Tax Credits 9,050 100.0 55 204,854 100.0 38 C. Property Tax Refunds (10 filed 11) Regular (Homeowners) 8,515 69.2 52 272,309 58.0 51 Regular (Renters) 3,773 30.6 23 195,387 41.6 37 Targeting Refund 24 0.2 0 1,902 0.4 0
Total Property Tax Refunds 12,313 100.0 75 469,597 100.0 88 Total Aids/Credits $377,339 100.0% $2,301 $13,164,561 100.0% $2,469
II. Property Tax Data A. Property Tax Levy (Payable 2011) County Levy $86,786 45.3% $529 $2,482,289 29.7% $466 City/Town Levy 43,182 22.5 263 1,915,713 22.9 359 School District Net Tax Capacity Levy 37,069 19.3 226 1,293,852 15.5 243 School District Referendum Market Value Levy 8,384 4.4 51 759,580 9.1 142 Miscellaneous District Levy 4,387 2.3 27 1,110,516 13.3 208 State Property Tax Levy 11,984 6.2 73 796,623 9.5 149
Total Levy $191,792 100.0% 1,170 $8,358,573 100.0% 1,568 Less Property Tax Credits 9,050 55 204,854 38
Net Property Taxes Payable 182,742 1,115 8,153,718 1,529 B. Property Valuation (2010 Assessment) Market Valuation $14,299,020 $87,211 $560,005,009 $105,022 Referendum Market Valuation 10,566,456 $64,446 446,868,189 83,805 Net Tax Capacity (NTC) 146,328 892 6,245,082 1,171 C. Average Local NTC Tax Rate 116.930 108.350 Avg. Referendum Mkt. Value Tax Rate 0.082 0.178
III. Major State Taxes Individual Income Tax (2010 filed 2011) $121,766 45.3% $743 $6,530,689 46.5% $1,225 Sales/Use Tax (Calendar 2011) 59,309 22.1 362 3,975,605 28.3 746 Motor Vehicle Sales Tax (Calendar 2011) 17,056 6.3 104 538,490 3.8 101 Motor Vehicle Registration Tax (Calendar 2011) 16,548 6.2 101 574,395 4.1 108 Motor Fuels Tax (Calendar 2011) 34,874 13.0 213 846,661 6.0 159 Corporate Income Tax (Calendar 2011) 7,110 2.6 43 782,453 5.6 147 State General Property Tax (Payable 2011) 11,984 4.5 73 796,623 5.7 149
Total State Taxes $268,647 100.0% $1,639 $14,044,914 100.0% $2,634

House Research Department May 2015Table 3 Page 124
CENTRAL MN (7W) STATEAmount Amount
I. Major State Aids/Credits (000s) Percent Per Capita (000s) Percent Per Capita
A. Aids to Local Governments Education Aid (2010-2011) $510,613 62.2% $1,262 $6,728,024 53.9% $1,262 Human Services Aid (Calendar 2011) Medical Assistance 148,838 18.1 368 2,827,887 22.6 530 Minnesota Family Investment Program 3,672 0.4 9 76,772 0.6 14 General Assistance including GAMC 1,414 0.2 3 41,221 0.3 8 Social Services 70,312 8.6 174 1,316,027 10.5 247 Miscellaneous 8,033 1.0 20 159,666 1.3 30
Total 232,269 28.3 574 4,421,574 35.4 829 Highway Aid (Calendar 2011) County Aid 27,533 3.4 68 470,326 3.8 88 Municipal Aid 8,722 1.1 22 147,719 1.2 28 Township Aid 1,509 0.2 4 34,508 0.3 6
Total 37,764 4.6 93 652,552 5.2 122 Local Government Aid (Calendar 2011) 20,791 2.5 51 425,345 3.4 80 Disparity Reduction Aid (Calendar 2011) 158 0.0 0 18,213 0.1 3 County Program Aid (Payable 2011) 14,135 1.7 35 161,106 1.3 30 Community Corrections Funding (2011) 5,444 0.7 13 83,296 0.7 16
Total Aids 821,174 100.0 2,030 12,490,110 100.0 2,342 B. Property Tax Credits (Payable 2011) Homestead Market Value Credit 13,573 86.4 34 156,513 76.4 29 Agricultural Market Value Credit 2,095 13.3 5 23,413 11.4 4 Miscellaneous Credits 36 0.2 0 24,929 12.2 5
Total Property Tax Credits 15,705 100.0 39 204,854 100.0 38 C. Property Tax Refunds (10 filed 11) Regular (Homeowners) 18,757 61.0 46 272,309 58.0 51 Regular (Renters) 11,897 38.7 29 195,387 41.6 37 Targeting Refund 72 0.2 0 1,902 0.4 0
Total Property Tax Refunds 30,726 100.0 76 469,597 100.0 88 Total Aids/Credits $867,604 100.0% $2,145 $13,164,561 100.0% $2,469
II. Property Tax Data A. Property Tax Levy (Payable 2011) County Levy $181,219 34.2% $448 $2,482,289 29.7% $466 City/Town Levy 130,454 24.6 322 1,915,713 22.9 359 School District Net Tax Capacity Levy 109,969 20.7 272 1,293,852 15.5 243 School District Referendum Market Value Levy 40,756 7.7 101 759,580 9.1 142 Miscellaneous District Levy 19,171 3.6 47 1,110,516 13.3 208 State Property Tax Levy 48,679 9.2 120 796,623 9.5 149
Total Levy $530,248 100.0% 1,311 $8,358,573 100.0% 1,568 Less Property Tax Credits 15,705 39 204,854 38
Net Property Taxes Payable 514,544 1,272 8,153,718 1,529 B. Property Valuation (2010 Assessment) Market Valuation $34,860,261 $86,172 $560,005,009 $105,022 Referendum Market Valuation 29,506,186 $72,937 446,868,189 83,805 Net Tax Capacity (NTC) 390,822 966 6,245,082 1,171 C. Average Local NTC Tax Rate 111.892 108.350 Avg. Referendum Mkt. Value Tax Rate 0.150 0.178
III. Major State Taxes Individual Income Tax (2010 filed 2011) $380,546 44.5% $941 $6,530,689 46.5% $1,225 Sales/Use Tax (Calendar 2011) 235,872 27.6 583 3,975,605 28.3 746 Motor Vehicle Sales Tax (Calendar 2011) 40,809 4.8 101 538,490 3.8 101 Motor Vehicle Registration Tax (Calendar 2011) 42,682 5.0 106 574,395 4.1 108 Motor Fuels Tax (Calendar 2011) 70,153 8.2 173 846,661 6.0 159 Corporate Income Tax (Calendar 2011) 35,636 4.2 88 782,453 5.6 147 State General Property Tax (Payable 2011) 48,679 5.7 120 796,623 5.7 149
Total State Taxes $854,377 100.0% $2,112 $14,044,914 100.0% $2,634

House Research Department May 2015Table 3 Page 125
SOUTHWEST (8) STATEAmount Amount
I. Major State Aids/Credits (000s) Percent Per Capita (000s) Percent Per Capita
A. Aids to Local Governments Education Aid (2010-2011) $157,480 48.6% $1,325 $6,728,024 53.9% $1,262 Human Services Aid (Calendar 2011) Medical Assistance 65,799 20.3 554 2,827,887 22.6 530 Minnesota Family Investment Program 973 0.3 8 76,772 0.6 14 General Assistance including GAMC 384 0.1 3 41,221 0.3 8 Social Services 32,134 9.9 270 1,316,027 10.5 247 Miscellaneous 2,563 0.8 22 159,666 1.3 30
Total 101,853 31.4 857 4,421,574 35.4 829 Highway Aid (Calendar 2011) County Aid 30,398 9.4 256 470,326 3.8 88 Municipal Aid 1,296 0.4 11 147,719 1.2 28 Township Aid 5,076 1.6 43 34,508 0.3 6
Total 36,770 11.3 309 652,552 5.2 122 Local Government Aid (Calendar 2011) 21,341 6.6 180 425,345 3.4 80 Disparity Reduction Aid (Calendar 2011) 836 0.3 7 18,213 0.1 3 County Program Aid (Payable 2011) 3,635 1.1 31 161,106 1.3 30 Community Corrections Funding (2011) 2,210 0.7 19 83,296 0.7 16
Total Aids 324,126 100.0 2,728 12,490,110 100.0 2,342 B. Property Tax Credits (Payable 2011) Homestead Market Value Credit 5,161 71.6 43 156,513 76.4 29 Agricultural Market Value Credit 2,043 28.4 17 23,413 11.4 4 Miscellaneous Credits 0 0.0 0 24,929 12.2 5
Total Property Tax Credits 7,204 100.0 61 204,854 100.0 38 C. Property Tax Refunds (10 filed 11) Regular (Homeowners) 2,061 46.3 17 272,309 58.0 51 Regular (Renters) 2,359 52.9 20 195,387 41.6 37 Targeting Refund 35 0.8 0 1,902 0.4 0
Total Property Tax Refunds 4,455 100.0 37 469,597 100.0 88 Total Aids/Credits $335,785 100.0% $2,826 $13,164,561 100.0% $2,469
II. Property Tax Data A. Property Tax Levy (Payable 2011) County Levy $65,741 42.0% $553 $2,482,289 29.7% $466 City/Town Levy 36,431 23.3 307 1,915,713 22.9 359 School District Net Tax Capacity Levy 25,013 16.0 211 1,293,852 15.5 243 School District Referendum Market Value Levy 14,560 9.3 123 759,580 9.1 142 Miscellaneous District Levy 4,024 2.6 34 1,110,516 13.3 208 State Property Tax Levy 10,785 6.9 91 796,623 9.5 149
Total Levy $156,554 100.0% 1,318 $8,358,573 100.0% 1,568 Less Property Tax Credits 7,204 61 204,854 38
Net Property Taxes Payable 149,349 1,257 8,153,718 1,529 B. Property Valuation (2010 Assessment) Market Valuation $18,577,330 $156,355 $560,005,009 $105,022 Referendum Market Valuation 5,294,357 $44,560 446,868,189 83,805 Net Tax Capacity (NTC) 165,456 1,393 6,245,082 1,171 C. Average Local NTC Tax Rate 79.154 108.350 Avg. Referendum Mkt. Value Tax Rate 0.280 0.178
III. Major State Taxes Individual Income Tax (2010 filed 2011) $100,709 38.8% $848 $6,530,689 46.5% $1,225 Sales/Use Tax (Calendar 2011) 73,110 28.1 615 3,975,605 28.3 746 Motor Vehicle Sales Tax (Calendar 2011) 13,755 5.3 116 538,490 3.8 101 Motor Vehicle Registration Tax (Calendar 2011) 14,471 5.6 122 574,395 4.1 108 Motor Fuels Tax (Calendar 2011) 25,036 9.6 211 846,661 6.0 159 Corporate Income Tax (Calendar 2011) 22,019 8.5 185 782,453 5.6 147 State General Property Tax (Payable 2011) 10,785 4.1 91 796,623 5.7 149
Total State Taxes $259,885 100.0% $2,187 $14,044,914 100.0% $2,634

House Research Department May 2015Table 3 Page 126
NINE (9) STATEAmount Amount
I. Major State Aids/Credits (000s) Percent Per Capita (000s) Percent Per Capita
A. Aids to Local Governments Education Aid (2010-2011) $248,843 48.0% $1,075 $6,728,024 53.9% $1,262 Human Services Aid (Calendar 2011) Medical Assistance 104,319 20.1 451 2,827,887 22.6 530 Minnesota Family Investment Program 1,906 0.4 8 76,772 0.6 14 General Assistance including GAMC 931 0.2 4 41,221 0.3 8 Social Services 58,584 11.3 253 1,316,027 10.5 247 Miscellaneous 4,769 0.9 21 159,666 1.3 30
Total 170,509 32.9 736 4,421,574 35.4 829 Highway Aid (Calendar 2011) County Aid 38,316 7.4 165 470,326 3.8 88 Municipal Aid 4,145 0.8 18 147,719 1.2 28 Township Aid 3,221 0.6 14 34,508 0.3 6
Total 45,682 8.8 197 652,552 5.2 122 Local Government Aid (Calendar 2011) 39,375 7.6 170 425,345 3.4 80 Disparity Reduction Aid (Calendar 2011) 844 0.2 4 18,213 0.1 3 County Program Aid (Payable 2011) 8,780 1.7 38 161,106 1.3 30 Community Corrections Funding (2011) 4,059 0.8 18 83,296 0.7 16
Total Aids 518,092 100.0 2,238 12,490,110 100.0 2,342 B. Property Tax Credits (Payable 2011) Homestead Market Value Credit 9,131 77.4 39 156,513 76.4 29 Agricultural Market Value Credit 2,290 19.4 10 23,413 11.4 4 Miscellaneous Credits 373 3.2 2 24,929 12.2 5
Total Property Tax Credits 11,793 100.0 51 204,854 100.0 38 C. Property Tax Refunds (10 filed 11) Regular (Homeowners) 6,177 50.4 27 272,309 58.0 51 Regular (Renters) 6,046 49.3 26 195,387 41.6 37 Targeting Refund 35 0.3 0 1,902 0.4 0
Total Property Tax Refunds 12,258 100.0 53 469,597 100.0 88 Total Aids/Credits $542,143 100.0% $2,342 $13,164,561 100.0% $2,469
II. Property Tax Data A. Property Tax Levy (Payable 2011) County Levy $115,239 41.1% $498 $2,482,289 29.7% $466 City/Town Levy 73,444 26.2 317 1,915,713 22.9 359 School District Net Tax Capacity Levy 42,182 15.0 182 1,293,852 15.5 243 School District Referendum Market Value Levy 22,231 7.9 96 759,580 9.1 142 Miscellaneous District Levy 4,887 1.7 21 1,110,516 13.3 208 State Property Tax Levy 22,474 8.0 97 796,623 9.5 149
Total Levy $280,458 100.0% 1,211 $8,358,573 100.0% 1,568 Less Property Tax Credits 11,793 51 204,854 38
Net Property Taxes Payable 268,664 1,160 8,153,718 1,529 B. Property Valuation (2010 Assessment) Market Valuation $26,855,259 $115,995 $560,005,009 $105,022 Referendum Market Valuation 13,813,769 $59,665 446,868,189 83,805 Net Tax Capacity (NTC) 258,371 1,116 6,245,082 1,171 C. Average Local NTC Tax Rate 91.127 108.350 Avg. Referendum Mkt. Value Tax Rate 0.163 0.178
III. Major State Taxes Individual Income Tax (2010 filed 2011) $200,843 41.3% $867 $6,530,689 46.5% $1,225 Sales/Use Tax (Calendar 2011) 134,165 27.6 579 3,975,605 28.3 746 Motor Vehicle Sales Tax (Calendar 2011) 24,549 5.1 106 538,490 3.8 101 Motor Vehicle Registration Tax (Calendar 2011) 25,520 5.2 110 574,395 4.1 108 Motor Fuels Tax (Calendar 2011) 39,161 8.1 169 846,661 6.0 159 Corporate Income Tax (Calendar 2011) 39,398 8.1 170 782,453 5.6 147 State General Property Tax (Payable 2011) 22,474 4.6 97 796,623 5.7 149
Total State Taxes $486,111 100.0% $2,100 $14,044,914 100.0% $2,634

House Research Department May 2015Table 3 Page 127
SE MN (10) STATEAmount Amount
I. Major State Aids/Credits (000s) Percent Per Capita (000s) Percent Per Capita
A. Aids to Local Governments Education Aid (2010-2011) $588,819 53.8% $1,187 $6,728,024 53.9% $1,262 Human Services Aid (Calendar 2011) Medical Assistance 207,401 19.0 418 2,827,887 22.6 530 Minnesota Family Investment Program 4,514 0.4 9 76,772 0.6 14 General Assistance including GAMC 1,496 0.1 3 41,221 0.3 8 Social Services 122,198 11.2 246 1,316,027 10.5 247 Miscellaneous 10,022 0.9 20 159,666 1.3 30
Total 345,632 31.6 696 4,421,574 35.4 829 Highway Aid (Calendar 2011) County Aid 54,728 5.0 110 470,326 3.8 88 Municipal Aid 14,286 1.3 29 147,719 1.2 28 Township Aid 4,451 0.4 9 34,508 0.3 6
Total 73,465 6.7 148 652,552 5.2 122 Local Government Aid (Calendar 2011) 56,586 5.2 114 425,345 3.4 80 Disparity Reduction Aid (Calendar 2011) 1,731 0.2 3 18,213 0.1 3 County Program Aid (Payable 2011) 20,252 1.9 41 161,106 1.3 30 Community Corrections Funding (2011) 7,331 0.7 15 83,296 0.7 16
Total Aids 1,093,817 100.0 2,204 12,490,110 100.0 2,342 B. Property Tax Credits (Payable 2011) Homestead Market Value Credit 19,217 82.8 39 156,513 76.4 29 Agricultural Market Value Credit 3,684 15.9 7 23,413 11.4 4 Miscellaneous Credits 305 1.3 1 24,929 12.2 5
Total Property Tax Credits 23,206 100.0 47 204,854 100.0 38 C. Property Tax Refunds (10 filed 11) Regular (Homeowners) 16,657 54.2 34 272,309 58.0 51 Regular (Renters) 13,961 45.4 28 195,387 41.6 37 Targeting Refund 106 0.3 0 1,902 0.4 0
Total Property Tax Refunds 30,724 100.0 62 469,597 100.0 88 Total Aids/Credits $1,147,747 100.0% $2,313 $13,164,561 100.0% $2,469
II. Property Tax Data A. Property Tax Levy (Payable 2011) County Levy $235,377 37.2% $474 $2,482,289 29.7% $466 City/Town Levy 167,992 26.6 339 1,915,713 22.9 359 School District Net Tax Capacity Levy 106,634 16.9 215 1,293,852 15.5 243 School District Referendum Market Value Levy 57,063 9.0 115 759,580 9.1 142 Miscellaneous District Levy 13,351 2.1 27 1,110,516 13.3 208 State Property Tax Levy 51,866 8.2 105 796,623 9.5 149
Total Levy $632,283 100.0% 1,274 $8,358,573 100.0% 1,568 Less Property Tax Credits 23,206 47 204,854 38
Net Property Taxes Payable 609,077 1,227 8,153,718 1,529 B. Property Valuation (2010 Assessment) Market Valuation $47,986,143 $96,697 $560,005,009 $105,022 Referendum Market Valuation 34,200,429 $68,917 446,868,189 83,805 Net Tax Capacity (NTC) 497,791 1,003 6,245,082 1,171 C. Average Local NTC Tax Rate 105.046 108.350 Avg. Referendum Mkt. Value Tax Rate 0.168 0.178
III. Major State Taxes Individual Income Tax (2010 filed 2011) $522,162 47.8% $1,052 $6,530,689 46.5% $1,225 Sales/Use Tax (Calendar 2011) 281,645 25.8 568 3,975,605 28.3 746 Motor Vehicle Sales Tax (Calendar 2011) 50,608 4.6 102 538,490 3.8 101 Motor Vehicle Registration Tax (Calendar 2011) 52,526 4.8 106 574,395 4.1 108 Motor Fuels Tax (Calendar 2011) 84,838 7.8 171 846,661 6.0 159 Corporate Income Tax (Calendar 2011) 48,594 4.4 98 782,453 5.6 147 State General Property Tax (Payable 2011) 51,866 4.7 105 796,623 5.7 149
Total State Taxes $1,092,240 100.0% $2,201 $14,044,914 100.0% $2,634

House Research Department May 2015Table 3 Page 128
METRO (11) STATEAmount Amount
I. Major State Aids/Credits (000s) Percent Per Capita (000s) Percent Per Capita
A. Aids to Local Governments Education Aid (2010-2011) $3,756,329 56.5% $1,307 $6,728,024 53.9% $1,262 Human Services Aid (Calendar 2011) Medical Assistance 1,556,584 23.4 542 2,827,887 22.6 530 Minnesota Family Investment Program 50,160 0.8 17 76,772 0.6 14 General Assistance including GAMC 29,892 0.4 10 41,221 0.3 8 Social Services 705,546 10.6 246 1,316,027 10.5 247 Miscellaneous 102,029 1.5 36 159,666 1.3 30
Total 2,444,211 36.8 851 4,421,574 35.4 829 Highway Aid (Calendar 2011) County Aid 109,674 1.6 38 470,326 3.8 88 Municipal Aid 94,021 1.4 33 147,719 1.2 28 Township Aid 860 0.0 0 34,508 0.3 6
Total 204,555 3.1 71 652,552 5.2 122 Local Government Aid (Calendar 2011) 132,977 2.0 46 425,345 3.4 80 Disparity Reduction Aid (Calendar 2011) 1,428 0.0 0 18,213 0.1 3 County Program Aid (Payable 2011) 67,009 1.0 23 161,106 1.3 30 Community Corrections Funding (2011) 41,220 0.6 14 83,296 0.7 16
Total Aids 6,647,729 100.0 2,314 12,490,110 100.0 2,342 B. Property Tax Credits (Payable 2011) Homestead Market Value Credit 57,543 97.1 20 156,513 76.4 29 Agricultural Market Value Credit 1,103 1.9 0 23,413 11.4 4 Miscellaneous Credits 585 1.0 0 24,929 12.2 5
Total Property Tax Credits 59,231 100.0 21 204,854 100.0 38 C. Property Tax Refunds (10 filed 11) Regular (Homeowners) 191,751 59.2 67 272,309 58.0 51 Regular (Renters) 130,673 40.4 45 195,387 41.6 37 Targeting Refund 1,231 0.4 0 1,902 0.4 0
Total Property Tax Refunds 323,656 100.0 113 469,597 100.0 88 Total Aids/Credits $7,030,616 100.0% $2,447 $13,164,561 100.0% $2,469
II. Property Tax Data A. Property Tax Levy (Payable 2011) County Levy $1,217,348 23.3% $424 $2,482,289 29.7% $466 City/Town Levy 1,169,088 22.4 407 1,915,713 22.9 359 School District Net Tax Capacity Levy 767,794 14.7 267 1,293,852 15.5 243 School District Referendum Market Value Levy 536,331 10.3 187 759,580 9.1 142 Miscellaneous District Levy 1,011,935 19.4 352 1,110,516 13.3 208 State Property Tax Levy 520,586 10.0 181 796,623 9.5 149
Total Levy $5,223,082 100.0% 1,818 $8,358,573 100.0% 1,568 Less Property Tax Credits 59,231 21 204,854 38
Net Property Taxes Payable 5,163,851 1,797 8,153,718 1,529 B. Property Valuation (2010 Assessment) Market Valuation $290,961,355 $101,259 $560,005,009 $105,022 Referendum Market Valuation 286,252,860 $99,620 446,868,189 83,805 Net Tax Capacity (NTC) 3,502,971 1,219 6,245,082 1,171 C. Average Local NTC Tax Rate 118.074 108.350 Avg. Referendum Mkt. Value Tax Rate 0.198 0.178
III. Major State Taxes Individual Income Tax (2010 filed 2011) $4,363,770 48.7% $1,519 $6,530,689 46.5% $1,225 Sales/Use Tax (Calendar 2011) 2,550,450 28.5 888 3,975,605 28.3 746 Motor Vehicle Sales Tax (Calendar 2011) 281,379 3.1 98 538,490 3.8 101 Motor Vehicle Registration Tax (Calendar 2011) 310,203 3.5 108 574,395 4.1 108 Motor Fuels Tax (Calendar 2011) 397,331 4.4 138 846,661 6.0 159 Corporate Income Tax (Calendar 2011) 537,243 6.0 187 782,453 5.6 147 State General Property Tax (Payable 2011) 520,586 5.8 181 796,623 5.7 149
Total State Taxes $8,960,962 100.0% $3,119 $14,044,914 100.0% $2,634
House Research Department May 2015 Major State Aids and Taxes Page 129
4. County Data This section compares data from each county with statewide data and data from the economic development regions in which the county is located. The counties are listed in alphabetical order. There is a separate table for each county.
Statewide per capita amounts exclude income and sales tax paid by nonresidents of Minnesota.
A table containing the 2011 estimated population, which was used for each county in determining the county and region per capita amounts, is on page 6. 2011 population is used to calculate per capita amounts throughout this report, even if 2010 is the most recent year for which data for a particular aid or tax is available.

House Research Department May 2015Table 4 Page 130
AITKIN ARROWHEAD (3) STATEAmount
I. Major State Aids/Credits (000s) Percent Per Capita Per Capita Per Capita
A. Aids to Local Governments Education Aid (2010-2011) $18,091 45.3% $1,117 $1,104 $1,262 Human Services Aid (Calendar 2011) Medical Assistance 11,354 28.4 701 653 530 Minnesota Family Investment Program 160 0.4 10 14 14 General Assistance including GAMC 100 0.3 6 10 8 Social Services 3,569 8.9 220 314 247 Miscellaneous 341 0.9 21 41 30
Total 15,524 38.9 958 1,032 829 Highway Aid (Calendar 2011) County Aid 4,455 11.2 275 160 88 Municipal Aid 0 0.0 0 33 28 Township Aid 359 0.9 22 5 6
Total 4,814 12.1 297 199 122 Local Government Aid (Calendar 2011) 897 2.2 55 198 80 Disparity Reduction Aid (Calendar 2011) 22 0.1 1 33 3 County Program Aid (Payable 2011) 311 0.8 19 42 30 Community Corrections Funding (2011) 279 0.7 17 21 16
Total Aids 39,939 100.0 2,465 2,630 2,342 B. Property Tax Credits (Payable 2011) Homestead Market Value Credit 814 42.2 50 42 29 Agricultural Market Value Credit 240 12.4 15 3 4 Miscellaneous Credits 875 45.3 54 48 5
Total Property Tax Credits 1,929 100.0 119 93 38 C. Property Tax Refunds (10 filed 11) Regular (Homeowners) 230 44.5 14 26 51 Regular (Renters) 285 55.2 18 29 37 Targeting Refund 2 0.3 0 0 0
Total Property Tax Refunds 516 100.0 32 56 88 Total Aids/Credits $42,384 100.0% $2,616 $2,778 $2,469
II. Property Tax Data A. Property Tax Levy (Payable 2011) County Levy $10,930 48.5% $675 $545 $466 City/Town Levy 5,023 22.3 310 269 359 School District Net Tax Capacity Levy 2,782 12.4 172 187 243 School District Referendum Market Value Levy 535 2.4 33 51 142 Miscellaneous District Levy 622 2.8 38 66 208 State Property Tax Levy 2,635 11.7 163 122 149
Total Levy $22,526 100.0% $1,390 $1,239 $1,568 Less Property Tax Credits 1,929 119 93 38
Net Property Taxes Payable 20,597 1,271 1,147 1,529 B. Property Valuation (2010 Assessment) Market Valuation $3,210,872 $198,178 $99,574 $105,022 Referendum Market Valuation 1,300,047 $80,240 67,723 83,805 Net Tax Capacity (NTC) 32,004 1,975 1,088 1,171 C. Average Local NTC Tax Rate 60.482 Avg. Referendum Mkt. Value Tax Rate 0.041
III. Major State Taxes Individual Income Tax (2010 filed 2011) $9,467 34.7% $584 $783 $1,225 Sales/Use Tax (Calendar 2011) 7,172 26.3 443 720 746 Motor Vehicle Sales Tax (Calendar 2011) 1,844 6.8 114 102 101 Motor Vehicle Registration Tax (Calendar 2011) 1,851 6.8 114 104 108 Motor Fuels Tax (Calendar 2011) 3,878 14.2 239 175 159 Corporate Income Tax (Calendar 2011) 459 1.7 28 79 147 State General Property Tax (Payable 2011) 2,635 9.6 163 122 149
Total State Taxes $27,306 100.0% $1,685 $2,085 $2,634

House Research Department May 2015Table 4 Page 131
ANOKA METRO (11) STATEAmount
I. Major State Aids/Credits (000s) Percent Per Capita Per Capita Per Capita
A. Aids to Local Governments Education Aid (2010-2011) $456,972 62.7% $1,368 $1,307 $1,262 Human Services Aid (Calendar 2011) Medical Assistance 143,590 19.7 430 542 530 Minnesota Family Investment Program 4,216 0.6 13 17 14 General Assistance including GAMC 1,497 0.2 4 10 8 Social Services 70,309 9.7 210 246 247 Miscellaneous 4,928 0.7 15 36 30
Total 224,540 30.8 672 851 829 Highway Aid (Calendar 2011) County Aid 15,022 2.1 45 38 88 Municipal Aid 10,314 1.4 31 33 28 Township Aid 26 0.0 0 0 6
Total 25,362 3.5 76 71 122 Local Government Aid (Calendar 2011) 3,107 0.4 9 46 80 Disparity Reduction Aid (Calendar 2011) 0 0.0 0 0 3 County Program Aid (Payable 2011) 13,560 1.9 41 23 30 Community Corrections Funding (2011) 4,848 0.7 15 14 16
Total Aids 728,390 100.0 2,180 2,314 2,342 B. Property Tax Credits (Payable 2011) Homestead Market Value Credit 9,253 98.9 28 20 29 Agricultural Market Value Credit 91 1.0 0 0 4 Miscellaneous Credits 8 0.1 0 0 5
Total Property Tax Credits 9,352 100.0 28 21 38 C. Property Tax Refunds (10 filed 11) Regular (Homeowners) 20,688 65.5 62 67 51 Regular (Renters) 10,852 34.4 32 45 37 Targeting Refund 26 0.1 0 0 0
Total Property Tax Refunds 31,565 100.0 94 113 88 Total Aids/Credits $769,307 100.0% $2,303 $2,447 $2,469
II. Property Tax Data A. Property Tax Levy (Payable 2011) County Levy $106,447 23.1% $319 $424 $466 City/Town Levy 103,729 22.5 311 407 359 School District Net Tax Capacity Levy 73,407 15.9 220 267 243 School District Referendum Market Value Levy 55,339 12.0 166 187 142 Miscellaneous District Levy 79,741 17.3 239 352 208 State Property Tax Levy 42,721 9.3 128 181 149
Total Levy $461,382 100.0% $1,381 $1,818 $1,568 Less Property Tax Credits 9,352 28 21 38
Net Property Taxes Payable 452,030 1,353 1,797 1,529 B. Property Valuation (2010 Assessment) Market Valuation $27,025,523 $80,902 $101,259 $105,022 Referendum Market Valuation 26,711,065 $79,961 99,620 83,805 Net Tax Capacity (NTC) 315,214 944 1,219 1,171 C. Average Local NTC Tax Rate 114.970 Avg. Referendum Mkt. Value Tax Rate 0.211
III. Major State Taxes Individual Income Tax (2010 filed 2011) $371,333 49.2% $1,112 $1,519 $1,225 Sales/Use Tax (Calendar 2011) 206,157 27.3 617 888 746 Motor Vehicle Sales Tax (Calendar 2011) 32,442 4.3 97 98 101 Motor Vehicle Registration Tax (Calendar 2011) 34,353 4.6 103 108 108 Motor Fuels Tax (Calendar 2011) 44,499 5.9 133 138 159 Corporate Income Tax (Calendar 2011) 23,178 3.1 69 187 147 State General Property Tax (Payable 2011) 42,721 5.7 128 181 149
Total State Taxes $754,684 100.0% $2,259 $3,119 $2,634

House Research Department May 2015Table 4 Page 132
BECKER W CENTRAL (4) STATEAmount
I. Major State Aids/Credits (000s) Percent Per Capita Per Capita Per Capita
A. Aids to Local Governments Education Aid (2010-2011) $39,868 46.8% $1,217 $1,158 $1,262 Human Services Aid (Calendar 2011) Medical Assistance 26,964 31.7 823 564 530 Minnesota Family Investment Program 522 0.6 16 9 14 General Assistance including GAMC 280 0.3 9 5 8 Social Services 7,649 9.0 233 266 247 Miscellaneous 731 0.9 22 23 30
Total 36,145 42.5 1,103 868 829 Highway Aid (Calendar 2011) County Aid 4,714 5.5 144 170 88 Municipal Aid 427 0.5 13 26 28 Township Aid 547 0.6 17 20 6
Total 5,688 6.7 174 216 122 Local Government Aid (Calendar 2011) 1,518 1.8 46 115 80 Disparity Reduction Aid (Calendar 2011) 2 0.0 0 1 3 County Program Aid (Payable 2011) 1,019 1.2 31 34 30 Community Corrections Funding (2011) 876 1.0 27 17 16
Total Aids 85,116 100.0 2,597 2,409 2,342 B. Property Tax Credits (Payable 2011) Homestead Market Value Credit 1,454 79.6 44 43 29 Agricultural Market Value Credit 374 20.4 11 11 4 Miscellaneous Credits 0 0.0 0 24 5
Total Property Tax Credits 1,828 100.0 56 78 38 C. Property Tax Refunds (10 filed 11) Regular (Homeowners) 891 53.6 27 26 51 Regular (Renters) 730 44.0 22 25 37 Targeting Refund 40 2.4 1 1 0
Total Property Tax Refunds 1,661 100.0 51 52 88 Total Aids/Credits $88,605 100.0% $2,704 $2,539 $2,469
II. Property Tax Data A. Property Tax Levy (Payable 2011) County Levy $18,050 42.5% $551 $563 $466 City/Town Levy 8,652 20.4 264 275 359 School District Net Tax Capacity Levy 6,314 14.9 193 204 243 School District Referendum Market Value Levy 3,344 7.9 102 96 142 Miscellaneous District Levy 1,709 4.0 52 52 208 State Property Tax Levy 4,394 10.3 134 118 149
Total Levy $42,464 100.0% $1,296 $1,308 $1,568 Less Property Tax Credits 1,828 56 78 38
Net Property Taxes Payable 40,636 1,240 1,231 1,529 B. Property Valuation (2010 Assessment) Market Valuation $4,586,284 $139,954 $132,717 $105,022 Referendum Market Valuation 2,436,290 $74,345 66,557 83,805 Net Tax Capacity (NTC) 46,139 1,408 1,311 1,171 C. Average Local NTC Tax Rate 75.263 Avg. Referendum Mkt. Value Tax Rate 0.137
III. Major State Taxes Individual Income Tax (2010 filed 2011) $24,203 38.8% $739 $849 $1,225 Sales/Use Tax (Calendar 2011) 19,374 31.1 591 610 746 Motor Vehicle Sales Tax (Calendar 2011) 3,435 5.5 105 106 101 Motor Vehicle Registration Tax (Calendar 2011) 3,417 5.5 104 109 108 Motor Fuels Tax (Calendar 2011) 5,937 9.5 181 207 159 Corporate Income Tax (Calendar 2011) 1,626 2.6 50 83 147 State General Property Tax (Payable 2011) 4,394 7.0 134 118 149
Total State Taxes $62,386 100.0% $1,904 $2,081 $2,634
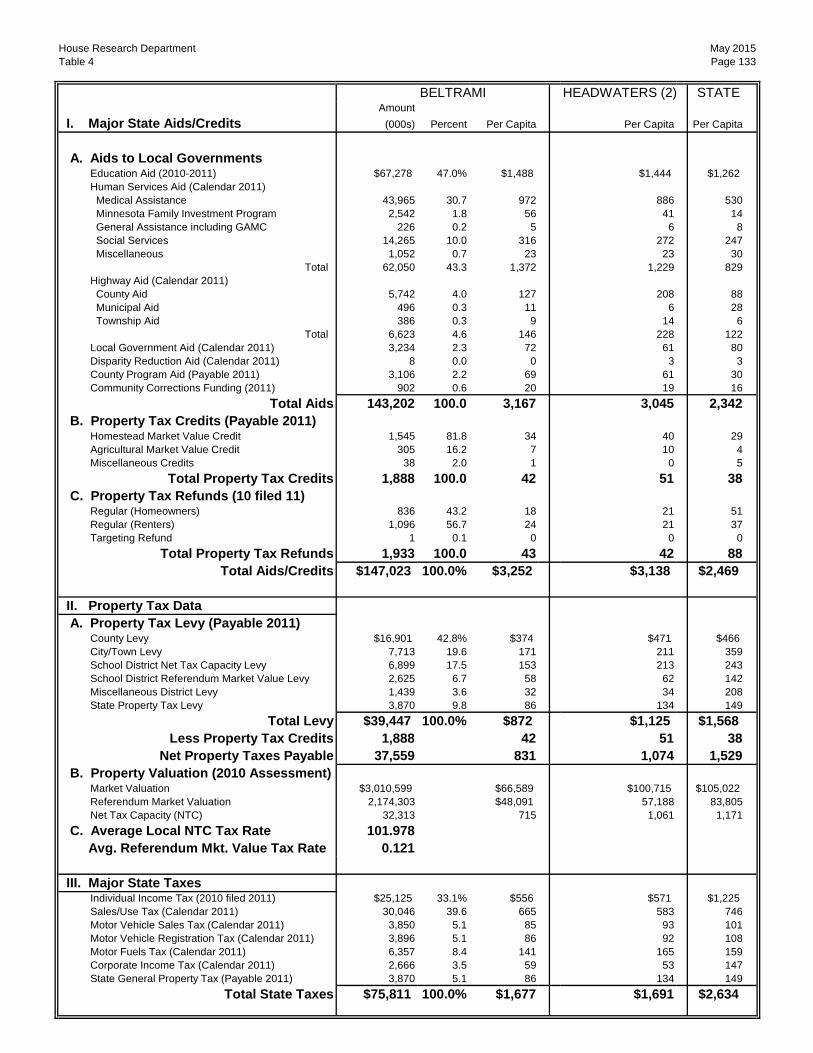
House Research Department May 2015Table 4 Page 133
BELTRAMI HEADWATERS (2) STATEAmount
I. Major State Aids/Credits (000s) Percent Per Capita Per Capita Per Capita
A. Aids to Local Governments Education Aid (2010-2011) $67,278 47.0% $1,488 $1,444 $1,262 Human Services Aid (Calendar 2011) Medical Assistance 43,965 30.7 972 886 530 Minnesota Family Investment Program 2,542 1.8 56 41 14 General Assistance including GAMC 226 0.2 5 6 8 Social Services 14,265 10.0 316 272 247 Miscellaneous 1,052 0.7 23 23 30
Total 62,050 43.3 1,372 1,229 829 Highway Aid (Calendar 2011) County Aid 5,742 4.0 127 208 88 Municipal Aid 496 0.3 11 6 28 Township Aid 386 0.3 9 14 6
Total 6,623 4.6 146 228 122 Local Government Aid (Calendar 2011) 3,234 2.3 72 61 80 Disparity Reduction Aid (Calendar 2011) 8 0.0 0 3 3 County Program Aid (Payable 2011) 3,106 2.2 69 61 30 Community Corrections Funding (2011) 902 0.6 20 19 16
Total Aids 143,202 100.0 3,167 3,045 2,342 B. Property Tax Credits (Payable 2011) Homestead Market Value Credit 1,545 81.8 34 40 29 Agricultural Market Value Credit 305 16.2 7 10 4 Miscellaneous Credits 38 2.0 1 0 5
Total Property Tax Credits 1,888 100.0 42 51 38 C. Property Tax Refunds (10 filed 11) Regular (Homeowners) 836 43.2 18 21 51 Regular (Renters) 1,096 56.7 24 21 37 Targeting Refund 1 0.1 0 0 0
Total Property Tax Refunds 1,933 100.0 43 42 88 Total Aids/Credits $147,023 100.0% $3,252 $3,138 $2,469
II. Property Tax Data A. Property Tax Levy (Payable 2011) County Levy $16,901 42.8% $374 $471 $466 City/Town Levy 7,713 19.6 171 211 359 School District Net Tax Capacity Levy 6,899 17.5 153 213 243 School District Referendum Market Value Levy 2,625 6.7 58 62 142 Miscellaneous District Levy 1,439 3.6 32 34 208 State Property Tax Levy 3,870 9.8 86 134 149
Total Levy $39,447 100.0% $872 $1,125 $1,568 Less Property Tax Credits 1,888 42 51 38
Net Property Taxes Payable 37,559 831 1,074 1,529 B. Property Valuation (2010 Assessment) Market Valuation $3,010,599 $66,589 $100,715 $105,022 Referendum Market Valuation 2,174,303 $48,091 57,188 83,805 Net Tax Capacity (NTC) 32,313 715 1,061 1,171 C. Average Local NTC Tax Rate 101.978 Avg. Referendum Mkt. Value Tax Rate 0.121
III. Major State Taxes Individual Income Tax (2010 filed 2011) $25,125 33.1% $556 $571 $1,225 Sales/Use Tax (Calendar 2011) 30,046 39.6 665 583 746 Motor Vehicle Sales Tax (Calendar 2011) 3,850 5.1 85 93 101 Motor Vehicle Registration Tax (Calendar 2011) 3,896 5.1 86 92 108 Motor Fuels Tax (Calendar 2011) 6,357 8.4 141 165 159 Corporate Income Tax (Calendar 2011) 2,666 3.5 59 53 147 State General Property Tax (Payable 2011) 3,870 5.1 86 134 149
Total State Taxes $75,811 100.0% $1,677 $1,691 $2,634

House Research Department May 2015Table 4 Page 134
BENTON CENTRAL MN (7W) STATEAmount
I. Major State Aids/Credits (000s) Percent Per Capita Per Capita Per Capita
A. Aids to Local Governments Education Aid (2010-2011) $46,475 53.0% $1,205 $1,262 $1,262 Human Services Aid (Calendar 2011) Medical Assistance 19,273 22.0 500 368 530 Minnesota Family Investment Program 521 0.6 14 9 14 General Assistance including GAMC 325 0.4 8 3 8 Social Services 10,828 12.3 281 174 247 Miscellaneous 1,331 1.5 35 20 30
Total 32,279 36.8 837 574 829 Highway Aid (Calendar 2011) County Aid 3,351 3.8 87 68 88 Municipal Aid 491 0.6 13 22 28 Township Aid 177 0.2 5 4 6
Total 4,018 4.6 104 93 122 Local Government Aid (Calendar 2011) 2,358 2.7 61 51 80 Disparity Reduction Aid (Calendar 2011) 17 0.0 0 0 3 County Program Aid (Payable 2011) 1,803 2.1 47 35 30 Community Corrections Funding (2011) 806 0.9 21 13 16
Total Aids 87,757 100.0 2,276 2,030 2,342 B. Property Tax Credits (Payable 2011) Homestead Market Value Credit 1,550 80.0 40 34 29 Agricultural Market Value Credit 387 19.9 10 5 4 Miscellaneous Credits 2 0.1 0 0 5
Total Property Tax Credits 1,938 100.0 50 39 38 C. Property Tax Refunds (10 filed 11) Regular (Homeowners) 1,655 49.0 43 46 51 Regular (Renters) 1,724 51.0 45 29 37 Targeting Refund 0 0.0 0 0 0
Total Property Tax Refunds 3,379 100.0 88 76 88 Total Aids/Credits $93,074 100.0% $2,414 $2,145 $2,469
II. Property Tax Data A. Property Tax Levy (Payable 2011) County Levy $19,944 42.9% $517 $448 $466 City/Town Levy 9,352 20.1 243 322 359 School District Net Tax Capacity Levy 10,665 22.9 277 272 243 School District Referendum Market Value Levy 1,056 2.3 27 101 142 Miscellaneous District Levy 1,731 3.7 45 47 208 State Property Tax Levy 3,749 8.1 97 120 149
Total Levy $46,497 100.0% $1,206 $1,311 $1,568 Less Property Tax Credits 1,938 50 39 38
Net Property Taxes Payable 44,559 1,156 1,272 1,529 B. Property Valuation (2010 Assessment) Market Valuation $2,856,832 $74,092 $86,172 $105,022 Referendum Market Valuation 2,267,511 $58,808 72,937 83,805 Net Tax Capacity (NTC) 30,628 794 966 1,171 C. Average Local NTC Tax Rate 135.335 Avg. Referendum Mkt. Value Tax Rate 0.057
III. Major State Taxes Individual Income Tax (2010 filed 2011) $29,360 40.8% $761 $941 $1,225 Sales/Use Tax (Calendar 2011) 21,635 30.1 561 583 746 Motor Vehicle Sales Tax (Calendar 2011) 3,464 4.8 90 101 101 Motor Vehicle Registration Tax (Calendar 2011) 3,486 4.8 90 106 108 Motor Fuels Tax (Calendar 2011) 7,187 10.0 186 173 159 Corporate Income Tax (Calendar 2011) 3,060 4.3 79 88 147 State General Property Tax (Payable 2011) 3,749 5.2 97 120 149
Total State Taxes $71,942 100.0% $1,866 $2,112 $2,634

House Research Department May 2015Table 4 Page 135
BIG STONE MN VALLEY (6W) STATEAmount
I. Major State Aids/Credits (000s) Percent Per Capita Per Capita Per Capita
A. Aids to Local Governments Education Aid (2010-2011) $6,992 40.6% $1,334 $1,347 $1,262 Human Services Aid (Calendar 2011) Medical Assistance 4,027 23.4 768 696 530 Minnesota Family Investment Program 43 0.2 8 8 14 General Assistance including GAMC 6 0.0 1 3 8 Social Services 1,732 10.1 331 299 247 Miscellaneous 107 0.6 20 21 30
Total 5,915 34.4 1,129 1,026 829 Highway Aid (Calendar 2011) County Aid 2,428 14.1 463 313 88 Municipal Aid 0 0.0 0 5 28 Township Aid 162 0.9 31 58 6
Total 2,589 15.0 494 376 122 Local Government Aid (Calendar 2011) 1,158 6.7 221 198 80 Disparity Reduction Aid (Calendar 2011) 176 1.0 34 13 3 County Program Aid (Payable 2011) 264 1.5 50 34 30 Community Corrections Funding (2011) 113 0.7 22 17 16
Total Aids 17,208 100.0 3,284 3,012 2,342 B. Property Tax Credits (Payable 2011) Homestead Market Value Credit 235 67.0 45 45 29 Agricultural Market Value Credit 116 33.0 22 21 4 Miscellaneous Credits 0 0.0 0 0 5
Total Property Tax Credits 350 100.0 67 66 38 C. Property Tax Refunds (10 filed 11) Regular (Homeowners) 126 58.1 24 16 51 Regular (Renters) 91 41.9 17 19 37 Targeting Refund 0 0.0 0 0 0
Total Property Tax Refunds 218 100.0 42 34 88 Total Aids/Credits $17,775 100.0% $3,392 $3,112 $2,469
II. Property Tax Data A. Property Tax Levy (Payable 2011) County Levy $3,875 50.4% $740 $696 $466 City/Town Levy 1,474 19.2 281 361 359 School District Net Tax Capacity Levy 1,235 16.0 236 210 243 School District Referendum Market Value Levy 571 7.4 109 97 142 Miscellaneous District Levy 273 3.5 52 36 208 State Property Tax Levy 266 3.5 51 82 149
Total Levy $7,694 100.0% $1,468 $1,482 $1,568 Less Property Tax Credits 350 67 66 38
Net Property Taxes Payable 7,344 1,401 1,416 1,529 B. Property Valuation (2010 Assessment) Market Valuation $975,956 $186,251 $177,801 $105,022 Referendum Market Valuation 193,670 $36,960 41,733 83,805 Net Tax Capacity (NTC) 8,038 1,534 1,527 1,171 C. Average Local NTC Tax Rate 85.307 Avg. Referendum Mkt. Value Tax Rate 0.295
III. Major State Taxes Individual Income Tax (2010 filed 2011) $4,230 49.0% $807 $923 $1,225 Sales/Use Tax (Calendar 2011) 1,591 18.4 304 453 746 Motor Vehicle Sales Tax (Calendar 2011) 684 7.9 131 123 101 Motor Vehicle Registration Tax (Calendar 2011) 737 8.5 141 130 108 Motor Fuels Tax (Calendar 2011) 1,006 11.7 192 200 159 Corporate Income Tax (Calendar 2011) 112 1.3 21 201 147 State General Property Tax (Payable 2011) 266 3.1 51 82 149
Total State Taxes $8,627 100.0% $1,646 $2,114 $2,634
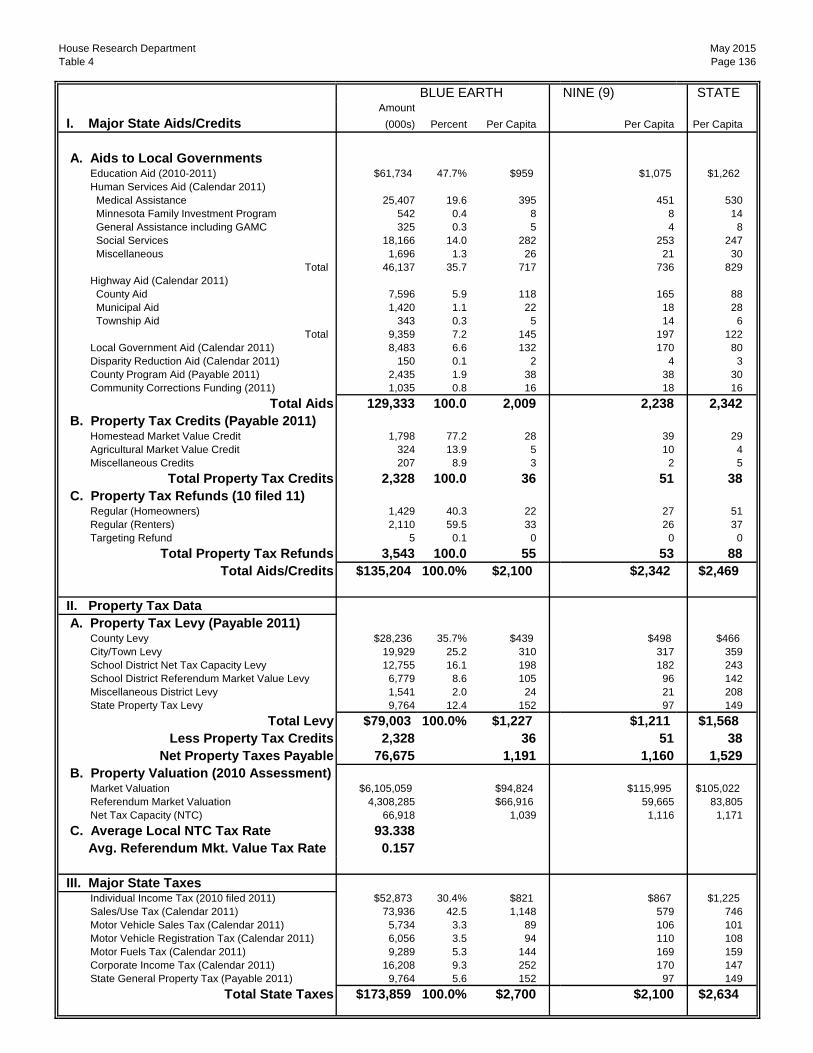
House Research Department May 2015Table 4 Page 136
BLUE EARTH NINE (9) STATEAmount
I. Major State Aids/Credits (000s) Percent Per Capita Per Capita Per Capita
A. Aids to Local Governments Education Aid (2010-2011) $61,734 47.7% $959 $1,075 $1,262 Human Services Aid (Calendar 2011) Medical Assistance 25,407 19.6 395 451 530 Minnesota Family Investment Program 542 0.4 8 8 14 General Assistance including GAMC 325 0.3 5 4 8 Social Services 18,166 14.0 282 253 247 Miscellaneous 1,696 1.3 26 21 30
Total 46,137 35.7 717 736 829 Highway Aid (Calendar 2011) County Aid 7,596 5.9 118 165 88 Municipal Aid 1,420 1.1 22 18 28 Township Aid 343 0.3 5 14 6
Total 9,359 7.2 145 197 122 Local Government Aid (Calendar 2011) 8,483 6.6 132 170 80 Disparity Reduction Aid (Calendar 2011) 150 0.1 2 4 3 County Program Aid (Payable 2011) 2,435 1.9 38 38 30 Community Corrections Funding (2011) 1,035 0.8 16 18 16
Total Aids 129,333 100.0 2,009 2,238 2,342 B. Property Tax Credits (Payable 2011) Homestead Market Value Credit 1,798 77.2 28 39 29 Agricultural Market Value Credit 324 13.9 5 10 4 Miscellaneous Credits 207 8.9 3 2 5
Total Property Tax Credits 2,328 100.0 36 51 38 C. Property Tax Refunds (10 filed 11) Regular (Homeowners) 1,429 40.3 22 27 51 Regular (Renters) 2,110 59.5 33 26 37 Targeting Refund 5 0.1 0 0 0
Total Property Tax Refunds 3,543 100.0 55 53 88 Total Aids/Credits $135,204 100.0% $2,100 $2,342 $2,469
II. Property Tax Data A. Property Tax Levy (Payable 2011) County Levy $28,236 35.7% $439 $498 $466 City/Town Levy 19,929 25.2 310 317 359 School District Net Tax Capacity Levy 12,755 16.1 198 182 243 School District Referendum Market Value Levy 6,779 8.6 105 96 142 Miscellaneous District Levy 1,541 2.0 24 21 208 State Property Tax Levy 9,764 12.4 152 97 149
Total Levy $79,003 100.0% $1,227 $1,211 $1,568 Less Property Tax Credits 2,328 36 51 38
Net Property Taxes Payable 76,675 1,191 1,160 1,529 B. Property Valuation (2010 Assessment) Market Valuation $6,105,059 $94,824 $115,995 $105,022 Referendum Market Valuation 4,308,285 $66,916 59,665 83,805 Net Tax Capacity (NTC) 66,918 1,039 1,116 1,171 C. Average Local NTC Tax Rate 93.338 Avg. Referendum Mkt. Value Tax Rate 0.157
III. Major State Taxes Individual Income Tax (2010 filed 2011) $52,873 30.4% $821 $867 $1,225 Sales/Use Tax (Calendar 2011) 73,936 42.5 1,148 579 746 Motor Vehicle Sales Tax (Calendar 2011) 5,734 3.3 89 106 101 Motor Vehicle Registration Tax (Calendar 2011) 6,056 3.5 94 110 108 Motor Fuels Tax (Calendar 2011) 9,289 5.3 144 169 159 Corporate Income Tax (Calendar 2011) 16,208 9.3 252 170 147 State General Property Tax (Payable 2011) 9,764 5.6 152 97 149
Total State Taxes $173,859 100.0% $2,700 $2,100 $2,634

House Research Department May 2015Table 4 Page 137
BROWN NINE (9) STATEAmount
I. Major State Aids/Credits (000s) Percent Per Capita Per Capita Per Capita
A. Aids to Local Governments Education Aid (2010-2011) $24,029 42.1% $933 $1,075 $1,262 Human Services Aid (Calendar 2011) Medical Assistance 12,341 21.6 479 451 530 Minnesota Family Investment Program 111 0.2 4 8 14 General Assistance including GAMC 106 0.2 4 4 8 Social Services 7,092 12.4 275 253 247 Miscellaneous 492 0.9 19 21 30
Total 20,141 35.3 782 736 829 Highway Aid (Calendar 2011) County Aid 3,728 6.5 145 165 88 Municipal Aid 665 1.2 26 18 28 Township Aid 369 0.6 14 14 6
Total 4,762 8.3 185 197 122 Local Government Aid (Calendar 2011) 6,490 11.4 252 170 80 Disparity Reduction Aid (Calendar 2011) 68 0.1 3 4 3 County Program Aid (Payable 2011) 1,197 2.1 46 38 30 Community Corrections Funding (2011) 449 0.8 17 18 16
Total Aids 57,137 100.0 2,218 2,238 2,342 B. Property Tax Credits (Payable 2011) Homestead Market Value Credit 1,265 80.7 49 39 29 Agricultural Market Value Credit 302 19.3 12 10 4 Miscellaneous Credits 0 0.0 0 2 5
Total Property Tax Credits 1,567 100.0 61 51 38 C. Property Tax Refunds (10 filed 11) Regular (Homeowners) 678 50.6 26 27 51 Regular (Renters) 661 49.3 26 26 37 Targeting Refund 2 0.1 0 0 0
Total Property Tax Refunds 1,340 100.0 52 53 88 Total Aids/Credits $60,045 100.0% $2,331 $2,342 $2,469
II. Property Tax Data A. Property Tax Levy (Payable 2011) County Levy $11,151 39.8% $433 $498 $466 City/Town Levy 8,973 32.0 348 317 359 School District Net Tax Capacity Levy 3,640 13.0 141 182 243 School District Referendum Market Value Levy 2,058 7.3 80 96 142 Miscellaneous District Levy 304 1.1 12 21 208 State Property Tax Levy 1,879 6.7 73 97 149
Total Levy $28,005 100.0% $1,087 $1,211 $1,568 Less Property Tax Credits 1,567 61 51 38
Net Property Taxes Payable 26,437 1,026 1,160 1,529 B. Property Valuation (2010 Assessment) Market Valuation $2,743,336 $106,513 $115,995 $105,022 Referendum Market Valuation 1,299,572 $50,457 59,665 83,805 Net Tax Capacity (NTC) 24,790 962 1,116 1,171 C. Average Local NTC Tax Rate 97.087 Avg. Referendum Mkt. Value Tax Rate 0.158
III. Major State Taxes Individual Income Tax (2010 filed 2011) $23,778 42.1% $923 $867 $1,225 Sales/Use Tax (Calendar 2011) 14,698 26.0 571 579 746 Motor Vehicle Sales Tax (Calendar 2011) 3,155 5.6 122 106 101 Motor Vehicle Registration Tax (Calendar 2011) 3,275 5.8 127 110 108 Motor Fuels Tax (Calendar 2011) 3,512 6.2 136 169 159 Corporate Income Tax (Calendar 2011) 6,242 11.0 242 170 147 State General Property Tax (Payable 2011) 1,879 3.3 73 97 149
Total State Taxes $56,538 100.0% $2,195 $2,100 $2,634

House Research Department May 2015Table 4 Page 138
CARLTON ARROWHEAD (3) STATEAmount
I. Major State Aids/Credits (000s) Percent Per Capita Per Capita Per Capita
A. Aids to Local Governments Education Aid (2010-2011) $46,784 50.8% $1,318 $1,104 $1,262 Human Services Aid (Calendar 2011) Medical Assistance 21,880 23.8 616 653 530 Minnesota Family Investment Program 286 0.3 8 14 14 General Assistance including GAMC 250 0.3 7 10 8 Social Services 10,780 11.7 304 314 247 Miscellaneous 869 0.9 24 41 30
Total 34,065 37.0 960 1,032 829 Highway Aid (Calendar 2011) County Aid 4,292 4.7 121 160 88 Municipal Aid 594 0.6 17 33 28 Township Aid 222 0.2 6 5 6
Total 5,108 5.6 144 199 122 Local Government Aid (Calendar 2011) 3,148 3.4 89 198 80 Disparity Reduction Aid (Calendar 2011) 656 0.7 18 33 3 County Program Aid (Payable 2011) 1,619 1.8 46 42 30 Community Corrections Funding (2011) 630 0.7 18 21 16
Total Aids 92,010 100.0 2,592 2,630 2,342 B. Property Tax Credits (Payable 2011) Homestead Market Value Credit 1,617 86.9 46 42 29 Agricultural Market Value Credit 241 13.0 7 3 4 Miscellaneous Credits 2 0.1 0 48 5
Total Property Tax Credits 1,860 100.0 52 93 38 C. Property Tax Refunds (10 filed 11) Regular (Homeowners) 1,699 66.4 48 26 51 Regular (Renters) 849 33.2 24 29 37 Targeting Refund 12 0.5 0 0 0
Total Property Tax Refunds 2,560 100.0 72 56 88 Total Aids/Credits $96,429 100.0% $2,717 $2,778 $2,469
II. Property Tax Data A. Property Tax Levy (Payable 2011) County Levy $20,003 47.4% $564 $545 $466 City/Town Levy 7,366 17.5 208 269 359 School District Net Tax Capacity Levy 7,531 17.8 212 187 243 School District Referendum Market Value Levy 1,971 4.7 56 51 142 Miscellaneous District Levy 2,235 5.3 63 66 208 State Property Tax Levy 3,082 7.3 87 122 149
Total Levy $42,189 100.0% $1,189 $1,239 $1,568 Less Property Tax Credits 1,860 52 93 38
Net Property Taxes Payable 40,329 1,136 1,147 1,529 B. Property Valuation (2010 Assessment) Market Valuation $2,621,615 $73,865 $99,574 $105,022 Referendum Market Valuation 2,116,745 $59,640 67,723 83,805 Net Tax Capacity (NTC) 28,468 802 1,088 1,171 C. Average Local NTC Tax Rate 130.444 Avg. Referendum Mkt. Value Tax Rate 0.093
III. Major State Taxes Individual Income Tax (2010 filed 2011) $23,550 40.0% $664 $783 $1,225 Sales/Use Tax (Calendar 2011) 15,150 25.8 427 720 746 Motor Vehicle Sales Tax (Calendar 2011) 3,602 6.1 101 102 101 Motor Vehicle Registration Tax (Calendar 2011) 3,586 6.1 101 104 108 Motor Fuels Tax (Calendar 2011) 7,306 12.4 206 175 159 Corporate Income Tax (Calendar 2011) 2,555 4.3 72 79 147 State General Property Tax (Payable 2011) 3,082 5.2 87 122 149
Total State Taxes $58,830 100.0% $1,658 $2,085 $2,634
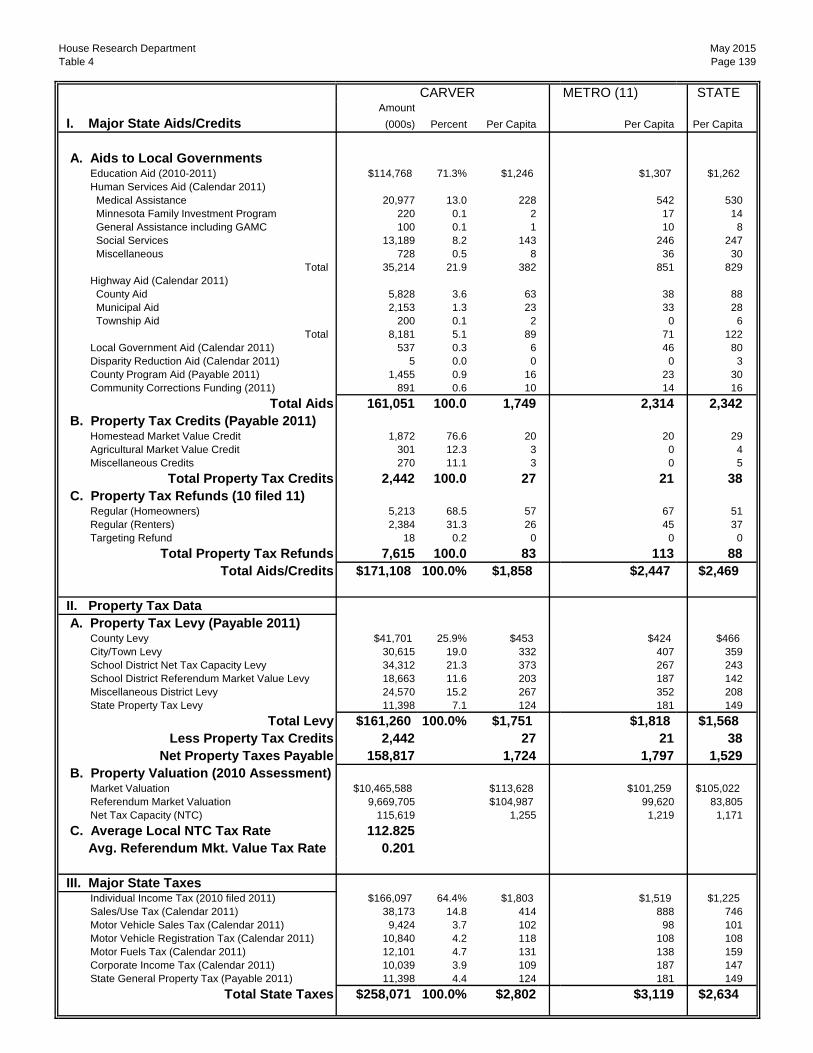
House Research Department May 2015Table 4 Page 139
CARVER METRO (11) STATEAmount
I. Major State Aids/Credits (000s) Percent Per Capita Per Capita Per Capita
A. Aids to Local Governments Education Aid (2010-2011) $114,768 71.3% $1,246 $1,307 $1,262 Human Services Aid (Calendar 2011) Medical Assistance 20,977 13.0 228 542 530 Minnesota Family Investment Program 220 0.1 2 17 14 General Assistance including GAMC 100 0.1 1 10 8 Social Services 13,189 8.2 143 246 247 Miscellaneous 728 0.5 8 36 30
Total 35,214 21.9 382 851 829 Highway Aid (Calendar 2011) County Aid 5,828 3.6 63 38 88 Municipal Aid 2,153 1.3 23 33 28 Township Aid 200 0.1 2 0 6
Total 8,181 5.1 89 71 122 Local Government Aid (Calendar 2011) 537 0.3 6 46 80 Disparity Reduction Aid (Calendar 2011) 5 0.0 0 0 3 County Program Aid (Payable 2011) 1,455 0.9 16 23 30 Community Corrections Funding (2011) 891 0.6 10 14 16
Total Aids 161,051 100.0 1,749 2,314 2,342 B. Property Tax Credits (Payable 2011) Homestead Market Value Credit 1,872 76.6 20 20 29 Agricultural Market Value Credit 301 12.3 3 0 4 Miscellaneous Credits 270 11.1 3 0 5
Total Property Tax Credits 2,442 100.0 27 21 38 C. Property Tax Refunds (10 filed 11) Regular (Homeowners) 5,213 68.5 57 67 51 Regular (Renters) 2,384 31.3 26 45 37 Targeting Refund 18 0.2 0 0 0
Total Property Tax Refunds 7,615 100.0 83 113 88 Total Aids/Credits $171,108 100.0% $1,858 $2,447 $2,469
II. Property Tax Data A. Property Tax Levy (Payable 2011) County Levy $41,701 25.9% $453 $424 $466 City/Town Levy 30,615 19.0 332 407 359 School District Net Tax Capacity Levy 34,312 21.3 373 267 243 School District Referendum Market Value Levy 18,663 11.6 203 187 142 Miscellaneous District Levy 24,570 15.2 267 352 208 State Property Tax Levy 11,398 7.1 124 181 149
Total Levy $161,260 100.0% $1,751 $1,818 $1,568 Less Property Tax Credits 2,442 27 21 38
Net Property Taxes Payable 158,817 1,724 1,797 1,529 B. Property Valuation (2010 Assessment) Market Valuation $10,465,588 $113,628 $101,259 $105,022 Referendum Market Valuation 9,669,705 $104,987 99,620 83,805 Net Tax Capacity (NTC) 115,619 1,255 1,219 1,171 C. Average Local NTC Tax Rate 112.825 Avg. Referendum Mkt. Value Tax Rate 0.201
III. Major State Taxes Individual Income Tax (2010 filed 2011) $166,097 64.4% $1,803 $1,519 $1,225 Sales/Use Tax (Calendar 2011) 38,173 14.8 414 888 746 Motor Vehicle Sales Tax (Calendar 2011) 9,424 3.7 102 98 101 Motor Vehicle Registration Tax (Calendar 2011) 10,840 4.2 118 108 108 Motor Fuels Tax (Calendar 2011) 12,101 4.7 131 138 159 Corporate Income Tax (Calendar 2011) 10,039 3.9 109 187 147 State General Property Tax (Payable 2011) 11,398 4.4 124 181 149
Total State Taxes $258,071 100.0% $2,802 $3,119 $2,634

House Research Department May 2015Table 4 Page 140
CASS FIVE (5) STATEAmount
I. Major State Aids/Credits (000s) Percent Per Capita Per Capita Per Capita
A. Aids to Local Governments Education Aid (2010-2011) $37,975 49.0% $1,337 $1,273 $1,262 Human Services Aid (Calendar 2011) Medical Assistance 23,764 30.7 837 642 530 Minnesota Family Investment Program 593 0.8 21 11 14 General Assistance including GAMC 191 0.2 7 3 8 Social Services 7,176 9.3 253 247 247 Miscellaneous 608 0.8 21 26 30
Total 32,332 41.7 1,139 929 829 Highway Aid (Calendar 2011) County Aid 4,736 6.1 167 132 88 Municipal Aid 0 0.0 0 14 28 Township Aid 425 0.5 15 13 6
Total 5,161 6.7 182 158 122 Local Government Aid (Calendar 2011) 980 1.3 35 79 80 Disparity Reduction Aid (Calendar 2011) 16 0.0 1 2 3 County Program Aid (Payable 2011) 359 0.5 13 26 30 Community Corrections Funding (2011) 642 0.8 23 17 16
Total Aids 77,464 100.0 2,728 2,485 2,342 B. Property Tax Credits (Payable 2011) Homestead Market Value Credit 1,106 83.9 39 44 29 Agricultural Market Value Credit 212 16.1 7 13 4 Miscellaneous Credits 0 0.0 0 8 5
Total Property Tax Credits 1,317 100.0 46 65 38 C. Property Tax Refunds (10 filed 11) Regular (Homeowners) 801 63.6 28 33 51 Regular (Renters) 453 36.0 16 25 37 Targeting Refund 5 0.4 0 0 0
Total Property Tax Refunds 1,259 100.0 44 58 88 Total Aids/Credits $80,040 100.0% $2,819 $2,608 $2,469
II. Property Tax Data A. Property Tax Levy (Payable 2011) County Levy $20,039 42.9% $706 $561 $466 City/Town Levy 10,178 21.8 358 330 359 School District Net Tax Capacity Levy 7,082 15.2 249 223 243 School District Referendum Market Value Levy 1,237 2.6 44 66 142 Miscellaneous District Levy 582 1.2 20 29 208 State Property Tax Levy 7,609 16.3 268 176 149
Total Levy $46,727 100.0% $1,646 $1,386 $1,568 Less Property Tax Credits 1,317 46 65 38
Net Property Taxes Payable 45,409 1,599 1,322 1,529 B. Property Valuation (2010 Assessment) Market Valuation $6,663,956 $234,679 $150,534 $105,022 Referendum Market Valuation 2,691,635 $94,789 76,762 83,805 Net Tax Capacity (NTC) 68,996 2,430 1,557 1,171 C. Average Local NTC Tax Rate 54.903 Avg. Referendum Mkt. Value Tax Rate 0.046
III. Major State Taxes Individual Income Tax (2010 filed 2011) $20,483 37.2% $721 $674 $1,225 Sales/Use Tax (Calendar 2011) 13,612 24.7 479 581 746 Motor Vehicle Sales Tax (Calendar 2011) 2,876 5.2 101 106 101 Motor Vehicle Registration Tax (Calendar 2011) 2,881 5.2 101 105 108 Motor Fuels Tax (Calendar 2011) 6,614 12.0 233 201 159 Corporate Income Tax (Calendar 2011) 927 1.7 33 69 147 State General Property Tax (Payable 2011) 7,609 13.8 268 176 149
Total State Taxes $55,002 100.0% $1,937 $1,912 $2,634
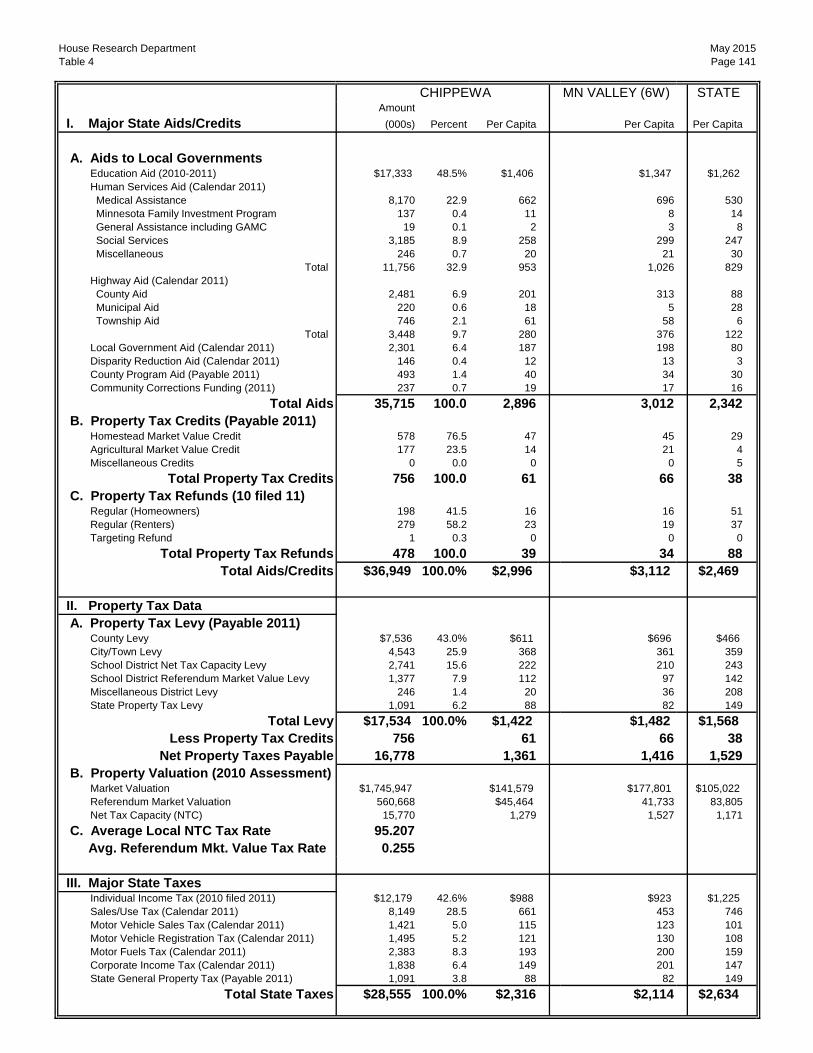
House Research Department May 2015Table 4 Page 141
CHIPPEWA MN VALLEY (6W) STATEAmount
I. Major State Aids/Credits (000s) Percent Per Capita Per Capita Per Capita
A. Aids to Local Governments Education Aid (2010-2011) $17,333 48.5% $1,406 $1,347 $1,262 Human Services Aid (Calendar 2011) Medical Assistance 8,170 22.9 662 696 530 Minnesota Family Investment Program 137 0.4 11 8 14 General Assistance including GAMC 19 0.1 2 3 8 Social Services 3,185 8.9 258 299 247 Miscellaneous 246 0.7 20 21 30
Total 11,756 32.9 953 1,026 829 Highway Aid (Calendar 2011) County Aid 2,481 6.9 201 313 88 Municipal Aid 220 0.6 18 5 28 Township Aid 746 2.1 61 58 6
Total 3,448 9.7 280 376 122 Local Government Aid (Calendar 2011) 2,301 6.4 187 198 80 Disparity Reduction Aid (Calendar 2011) 146 0.4 12 13 3 County Program Aid (Payable 2011) 493 1.4 40 34 30 Community Corrections Funding (2011) 237 0.7 19 17 16
Total Aids 35,715 100.0 2,896 3,012 2,342 B. Property Tax Credits (Payable 2011) Homestead Market Value Credit 578 76.5 47 45 29 Agricultural Market Value Credit 177 23.5 14 21 4 Miscellaneous Credits 0 0.0 0 0 5
Total Property Tax Credits 756 100.0 61 66 38 C. Property Tax Refunds (10 filed 11) Regular (Homeowners) 198 41.5 16 16 51 Regular (Renters) 279 58.2 23 19 37 Targeting Refund 1 0.3 0 0 0
Total Property Tax Refunds 478 100.0 39 34 88 Total Aids/Credits $36,949 100.0% $2,996 $3,112 $2,469
II. Property Tax Data A. Property Tax Levy (Payable 2011) County Levy $7,536 43.0% $611 $696 $466 City/Town Levy 4,543 25.9 368 361 359 School District Net Tax Capacity Levy 2,741 15.6 222 210 243 School District Referendum Market Value Levy 1,377 7.9 112 97 142 Miscellaneous District Levy 246 1.4 20 36 208 State Property Tax Levy 1,091 6.2 88 82 149
Total Levy $17,534 100.0% $1,422 $1,482 $1,568 Less Property Tax Credits 756 61 66 38
Net Property Taxes Payable 16,778 1,361 1,416 1,529 B. Property Valuation (2010 Assessment) Market Valuation $1,745,947 $141,579 $177,801 $105,022 Referendum Market Valuation 560,668 $45,464 41,733 83,805 Net Tax Capacity (NTC) 15,770 1,279 1,527 1,171 C. Average Local NTC Tax Rate 95.207 Avg. Referendum Mkt. Value Tax Rate 0.255
III. Major State Taxes Individual Income Tax (2010 filed 2011) $12,179 42.6% $988 $923 $1,225 Sales/Use Tax (Calendar 2011) 8,149 28.5 661 453 746 Motor Vehicle Sales Tax (Calendar 2011) 1,421 5.0 115 123 101 Motor Vehicle Registration Tax (Calendar 2011) 1,495 5.2 121 130 108 Motor Fuels Tax (Calendar 2011) 2,383 8.3 193 200 159 Corporate Income Tax (Calendar 2011) 1,838 6.4 149 201 147 State General Property Tax (Payable 2011) 1,091 3.8 88 82 149
Total State Taxes $28,555 100.0% $2,316 $2,114 $2,634

House Research Department May 2015Table 4 Page 142
CHISAGO E CENTRAL (7E) STATEAmount
I. Major State Aids/Credits (000s) Percent Per Capita Per Capita Per Capita
A. Aids to Local Governments Education Aid (2010-2011) $63,570 61.6% $1,179 $1,179 $1,262 Human Services Aid (Calendar 2011) Medical Assistance 18,816 18.2 349 493 530 Minnesota Family Investment Program 223 0.2 4 9 14 General Assistance including GAMC 157 0.2 3 4 8 Social Services 9,700 9.4 180 218 247 Miscellaneous 533 0.5 10 16 30
Total 29,428 28.5 546 740 829 Highway Aid (Calendar 2011) County Aid 5,080 4.9 94 131 88 Municipal Aid 904 0.9 17 13 28 Township Aid 214 0.2 4 8 6
Total 6,198 6.0 115 151 122 Local Government Aid (Calendar 2011) 1,467 1.4 27 41 80 Disparity Reduction Aid (Calendar 2011) 11 0.0 0 1 3 County Program Aid (Payable 2011) 1,544 1.5 29 38 30 Community Corrections Funding (2011) 1,004 1.0 19 20 16
Total Aids 103,222 100.0 1,914 2,171 2,342 B. Property Tax Credits (Payable 2011) Homestead Market Value Credit 1,715 82.2 32 43 29 Agricultural Market Value Credit 363 17.4 7 12 4 Miscellaneous Credits 9 0.4 0 0 5
Total Property Tax Credits 2,087 100.0 39 55 38 C. Property Tax Refunds (10 filed 11) Regular (Homeowners) 4,042 77.8 75 52 51 Regular (Renters) 1,147 22.1 21 23 37 Targeting Refund 8 0.2 0 0 0
Total Property Tax Refunds 5,197 100.0 96 75 88 Total Aids/Credits $110,506 100.0% $2,049 $2,301 $2,469
II. Property Tax Data A. Property Tax Levy (Payable 2011) County Levy $31,663 43.4% $587 $529 $466 City/Town Levy 17,052 23.4 316 263 359 School District Net Tax Capacity Levy 13,705 18.8 254 226 243 School District Referendum Market Value Levy 3,448 4.7 64 51 142 Miscellaneous District Levy 2,637 3.6 49 27 208 State Property Tax Levy 4,470 6.1 83 73 149
Total Levy $72,975 100.0% $1,353 $1,170 $1,568 Less Property Tax Credits 2,087 39 55 38
Net Property Taxes Payable 70,888 1,314 1,115 1,529 B. Property Valuation (2010 Assessment) Market Valuation $4,655,492 $86,326 $87,211 $105,022 Referendum Market Valuation 4,082,375 $75,699 64,446 83,805 Net Tax Capacity (NTC) 49,585 919 892 1,171 C. Average Local NTC Tax Rate 130.915 Avg. Referendum Mkt. Value Tax Rate 0.088
III. Major State Taxes Individual Income Tax (2010 filed 2011) $50,924 53.2% $944 $743 $1,225 Sales/Use Tax (Calendar 2011) 14,437 15.1 268 362 746 Motor Vehicle Sales Tax (Calendar 2011) 6,099 6.4 113 104 101 Motor Vehicle Registration Tax (Calendar 2011) 6,156 6.4 114 101 108 Motor Fuels Tax (Calendar 2011) 11,421 11.9 212 213 159 Corporate Income Tax (Calendar 2011) 2,262 2.4 42 43 147 State General Property Tax (Payable 2011) 4,470 4.7 83 73 149
Total State Taxes $95,768 100.0% $1,776 $1,639 $2,634
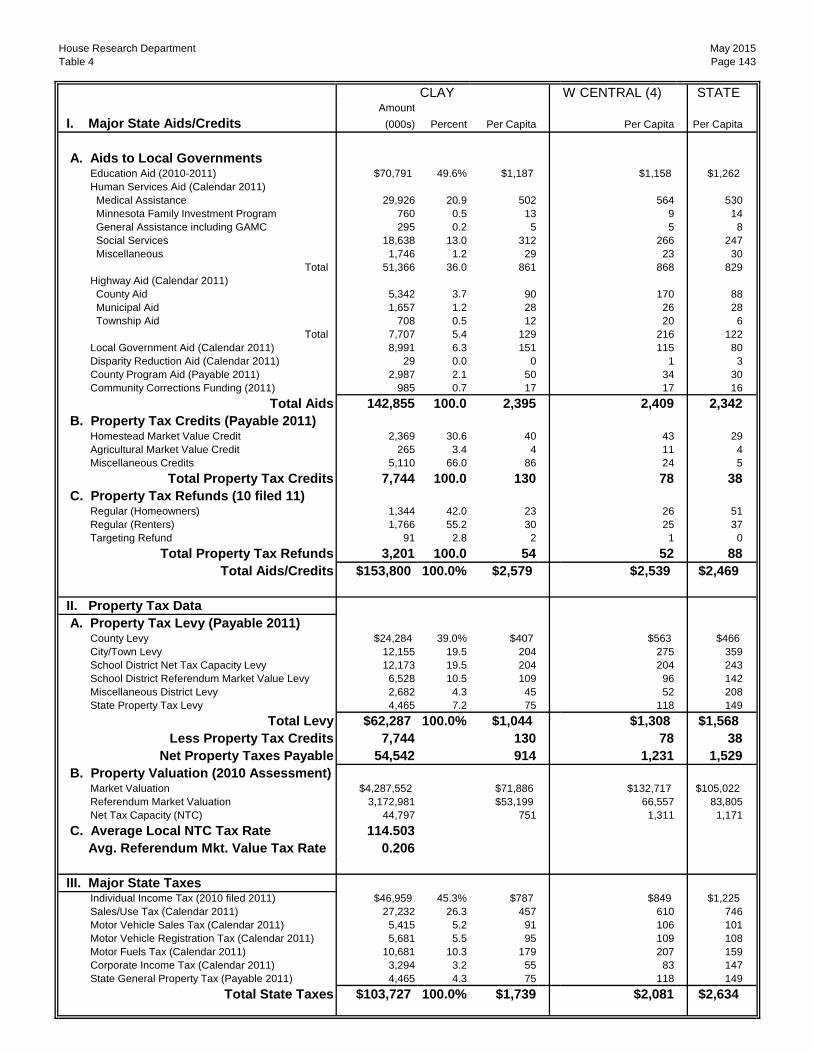
House Research Department May 2015Table 4 Page 143
CLAY W CENTRAL (4) STATEAmount
I. Major State Aids/Credits (000s) Percent Per Capita Per Capita Per Capita
A. Aids to Local Governments Education Aid (2010-2011) $70,791 49.6% $1,187 $1,158 $1,262 Human Services Aid (Calendar 2011) Medical Assistance 29,926 20.9 502 564 530 Minnesota Family Investment Program 760 0.5 13 9 14 General Assistance including GAMC 295 0.2 5 5 8 Social Services 18,638 13.0 312 266 247 Miscellaneous 1,746 1.2 29 23 30
Total 51,366 36.0 861 868 829 Highway Aid (Calendar 2011) County Aid 5,342 3.7 90 170 88 Municipal Aid 1,657 1.2 28 26 28 Township Aid 708 0.5 12 20 6
Total 7,707 5.4 129 216 122 Local Government Aid (Calendar 2011) 8,991 6.3 151 115 80 Disparity Reduction Aid (Calendar 2011) 29 0.0 0 1 3 County Program Aid (Payable 2011) 2,987 2.1 50 34 30 Community Corrections Funding (2011) 985 0.7 17 17 16
Total Aids 142,855 100.0 2,395 2,409 2,342 B. Property Tax Credits (Payable 2011) Homestead Market Value Credit 2,369 30.6 40 43 29 Agricultural Market Value Credit 265 3.4 4 11 4 Miscellaneous Credits 5,110 66.0 86 24 5
Total Property Tax Credits 7,744 100.0 130 78 38 C. Property Tax Refunds (10 filed 11) Regular (Homeowners) 1,344 42.0 23 26 51 Regular (Renters) 1,766 55.2 30 25 37 Targeting Refund 91 2.8 2 1 0
Total Property Tax Refunds 3,201 100.0 54 52 88 Total Aids/Credits $153,800 100.0% $2,579 $2,539 $2,469
II. Property Tax Data A. Property Tax Levy (Payable 2011) County Levy $24,284 39.0% $407 $563 $466 City/Town Levy 12,155 19.5 204 275 359 School District Net Tax Capacity Levy 12,173 19.5 204 204 243 School District Referendum Market Value Levy 6,528 10.5 109 96 142 Miscellaneous District Levy 2,682 4.3 45 52 208 State Property Tax Levy 4,465 7.2 75 118 149
Total Levy $62,287 100.0% $1,044 $1,308 $1,568 Less Property Tax Credits 7,744 130 78 38
Net Property Taxes Payable 54,542 914 1,231 1,529 B. Property Valuation (2010 Assessment) Market Valuation $4,287,552 $71,886 $132,717 $105,022 Referendum Market Valuation 3,172,981 $53,199 66,557 83,805 Net Tax Capacity (NTC) 44,797 751 1,311 1,171 C. Average Local NTC Tax Rate 114.503 Avg. Referendum Mkt. Value Tax Rate 0.206
III. Major State Taxes Individual Income Tax (2010 filed 2011) $46,959 45.3% $787 $849 $1,225 Sales/Use Tax (Calendar 2011) 27,232 26.3 457 610 746 Motor Vehicle Sales Tax (Calendar 2011) 5,415 5.2 91 106 101 Motor Vehicle Registration Tax (Calendar 2011) 5,681 5.5 95 109 108 Motor Fuels Tax (Calendar 2011) 10,681 10.3 179 207 159 Corporate Income Tax (Calendar 2011) 3,294 3.2 55 83 147 State General Property Tax (Payable 2011) 4,465 4.3 75 118 149
Total State Taxes $103,727 100.0% $1,739 $2,081 $2,634
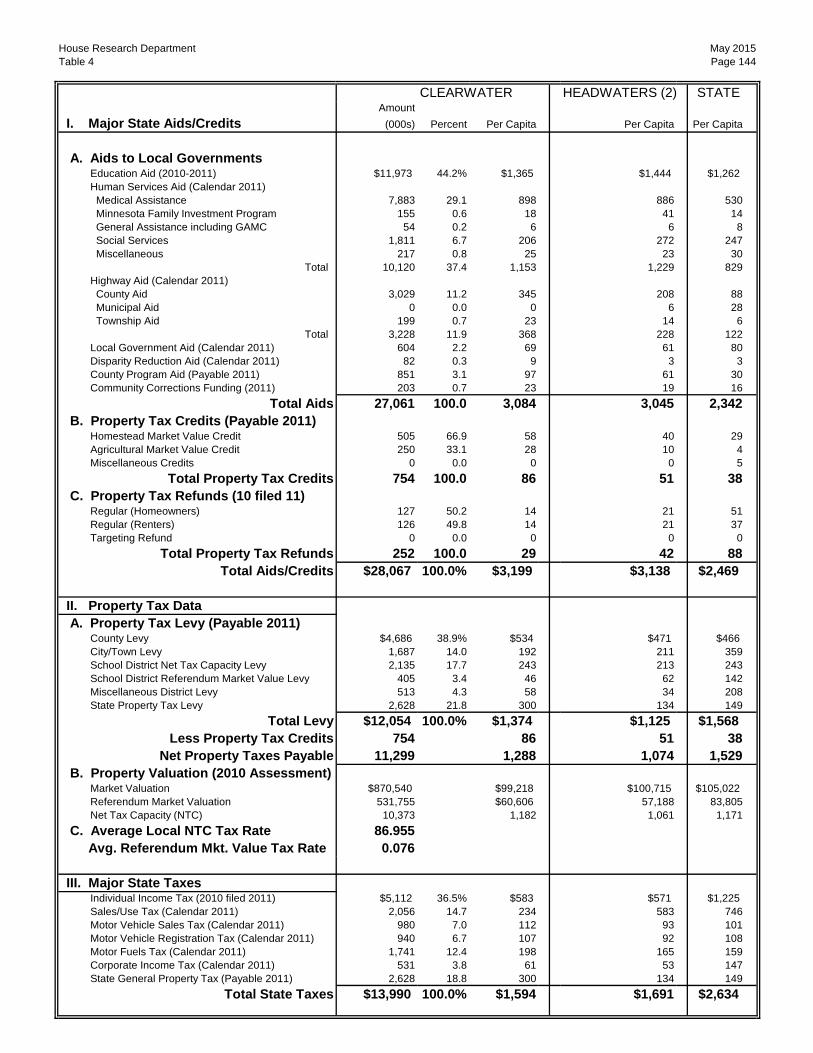
House Research Department May 2015Table 4 Page 144
CLEARWATER HEADWATERS (2) STATEAmount
I. Major State Aids/Credits (000s) Percent Per Capita Per Capita Per Capita
A. Aids to Local Governments Education Aid (2010-2011) $11,973 44.2% $1,365 $1,444 $1,262 Human Services Aid (Calendar 2011) Medical Assistance 7,883 29.1 898 886 530 Minnesota Family Investment Program 155 0.6 18 41 14 General Assistance including GAMC 54 0.2 6 6 8 Social Services 1,811 6.7 206 272 247 Miscellaneous 217 0.8 25 23 30
Total 10,120 37.4 1,153 1,229 829 Highway Aid (Calendar 2011) County Aid 3,029 11.2 345 208 88 Municipal Aid 0 0.0 0 6 28 Township Aid 199 0.7 23 14 6
Total 3,228 11.9 368 228 122 Local Government Aid (Calendar 2011) 604 2.2 69 61 80 Disparity Reduction Aid (Calendar 2011) 82 0.3 9 3 3 County Program Aid (Payable 2011) 851 3.1 97 61 30 Community Corrections Funding (2011) 203 0.7 23 19 16
Total Aids 27,061 100.0 3,084 3,045 2,342 B. Property Tax Credits (Payable 2011) Homestead Market Value Credit 505 66.9 58 40 29 Agricultural Market Value Credit 250 33.1 28 10 4 Miscellaneous Credits 0 0.0 0 0 5
Total Property Tax Credits 754 100.0 86 51 38 C. Property Tax Refunds (10 filed 11) Regular (Homeowners) 127 50.2 14 21 51 Regular (Renters) 126 49.8 14 21 37 Targeting Refund 0 0.0 0 0 0
Total Property Tax Refunds 252 100.0 29 42 88 Total Aids/Credits $28,067 100.0% $3,199 $3,138 $2,469
II. Property Tax Data A. Property Tax Levy (Payable 2011) County Levy $4,686 38.9% $534 $471 $466 City/Town Levy 1,687 14.0 192 211 359 School District Net Tax Capacity Levy 2,135 17.7 243 213 243 School District Referendum Market Value Levy 405 3.4 46 62 142 Miscellaneous District Levy 513 4.3 58 34 208 State Property Tax Levy 2,628 21.8 300 134 149
Total Levy $12,054 100.0% $1,374 $1,125 $1,568 Less Property Tax Credits 754 86 51 38
Net Property Taxes Payable 11,299 1,288 1,074 1,529 B. Property Valuation (2010 Assessment) Market Valuation $870,540 $99,218 $100,715 $105,022 Referendum Market Valuation 531,755 $60,606 57,188 83,805 Net Tax Capacity (NTC) 10,373 1,182 1,061 1,171 C. Average Local NTC Tax Rate 86.955 Avg. Referendum Mkt. Value Tax Rate 0.076
III. Major State Taxes Individual Income Tax (2010 filed 2011) $5,112 36.5% $583 $571 $1,225 Sales/Use Tax (Calendar 2011) 2,056 14.7 234 583 746 Motor Vehicle Sales Tax (Calendar 2011) 980 7.0 112 93 101 Motor Vehicle Registration Tax (Calendar 2011) 940 6.7 107 92 108 Motor Fuels Tax (Calendar 2011) 1,741 12.4 198 165 159 Corporate Income Tax (Calendar 2011) 531 3.8 61 53 147 State General Property Tax (Payable 2011) 2,628 18.8 300 134 149
Total State Taxes $13,990 100.0% $1,594 $1,691 $2,634
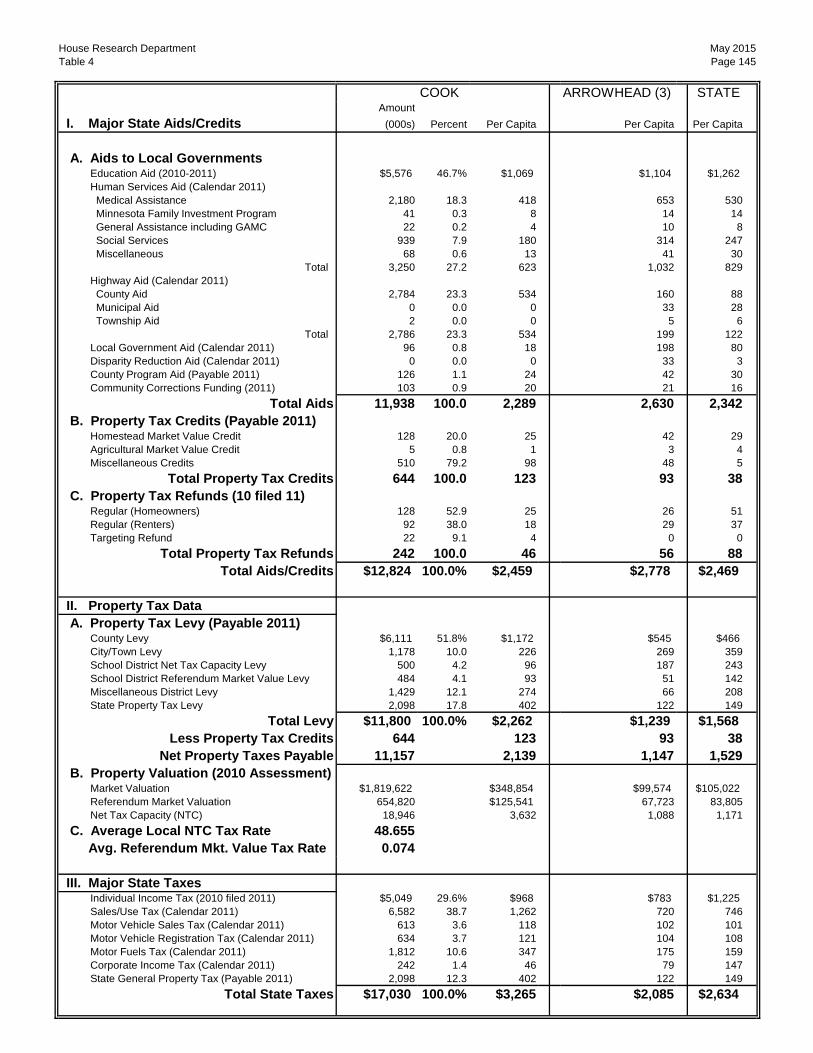
House Research Department May 2015Table 4 Page 145
COOK ARROWHEAD (3) STATEAmount
I. Major State Aids/Credits (000s) Percent Per Capita Per Capita Per Capita
A. Aids to Local Governments Education Aid (2010-2011) $5,576 46.7% $1,069 $1,104 $1,262 Human Services Aid (Calendar 2011) Medical Assistance 2,180 18.3 418 653 530 Minnesota Family Investment Program 41 0.3 8 14 14 General Assistance including GAMC 22 0.2 4 10 8 Social Services 939 7.9 180 314 247 Miscellaneous 68 0.6 13 41 30
Total 3,250 27.2 623 1,032 829 Highway Aid (Calendar 2011) County Aid 2,784 23.3 534 160 88 Municipal Aid 0 0.0 0 33 28 Township Aid 2 0.0 0 5 6
Total 2,786 23.3 534 199 122 Local Government Aid (Calendar 2011) 96 0.8 18 198 80 Disparity Reduction Aid (Calendar 2011) 0 0.0 0 33 3 County Program Aid (Payable 2011) 126 1.1 24 42 30 Community Corrections Funding (2011) 103 0.9 20 21 16
Total Aids 11,938 100.0 2,289 2,630 2,342 B. Property Tax Credits (Payable 2011) Homestead Market Value Credit 128 20.0 25 42 29 Agricultural Market Value Credit 5 0.8 1 3 4 Miscellaneous Credits 510 79.2 98 48 5
Total Property Tax Credits 644 100.0 123 93 38 C. Property Tax Refunds (10 filed 11) Regular (Homeowners) 128 52.9 25 26 51 Regular (Renters) 92 38.0 18 29 37 Targeting Refund 22 9.1 4 0 0
Total Property Tax Refunds 242 100.0 46 56 88 Total Aids/Credits $12,824 100.0% $2,459 $2,778 $2,469
II. Property Tax Data A. Property Tax Levy (Payable 2011) County Levy $6,111 51.8% $1,172 $545 $466 City/Town Levy 1,178 10.0 226 269 359 School District Net Tax Capacity Levy 500 4.2 96 187 243 School District Referendum Market Value Levy 484 4.1 93 51 142 Miscellaneous District Levy 1,429 12.1 274 66 208 State Property Tax Levy 2,098 17.8 402 122 149
Total Levy $11,800 100.0% $2,262 $1,239 $1,568 Less Property Tax Credits 644 123 93 38
Net Property Taxes Payable 11,157 2,139 1,147 1,529 B. Property Valuation (2010 Assessment) Market Valuation $1,819,622 $348,854 $99,574 $105,022 Referendum Market Valuation 654,820 $125,541 67,723 83,805 Net Tax Capacity (NTC) 18,946 3,632 1,088 1,171 C. Average Local NTC Tax Rate 48.655 Avg. Referendum Mkt. Value Tax Rate 0.074
III. Major State Taxes Individual Income Tax (2010 filed 2011) $5,049 29.6% $968 $783 $1,225 Sales/Use Tax (Calendar 2011) 6,582 38.7 1,262 720 746 Motor Vehicle Sales Tax (Calendar 2011) 613 3.6 118 102 101 Motor Vehicle Registration Tax (Calendar 2011) 634 3.7 121 104 108 Motor Fuels Tax (Calendar 2011) 1,812 10.6 347 175 159 Corporate Income Tax (Calendar 2011) 242 1.4 46 79 147 State General Property Tax (Payable 2011) 2,098 12.3 402 122 149
Total State Taxes $17,030 100.0% $3,265 $2,085 $2,634
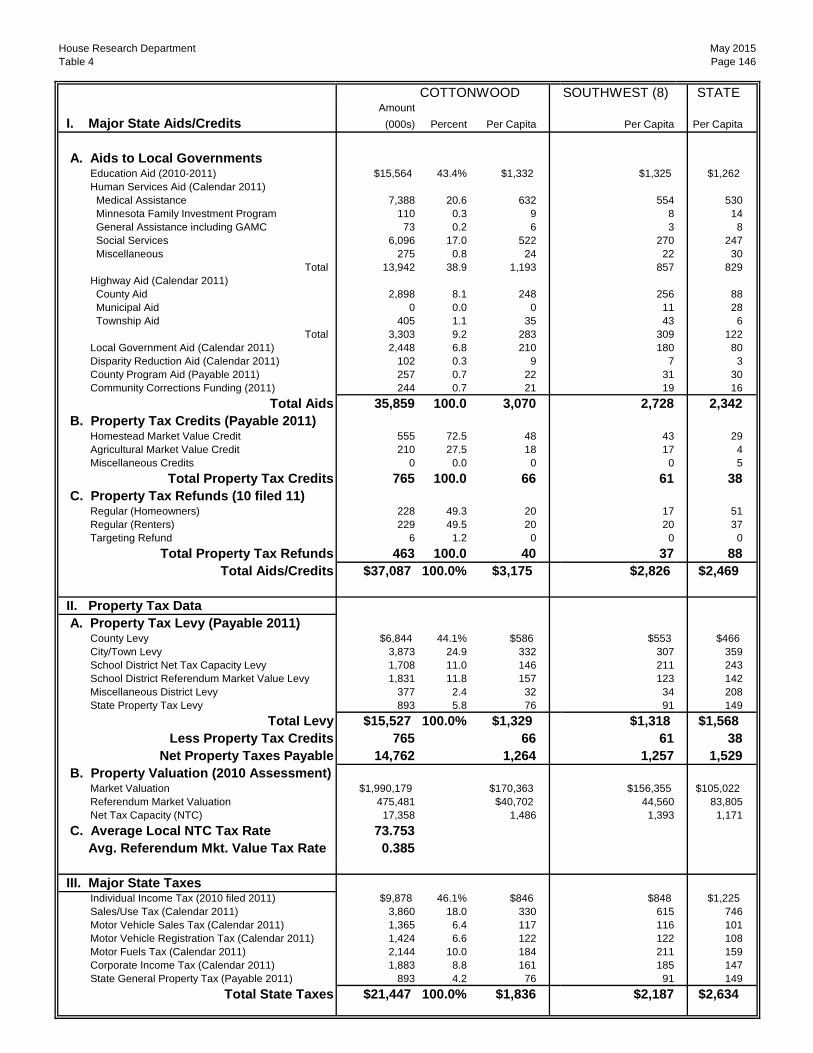
House Research Department May 2015Table 4 Page 146
COTTONWOOD SOUTHWEST (8) STATEAmount
I. Major State Aids/Credits (000s) Percent Per Capita Per Capita Per Capita
A. Aids to Local Governments Education Aid (2010-2011) $15,564 43.4% $1,332 $1,325 $1,262 Human Services Aid (Calendar 2011) Medical Assistance 7,388 20.6 632 554 530 Minnesota Family Investment Program 110 0.3 9 8 14 General Assistance including GAMC 73 0.2 6 3 8 Social Services 6,096 17.0 522 270 247 Miscellaneous 275 0.8 24 22 30
Total 13,942 38.9 1,193 857 829 Highway Aid (Calendar 2011) County Aid 2,898 8.1 248 256 88 Municipal Aid 0 0.0 0 11 28 Township Aid 405 1.1 35 43 6
Total 3,303 9.2 283 309 122 Local Government Aid (Calendar 2011) 2,448 6.8 210 180 80 Disparity Reduction Aid (Calendar 2011) 102 0.3 9 7 3 County Program Aid (Payable 2011) 257 0.7 22 31 30 Community Corrections Funding (2011) 244 0.7 21 19 16
Total Aids 35,859 100.0 3,070 2,728 2,342 B. Property Tax Credits (Payable 2011) Homestead Market Value Credit 555 72.5 48 43 29 Agricultural Market Value Credit 210 27.5 18 17 4 Miscellaneous Credits 0 0.0 0 0 5
Total Property Tax Credits 765 100.0 66 61 38 C. Property Tax Refunds (10 filed 11) Regular (Homeowners) 228 49.3 20 17 51 Regular (Renters) 229 49.5 20 20 37 Targeting Refund 6 1.2 0 0 0
Total Property Tax Refunds 463 100.0 40 37 88 Total Aids/Credits $37,087 100.0% $3,175 $2,826 $2,469
II. Property Tax Data A. Property Tax Levy (Payable 2011) County Levy $6,844 44.1% $586 $553 $466 City/Town Levy 3,873 24.9 332 307 359 School District Net Tax Capacity Levy 1,708 11.0 146 211 243 School District Referendum Market Value Levy 1,831 11.8 157 123 142 Miscellaneous District Levy 377 2.4 32 34 208 State Property Tax Levy 893 5.8 76 91 149
Total Levy $15,527 100.0% $1,329 $1,318 $1,568 Less Property Tax Credits 765 66 61 38
Net Property Taxes Payable 14,762 1,264 1,257 1,529 B. Property Valuation (2010 Assessment) Market Valuation $1,990,179 $170,363 $156,355 $105,022 Referendum Market Valuation 475,481 $40,702 44,560 83,805 Net Tax Capacity (NTC) 17,358 1,486 1,393 1,171 C. Average Local NTC Tax Rate 73.753 Avg. Referendum Mkt. Value Tax Rate 0.385
III. Major State Taxes Individual Income Tax (2010 filed 2011) $9,878 46.1% $846 $848 $1,225 Sales/Use Tax (Calendar 2011) 3,860 18.0 330 615 746 Motor Vehicle Sales Tax (Calendar 2011) 1,365 6.4 117 116 101 Motor Vehicle Registration Tax (Calendar 2011) 1,424 6.6 122 122 108 Motor Fuels Tax (Calendar 2011) 2,144 10.0 184 211 159 Corporate Income Tax (Calendar 2011) 1,883 8.8 161 185 147 State General Property Tax (Payable 2011) 893 4.2 76 91 149
Total State Taxes $21,447 100.0% $1,836 $2,187 $2,634

House Research Department May 2015Table 4 Page 147
CROW WING FIVE (5) STATEAmount
I. Major State Aids/Credits (000s) Percent Per Capita Per Capita Per Capita
A. Aids to Local Governments Education Aid (2010-2011) $74,270 53.2% $1,184 $1,273 $1,262 Human Services Aid (Calendar 2011) Medical Assistance 33,899 24.3 540 642 530 Minnesota Family Investment Program 510 0.4 8 11 14 General Assistance including GAMC 254 0.2 4 3 8 Social Services 15,201 10.9 242 247 247 Miscellaneous 1,902 1.4 30 26 30
Total 51,766 37.1 825 929 829 Highway Aid (Calendar 2011) County Aid 5,095 3.7 81 132 88 Municipal Aid 1,793 1.3 29 14 28 Township Aid 398 0.3 6 13 6
Total 7,285 5.2 116 158 122 Local Government Aid (Calendar 2011) 4,525 3.2 72 79 80 Disparity Reduction Aid (Calendar 2011) 34 0.0 1 2 3 County Program Aid (Payable 2011) 604 0.4 10 26 30 Community Corrections Funding (2011) 1,007 0.7 16 17 16
Total Aids 139,491 100.0 2,223 2,485 2,342 B. Property Tax Credits (Payable 2011) Homestead Market Value Credit 2,050 59.4 33 44 29 Agricultural Market Value Credit 233 6.8 4 13 4 Miscellaneous Credits 1,169 33.9 19 8 5
Total Property Tax Credits 3,452 100.0 55 65 38 C. Property Tax Refunds (10 filed 11) Regular (Homeowners) 2,028 50.9 32 33 51 Regular (Renters) 1,946 48.8 31 25 37 Targeting Refund 14 0.3 0 0 0
Total Property Tax Refunds 3,988 100.0 64 58 88 Total Aids/Credits $146,931 100.0% $2,342 $2,608 $2,469
II. Property Tax Data A. Property Tax Levy (Payable 2011) County Levy $35,628 34.2% $568 $561 $466 City/Town Levy 28,209 27.1 450 330 359 School District Net Tax Capacity Levy 18,034 17.3 287 223 243 School District Referendum Market Value Levy 3,583 3.4 57 66 142 Miscellaneous District Levy 2,904 2.8 46 29 208 State Property Tax Levy 15,878 15.2 253 176 149
Total Levy $104,236 100.0% $1,661 $1,386 $1,568 Less Property Tax Credits 3,452 55 65 38
Net Property Taxes Payable 100,784 1,606 1,322 1,529 B. Property Valuation (2010 Assessment) Market Valuation $11,189,216 $178,328 $150,534 $105,022 Referendum Market Valuation 6,212,879 $99,018 76,762 83,805 Net Tax Capacity (NTC) 121,782 1,941 1,557 1,171 C. Average Local NTC Tax Rate 69.612 Avg. Referendum Mkt. Value Tax Rate 0.058
III. Major State Taxes Individual Income Tax (2010 filed 2011) $48,451 32.1% $772 $674 $1,225 Sales/Use Tax (Calendar 2011) 56,056 37.1 893 581 746 Motor Vehicle Sales Tax (Calendar 2011) 6,890 4.6 110 106 101 Motor Vehicle Registration Tax (Calendar 2011) 7,025 4.6 112 105 108 Motor Fuels Tax (Calendar 2011) 11,949 7.9 190 201 159 Corporate Income Tax (Calendar 2011) 4,886 3.2 78 69 147 State General Property Tax (Payable 2011) 15,878 10.5 253 176 149
Total State Taxes $151,135 100.0% $2,409 $1,912 $2,634

House Research Department May 2015Table 4 Page 148
DAKOTA METRO (11) STATEAmount
I. Major State Aids/Credits (000s) Percent Per Capita Per Capita Per Capita
A. Aids to Local Governments Education Aid (2010-2011) $532,305 66.0% $1,327 $1,307 $1,262 Human Services Aid (Calendar 2011) Medical Assistance 131,313 16.3 327 542 530 Minnesota Family Investment Program 2,919 0.4 7 17 14 General Assistance including GAMC 1,503 0.2 4 10 8 Social Services 86,323 10.7 215 246 247 Miscellaneous 5,808 0.7 14 36 30
Total 227,866 28.2 568 851 829 Highway Aid (Calendar 2011) County Aid 12,608 1.6 31 38 88 Municipal Aid 13,913 1.7 35 33 28 Township Aid 339 0.0 1 0 6
Total 26,860 3.3 67 71 122 Local Government Aid (Calendar 2011) 2,556 0.3 6 46 80 Disparity Reduction Aid (Calendar 2011) 5 0.0 0 0 3 County Program Aid (Payable 2011) 12,631 1.6 31 23 30 Community Corrections Funding (2011) 4,725 0.6 12 14 16
Total Aids 806,949 100.0 2,011 2,314 2,342 B. Property Tax Credits (Payable 2011) Homestead Market Value Credit 9,255 95.9 23 20 29 Agricultural Market Value Credit 221 2.3 1 0 4 Miscellaneous Credits 173 1.8 0 0 5
Total Property Tax Credits 9,649 100.0 24 21 38 C. Property Tax Refunds (10 filed 11) Regular (Homeowners) 19,415 55.7 48 67 51 Regular (Renters) 15,436 44.3 38 45 37 Targeting Refund 9 0.0 0 0 0
Total Property Tax Refunds 34,861 100.0 87 113 88 Total Aids/Credits $851,459 100.0% $2,122 $2,447 $2,469
II. Property Tax Data A. Property Tax Levy (Payable 2011) County Levy $113,497 18.4% $283 $424 $466 City/Town Levy 156,960 25.5 391 407 359 School District Net Tax Capacity Levy 104,723 17.0 261 267 243 School District Referendum Market Value Levy 75,888 12.3 189 187 142 Miscellaneous District Levy 101,383 16.5 253 352 208 State Property Tax Levy 63,596 10.3 159 181 149
Total Levy $616,047 100.0% $1,535 $1,818 $1,568 Less Property Tax Credits 9,649 24 21 38
Net Property Taxes Payable 606,398 1,511 1,797 1,529 B. Property Valuation (2010 Assessment) Market Valuation $38,259,659 $95,358 $101,259 $105,022 Referendum Market Valuation 37,262,010 $92,872 99,620 83,805 Net Tax Capacity (NTC) 450,413 1,123 1,219 1,171 C. Average Local NTC Tax Rate 104.538 Avg. Referendum Mkt. Value Tax Rate 0.219
III. Major State Taxes Individual Income Tax (2010 filed 2011) $572,325 50.8% $1,426 $1,519 $1,225 Sales/Use Tax (Calendar 2011) 287,053 25.5 715 888 746 Motor Vehicle Sales Tax (Calendar 2011) 41,895 3.7 104 98 101 Motor Vehicle Registration Tax (Calendar 2011) 46,621 4.1 116 108 108 Motor Fuels Tax (Calendar 2011) 57,522 5.1 143 138 159 Corporate Income Tax (Calendar 2011) 57,467 5.1 143 187 147 State General Property Tax (Payable 2011) 63,596 5.6 159 181 149
Total State Taxes $1,126,478 100.0% $2,808 $3,119 $2,634

House Research Department May 2015Table 4 Page 149
DODGE SE MN (10) STATEAmount
I. Major State Aids/Credits (000s) Percent Per Capita Per Capita Per Capita
A. Aids to Local Governments Education Aid (2010-2011) $28,466 60.3% $1,406 $1,187 $1,262 Human Services Aid (Calendar 2011) Medical Assistance 7,021 14.9 347 418 530 Minnesota Family Investment Program 139 0.3 7 9 14 General Assistance including GAMC 60 0.1 3 3 8 Social Services 3,610 7.6 178 246 247 Miscellaneous 325 0.7 16 20 30
Total 11,155 23.6 551 696 829 Highway Aid (Calendar 2011) County Aid 3,511 7.4 173 110 88 Municipal Aid 192 0.4 10 29 28 Township Aid 249 0.5 12 9 6
Total 3,952 8.4 195 148 122 Local Government Aid (Calendar 2011) 2,381 5.0 118 114 80 Disparity Reduction Aid (Calendar 2011) 324 0.7 16 3 3 County Program Aid (Payable 2011) 742 1.6 37 41 30 Community Corrections Funding (2011) 212 0.4 10 15 16
Total Aids 47,232 100.0 2,333 2,204 2,342 B. Property Tax Credits (Payable 2011) Homestead Market Value Credit 891 80.2 44 39 29 Agricultural Market Value Credit 211 19.0 10 7 4 Miscellaneous Credits 9 0.8 0 1 5
Total Property Tax Credits 1,111 100.0 55 47 38 C. Property Tax Refunds (10 filed 11) Regular (Homeowners) 638 63.5 32 34 51 Regular (Renters) 364 36.2 18 28 37 Targeting Refund 3 0.3 0 0 0
Total Property Tax Refunds 1,005 100.0 50 62 88 Total Aids/Credits $49,349 100.0% $2,438 $2,313 $2,469
II. Property Tax Data A. Property Tax Levy (Payable 2011) County Levy $9,850 40.1% $487 $474 $466 City/Town Levy 6,565 26.7 324 339 359 School District Net Tax Capacity Levy 5,154 21.0 255 215 243 School District Referendum Market Value Levy 1,516 6.2 75 115 142 Miscellaneous District Levy 506 2.1 25 27 208 State Property Tax Levy 996 4.1 49 105 149
Total Levy $24,587 100.0% $1,215 $1,274 $1,568 Less Property Tax Credits 1,111 55 47 38
Net Property Taxes Payable 23,476 1,160 1,227 1,529 B. Property Valuation (2010 Assessment) Market Valuation $2,280,032 $112,633 $96,697 $105,022 Referendum Market Valuation 1,194,092 $58,988 68,917 83,805 Net Tax Capacity (NTC) 21,193 1,047 1,003 1,171 C. Average Local NTC Tax Rate 104.163 Avg. Referendum Mkt. Value Tax Rate 0.127
III. Major State Taxes Individual Income Tax (2010 filed 2011) $19,704 56.6% $973 $1,052 $1,225 Sales/Use Tax (Calendar 2011) 4,796 13.8 237 568 746 Motor Vehicle Sales Tax (Calendar 2011) 2,145 6.2 106 102 101 Motor Vehicle Registration Tax (Calendar 2011) 2,172 6.2 107 106 108 Motor Fuels Tax (Calendar 2011) 3,129 9.0 155 171 159 Corporate Income Tax (Calendar 2011) 1,846 5.3 91 98 147 State General Property Tax (Payable 2011) 996 2.9 49 105 149
Total State Taxes $34,788 100.0% $1,719 $2,201 $2,634
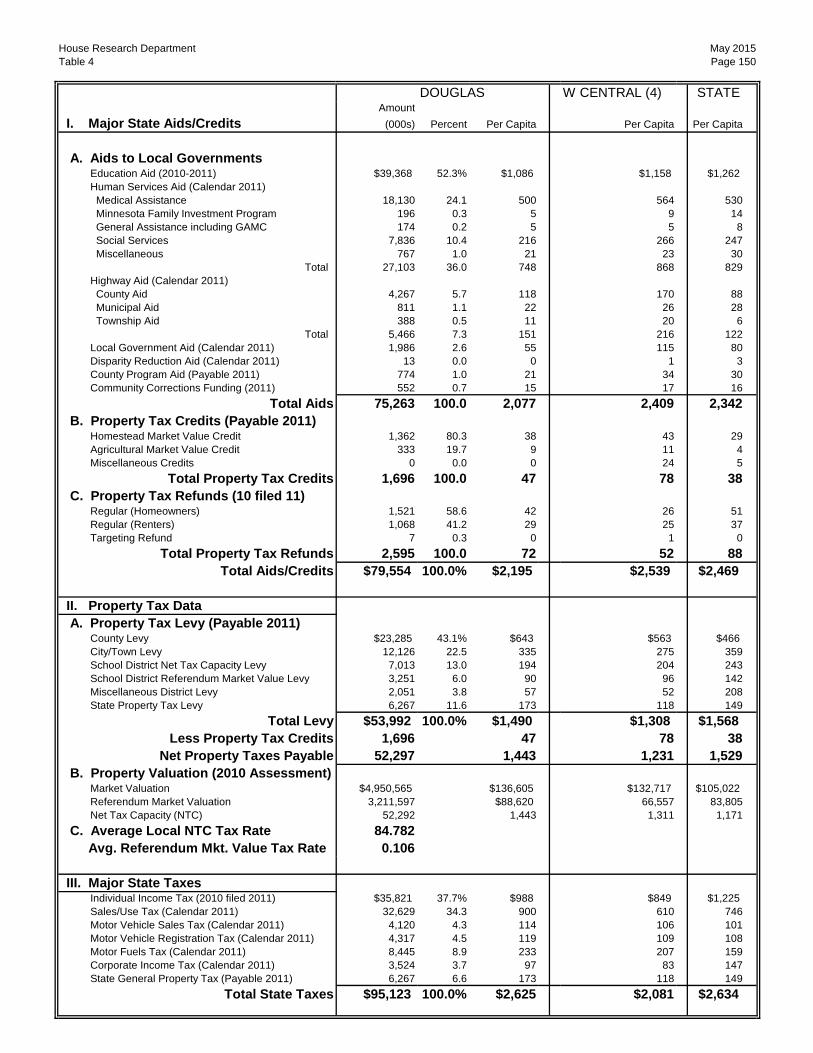
House Research Department May 2015Table 4 Page 150
DOUGLAS W CENTRAL (4) STATEAmount
I. Major State Aids/Credits (000s) Percent Per Capita Per Capita Per Capita
A. Aids to Local Governments Education Aid (2010-2011) $39,368 52.3% $1,086 $1,158 $1,262 Human Services Aid (Calendar 2011) Medical Assistance 18,130 24.1 500 564 530 Minnesota Family Investment Program 196 0.3 5 9 14 General Assistance including GAMC 174 0.2 5 5 8 Social Services 7,836 10.4 216 266 247 Miscellaneous 767 1.0 21 23 30
Total 27,103 36.0 748 868 829 Highway Aid (Calendar 2011) County Aid 4,267 5.7 118 170 88 Municipal Aid 811 1.1 22 26 28 Township Aid 388 0.5 11 20 6
Total 5,466 7.3 151 216 122 Local Government Aid (Calendar 2011) 1,986 2.6 55 115 80 Disparity Reduction Aid (Calendar 2011) 13 0.0 0 1 3 County Program Aid (Payable 2011) 774 1.0 21 34 30 Community Corrections Funding (2011) 552 0.7 15 17 16
Total Aids 75,263 100.0 2,077 2,409 2,342 B. Property Tax Credits (Payable 2011) Homestead Market Value Credit 1,362 80.3 38 43 29 Agricultural Market Value Credit 333 19.7 9 11 4 Miscellaneous Credits 0 0.0 0 24 5
Total Property Tax Credits 1,696 100.0 47 78 38 C. Property Tax Refunds (10 filed 11) Regular (Homeowners) 1,521 58.6 42 26 51 Regular (Renters) 1,068 41.2 29 25 37 Targeting Refund 7 0.3 0 1 0
Total Property Tax Refunds 2,595 100.0 72 52 88 Total Aids/Credits $79,554 100.0% $2,195 $2,539 $2,469
II. Property Tax Data A. Property Tax Levy (Payable 2011) County Levy $23,285 43.1% $643 $563 $466 City/Town Levy 12,126 22.5 335 275 359 School District Net Tax Capacity Levy 7,013 13.0 194 204 243 School District Referendum Market Value Levy 3,251 6.0 90 96 142 Miscellaneous District Levy 2,051 3.8 57 52 208 State Property Tax Levy 6,267 11.6 173 118 149
Total Levy $53,992 100.0% $1,490 $1,308 $1,568 Less Property Tax Credits 1,696 47 78 38
Net Property Taxes Payable 52,297 1,443 1,231 1,529 B. Property Valuation (2010 Assessment) Market Valuation $4,950,565 $136,605 $132,717 $105,022 Referendum Market Valuation 3,211,597 $88,620 66,557 83,805 Net Tax Capacity (NTC) 52,292 1,443 1,311 1,171 C. Average Local NTC Tax Rate 84.782 Avg. Referendum Mkt. Value Tax Rate 0.106
III. Major State Taxes Individual Income Tax (2010 filed 2011) $35,821 37.7% $988 $849 $1,225 Sales/Use Tax (Calendar 2011) 32,629 34.3 900 610 746 Motor Vehicle Sales Tax (Calendar 2011) 4,120 4.3 114 106 101 Motor Vehicle Registration Tax (Calendar 2011) 4,317 4.5 119 109 108 Motor Fuels Tax (Calendar 2011) 8,445 8.9 233 207 159 Corporate Income Tax (Calendar 2011) 3,524 3.7 97 83 147 State General Property Tax (Payable 2011) 6,267 6.6 173 118 149
Total State Taxes $95,123 100.0% $2,625 $2,081 $2,634
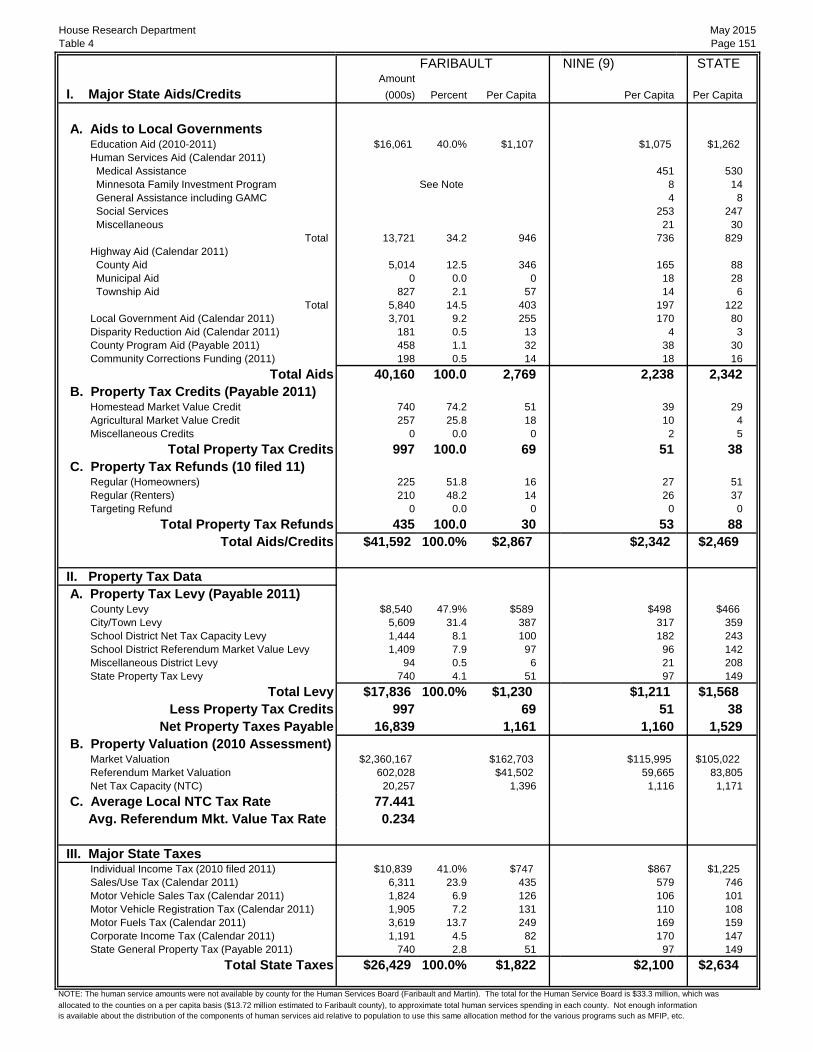
House Research Department May 2015Table 4 Page 151
FARIBAULT NINE (9) STATEAmount
I. Major State Aids/Credits (000s) Percent Per Capita Per Capita Per Capita
A. Aids to Local Governments Education Aid (2010-2011) $16,061 40.0% $1,107 $1,075 $1,262 Human Services Aid (Calendar 2011) Medical Assistance 451 530 Minnesota Family Investment Program See Note 8 14 General Assistance including GAMC 4 8 Social Services 253 247 Miscellaneous 21 30
Total 13,721 34.2 946 736 829 Highway Aid (Calendar 2011) County Aid 5,014 12.5 346 165 88 Municipal Aid 0 0.0 0 18 28 Township Aid 827 2.1 57 14 6
Total 5,840 14.5 403 197 122 Local Government Aid (Calendar 2011) 3,701 9.2 255 170 80 Disparity Reduction Aid (Calendar 2011) 181 0.5 13 4 3 County Program Aid (Payable 2011) 458 1.1 32 38 30 Community Corrections Funding (2011) 198 0.5 14 18 16
Total Aids 40,160 100.0 2,769 2,238 2,342 B. Property Tax Credits (Payable 2011) Homestead Market Value Credit 740 74.2 51 39 29 Agricultural Market Value Credit 257 25.8 18 10 4 Miscellaneous Credits 0 0.0 0 2 5
Total Property Tax Credits 997 100.0 69 51 38 C. Property Tax Refunds (10 filed 11) Regular (Homeowners) 225 51.8 16 27 51 Regular (Renters) 210 48.2 14 26 37 Targeting Refund 0 0.0 0 0 0
Total Property Tax Refunds 435 100.0 30 53 88 Total Aids/Credits $41,592 100.0% $2,867 $2,342 $2,469
II. Property Tax Data A. Property Tax Levy (Payable 2011) County Levy $8,540 47.9% $589 $498 $466 City/Town Levy 5,609 31.4 387 317 359 School District Net Tax Capacity Levy 1,444 8.1 100 182 243 School District Referendum Market Value Levy 1,409 7.9 97 96 142 Miscellaneous District Levy 94 0.5 6 21 208 State Property Tax Levy 740 4.1 51 97 149
Total Levy $17,836 100.0% $1,230 $1,211 $1,568 Less Property Tax Credits 997 69 51 38
Net Property Taxes Payable 16,839 1,161 1,160 1,529 B. Property Valuation (2010 Assessment) Market Valuation $2,360,167 $162,703 $115,995 $105,022 Referendum Market Valuation 602,028 $41,502 59,665 83,805 Net Tax Capacity (NTC) 20,257 1,396 1,116 1,171 C. Average Local NTC Tax Rate 77.441 Avg. Referendum Mkt. Value Tax Rate 0.234
III. Major State Taxes Individual Income Tax (2010 filed 2011) $10,839 41.0% $747 $867 $1,225 Sales/Use Tax (Calendar 2011) 6,311 23.9 435 579 746 Motor Vehicle Sales Tax (Calendar 2011) 1,824 6.9 126 106 101 Motor Vehicle Registration Tax (Calendar 2011) 1,905 7.2 131 110 108 Motor Fuels Tax (Calendar 2011) 3,619 13.7 249 169 159 Corporate Income Tax (Calendar 2011) 1,191 4.5 82 170 147 State General Property Tax (Payable 2011) 740 2.8 51 97 149
Total State Taxes $26,429 100.0% $1,822 $2,100 $2,634
NOTE: The human service amounts were not available by county for the Human Services Board (Faribault and Martin). The total for the Human Service Board is $33.3 million, which wasallocated to the counties on a per capita basis ($13.72 million estimated to Faribault county), to approximate total human services spending in each county. Not enough informationis available about the distribution of the components of human services aid relative to population to use this same allocation method for the various programs such as MFIP, etc.

House Research Department May 2015Table 4 Page 152
FILLMORE SE MN (10) STATEAmount
I. Major State Aids/Credits (000s) Percent Per Capita Per Capita Per Capita
A. Aids to Local Governments Education Aid (2010-2011) $22,270 46.2% $1,067 $1,187 $1,262 Human Services Aid (Calendar 2011) Medical Assistance 10,660 22.1 511 418 530 Minnesota Family Investment Program 118 0.2 6 9 14 General Assistance including GAMC 44 0.1 2 3 8 Social Services 4,099 8.5 196 246 247 Miscellaneous 358 0.7 17 20 30
Total 15,281 31.7 732 696 829 Highway Aid (Calendar 2011) County Aid 5,445 11.3 261 110 88 Municipal Aid 0 0.0 0 29 28 Township Aid 387 0.8 19 9 6
Total 5,832 12.1 279 148 122 Local Government Aid (Calendar 2011) 3,665 7.6 176 114 80 Disparity Reduction Aid (Calendar 2011) 245 0.5 12 3 3 County Program Aid (Payable 2011) 818 1.7 39 41 30 Community Corrections Funding (2011) 59 0.1 3 15 16
Total Aids 48,171 100.0 2,308 2,204 2,342 B. Property Tax Credits (Payable 2011) Homestead Market Value Credit 1,148 73.0 55 39 29 Agricultural Market Value Credit 425 27.0 20 7 4 Miscellaneous Credits 0 0.0 0 1 5
Total Property Tax Credits 1,574 100.0 75 47 38 C. Property Tax Refunds (10 filed 11) Regular (Homeowners) 543 60.3 26 34 51 Regular (Renters) 356 39.6 17 28 37 Targeting Refund 1 0.1 0 0 0
Total Property Tax Refunds 900 100.0 43 62 88 Total Aids/Credits $50,645 100.0% $2,427 $2,313 $2,469
II. Property Tax Data A. Property Tax Levy (Payable 2011) County Levy $8,080 32.7% $387 $474 $466 City/Town Levy 8,066 32.7 387 339 359 School District Net Tax Capacity Levy 4,568 18.5 219 215 243 School District Referendum Market Value Levy 2,320 9.4 111 115 142 Miscellaneous District Levy 441 1.8 21 27 208 State Property Tax Levy 1,225 5.0 59 105 149
Total Levy $24,701 100.0% $1,184 $1,274 $1,568 Less Property Tax Credits 1,574 75 47 38
Net Property Taxes Payable 23,127 1,108 1,227 1,529 B. Property Valuation (2010 Assessment) Market Valuation $2,779,794 $133,208 $96,697 $105,022 Referendum Market Valuation 1,156,069 $55,399 68,917 83,805 Net Tax Capacity (NTC) 24,223 1,161 1,003 1,171 C. Average Local NTC Tax Rate 87.336 Avg. Referendum Mkt. Value Tax Rate 0.201
III. Major State Taxes Individual Income Tax (2010 filed 2011) $14,901 43.1% $714 $1,052 $1,225 Sales/Use Tax (Calendar 2011) 8,381 24.3 402 568 746 Motor Vehicle Sales Tax (Calendar 2011) 2,562 7.4 123 102 101 Motor Vehicle Registration Tax (Calendar 2011) 2,593 7.5 124 106 108 Motor Fuels Tax (Calendar 2011) 3,359 9.7 161 171 159 Corporate Income Tax (Calendar 2011) 1,524 4.4 73 98 147 State General Property Tax (Payable 2011) 1,225 3.5 59 105 149
Total State Taxes $34,545 100.0% $1,655 $2,201 $2,634

House Research Department May 2015Table 4 Page 153
FREEBORN SE MN (10) STATEAmount
I. Major State Aids/Credits (000s) Percent Per Capita Per Capita Per Capita
A. Aids to Local Governments Education Aid (2010-2011) $41,186 50.8% $1,322 $1,187 $1,262 Human Services Aid (Calendar 2011) Medical Assistance 16,691 20.6 536 418 530 Minnesota Family Investment Program 304 0.4 10 9 14 General Assistance including GAMC 83 0.1 3 3 8 Social Services 8,240 10.2 264 246 247 Miscellaneous 372 0.5 12 20 30
Total 25,691 31.7 824 696 829 Highway Aid (Calendar 2011) County Aid 5,186 6.4 166 110 88 Municipal Aid 852 1.1 27 29 28 Township Aid 355 0.4 11 9 6
Total 6,393 7.9 205 148 122 Local Government Aid (Calendar 2011) 5,607 6.9 180 114 80 Disparity Reduction Aid (Calendar 2011) 105 0.1 3 3 3 County Program Aid (Payable 2011) 1,382 1.7 44 41 30 Community Corrections Funding (2011) 726 0.9 23 15 16
Total Aids 81,091 100.0 2,602 2,204 2,342 B. Property Tax Credits (Payable 2011) Homestead Market Value Credit 1,638 81.6 53 39 29 Agricultural Market Value Credit 320 15.9 10 7 4 Miscellaneous Credits 50 2.5 2 1 5
Total Property Tax Credits 2,009 100.0 64 47 38 C. Property Tax Refunds (10 filed 11) Regular (Homeowners) 933 48.2 30 34 51 Regular (Renters) 999 51.6 32 28 37 Targeting Refund 3 0.1 0 0 0
Total Property Tax Refunds 1,934 100.0 62 62 88 Total Aids/Credits $85,034 100.0% $2,729 $2,313 $2,469
II. Property Tax Data A. Property Tax Levy (Payable 2011) County Levy $18,585 44.6% $596 $474 $466 City/Town Levy 8,698 20.9 279 339 359 School District Net Tax Capacity Levy 6,665 16.0 214 215 243 School District Referendum Market Value Levy 4,044 9.7 130 115 142 Miscellaneous District Levy 463 1.1 15 27 208 State Property Tax Levy 3,241 7.8 104 105 149
Total Levy $41,696 100.0% $1,338 $1,274 $1,568 Less Property Tax Credits 2,009 64 47 38
Net Property Taxes Payable 39,687 1,274 1,227 1,529 B. Property Valuation (2010 Assessment) Market Valuation $3,304,167 $106,039 $96,697 $105,022 Referendum Market Valuation 1,623,177 $52,092 68,917 83,805 Net Tax Capacity (NTC) 31,943 1,025 1,003 1,171 C. Average Local NTC Tax Rate 107.725 Avg. Referendum Mkt. Value Tax Rate 0.249
III. Major State Taxes Individual Income Tax (2010 filed 2011) $23,327 37.5% $749 $1,052 $1,225 Sales/Use Tax (Calendar 2011) 17,790 28.6 571 568 746 Motor Vehicle Sales Tax (Calendar 2011) 3,218 5.2 103 102 101 Motor Vehicle Registration Tax (Calendar 2011) 3,235 5.2 104 106 108 Motor Fuels Tax (Calendar 2011) 8,414 13.5 270 171 159 Corporate Income Tax (Calendar 2011) 2,944 4.7 94 98 147 State General Property Tax (Payable 2011) 3,241 5.2 104 105 149
Total State Taxes $62,169 100.0% $1,995 $2,201 $2,634

House Research Department May 2015Table 4 Page 154
GOODHUE SE MN (10) STATEAmount
I. Major State Aids/Credits (000s) Percent Per Capita Per Capita Per Capita
A. Aids to Local Governments Education Aid (2010-2011) $52,246 53.7% $1,132 $1,187 $1,262 Human Services Aid (Calendar 2011) Medical Assistance 18,945 19.5 410 418 530 Minnesota Family Investment Program 342 0.4 7 9 14 General Assistance including GAMC 91 0.1 2 3 8 Social Services 10,191 10.5 221 246 247 Miscellaneous 726 0.7 16 20 30
Total 30,294 31.1 656 696 829 Highway Aid (Calendar 2011) County Aid 5,240 5.4 113 110 88 Municipal Aid 3,821 3.9 83 29 28 Township Aid 656 0.7 14 9 6
Total 9,717 10.0 210 148 122 Local Government Aid (Calendar 2011) 2,889 3.0 63 114 80 Disparity Reduction Aid (Calendar 2011) 90 0.1 2 3 3 County Program Aid (Payable 2011) 1,327 1.4 29 41 30 Community Corrections Funding (2011) 767 0.8 17 15 16
Total Aids 97,329 100.0 2,108 2,204 2,342 B. Property Tax Credits (Payable 2011) Homestead Market Value Credit 1,470 74.6 32 39 29 Agricultural Market Value Credit 499 25.3 11 7 4 Miscellaneous Credits 1 0.1 0 1 5
Total Property Tax Credits 1,971 100.0 43 47 38 C. Property Tax Refunds (10 filed 11) Regular (Homeowners) 2,246 61.6 49 34 51 Regular (Renters) 1,383 38.0 30 28 37 Targeting Refund 15 0.4 0 0 0
Total Property Tax Refunds 3,644 100.0 79 62 88 Total Aids/Credits $102,945 100.0% $2,230 $2,313 $2,469
II. Property Tax Data A. Property Tax Levy (Payable 2011) County Levy $26,158 34.4% $567 $474 $466 City/Town Levy 23,580 31.0 511 339 359 School District Net Tax Capacity Levy 11,269 14.8 244 215 243 School District Referendum Market Value Levy 7,093 9.3 154 115 142 Miscellaneous District Levy 2,375 3.1 51 27 208 State Property Tax Levy 5,490 7.2 119 105 149
Total Levy $75,967 100.0% $1,645 $1,274 $1,568 Less Property Tax Credits 1,971 43 47 38
Net Property Taxes Payable 73,995 1,603 1,227 1,529 B. Property Valuation (2010 Assessment) Market Valuation $5,640,695 $122,178 $96,697 $105,022 Referendum Market Valuation 4,096,260 $88,725 68,917 83,805 Net Tax Capacity (NTC) 60,546 1,311 1,003 1,171 C. Average Local NTC Tax Rate 104.686 Avg. Referendum Mkt. Value Tax Rate 0.173
III. Major State Taxes Individual Income Tax (2010 filed 2011) $47,919 48.9% $1,038 $1,052 $1,225 Sales/Use Tax (Calendar 2011) 19,768 20.2 428 568 746 Motor Vehicle Sales Tax (Calendar 2011) 5,271 5.4 114 102 101 Motor Vehicle Registration Tax (Calendar 2011) 5,463 5.6 118 106 108 Motor Fuels Tax (Calendar 2011) 9,852 10.0 213 171 159 Corporate Income Tax (Calendar 2011) 4,324 4.4 94 98 147 State General Property Tax (Payable 2011) 5,490 5.6 119 105 149
Total State Taxes $98,087 100.0% $2,125 $2,201 $2,634

House Research Department May 2015Table 4 Page 155
GRANT W CENTRAL (4) STATEAmount
I. Major State Aids/Credits (000s) Percent Per Capita Per Capita Per Capita
A. Aids to Local Governments Education Aid (2010-2011) $6,537 39.8% $1,091 $1,158 $1,262 Human Services Aid (Calendar 2011) Medical Assistance 3,577 21.8 597 564 530 Minnesota Family Investment Program 64 0.4 11 9 14 General Assistance including GAMC 24 0.1 4 5 8 Social Services 2,187 13.3 365 266 247 Miscellaneous 92 0.6 15 23 30
Total 5,945 36.2 992 868 829 Highway Aid (Calendar 2011) County Aid 2,428 14.8 405 170 88 Municipal Aid 0 0.0 0 26 28 Township Aid 467 2.8 78 20 6
Total 2,895 17.6 483 216 122 Local Government Aid (Calendar 2011) 807 4.9 135 115 80 Disparity Reduction Aid (Calendar 2011) 13 0.1 2 1 3 County Program Aid (Payable 2011) 125 0.8 21 34 30 Community Corrections Funding (2011) 115 0.7 19 17 16
Total Aids 16,436 100.0 2,743 2,409 2,342 B. Property Tax Credits (Payable 2011) Homestead Market Value Credit 285 68.9 48 43 29 Agricultural Market Value Credit 125 30.1 21 11 4 Miscellaneous Credits 4 1.0 1 24 5
Total Property Tax Credits 414 100.0 69 78 38 C. Property Tax Refunds (10 filed 11) Regular (Homeowners) 182 60.8 30 26 51 Regular (Renters) 113 37.6 19 25 37 Targeting Refund 5 1.6 1 1 0
Total Property Tax Refunds 300 100.0 50 52 88 Total Aids/Credits $17,150 100.0% $2,862 $2,539 $2,469
II. Property Tax Data A. Property Tax Levy (Payable 2011) County Levy $5,094 49.1% $850 $563 $466 City/Town Levy 2,296 22.1 383 275 359 School District Net Tax Capacity Levy 1,172 11.3 195 204 243 School District Referendum Market Value Levy 898 8.7 150 96 142 Miscellaneous District Levy 496 4.8 83 52 208 State Property Tax Levy 411 4.0 69 118 149
Total Levy $10,365 100.0% $1,730 $1,308 $1,568 Less Property Tax Credits 414 69 78 38
Net Property Taxes Payable 9,951 1,660 1,231 1,529 B. Property Valuation (2010 Assessment) Market Valuation $1,195,730 $199,521 $132,717 $105,022 Referendum Market Valuation 278,512 $46,473 66,557 83,805 Net Tax Capacity (NTC) 10,394 1,734 1,311 1,171 C. Average Local NTC Tax Rate 87.140 Avg. Referendum Mkt. Value Tax Rate 0.322
III. Major State Taxes Individual Income Tax (2010 filed 2011) $6,238 47.4% $1,041 $849 $1,225 Sales/Use Tax (Calendar 2011) 2,016 15.3 336 610 746 Motor Vehicle Sales Tax (Calendar 2011) 805 6.1 134 106 101 Motor Vehicle Registration Tax (Calendar 2011) 851 6.5 142 109 108 Motor Fuels Tax (Calendar 2011) 1,914 14.5 319 207 159 Corporate Income Tax (Calendar 2011) 927 7.0 155 83 147 State General Property Tax (Payable 2011) 411 3.1 69 118 149
Total State Taxes $13,162 100.0% $2,196 $2,081 $2,634

House Research Department May 2015Table 4 Page 156
HENNEPIN METRO (11) STATEAmount
I. Major State Aids/Credits (000s) Percent Per Capita Per Capita Per Capita
A. Aids to Local Governments Education Aid (2010-2011) $1,429,907 51.0% $1,229 $1,307 $1,262 Human Services Aid (Calendar 2011) Medical Assistance 759,407 27.1 653 542 530 Minnesota Family Investment Program 21,821 0.8 19 17 14 General Assistance including GAMC 19,967 0.7 17 10 8 Social Services 317,007 11.3 273 246 247 Miscellaneous 67,271 2.4 58 36 30
Total 1,185,473 42.3 1,019 851 829 Highway Aid (Calendar 2011) County Aid 45,094 1.6 39 38 88 Municipal Aid 38,693 1.4 33 33 28 Township Aid 16 0.0 0 0 6
Total 83,803 3.0 72 71 122 Local Government Aid (Calendar 2011) 69,635 2.5 60 46 80 Disparity Reduction Aid (Calendar 2011) 740 0.0 1 0 3 County Program Aid (Payable 2011) 18,333 0.7 16 23 30 Community Corrections Funding (2011) 17,594 0.6 15 14 16
Total Aids 2,805,485 100.0 2,412 2,314 2,342 B. Property Tax Credits (Payable 2011) Homestead Market Value Credit 18,152 98.8 16 20 29 Agricultural Market Value Credit 126 0.7 0 0 4 Miscellaneous Credits 94 0.5 0 0 5
Total Property Tax Credits 18,372 100.0 16 21 38 C. Property Tax Refunds (10 filed 11) Regular (Homeowners) 94,936 60.1 82 67 51 Regular (Renters) 62,056 39.3 53 45 37 Targeting Refund 949 0.6 1 0 0
Total Property Tax Refunds 157,941 100.0 136 113 88 Total Aids/Credits $2,981,798 100.0% $2,564 $2,447 $2,469
II. Property Tax Data A. Property Tax Levy (Payable 2011) County Levy $602,890 23.4% $518 $424 $466 City/Town Levy 597,337 23.2 514 407 359 School District Net Tax Capacity Levy 320,821 12.5 276 267 243 School District Referendum Market Value Levy 242,917 9.4 209 187 142 Miscellaneous District Levy 544,058 21.2 468 352 208 State Property Tax Levy 263,175 10.2 226 181 149
Total Levy $2,571,197 100.0% $2,211 $1,818 $1,568 Less Property Tax Credits 18,372 16 21 38
Net Property Taxes Payable 2,552,824 2,195 1,797 1,529 B. Property Valuation (2010 Assessment) Market Valuation $132,165,414 $113,636 $101,259 $105,022 Referendum Market Valuation 131,250,046 $112,849 99,620 83,805 Net Tax Capacity (NTC) 1,635,528 1,406 1,219 1,171 C. Average Local NTC Tax Rate 125.258 Avg. Referendum Mkt. Value Tax Rate 0.198
III. Major State Taxes Individual Income Tax (2010 filed 2011) $2,108,599 47.1% $1,813 $1,519 $1,225 Sales/Use Tax (Calendar 2011) 1,369,147 30.6 1,177 888 746 Motor Vehicle Sales Tax (Calendar 2011) 112,930 2.5 97 98 101 Motor Vehicle Registration Tax (Calendar 2011) 125,915 2.8 108 108 108 Motor Fuels Tax (Calendar 2011) 163,485 3.7 141 138 159 Corporate Income Tax (Calendar 2011) 331,243 7.4 285 187 147 State General Property Tax (Payable 2011) 263,175 5.9 226 181 149
Total State Taxes $4,474,492 100.0% $3,847 $3,119 $2,634

House Research Department May 2015Table 4 Page 157
HOUSTON SE MN (10) STATEAmount
I. Major State Aids/Credits (000s) Percent Per Capita Per Capita Per Capita
A. Aids to Local Governments Education Aid (2010-2011) $32,466 59.8% $1,715 $1,187 $1,262 Human Services Aid (Calendar 2011) Medical Assistance 7,530 13.9 398 418 530 Minnesota Family Investment Program 178 0.3 9 9 14 General Assistance including GAMC 83 0.2 4 3 8 Social Services 4,645 8.6 245 246 247 Miscellaneous 372 0.7 20 20 30
Total 12,809 23.6 677 696 829 Highway Aid (Calendar 2011) County Aid 4,462 8.2 236 110 88 Municipal Aid 213 0.4 11 29 28 Township Aid 507 0.9 27 9 6
Total 5,183 9.6 274 148 122 Local Government Aid (Calendar 2011) 2,306 4.3 122 114 80 Disparity Reduction Aid (Calendar 2011) 288 0.5 15 3 3 County Program Aid (Payable 2011) 906 1.7 48 41 30 Community Corrections Funding (2011) 293 0.5 16 15 16
Total Aids 54,252 100.0 2,865 2,204 2,342 B. Property Tax Credits (Payable 2011) Homestead Market Value Credit 1,091 77.6 58 39 29 Agricultural Market Value Credit 315 22.4 17 7 4 Miscellaneous Credits 0 0.0 0 1 5
Total Property Tax Credits 1,407 100.0 74 47 38 C. Property Tax Refunds (10 filed 11) Regular (Homeowners) 835 72.4 44 34 51 Regular (Renters) 315 27.3 17 28 37 Targeting Refund 4 0.3 0 0 0
Total Property Tax Refunds 1,153 100.0 61 62 88 Total Aids/Credits $56,812 100.0% $3,001 $2,313 $2,469
II. Property Tax Data A. Property Tax Levy (Payable 2011) County Levy $9,753 41.8% $515 $474 $466 City/Town Levy 6,358 27.3 336 339 359 School District Net Tax Capacity Levy 3,657 15.7 193 215 243 School District Referendum Market Value Levy 2,339 10.0 124 115 142 Miscellaneous District Levy 217 0.9 11 27 208 State Property Tax Levy 985 4.2 52 105 149
Total Levy $23,309 100.0% $1,231 $1,274 $1,568 Less Property Tax Credits 1,407 74 47 38
Net Property Taxes Payable 21,902 1,157 1,227 1,529 B. Property Valuation (2010 Assessment) Market Valuation $1,817,504 $95,997 $96,697 $105,022 Referendum Market Valuation 1,095,736 $57,874 68,917 83,805 Net Tax Capacity (NTC) 16,472 870 1,003 1,171 C. Average Local NTC Tax Rate 121.327 Avg. Referendum Mkt. Value Tax Rate 0.213
III. Major State Taxes Individual Income Tax (2010 filed 2011) $9,717 41.5% $513 $1,052 $1,225 Sales/Use Tax (Calendar 2011) 4,760 20.3 251 568 746 Motor Vehicle Sales Tax (Calendar 2011) 2,192 9.4 116 102 101 Motor Vehicle Registration Tax (Calendar 2011) 2,230 9.5 118 106 108 Motor Fuels Tax (Calendar 2011) 2,849 12.2 150 171 159 Corporate Income Tax (Calendar 2011) 667 2.9 35 98 147 State General Property Tax (Payable 2011) 985 4.2 52 105 149
Total State Taxes $23,399 100.0% $1,236 $2,201 $2,634

House Research Department May 2015Table 4 Page 158
HUBBARD HEADWATERS (2) STATEAmount
I. Major State Aids/Credits (000s) Percent Per Capita Per Capita Per Capita
A. Aids to Local Governments Education Aid (2010-2011) $26,675 55.5% $1,305 $1,444 $1,262 Human Services Aid (Calendar 2011) Medical Assistance 11,817 24.6 578 886 530 Minnesota Family Investment Program 244 0.5 12 41 14 General Assistance including GAMC 67 0.1 3 6 8 Social Services 4,391 9.1 215 272 247 Miscellaneous 389 0.8 19 23 30
Total 16,908 35.2 827 1,229 829 Highway Aid (Calendar 2011) County Aid 3,379 7.0 165 208 88 Municipal Aid 0 0.0 0 6 28 Township Aid 288 0.6 14 14 6
Total 3,667 7.6 179 228 122 Local Government Aid (Calendar 2011) 416 0.9 20 61 80 Disparity Reduction Aid (Calendar 2011) 0 0.0 0 3 3 County Program Aid (Payable 2011) 273 0.6 13 61 30 Community Corrections Funding (2011) 154 0.3 8 19 16
Total Aids 48,093 100.0 2,353 3,045 2,342 B. Property Tax Credits (Payable 2011) Homestead Market Value Credit 923 85.3 45 40 29 Agricultural Market Value Credit 159 14.7 8 10 4 Miscellaneous Credits 0 0.0 0 0 5
Total Property Tax Credits 1,082 100.0 53 51 38 C. Property Tax Refunds (10 filed 11) Regular (Homeowners) 662 62.4 32 21 51 Regular (Renters) 392 37.0 19 21 37 Targeting Refund 6 0.6 0 0 0
Total Property Tax Refunds 1,061 100.0 52 42 88 Total Aids/Credits $50,236 100.0% $2,458 $3,138 $2,469
II. Property Tax Data A. Property Tax Levy (Payable 2011) County Levy $11,660 38.3% $570 $471 $466 City/Town Levy 6,715 22.0 329 211 359 School District Net Tax Capacity Levy 5,857 19.2 287 213 243 School District Referendum Market Value Levy 1,685 5.5 82 62 142 Miscellaneous District Levy 483 1.6 24 34 208 State Property Tax Levy 4,061 13.3 199 134 149
Total Levy $30,460 100.0% $1,490 $1,125 $1,568 Less Property Tax Credits 1,082 53 51 38
Net Property Taxes Payable 29,378 1,437 1,074 1,529 B. Property Valuation (2010 Assessment) Market Valuation $3,564,318 $174,388 $100,715 $105,022 Referendum Market Valuation 1,712,377 $83,780 57,188 83,805 Net Tax Capacity (NTC) 36,972 1,809 1,061 1,171 C. Average Local NTC Tax Rate 66.845 Avg. Referendum Mkt. Value Tax Rate 0.098
III. Major State Taxes Individual Income Tax (2010 filed 2011) $13,481 37.4% $660 $571 $1,225 Sales/Use Tax (Calendar 2011) 9,593 26.6 469 583 746 Motor Vehicle Sales Tax (Calendar 2011) 2,065 5.7 101 93 101 Motor Vehicle Registration Tax (Calendar 2011) 2,023 5.6 99 92 108 Motor Fuels Tax (Calendar 2011) 3,883 10.8 190 165 159 Corporate Income Tax (Calendar 2011) 977 2.7 48 53 147 State General Property Tax (Payable 2011) 4,061 11.3 199 134 149
Total State Taxes $36,084 100.0% $1,765 $1,691 $2,634
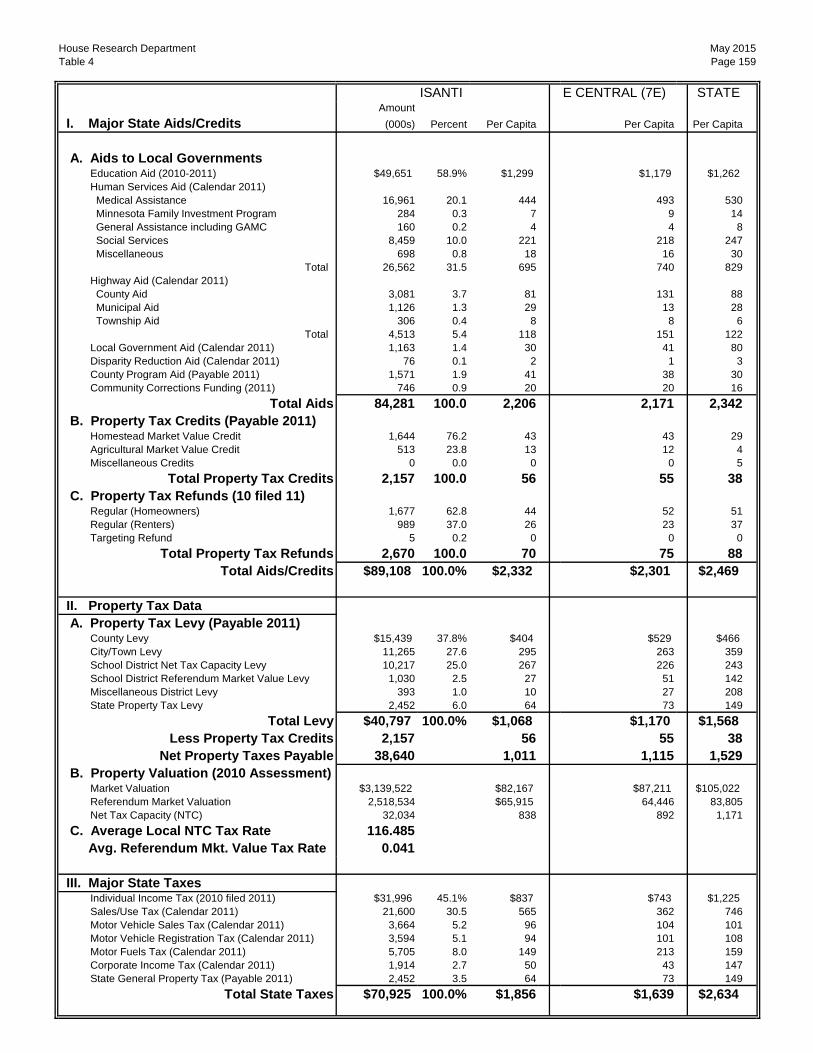
House Research Department May 2015Table 4 Page 159
ISANTI E CENTRAL (7E) STATEAmount
I. Major State Aids/Credits (000s) Percent Per Capita Per Capita Per Capita
A. Aids to Local Governments Education Aid (2010-2011) $49,651 58.9% $1,299 $1,179 $1,262 Human Services Aid (Calendar 2011) Medical Assistance 16,961 20.1 444 493 530 Minnesota Family Investment Program 284 0.3 7 9 14 General Assistance including GAMC 160 0.2 4 4 8 Social Services 8,459 10.0 221 218 247 Miscellaneous 698 0.8 18 16 30
Total 26,562 31.5 695 740 829 Highway Aid (Calendar 2011) County Aid 3,081 3.7 81 131 88 Municipal Aid 1,126 1.3 29 13 28 Township Aid 306 0.4 8 8 6
Total 4,513 5.4 118 151 122 Local Government Aid (Calendar 2011) 1,163 1.4 30 41 80 Disparity Reduction Aid (Calendar 2011) 76 0.1 2 1 3 County Program Aid (Payable 2011) 1,571 1.9 41 38 30 Community Corrections Funding (2011) 746 0.9 20 20 16
Total Aids 84,281 100.0 2,206 2,171 2,342 B. Property Tax Credits (Payable 2011) Homestead Market Value Credit 1,644 76.2 43 43 29 Agricultural Market Value Credit 513 23.8 13 12 4 Miscellaneous Credits 0 0.0 0 0 5
Total Property Tax Credits 2,157 100.0 56 55 38 C. Property Tax Refunds (10 filed 11) Regular (Homeowners) 1,677 62.8 44 52 51 Regular (Renters) 989 37.0 26 23 37 Targeting Refund 5 0.2 0 0 0
Total Property Tax Refunds 2,670 100.0 70 75 88 Total Aids/Credits $89,108 100.0% $2,332 $2,301 $2,469
II. Property Tax Data A. Property Tax Levy (Payable 2011) County Levy $15,439 37.8% $404 $529 $466 City/Town Levy 11,265 27.6 295 263 359 School District Net Tax Capacity Levy 10,217 25.0 267 226 243 School District Referendum Market Value Levy 1,030 2.5 27 51 142 Miscellaneous District Levy 393 1.0 10 27 208 State Property Tax Levy 2,452 6.0 64 73 149
Total Levy $40,797 100.0% $1,068 $1,170 $1,568 Less Property Tax Credits 2,157 56 55 38
Net Property Taxes Payable 38,640 1,011 1,115 1,529 B. Property Valuation (2010 Assessment) Market Valuation $3,139,522 $82,167 $87,211 $105,022 Referendum Market Valuation 2,518,534 $65,915 64,446 83,805 Net Tax Capacity (NTC) 32,034 838 892 1,171 C. Average Local NTC Tax Rate 116.485 Avg. Referendum Mkt. Value Tax Rate 0.041
III. Major State Taxes Individual Income Tax (2010 filed 2011) $31,996 45.1% $837 $743 $1,225 Sales/Use Tax (Calendar 2011) 21,600 30.5 565 362 746 Motor Vehicle Sales Tax (Calendar 2011) 3,664 5.2 96 104 101 Motor Vehicle Registration Tax (Calendar 2011) 3,594 5.1 94 101 108 Motor Fuels Tax (Calendar 2011) 5,705 8.0 149 213 159 Corporate Income Tax (Calendar 2011) 1,914 2.7 50 43 147 State General Property Tax (Payable 2011) 2,452 3.5 64 73 149
Total State Taxes $70,925 100.0% $1,856 $1,639 $2,634

House Research Department May 2015Table 4 Page 160
ITASCA ARROWHEAD (3) STATEAmount
I. Major State Aids/Credits (000s) Percent Per Capita Per Capita Per Capita
A. Aids to Local Governments Education Aid (2010-2011) $52,600 46.5% $1,168 $1,104 $1,262 Human Services Aid (Calendar 2011) Medical Assistance 30,291 26.8 673 653 530 Minnesota Family Investment Program 716 0.6 16 14 14 General Assistance including GAMC 338 0.3 8 10 8 Social Services 13,422 11.9 298 314 247 Miscellaneous 1,303 1.2 29 41 30
Total 46,069 40.8 1,023 1,032 829 Highway Aid (Calendar 2011) County Aid 7,972 7.1 177 160 88 Municipal Aid 769 0.7 17 33 28 Township Aid 221 0.2 5 5 6
Total 8,962 7.9 199 199 122 Local Government Aid (Calendar 2011) 3,140 2.8 70 198 80 Disparity Reduction Aid (Calendar 2011) 289 0.3 6 33 3 County Program Aid (Payable 2011) 1,067 0.9 24 42 30 Community Corrections Funding (2011) 894 0.8 20 21 16
Total Aids 113,021 100.0 2,510 2,630 2,342 B. Property Tax Credits (Payable 2011) Homestead Market Value Credit 2,026 31.5 45 42 29 Agricultural Market Value Credit 174 2.7 4 3 4 Miscellaneous Credits 4,226 65.8 94 48 5
Total Property Tax Credits 6,425 100.0 143 93 38 C. Property Tax Refunds (10 filed 11) Regular (Homeowners) 952 47.8 21 26 51 Regular (Renters) 1,020 51.2 23 29 37 Targeting Refund 20 1.0 0 0 0
Total Property Tax Refunds 1,991 100.0 44 56 88 Total Aids/Credits $121,438 100.0% $2,697 $2,778 $2,469
II. Property Tax Data A. Property Tax Levy (Payable 2011) County Levy $28,177 42.5% $626 $545 $466 City/Town Levy 15,878 24.0 353 269 359 School District Net Tax Capacity Levy 10,857 16.4 241 187 243 School District Referendum Market Value Levy 1,101 1.7 24 51 142 Miscellaneous District Levy 3,418 5.2 76 66 208 State Property Tax Levy 6,822 10.3 151 122 149
Total Levy $66,253 100.0% $1,471 $1,239 $1,568 Less Property Tax Credits 6,425 143 93 38
Net Property Taxes Payable 59,827 1,328 1,147 1,529 B. Property Valuation (2010 Assessment) Market Valuation $5,701,641 $126,607 $99,574 $105,022 Referendum Market Valuation 3,585,173 $79,610 67,723 83,805 Net Tax Capacity (NTC) 63,490 1,410 1,088 1,171 C. Average Local NTC Tax Rate 91.873 Avg. Referendum Mkt. Value Tax Rate 0.031
III. Major State Taxes Individual Income Tax (2010 filed 2011) $31,509 36.9% $700 $783 $1,225 Sales/Use Tax (Calendar 2011) 26,957 31.6 599 720 746 Motor Vehicle Sales Tax (Calendar 2011) 4,788 5.6 106 102 101 Motor Vehicle Registration Tax (Calendar 2011) 4,866 5.7 108 104 108 Motor Fuels Tax (Calendar 2011) 7,594 8.9 169 175 159 Corporate Income Tax (Calendar 2011) 2,763 3.2 61 79 147 State General Property Tax (Payable 2011) 6,822 8.0 151 122 149
Total State Taxes $85,297 100.0% $1,894 $2,085 $2,634
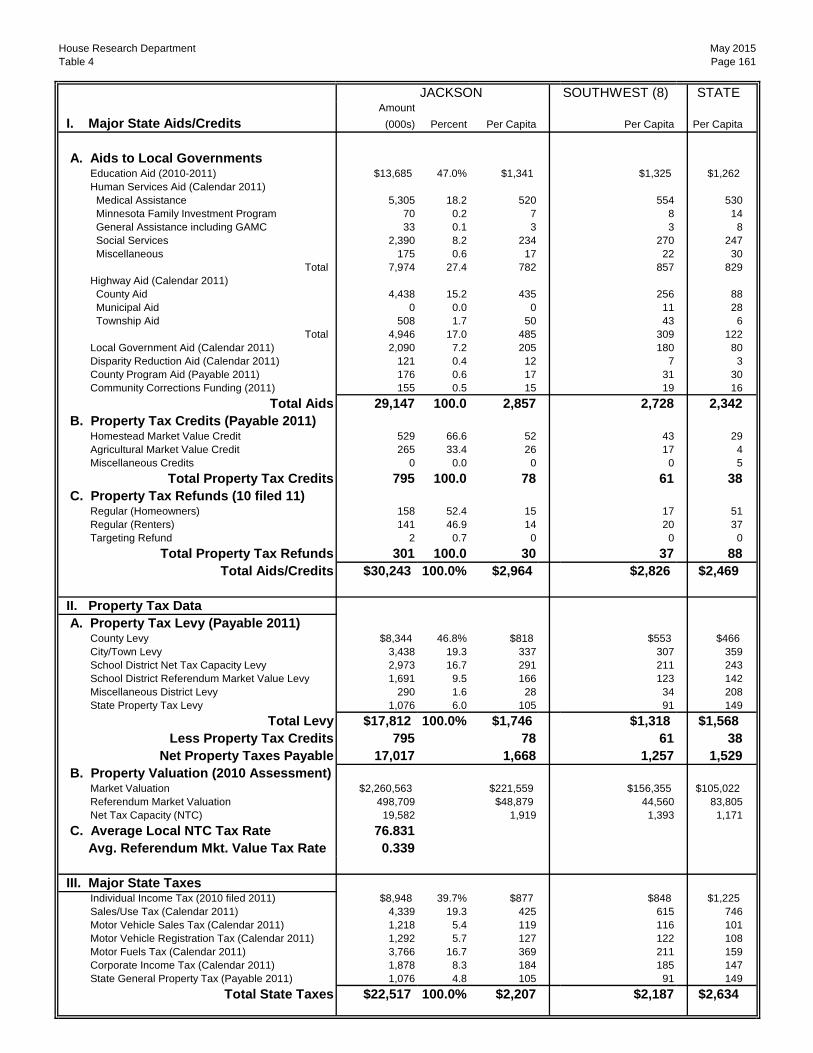
House Research Department May 2015Table 4 Page 161
JACKSON SOUTHWEST (8) STATEAmount
I. Major State Aids/Credits (000s) Percent Per Capita Per Capita Per Capita
A. Aids to Local Governments Education Aid (2010-2011) $13,685 47.0% $1,341 $1,325 $1,262 Human Services Aid (Calendar 2011) Medical Assistance 5,305 18.2 520 554 530 Minnesota Family Investment Program 70 0.2 7 8 14 General Assistance including GAMC 33 0.1 3 3 8 Social Services 2,390 8.2 234 270 247 Miscellaneous 175 0.6 17 22 30
Total 7,974 27.4 782 857 829 Highway Aid (Calendar 2011) County Aid 4,438 15.2 435 256 88 Municipal Aid 0 0.0 0 11 28 Township Aid 508 1.7 50 43 6
Total 4,946 17.0 485 309 122 Local Government Aid (Calendar 2011) 2,090 7.2 205 180 80 Disparity Reduction Aid (Calendar 2011) 121 0.4 12 7 3 County Program Aid (Payable 2011) 176 0.6 17 31 30 Community Corrections Funding (2011) 155 0.5 15 19 16
Total Aids 29,147 100.0 2,857 2,728 2,342 B. Property Tax Credits (Payable 2011) Homestead Market Value Credit 529 66.6 52 43 29 Agricultural Market Value Credit 265 33.4 26 17 4 Miscellaneous Credits 0 0.0 0 0 5
Total Property Tax Credits 795 100.0 78 61 38 C. Property Tax Refunds (10 filed 11) Regular (Homeowners) 158 52.4 15 17 51 Regular (Renters) 141 46.9 14 20 37 Targeting Refund 2 0.7 0 0 0
Total Property Tax Refunds 301 100.0 30 37 88 Total Aids/Credits $30,243 100.0% $2,964 $2,826 $2,469
II. Property Tax Data A. Property Tax Levy (Payable 2011) County Levy $8,344 46.8% $818 $553 $466 City/Town Levy 3,438 19.3 337 307 359 School District Net Tax Capacity Levy 2,973 16.7 291 211 243 School District Referendum Market Value Levy 1,691 9.5 166 123 142 Miscellaneous District Levy 290 1.6 28 34 208 State Property Tax Levy 1,076 6.0 105 91 149
Total Levy $17,812 100.0% $1,746 $1,318 $1,568 Less Property Tax Credits 795 78 61 38
Net Property Taxes Payable 17,017 1,668 1,257 1,529 B. Property Valuation (2010 Assessment) Market Valuation $2,260,563 $221,559 $156,355 $105,022 Referendum Market Valuation 498,709 $48,879 44,560 83,805 Net Tax Capacity (NTC) 19,582 1,919 1,393 1,171 C. Average Local NTC Tax Rate 76.831 Avg. Referendum Mkt. Value Tax Rate 0.339
III. Major State Taxes Individual Income Tax (2010 filed 2011) $8,948 39.7% $877 $848 $1,225 Sales/Use Tax (Calendar 2011) 4,339 19.3 425 615 746 Motor Vehicle Sales Tax (Calendar 2011) 1,218 5.4 119 116 101 Motor Vehicle Registration Tax (Calendar 2011) 1,292 5.7 127 122 108 Motor Fuels Tax (Calendar 2011) 3,766 16.7 369 211 159 Corporate Income Tax (Calendar 2011) 1,878 8.3 184 185 147 State General Property Tax (Payable 2011) 1,076 4.8 105 91 149
Total State Taxes $22,517 100.0% $2,207 $2,187 $2,634

House Research Department May 2015Table 4 Page 162
KANABEC E CENTRAL (7E) STATEAmount
I. Major State Aids/Credits (000s) Percent Per Capita Per Capita Per Capita
A. Aids to Local Governments Education Aid (2010-2011) $19,658 50.0% $1,216 $1,179 $1,262 Human Services Aid (Calendar 2011) Medical Assistance 10,167 25.9 629 493 530 Minnesota Family Investment Program 212 0.5 13 9 14 General Assistance including GAMC 75 0.2 5 4 8 Social Services 4,114 10.5 254 218 247 Miscellaneous 377 1.0 23 16 30
Total 14,945 38.0 924 740 829 Highway Aid (Calendar 2011) County Aid 2,474 6.3 153 131 88 Municipal Aid 56 0.1 3 13 28 Township Aid 148 0.4 9 8 6
Total 2,679 6.8 166 151 122 Local Government Aid (Calendar 2011) 864 2.2 53 41 80 Disparity Reduction Aid (Calendar 2011) 8 0.0 0 1 3 County Program Aid (Payable 2011) 773 2.0 48 38 30 Community Corrections Funding (2011) 393 1.0 24 20 16
Total Aids 39,319 100.0 2,432 2,171 2,342 B. Property Tax Credits (Payable 2011) Homestead Market Value Credit 953 75.0 59 43 29 Agricultural Market Value Credit 317 25.0 20 12 4 Miscellaneous Credits 0 0.0 0 0 5
Total Property Tax Credits 1,270 100.0 79 55 38 C. Property Tax Refunds (10 filed 11) Regular (Homeowners) 769 68.7 48 52 51 Regular (Renters) 348 31.1 22 23 37 Targeting Refund 2 0.2 0 0 0
Total Property Tax Refunds 1,120 100.0 69 75 88 Total Aids/Credits $41,709 100.0% $2,579 $2,301 $2,469
II. Property Tax Data A. Property Tax Levy (Payable 2011) County Levy $10,621 62.2% $657 $529 $466 City/Town Levy 2,154 12.6 133 263 359 School District Net Tax Capacity Levy 2,852 16.7 176 226 243 School District Referendum Market Value Levy 538 3.1 33 51 142 Miscellaneous District Levy 214 1.3 13 27 208 State Property Tax Levy 701 4.1 43 73 149
Total Levy $17,079 100.0% $1,056 $1,170 $1,568 Less Property Tax Credits 1,270 79 55 38
Net Property Taxes Payable 15,808 978 1,115 1,529 B. Property Valuation (2010 Assessment) Market Valuation $1,383,831 $85,580 $87,211 $105,022 Referendum Market Valuation 871,788 $53,914 64,446 83,805 Net Tax Capacity (NTC) 13,154 814 892 1,171 C. Average Local NTC Tax Rate 119.056 Avg. Referendum Mkt. Value Tax Rate 0.082
III. Major State Taxes Individual Income Tax (2010 filed 2011) $9,030 45.7% $558 $743 $1,225 Sales/Use Tax (Calendar 2011) 3,854 19.5 238 362 746 Motor Vehicle Sales Tax (Calendar 2011) 1,509 7.6 93 104 101 Motor Vehicle Registration Tax (Calendar 2011) 1,397 7.1 86 101 108 Motor Fuels Tax (Calendar 2011) 2,709 13.7 168 213 159 Corporate Income Tax (Calendar 2011) 553 2.8 34 43 147 State General Property Tax (Payable 2011) 701 3.6 43 73 149
Total State Taxes $19,753 100.0% $1,222 $1,639 $2,634
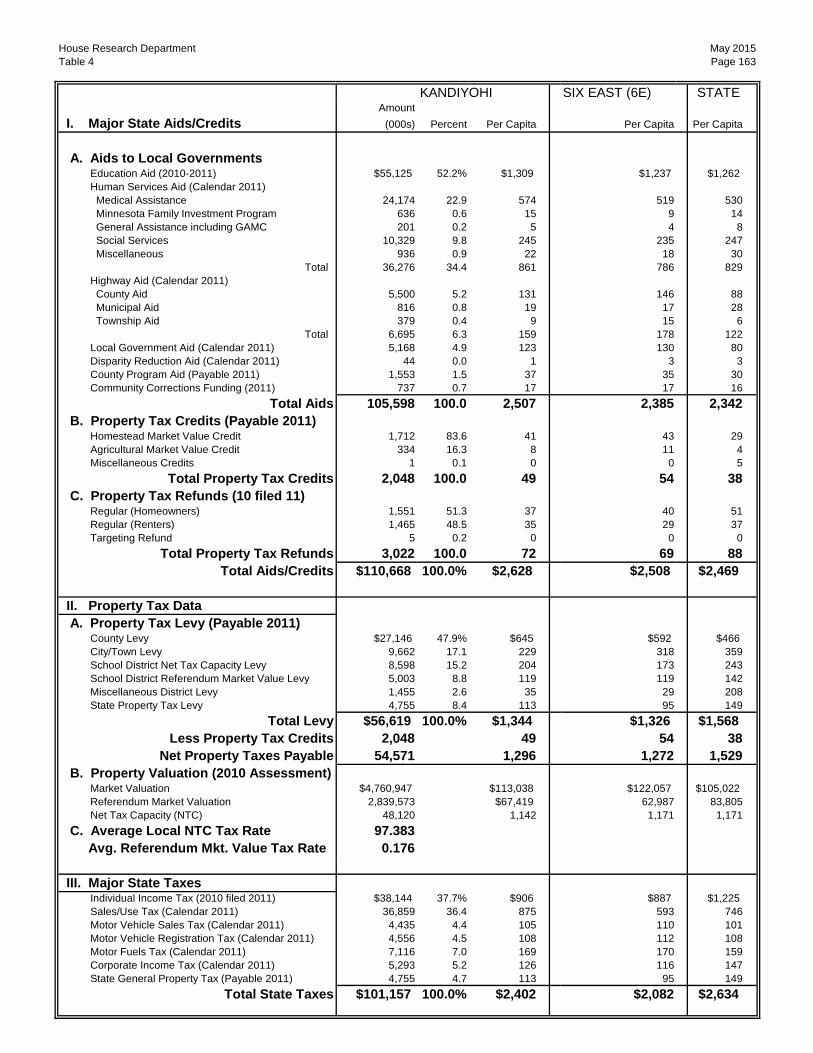
House Research Department May 2015Table 4 Page 163
KANDIYOHI SIX EAST (6E) STATEAmount
I. Major State Aids/Credits (000s) Percent Per Capita Per Capita Per Capita
A. Aids to Local Governments Education Aid (2010-2011) $55,125 52.2% $1,309 $1,237 $1,262 Human Services Aid (Calendar 2011) Medical Assistance 24,174 22.9 574 519 530 Minnesota Family Investment Program 636 0.6 15 9 14 General Assistance including GAMC 201 0.2 5 4 8 Social Services 10,329 9.8 245 235 247 Miscellaneous 936 0.9 22 18 30
Total 36,276 34.4 861 786 829 Highway Aid (Calendar 2011) County Aid 5,500 5.2 131 146 88 Municipal Aid 816 0.8 19 17 28 Township Aid 379 0.4 9 15 6
Total 6,695 6.3 159 178 122 Local Government Aid (Calendar 2011) 5,168 4.9 123 130 80 Disparity Reduction Aid (Calendar 2011) 44 0.0 1 3 3 County Program Aid (Payable 2011) 1,553 1.5 37 35 30 Community Corrections Funding (2011) 737 0.7 17 17 16
Total Aids 105,598 100.0 2,507 2,385 2,342 B. Property Tax Credits (Payable 2011) Homestead Market Value Credit 1,712 83.6 41 43 29 Agricultural Market Value Credit 334 16.3 8 11 4 Miscellaneous Credits 1 0.1 0 0 5
Total Property Tax Credits 2,048 100.0 49 54 38 C. Property Tax Refunds (10 filed 11) Regular (Homeowners) 1,551 51.3 37 40 51 Regular (Renters) 1,465 48.5 35 29 37 Targeting Refund 5 0.2 0 0 0
Total Property Tax Refunds 3,022 100.0 72 69 88 Total Aids/Credits $110,668 100.0% $2,628 $2,508 $2,469
II. Property Tax Data A. Property Tax Levy (Payable 2011) County Levy $27,146 47.9% $645 $592 $466 City/Town Levy 9,662 17.1 229 318 359 School District Net Tax Capacity Levy 8,598 15.2 204 173 243 School District Referendum Market Value Levy 5,003 8.8 119 119 142 Miscellaneous District Levy 1,455 2.6 35 29 208 State Property Tax Levy 4,755 8.4 113 95 149
Total Levy $56,619 100.0% $1,344 $1,326 $1,568 Less Property Tax Credits 2,048 49 54 38
Net Property Taxes Payable 54,571 1,296 1,272 1,529 B. Property Valuation (2010 Assessment) Market Valuation $4,760,947 $113,038 $122,057 $105,022 Referendum Market Valuation 2,839,573 $67,419 62,987 83,805 Net Tax Capacity (NTC) 48,120 1,142 1,171 1,171 C. Average Local NTC Tax Rate 97.383 Avg. Referendum Mkt. Value Tax Rate 0.176
III. Major State Taxes Individual Income Tax (2010 filed 2011) $38,144 37.7% $906 $887 $1,225 Sales/Use Tax (Calendar 2011) 36,859 36.4 875 593 746 Motor Vehicle Sales Tax (Calendar 2011) 4,435 4.4 105 110 101 Motor Vehicle Registration Tax (Calendar 2011) 4,556 4.5 108 112 108 Motor Fuels Tax (Calendar 2011) 7,116 7.0 169 170 159 Corporate Income Tax (Calendar 2011) 5,293 5.2 126 116 147 State General Property Tax (Payable 2011) 4,755 4.7 113 95 149
Total State Taxes $101,157 100.0% $2,402 $2,082 $2,634

House Research Department May 2015Table 4 Page 164
KITTSON NW (1) STATEAmount
I. Major State Aids/Credits (000s) Percent Per Capita Per Capita Per Capita
A. Aids to Local Governments Education Aid (2010-2011) $6,593 42.4% $1,456 $1,405 $1,262 Human Services Aid (Calendar 2011) Medical Assistance 2,939 18.9 649 633 530 Minnesota Family Investment Program 10 0.1 2 10 14 General Assistance including GAMC 18 0.1 4 4 8 Social Services 994 6.4 220 298 247 Miscellaneous 83 0.5 18 22 30
Total 4,044 26.0 893 966 829 Highway Aid (Calendar 2011) County Aid 3,168 20.4 700 328 88 Municipal Aid 0 0.0 0 18 28 Township Aid 553 3.6 122 49 6
Total 3,721 24.0 822 396 122 Local Government Aid (Calendar 2011) 871 5.6 192 177 80 Disparity Reduction Aid (Calendar 2011) 11 0.1 2 7 3 County Program Aid (Payable 2011) 164 1.1 36 54 30 Community Corrections Funding (2011) 127 0.8 28 21 16
Total Aids 15,531 100.0 3,430 3,025 2,342 B. Property Tax Credits (Payable 2011) Homestead Market Value Credit 160 55.8 35 47 29 Agricultural Market Value Credit 127 44.2 28 18 4 Miscellaneous Credits 0 0.0 0 16 5
Total Property Tax Credits 288 100.0 64 81 38 C. Property Tax Refunds (10 filed 11) Regular (Homeowners) 22 27.7 5 17 51 Regular (Renters) 55 70.5 12 18 37 Targeting Refund 1 1.8 0 0 0
Total Property Tax Refunds 78 100.0 17 35 88 Total Aids/Credits $15,896 100.0% $3,511 $3,142 $2,469
II. Property Tax Data A. Property Tax Levy (Payable 2011) County Levy $2,911 35.7% $643 $534 $466 City/Town Levy 1,774 21.8 392 249 359 School District Net Tax Capacity Levy 818 10.0 181 170 243 School District Referendum Market Value Levy 712 8.7 157 92 142 Miscellaneous District Levy 562 6.9 124 81 208 State Property Tax Levy 1,370 16.8 303 111 149
Total Levy $8,147 100.0% $1,799 $1,237 $1,568 Less Property Tax Credits 288 64 81 38
Net Property Taxes Payable 7,859 1,736 1,156 1,529 B. Property Valuation (2010 Assessment) Market Valuation $827,719 $182,800 $106,798 $105,022 Referendum Market Valuation 237,727 $52,501 43,786 83,805 Net Tax Capacity (NTC) 8,407 1,857 1,026 1,171 C. Average Local NTC Tax Rate 72.136 Avg. Referendum Mkt. Value Tax Rate 0.299
III. Major State Taxes Individual Income Tax (2010 filed 2011) $3,951 40.3% $873 $1,086 $1,225 Sales/Use Tax (Calendar 2011) 1,525 15.6 337 434 746 Motor Vehicle Sales Tax (Calendar 2011) 623 6.4 138 116 101 Motor Vehicle Registration Tax (Calendar 2011) 682 7.0 151 120 108 Motor Fuels Tax (Calendar 2011) 1,220 12.5 269 193 159 Corporate Income Tax (Calendar 2011) 424 4.3 94 115 147 State General Property Tax (Payable 2011) 1,370 14.0 303 111 149
Total State Taxes $9,796 100.0% $2,163 $2,175 $2,634

House Research Department May 2015Table 4 Page 165
KOOCHICHING ARROWHEAD (3) STATEAmount
I. Major State Aids/Credits (000s) Percent Per Capita Per Capita Per Capita
A. Aids to Local Governments Education Aid (2010-2011) $17,692 42.7% $1,338 $1,104 $1,262 Human Services Aid (Calendar 2011) Medical Assistance 8,728 21.1 660 653 530 Minnesota Family Investment Program 99 0.2 8 14 14 General Assistance including GAMC 27 0.1 2 10 8 Social Services 4,476 10.8 339 314 247 Miscellaneous 387 0.9 29 41 30
Total 13,718 33.1 1,038 1,032 829 Highway Aid (Calendar 2011) County Aid 4,248 10.3 321 160 88 Municipal Aid 264 0.6 20 33 28 Township Aid 101 0.2 8 5 6
Total 4,613 11.1 349 199 122 Local Government Aid (Calendar 2011) 4,088 9.9 309 198 80 Disparity Reduction Aid (Calendar 2011) 318 0.8 24 33 3 County Program Aid (Payable 2011) 773 1.9 58 42 30 Community Corrections Funding (2011) 214 0.5 16 21 16
Total Aids 41,415 100.0 3,133 2,630 2,342 B. Property Tax Credits (Payable 2011) Homestead Market Value Credit 728 85.9 55 42 29 Agricultural Market Value Credit 116 13.7 9 3 4 Miscellaneous Credits 3 0.4 0 48 5
Total Property Tax Credits 847 100.0 64 93 38 C. Property Tax Refunds (10 filed 11) Regular (Homeowners) 97 26.7 7 26 51 Regular (Renters) 264 73.0 20 29 37 Targeting Refund 1 0.3 0 0 0
Total Property Tax Refunds 362 100.0 27 56 88 Total Aids/Credits $42,625 100.0% $3,224 $2,778 $2,469
II. Property Tax Data A. Property Tax Levy (Payable 2011) County Levy $3,815 35.5% $289 $545 $466 City/Town Levy 2,403 22.4 182 269 359 School District Net Tax Capacity Levy 2,522 23.5 191 187 243 School District Referendum Market Value Levy 818 7.6 62 51 142 Miscellaneous District Levy 69 0.6 5 66 208 State Property Tax Levy 1,120 10.4 85 122 149
Total Levy $10,746 100.0% $813 $1,239 $1,568 Less Property Tax Credits 847 64 93 38
Net Property Taxes Payable 9,899 749 1,147 1,529 B. Property Valuation (2010 Assessment) Market Valuation $1,039,248 $78,606 $99,574 $105,022 Referendum Market Valuation 586,271 $44,344 67,723 83,805 Net Tax Capacity (NTC) 10,930 827 1,088 1,171 C. Average Local NTC Tax Rate 80.597 Avg. Referendum Mkt. Value Tax Rate 0.139
III. Major State Taxes Individual Income Tax (2010 filed 2011) $9,580 36.8% $725 $783 $1,225 Sales/Use Tax (Calendar 2011) 8,677 33.3 656 720 746 Motor Vehicle Sales Tax (Calendar 2011) 1,462 5.6 111 102 101 Motor Vehicle Registration Tax (Calendar 2011) 1,478 5.7 112 104 108 Motor Fuels Tax (Calendar 2011) 2,156 8.3 163 175 159 Corporate Income Tax (Calendar 2011) 1,587 6.1 120 79 147 State General Property Tax (Payable 2011) 1,120 4.3 85 122 149
Total State Taxes $26,061 100.0% $1,971 $2,085 $2,634

House Research Department May 2015Table 4 Page 166
LAC-QUI-PARLE MN VALLEY (6W) STATEAmount
I. Major State Aids/Credits (000s) Percent Per Capita Per Capita Per Capita
A. Aids to Local Governments Education Aid (2010-2011) $9,105 41.6% $1,265 $1,347 $1,262 Human Services Aid (Calendar 2011) Medical Assistance 5,448 24.9 757 696 530 Minnesota Family Investment Program 44 0.2 6 8 14 General Assistance including GAMC -8 0.0 -1 3 8 Social Services 1,952 8.9 271 299 247 Miscellaneous 131 0.6 18 21 30
Total 7,566 34.6 1,052 1,026 829 Highway Aid (Calendar 2011) County Aid 2,899 13.3 403 313 88 Municipal Aid 0 0.0 0 5 28 Township Aid 490 2.2 68 58 6
Total 3,390 15.5 471 376 122 Local Government Aid (Calendar 2011) 1,472 6.7 205 198 80 Disparity Reduction Aid (Calendar 2011) 127 0.6 18 13 3 County Program Aid (Payable 2011) 126 0.6 17 34 30 Community Corrections Funding (2011) 94 0.4 13 17 16
Total Aids 21,880 100.0 3,041 3,012 2,342 B. Property Tax Credits (Payable 2011) Homestead Market Value Credit 339 61.1 47 45 29 Agricultural Market Value Credit 216 38.9 30 21 4 Miscellaneous Credits 0 0.0 0 0 5
Total Property Tax Credits 555 100.0 77 66 38 C. Property Tax Refunds (10 filed 11) Regular (Homeowners) 73 43.5 10 16 51 Regular (Renters) 95 56.5 13 19 37 Targeting Refund 0 0.0 0 0 0
Total Property Tax Refunds 168 100.0 23 34 88 Total Aids/Credits $22,602 100.0% $3,141 $3,112 $2,469
II. Property Tax Data A. Property Tax Levy (Payable 2011) County Levy $4,038 42.1% $561 $696 $466 City/Town Levy 2,608 27.2 363 361 359 School District Net Tax Capacity Levy 1,459 15.2 203 210 243 School District Referendum Market Value Levy 622 6.5 86 97 142 Miscellaneous District Levy 546 5.7 76 36 208 State Property Tax Levy 319 3.3 44 82 149
Total Levy $9,593 100.0% $1,333 $1,482 $1,568 Less Property Tax Credits 555 77 66 38
Net Property Taxes Payable 9,038 1,256 1,416 1,529 B. Property Valuation (2010 Assessment) Market Valuation $1,517,960 $210,974 $177,801 $105,022 Referendum Market Valuation 242,535 $33,709 41,733 83,805 Net Tax Capacity (NTC) 12,117 1,684 1,527 1,171 C. Average Local NTC Tax Rate 70.697 Avg. Referendum Mkt. Value Tax Rate 0.291
III. Major State Taxes Individual Income Tax (2010 filed 2011) $6,907 50.4% $960 $923 $1,225 Sales/Use Tax (Calendar 2011) 2,195 16.0 305 453 746 Motor Vehicle Sales Tax (Calendar 2011) 920 6.7 128 123 101 Motor Vehicle Registration Tax (Calendar 2011) 991 7.2 138 130 108 Motor Fuels Tax (Calendar 2011) 1,591 11.6 221 200 159 Corporate Income Tax (Calendar 2011) 792 5.8 110 201 147 State General Property Tax (Payable 2011) 319 2.3 44 82 149
Total State Taxes $13,715 100.0% $1,906 $2,114 $2,634

House Research Department May 2015Table 4 Page 167
LAKE ARROWHEAD (3) STATEAmount
I. Major State Aids/Credits (000s) Percent Per Capita Per Capita Per Capita
A. Aids to Local Governments Education Aid (2010-2011) $8,711 34.0% $805 $1,104 $1,262 Human Services Aid (Calendar 2011) Medical Assistance 5,370 20.9 496 653 530 Minnesota Family Investment Program 41 0.2 4 14 14 General Assistance including GAMC 31 0.1 3 10 8 Social Services 5,511 21.5 509 314 247 Miscellaneous 262 1.0 24 41 30
Total 11,215 43.7 1,036 1,032 829 Highway Aid (Calendar 2011) County Aid 3,667 14.3 339 160 88 Municipal Aid 0 0.0 0 33 28 Township Aid 65 0.3 6 5 6
Total 3,732 14.5 345 199 122 Local Government Aid (Calendar 2011) 1,570 6.1 145 198 80 Disparity Reduction Aid (Calendar 2011) 219 0.9 20 33 3 County Program Aid (Payable 2011) 120 0.5 11 42 30 Community Corrections Funding (2011) 81 0.3 7 21 16
Total Aids 25,648 100.0 2,370 2,630 2,342 B. Property Tax Credits (Payable 2011) Homestead Market Value Credit 492 30.1 45 42 29 Agricultural Market Value Credit 4 0.2 0 3 4 Miscellaneous Credits 1,137 69.6 105 48 5
Total Property Tax Credits 1,632 100.0 151 93 38 C. Property Tax Refunds (10 filed 11) Regular (Homeowners) 191 43.5 18 26 51 Regular (Renters) 246 56.0 23 29 37 Targeting Refund 2 0.5 0 0 0
Total Property Tax Refunds 439 100.0 41 56 88 Total Aids/Credits $27,719 100.0% $2,561 $2,778 $2,469
II. Property Tax Data A. Property Tax Levy (Payable 2011) County Levy $7,733 42.1% $715 $545 $466 City/Town Levy 3,595 19.6 332 269 359 School District Net Tax Capacity Levy 3,257 17.7 301 187 243 School District Referendum Market Value Levy 172 0.9 16 51 142 Miscellaneous District Levy 1,645 9.0 152 66 208 State Property Tax Levy 1,963 10.7 181 122 149
Total Levy $18,365 100.0% $1,697 $1,239 $1,568 Less Property Tax Credits 1,632 151 93 38
Net Property Taxes Payable 16,733 1,546 1,147 1,529 B. Property Valuation (2010 Assessment) Market Valuation $1,929,216 $178,268 $99,574 $105,022 Referendum Market Valuation 993,464 $91,800 67,723 83,805 Net Tax Capacity (NTC) 20,468 1,891 1,088 1,171 C. Average Local NTC Tax Rate 79.297 Avg. Referendum Mkt. Value Tax Rate 0.017
III. Major State Taxes Individual Income Tax (2010 filed 2011) $8,637 32.8% $798 $783 $1,225 Sales/Use Tax (Calendar 2011) 10,341 39.2 956 720 746 Motor Vehicle Sales Tax (Calendar 2011) 1,252 4.8 116 102 101 Motor Vehicle Registration Tax (Calendar 2011) 1,282 4.9 118 104 108 Motor Fuels Tax (Calendar 2011) 2,610 9.9 241 175 159 Corporate Income Tax (Calendar 2011) 263 1.0 24 79 147 State General Property Tax (Payable 2011) 1,963 7.5 181 122 149
Total State Taxes $26,348 100.0% $2,435 $2,085 $2,634

House Research Department May 2015Table 4 Page 168
LAKE of the WOODS HEADWATERS (2) STATEAmount
I. Major State Aids/Credits (000s) Percent Per Capita Per Capita Per Capita
A. Aids to Local Governments Education Aid (2010-2011) $5,806 45.7% $1,448 $1,444 $1,262 Human Services Aid (Calendar 2011) Medical Assistance 2,166 17.1 540 886 530 Minnesota Family Investment Program 29 0.2 7 41 14 General Assistance including GAMC 20 0.2 5 6 8 Social Services 875 6.9 218 272 247 Miscellaneous 41 0.3 10 23 30
Total 3,131 24.7 781 1,229 829 Highway Aid (Calendar 2011) County Aid 2,856 22.5 712 208 88 Municipal Aid 0 0.0 0 6 28 Township Aid 155 1.2 39 14 6
Total 3,010 23.7 751 228 122 Local Government Aid (Calendar 2011) 332 2.6 83 61 80 Disparity Reduction Aid (Calendar 2011) 20 0.2 5 3 3 County Program Aid (Payable 2011) 270 2.1 67 61 30 Community Corrections Funding (2011) 126 1.0 31 19 16
Total Aids 12,694 100.0 3,165 3,045 2,342 B. Property Tax Credits (Payable 2011) Homestead Market Value Credit 228 79.2 57 40 29 Agricultural Market Value Credit 58 20.3 15 10 4 Miscellaneous Credits 2 0.5 0 0 5
Total Property Tax Credits 288 100.0 72 51 38 C. Property Tax Refunds (10 filed 11) Regular (Homeowners) 107 63.0 27 21 51 Regular (Renters) 63 37.0 16 21 37 Targeting Refund 0 0.0 0 0 0
Total Property Tax Refunds 169 100.0 42 42 88 Total Aids/Credits $13,151 100.0% $3,279 $3,138 $2,469
II. Property Tax Data A. Property Tax Levy (Payable 2011) County Levy $2,264 37.4% $564 $471 $466 City/Town Levy 771 12.8 192 211 359 School District Net Tax Capacity Levy 2,129 35.2 531 213 243 School District Referendum Market Value Levy 390 6.4 97 62 142 Miscellaneous District Levy 15 0.2 4 34 208 State Property Tax Levy 477 7.9 119 134 149
Total Levy $6,046 100.0% $1,507 $1,125 $1,568 Less Property Tax Credits 288 72 51 38
Net Property Taxes Payable 5,757 1,435 1,074 1,529 B. Property Valuation (2010 Assessment) Market Valuation $493,687 $123,083 $100,715 $105,022 Referendum Market Valuation 227,725 $56,775 57,188 83,805 Net Tax Capacity (NTC) 4,913 1,225 1,061 1,171 C. Average Local NTC Tax Rate 105.413 Avg. Referendum Mkt. Value Tax Rate 0.171
III. Major State Taxes Individual Income Tax (2010 filed 2011) $2,422 28.6% $604 $571 $1,225 Sales/Use Tax (Calendar 2011) 3,780 44.6 942 583 746 Motor Vehicle Sales Tax (Calendar 2011) 469 5.5 117 93 101 Motor Vehicle Registration Tax (Calendar 2011) 450 5.3 112 92 108 Motor Fuels Tax (Calendar 2011) 743 8.8 185 165 159 Corporate Income Tax (Calendar 2011) 138 1.6 35 53 147 State General Property Tax (Payable 2011) 477 5.6 119 134 149
Total State Taxes $8,480 100.0% $2,114 $1,691 $2,634

House Research Department May 2015Table 4 Page 169
LE SUEUR NINE (9) STATEAmount
I. Major State Aids/Credits (000s) Percent Per Capita Per Capita Per Capita
A. Aids to Local Governments Education Aid (2010-2011) $33,272 55.7% $1,203 $1,075 $1,262 Human Services Aid (Calendar 2011) Medical Assistance 10,089 16.9 365 451 530 Minnesota Family Investment Program 207 0.3 7 8 14 General Assistance including GAMC 81 0.1 3 4 8 Social Services 7,106 11.9 257 253 247 Miscellaneous 505 0.8 18 21 30
Total 17,988 30.1 650 736 829 Highway Aid (Calendar 2011) County Aid 4,154 7.0 150 165 88 Municipal Aid 0 0.0 0 18 28 Township Aid 141 0.2 5 14 6
Total 4,296 7.2 155 197 122 Local Government Aid (Calendar 2011) 2,868 4.8 104 170 80 Disparity Reduction Aid (Calendar 2011) 158 0.3 6 4 3 County Program Aid (Payable 2011) 817 1.4 30 38 30 Community Corrections Funding (2011) 327 0.5 12 18 16
Total Aids 59,726 100.0 2,160 2,238 2,342 B. Property Tax Credits (Payable 2011) Homestead Market Value Credit 1,180 81.5 43 39 29 Agricultural Market Value Credit 267 18.5 10 10 4 Miscellaneous Credits 0 0.0 0 2 5
Total Property Tax Credits 1,447 100.0 52 51 38 C. Property Tax Refunds (10 filed 11) Regular (Homeowners) 1,262 70.1 46 27 51 Regular (Renters) 532 29.5 19 26 37 Targeting Refund 6 0.3 0 0 0
Total Property Tax Refunds 1,800 100.0 65 53 88 Total Aids/Credits $62,973 100.0% $2,277 $2,342 $2,469
II. Property Tax Data A. Property Tax Levy (Payable 2011) County Levy $13,126 37.1% $475 $498 $466 City/Town Levy 9,357 26.5 338 317 359 School District Net Tax Capacity Levy 6,900 19.5 249 182 243 School District Referendum Market Value Levy 3,467 9.8 125 96 142 Miscellaneous District Levy 370 1.0 13 21 208 State Property Tax Levy 2,131 6.0 77 97 149
Total Levy $35,351 100.0% $1,278 $1,211 $1,568 Less Property Tax Credits 1,447 52 51 38
Net Property Taxes Payable 33,904 1,226 1,160 1,529 B. Property Valuation (2010 Assessment) Market Valuation $3,490,797 $126,227 $115,995 $105,022 Referendum Market Valuation 2,142,294 $77,465 59,665 83,805 Net Tax Capacity (NTC) 33,512 1,212 1,116 1,171 C. Average Local NTC Tax Rate 88.356 Avg. Referendum Mkt. Value Tax Rate 0.168
III. Major State Taxes Individual Income Tax (2010 filed 2011) $25,940 54.1% $938 $867 $1,225 Sales/Use Tax (Calendar 2011) 5,860 12.2 212 579 746 Motor Vehicle Sales Tax (Calendar 2011) 3,469 7.2 125 106 101 Motor Vehicle Registration Tax (Calendar 2011) 3,536 7.4 128 110 108 Motor Fuels Tax (Calendar 2011) 4,186 8.7 151 169 159 Corporate Income Tax (Calendar 2011) 2,821 5.9 102 170 147 State General Property Tax (Payable 2011) 2,131 4.4 77 97 149
Total State Taxes $47,942 100.0% $1,734 $2,100 $2,634
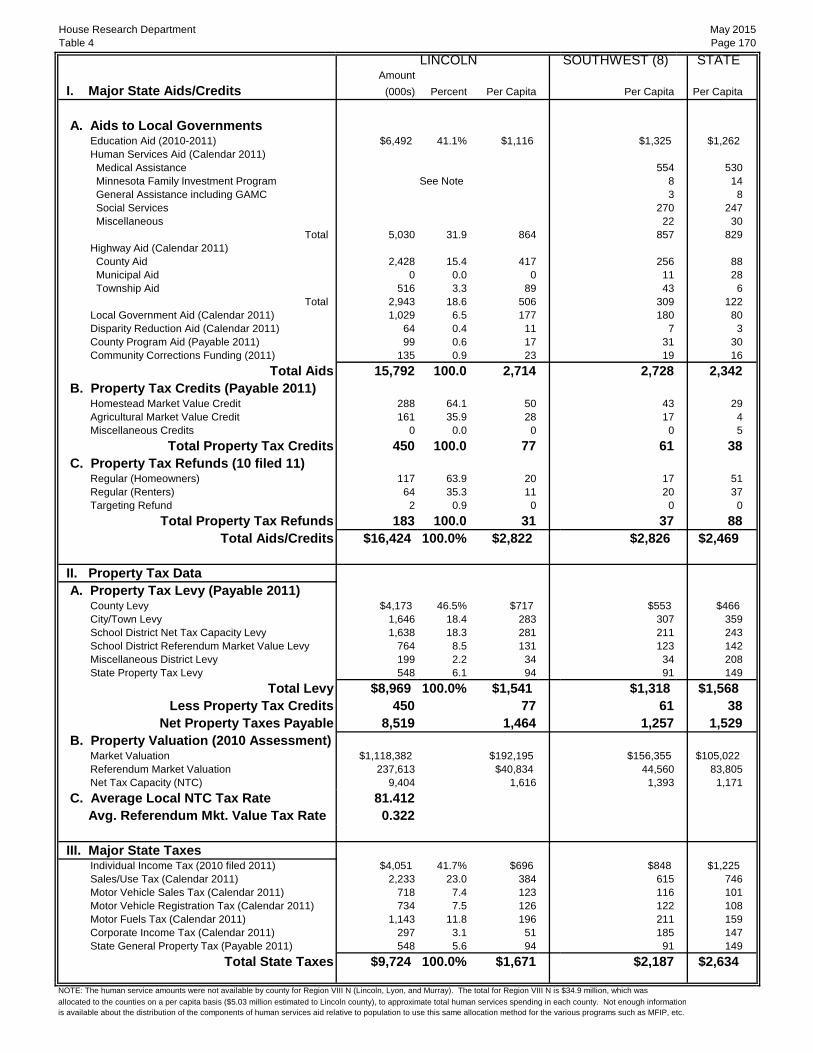
House Research Department May 2015Table 4 Page 170
LINCOLN SOUTHWEST (8) STATEAmount
I. Major State Aids/Credits (000s) Percent Per Capita Per Capita Per Capita
A. Aids to Local Governments Education Aid (2010-2011) $6,492 41.1% $1,116 $1,325 $1,262 Human Services Aid (Calendar 2011) Medical Assistance 554 530 Minnesota Family Investment Program See Note 8 14 General Assistance including GAMC 3 8 Social Services 270 247 Miscellaneous 22 30
Total 5,030 31.9 864 857 829 Highway Aid (Calendar 2011) County Aid 2,428 15.4 417 256 88 Municipal Aid 0 0.0 0 11 28 Township Aid 516 3.3 89 43 6
Total 2,943 18.6 506 309 122 Local Government Aid (Calendar 2011) 1,029 6.5 177 180 80 Disparity Reduction Aid (Calendar 2011) 64 0.4 11 7 3 County Program Aid (Payable 2011) 99 0.6 17 31 30 Community Corrections Funding (2011) 135 0.9 23 19 16
Total Aids 15,792 100.0 2,714 2,728 2,342 B. Property Tax Credits (Payable 2011) Homestead Market Value Credit 288 64.1 50 43 29 Agricultural Market Value Credit 161 35.9 28 17 4 Miscellaneous Credits 0 0.0 0 0 5
Total Property Tax Credits 450 100.0 77 61 38 C. Property Tax Refunds (10 filed 11) Regular (Homeowners) 117 63.9 20 17 51 Regular (Renters) 64 35.3 11 20 37 Targeting Refund 2 0.9 0 0 0
Total Property Tax Refunds 183 100.0 31 37 88 Total Aids/Credits $16,424 100.0% $2,822 $2,826 $2,469
II. Property Tax Data A. Property Tax Levy (Payable 2011) County Levy $4,173 46.5% $717 $553 $466 City/Town Levy 1,646 18.4 283 307 359 School District Net Tax Capacity Levy 1,638 18.3 281 211 243 School District Referendum Market Value Levy 764 8.5 131 123 142 Miscellaneous District Levy 199 2.2 34 34 208 State Property Tax Levy 548 6.1 94 91 149
Total Levy $8,969 100.0% $1,541 $1,318 $1,568 Less Property Tax Credits 450 77 61 38
Net Property Taxes Payable 8,519 1,464 1,257 1,529 B. Property Valuation (2010 Assessment) Market Valuation $1,118,382 $192,195 $156,355 $105,022 Referendum Market Valuation 237,613 $40,834 44,560 83,805 Net Tax Capacity (NTC) 9,404 1,616 1,393 1,171 C. Average Local NTC Tax Rate 81.412 Avg. Referendum Mkt. Value Tax Rate 0.322
III. Major State Taxes Individual Income Tax (2010 filed 2011) $4,051 41.7% $696 $848 $1,225 Sales/Use Tax (Calendar 2011) 2,233 23.0 384 615 746 Motor Vehicle Sales Tax (Calendar 2011) 718 7.4 123 116 101 Motor Vehicle Registration Tax (Calendar 2011) 734 7.5 126 122 108 Motor Fuels Tax (Calendar 2011) 1,143 11.8 196 211 159 Corporate Income Tax (Calendar 2011) 297 3.1 51 185 147 State General Property Tax (Payable 2011) 548 5.6 94 91 149
Total State Taxes $9,724 100.0% $1,671 $2,187 $2,634
NOTE: The human service amounts were not available by county for Region VIII N (Lincoln, Lyon, and Murray). The total for Region VIII N is $34.9 million, which wasallocated to the counties on a per capita basis ($5.03 million estimated to Lincoln county), to approximate total human services spending in each county. Not enough informationis available about the distribution of the components of human services aid relative to population to use this same allocation method for the various programs such as MFIP, etc.
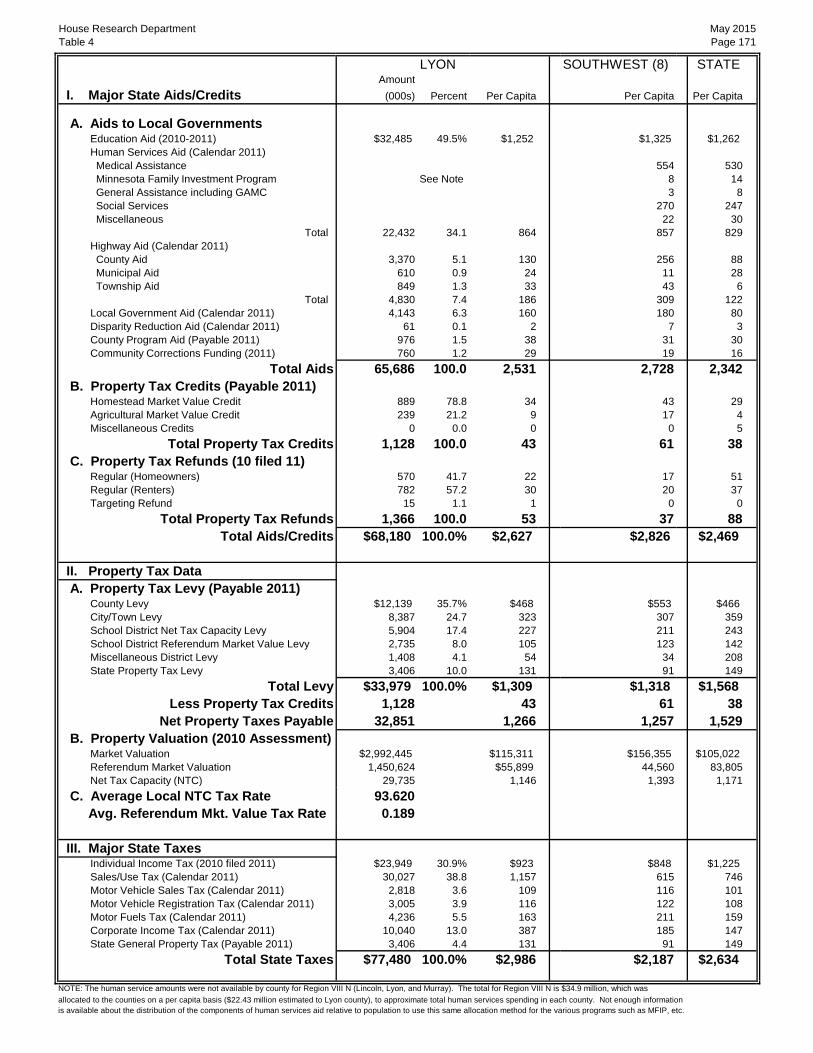
House Research Department May 2015Table 4 Page 171
LYON SOUTHWEST (8) STATEAmount
I. Major State Aids/Credits (000s) Percent Per Capita Per Capita Per Capita
A. Aids to Local Governments Education Aid (2010-2011) $32,485 49.5% $1,252 $1,325 $1,262 Human Services Aid (Calendar 2011) Medical Assistance 554 530 Minnesota Family Investment Program See Note 8 14 General Assistance including GAMC 3 8 Social Services 270 247 Miscellaneous 22 30
Total 22,432 34.1 864 857 829 Highway Aid (Calendar 2011) County Aid 3,370 5.1 130 256 88 Municipal Aid 610 0.9 24 11 28 Township Aid 849 1.3 33 43 6
Total 4,830 7.4 186 309 122 Local Government Aid (Calendar 2011) 4,143 6.3 160 180 80 Disparity Reduction Aid (Calendar 2011) 61 0.1 2 7 3 County Program Aid (Payable 2011) 976 1.5 38 31 30 Community Corrections Funding (2011) 760 1.2 29 19 16
Total Aids 65,686 100.0 2,531 2,728 2,342 B. Property Tax Credits (Payable 2011) Homestead Market Value Credit 889 78.8 34 43 29 Agricultural Market Value Credit 239 21.2 9 17 4 Miscellaneous Credits 0 0.0 0 0 5
Total Property Tax Credits 1,128 100.0 43 61 38 C. Property Tax Refunds (10 filed 11) Regular (Homeowners) 570 41.7 22 17 51 Regular (Renters) 782 57.2 30 20 37 Targeting Refund 15 1.1 1 0 0
Total Property Tax Refunds 1,366 100.0 53 37 88 Total Aids/Credits $68,180 100.0% $2,627 $2,826 $2,469
II. Property Tax Data A. Property Tax Levy (Payable 2011) County Levy $12,139 35.7% $468 $553 $466 City/Town Levy 8,387 24.7 323 307 359 School District Net Tax Capacity Levy 5,904 17.4 227 211 243 School District Referendum Market Value Levy 2,735 8.0 105 123 142 Miscellaneous District Levy 1,408 4.1 54 34 208 State Property Tax Levy 3,406 10.0 131 91 149
Total Levy $33,979 100.0% $1,309 $1,318 $1,568 Less Property Tax Credits 1,128 43 61 38
Net Property Taxes Payable 32,851 1,266 1,257 1,529 B. Property Valuation (2010 Assessment) Market Valuation $2,992,445 $115,311 $156,355 $105,022 Referendum Market Valuation 1,450,624 $55,899 44,560 83,805 Net Tax Capacity (NTC) 29,735 1,146 1,393 1,171 C. Average Local NTC Tax Rate 93.620 Avg. Referendum Mkt. Value Tax Rate 0.189
III. Major State Taxes Individual Income Tax (2010 filed 2011) $23,949 30.9% $923 $848 $1,225 Sales/Use Tax (Calendar 2011) 30,027 38.8 1,157 615 746 Motor Vehicle Sales Tax (Calendar 2011) 2,818 3.6 109 116 101 Motor Vehicle Registration Tax (Calendar 2011) 3,005 3.9 116 122 108 Motor Fuels Tax (Calendar 2011) 4,236 5.5 163 211 159 Corporate Income Tax (Calendar 2011) 10,040 13.0 387 185 147 State General Property Tax (Payable 2011) 3,406 4.4 131 91 149
Total State Taxes $77,480 100.0% $2,986 $2,187 $2,634
NOTE: The human service amounts were not available by county for Region VIII N (Lincoln, Lyon, and Murray). The total for Region VIII N is $34.9 million, which wasallocated to the counties on a per capita basis ($22.43 million estimated to Lyon county), to approximate total human services spending in each county. Not enough informationis available about the distribution of the components of human services aid relative to population to use this same allocation method for the various programs such as MFIP, etc.

House Research Department May 2015Table 4 Page 172
MCLEOD SIX EAST (6E) STATEAmount
I. Major State Aids/Credits (000s) Percent Per Capita Per Capita Per Capita
A. Aids to Local Governments Education Aid (2010-2011) $42,941 54.5% $1,177 $1,237 $1,262 Human Services Aid (Calendar 2011) Medical Assistance 16,389 20.8 449 519 530 Minnesota Family Investment Program 174 0.2 5 9 14 General Assistance including GAMC 92 0.1 3 4 8 Social Services 7,542 9.6 207 235 247 Miscellaneous 521 0.7 14 18 30
Total 24,717 31.3 677 786 829 Highway Aid (Calendar 2011) County Aid 3,537 4.5 97 146 88 Municipal Aid 829 1.1 23 17 28 Township Aid 321 0.4 9 15 6
Total 4,686 5.9 128 178 122 Local Government Aid (Calendar 2011) 4,365 5.5 120 130 80 Disparity Reduction Aid (Calendar 2011) 135 0.2 4 3 3 County Program Aid (Payable 2011) 1,511 1.9 41 35 30 Community Corrections Funding (2011) 493 0.6 14 17 16
Total Aids 78,849 100.0 2,161 2,385 2,342 B. Property Tax Credits (Payable 2011) Homestead Market Value Credit 1,495 81.7 41 43 29 Agricultural Market Value Credit 335 18.3 9 11 4 Miscellaneous Credits 0 0.0 0 0 5
Total Property Tax Credits 1,830 100.0 50 54 38 C. Property Tax Refunds (10 filed 11) Regular (Homeowners) 1,820 61.5 50 40 51 Regular (Renters) 1,137 38.4 31 29 37 Targeting Refund 4 0.1 0 0 0
Total Property Tax Refunds 2,961 100.0 81 69 88 Total Aids/Credits $83,640 100.0% $2,292 $2,508 $2,469
II. Property Tax Data A. Property Tax Levy (Payable 2011) County Levy $18,233 40.7% $500 $592 $466 City/Town Levy 13,514 30.2 370 318 359 School District Net Tax Capacity Levy 4,587 10.2 126 173 243 School District Referendum Market Value Levy 4,602 10.3 126 119 142 Miscellaneous District Levy 999 2.2 27 29 208 State Property Tax Levy 2,850 6.4 78 95 149
Total Levy $44,784 100.0% $1,227 $1,326 $1,568 Less Property Tax Credits 1,830 50 54 38
Net Property Taxes Payable 42,954 1,177 1,272 1,529 B. Property Valuation (2010 Assessment) Market Valuation $3,478,412 $95,328 $122,057 $105,022 Referendum Market Valuation 2,287,269 $62,684 62,987 83,805 Net Tax Capacity (NTC) 34,047 933 1,171 1,171 C. Average Local NTC Tax Rate 109.652 Avg. Referendum Mkt. Value Tax Rate 0.201
III. Major State Taxes Individual Income Tax (2010 filed 2011) $31,399 44.5% $861 $887 $1,225 Sales/Use Tax (Calendar 2011) 18,845 26.7 516 593 746 Motor Vehicle Sales Tax (Calendar 2011) 4,037 5.7 111 110 101 Motor Vehicle Registration Tax (Calendar 2011) 4,112 5.8 113 112 108 Motor Fuels Tax (Calendar 2011) 5,411 7.7 148 170 159 Corporate Income Tax (Calendar 2011) 3,937 5.6 108 116 147 State General Property Tax (Payable 2011) 2,850 4.0 78 95 149
Total State Taxes $70,591 100.0% $1,935 $2,082 $2,634

House Research Department May 2015Table 4 Page 173
MAHNOMEN HEADWATERS (2) STATEAmount
I. Major State Aids/Credits (000s) Percent Per Capita Per Capita Per Capita
A. Aids to Local Governments Education Aid (2010-2011) $9,347 38.4% $1,718 $1,444 $1,262 Human Services Aid (Calendar 2011) Medical Assistance 8,493 34.9 1,561 886 530 Minnesota Family Investment Program 482 2.0 89 41 14 General Assistance including GAMC 161 0.7 30 6 8 Social Services 1,511 6.2 278 272 247 Miscellaneous 259 1.1 48 23 30
Total 10,905 44.8 2,004 1,229 829 Highway Aid (Calendar 2011) County Aid 2,428 10.0 446 208 88 Municipal Aid 0 0.0 0 6 28 Township Aid 145 0.6 27 14 6
Total 2,573 10.6 473 228 122 Local Government Aid (Calendar 2011) 559 2.3 103 61 80 Disparity Reduction Aid (Calendar 2011) 124 0.5 23 3 3 County Program Aid (Payable 2011) 633 2.6 116 61 30 Community Corrections Funding (2011) 209 0.9 38 19 16
Total Aids 24,351 100.0 4,475 3,045 2,342 B. Property Tax Credits (Payable 2011) Homestead Market Value Credit 183 64.3 34 40 29 Agricultural Market Value Credit 102 35.7 19 10 4 Miscellaneous Credits 0 0.0 0 0 5
Total Property Tax Credits 284 100.0 52 51 38 C. Property Tax Refunds (10 filed 11) Regular (Homeowners) 61 54.6 11 21 51 Regular (Renters) 51 45.4 9 21 37 Targeting Refund 0 0.0 0 0 0
Total Property Tax Refunds 112 100.0 21 42 88 Total Aids/Credits $24,747 100.0% $4,548 $3,138 $2,469
II. Property Tax Data A. Property Tax Levy (Payable 2011) County Levy $4,001 62.9% $735 $471 $466 City/Town Levy 811 12.7 149 211 359 School District Net Tax Capacity Levy 838 13.2 154 213 243 School District Referendum Market Value Levy 93 1.5 17 62 142 Miscellaneous District Levy 379 6.0 70 34 208 State Property Tax Levy 241 3.8 44 134 149
Total Levy $6,362 100.0% $1,169 $1,125 $1,568 Less Property Tax Credits 284 52 51 38
Net Property Taxes Payable 6,078 1,117 1,074 1,529 B. Property Valuation (2010 Assessment) Market Valuation $508,561 $93,468 $100,715 $105,022 Referendum Market Valuation 150,622 $27,683 57,188 83,805 Net Tax Capacity (NTC) 4,396 808 1,061 1,171 C. Average Local NTC Tax Rate 137.137 Avg. Referendum Mkt. Value Tax Rate 0.061
III. Major State Taxes Individual Income Tax (2010 filed 2011) $1,766 23.5% $324 $571 $1,225 Sales/Use Tax (Calendar 2011) 3,431 45.7 631 583 746 Motor Vehicle Sales Tax (Calendar 2011) 438 5.8 80 93 101 Motor Vehicle Registration Tax (Calendar 2011) 432 5.8 79 92 108 Motor Fuels Tax (Calendar 2011) 1,109 14.8 204 165 159 Corporate Income Tax (Calendar 2011) 91 1.2 17 53 147 State General Property Tax (Payable 2011) 241 3.2 44 134 149
Total State Taxes $7,507 100.0% $1,380 $1,691 $2,634

House Research Department May 2015Table 4 Page 174
MARSHALL NW (1) STATEAmount
I. Major State Aids/Credits (000s) Percent Per Capita Per Capita Per Capita
A. Aids to Local Governments Education Aid (2010-2011) $14,672 47.9% $1,549 $1,405 $1,262 Human Services Aid (Calendar 2011) Medical Assistance 5,505 18.0 581 633 530 Minnesota Family Investment Program 63 0.2 7 10 14 General Assistance including GAMC 17 0.1 2 4 8 Social Services 2,597 8.5 274 298 247 Miscellaneous 199 0.7 21 22 30
Total 8,381 27.4 885 966 829 Highway Aid (Calendar 2011) County Aid 4,511 14.7 476 328 88 Municipal Aid 0 0.0 0 18 28 Township Aid 918 3.0 97 49 6
Total 5,429 17.7 573 396 122 Local Government Aid (Calendar 2011) 1,331 4.3 141 177 80 Disparity Reduction Aid (Calendar 2011) 11 0.0 1 7 3 County Program Aid (Payable 2011) 664 2.2 70 54 30 Community Corrections Funding (2011) 147 0.5 16 21 16
Total Aids 30,635 100.0 3,234 3,025 2,342 B. Property Tax Credits (Payable 2011) Homestead Market Value Credit 517 57.9 55 47 29 Agricultural Market Value Credit 305 34.1 32 18 4 Miscellaneous Credits 71 7.9 7 16 5
Total Property Tax Credits 893 100.0 94 81 38 C. Property Tax Refunds (10 filed 11) Regular (Homeowners) 28 21.1 3 17 51 Regular (Renters) 104 78.9 11 18 37 Targeting Refund 0 0.0 0 0 0
Total Property Tax Refunds 132 100.0 14 35 88 Total Aids/Credits $31,661 100.0% $3,342 $3,142 $2,469
II. Property Tax Data A. Property Tax Levy (Payable 2011) County Levy $4,998 39.7% $528 $534 $466 City/Town Levy 2,658 21.1 281 249 359 School District Net Tax Capacity Levy 1,063 8.5 112 170 243 School District Referendum Market Value Levy 1,000 7.9 106 92 142 Miscellaneous District Levy 906 7.2 96 81 208 State Property Tax Levy 1,950 15.5 206 111 149
Total Levy $12,575 100.0% $1,327 $1,237 $1,568 Less Property Tax Credits 893 94 81 38
Net Property Taxes Payable 11,682 1,233 1,156 1,529 B. Property Valuation (2010 Assessment) Market Valuation $1,411,326 $148,984 $106,798 $105,022 Referendum Market Valuation 452,508 $47,768 43,786 83,805 Net Tax Capacity (NTC) 13,668 1,443 1,026 1,171 C. Average Local NTC Tax Rate 70.420 Avg. Referendum Mkt. Value Tax Rate 0.221
III. Major State Taxes Individual Income Tax (2010 filed 2011) $9,313 47.5% $983 $1,086 $1,225 Sales/Use Tax (Calendar 2011) 2,662 13.6 281 434 746 Motor Vehicle Sales Tax (Calendar 2011) 1,271 6.5 134 116 101 Motor Vehicle Registration Tax (Calendar 2011) 1,383 7.1 146 120 108 Motor Fuels Tax (Calendar 2011) 2,364 12.1 250 193 159 Corporate Income Tax (Calendar 2011) 658 3.4 69 115 147 State General Property Tax (Payable 2011) 1,950 9.9 206 111 149
Total State Taxes $19,600 100.0% $2,069 $2,175 $2,634

House Research Department May 2015Table 4 Page 175
MARTIN NINE (9) STATEAmount
I. Major State Aids/Credits (000s) Percent Per Capita Per Capita Per Capita
A. Aids to Local Governments Education Aid (2010-2011) $23,196 42.4% $1,120 $1,075 $1,262 Human Services Aid (Calendar 2011) Medical Assistance 451 530 Minnesota Family Investment Program See Note 8 14 General Assistance including GAMC 4 8 Social Services 253 247 Miscellaneous 21 30
Total 19,595 35.8 946 736 829 Highway Aid (Calendar 2011) County Aid 4,404 8.0 213 165 88 Municipal Aid 641 1.2 31 18 28 Township Aid 485 0.9 23 14 6
Total 5,529 10.1 267 197 122 Local Government Aid (Calendar 2011) 5,167 9.4 249 170 80 Disparity Reduction Aid (Calendar 2011) 100 0.2 5 4 3 County Program Aid (Payable 2011) 730 1.3 35 38 30 Community Corrections Funding (2011) 439 0.8 21 18 16
Total Aids 54,756 100.0 2,643 2,238 2,342 B. Property Tax Credits (Payable 2011) Homestead Market Value Credit 959 76.2 46 39 29 Agricultural Market Value Credit 262 20.8 13 10 4 Miscellaneous Credits 37 2.9 2 2 5
Total Property Tax Credits 1,258 100.0 61 51 38 C. Property Tax Refunds (10 filed 11) Regular (Homeowners) 317 36.5 15 27 51 Regular (Renters) 532 61.3 26 26 37 Targeting Refund 20 2.3 1 0 0
Total Property Tax Refunds 869 100.0 42 53 88 Total Aids/Credits $56,884 100.0% $2,746 $2,342 $2,469
II. Property Tax Data A. Property Tax Levy (Payable 2011) County Levy $10,557 37.9% $510 $498 $466 City/Town Levy 6,703 24.0 324 317 359 School District Net Tax Capacity Levy 4,939 17.7 238 182 243 School District Referendum Market Value Levy 2,597 9.3 125 96 142 Miscellaneous District Levy 492 1.8 24 21 208 State Property Tax Levy 2,588 9.3 125 97 149
Total Levy $27,875 100.0% $1,346 $1,211 $1,568 Less Property Tax Credits 1,258 61 51 38
Net Property Taxes Payable 26,617 1,285 1,160 1,529 B. Property Valuation (2010 Assessment) Market Valuation $3,036,652 $146,585 $115,995 $105,022 Referendum Market Valuation 1,085,037 $52,377 59,665 83,805 Net Tax Capacity (NTC) 28,972 1,399 1,116 1,171 C. Average Local NTC Tax Rate 78.319 Avg. Referendum Mkt. Value Tax Rate 0.239
III. Major State Taxes Individual Income Tax (2010 filed 2011) $20,256 42.9% $978 $867 $1,225 Sales/Use Tax (Calendar 2011) 9,423 20.0 455 579 746 Motor Vehicle Sales Tax (Calendar 2011) 2,453 5.2 118 106 101 Motor Vehicle Registration Tax (Calendar 2011) 2,607 5.5 126 110 108 Motor Fuels Tax (Calendar 2011) 4,661 9.9 225 169 159 Corporate Income Tax (Calendar 2011) 5,177 11.0 250 170 147 State General Property Tax (Payable 2011) 2,588 5.5 125 97 149
Total State Taxes $47,165 100.0% $2,277 $2,100 $2,634
NOTE: The human service amounts were not available by county for the Human Services Board (Faribault and Martin). The total for the Human Service Board is $33.3 million, which wasallocated to the counties on a per capita basis ($19.59 million estimated to Martin county), to approximate total human services spending in each county. Not enough informationis available about the distribution of the components of human services aid relative to population to use this same allocation method for the various programs such as MFIP, etc.

House Research Department May 2015Table 4 Page 176
MEEKER SIX EAST (6E) STATEAmount
I. Major State Aids/Credits (000s) Percent Per Capita Per Capita Per Capita
A. Aids to Local Governments Education Aid (2010-2011) $30,586 54.4% $1,316 $1,237 $1,262 Human Services Aid (Calendar 2011) Medical Assistance 12,050 21.4 518 519 530 Minnesota Family Investment Program 192 0.3 8 9 14 General Assistance including GAMC 65 0.1 3 4 8 Social Services 5,031 9.0 216 235 247 Miscellaneous 449 0.8 19 18 30
Total 17,788 31.6 765 786 829 Highway Aid (Calendar 2011) County Aid 3,119 5.5 134 146 88 Municipal Aid 305 0.5 13 17 28 Township Aid 359 0.6 15 15 6
Total 3,783 6.7 163 178 122 Local Government Aid (Calendar 2011) 2,711 4.8 117 130 80 Disparity Reduction Aid (Calendar 2011) 34 0.1 1 3 3 County Program Aid (Payable 2011) 778 1.4 33 35 30 Community Corrections Funding (2011) 529 0.9 23 17 16
Total Aids 56,209 100.0 2,418 2,385 2,342 B. Property Tax Credits (Payable 2011) Homestead Market Value Credit 1,081 77.1 46 43 29 Agricultural Market Value Credit 315 22.5 14 11 4 Miscellaneous Credits 5 0.4 0 0 5
Total Property Tax Credits 1,401 100.0 60 54 38 C. Property Tax Refunds (10 filed 11) Regular (Homeowners) 1,124 68.4 48 40 51 Regular (Renters) 506 30.7 22 29 37 Targeting Refund 14 0.9 1 0 0
Total Property Tax Refunds 1,644 100.0 71 69 88 Total Aids/Credits $59,254 100.0% $2,549 $2,508 $2,469
II. Property Tax Data A. Property Tax Levy (Payable 2011) County Levy $12,175 41.4% $524 $592 $466 City/Town Levy 7,442 25.3 320 318 359 School District Net Tax Capacity Levy 5,058 17.2 218 173 243 School District Referendum Market Value Levy 2,459 8.4 106 119 142 Miscellaneous District Levy 468 1.6 20 29 208 State Property Tax Levy 1,790 6.1 77 95 149
Total Levy $29,392 100.0% $1,265 $1,326 $1,568 Less Property Tax Credits 1,401 60 54 38
Net Property Taxes Payable 27,991 1,204 1,272 1,529 B. Property Valuation (2010 Assessment) Market Valuation $2,792,886 $120,165 $122,057 $105,022 Referendum Market Valuation 1,517,875 $65,307 62,987 83,805 Net Tax Capacity (NTC) 26,316 1,132 1,171 1,171 C. Average Local NTC Tax Rate 95.541 Avg. Referendum Mkt. Value Tax Rate 0.162
III. Major State Taxes Individual Income Tax (2010 filed 2011) $18,301 46.0% $787 $887 $1,225 Sales/Use Tax (Calendar 2011) 8,990 22.6 387 593 746 Motor Vehicle Sales Tax (Calendar 2011) 2,444 6.1 105 110 101 Motor Vehicle Registration Tax (Calendar 2011) 2,456 6.2 106 112 108 Motor Fuels Tax (Calendar 2011) 3,875 9.7 167 170 159 Corporate Income Tax (Calendar 2011) 1,894 4.8 81 116 147 State General Property Tax (Payable 2011) 1,790 4.5 77 95 149
Total State Taxes $39,750 100.0% $1,710 $2,082 $2,634

House Research Department May 2015Table 4 Page 177
MILLE LACS E CENTRAL (7E) STATEAmount
I. Major State Aids/Credits (000s) Percent Per Capita Per Capita Per Capita
A. Aids to Local Governments Education Aid (2010-2011) $27,416 46.1% $1,054 $1,179 $1,262 Human Services Aid (Calendar 2011) Medical Assistance 16,534 27.8 636 493 530 Minnesota Family Investment Program 270 0.5 10 9 14 General Assistance including GAMC 131 0.2 5 4 8 Social Services 7,257 12.2 279 218 247 Miscellaneous 485 0.8 19 16 30
Total 24,677 41.5 949 740 829 Highway Aid (Calendar 2011) County Aid 3,869 6.5 149 131 88 Municipal Aid 0 0.0 0 13 28 Township Aid 200 0.3 8 8 6
Total 4,069 6.8 156 151 122 Local Government Aid (Calendar 2011) 1,462 2.5 56 41 80 Disparity Reduction Aid (Calendar 2011) 49 0.1 2 1 3 County Program Aid (Payable 2011) 1,214 2.0 47 38 30 Community Corrections Funding (2011) 636 1.1 24 20 16
Total Aids 59,523 100.0 2,289 2,171 2,342 B. Property Tax Credits (Payable 2011) Homestead Market Value Credit 1,262 81.8 49 43 29 Agricultural Market Value Credit 279 18.1 11 12 4 Miscellaneous Credits 2 0.1 0 0 5
Total Property Tax Credits 1,542 100.0 59 55 38 C. Property Tax Refunds (10 filed 11) Regular (Homeowners) 1,144 63.0 44 52 51 Regular (Renters) 665 36.6 26 23 37 Targeting Refund 7 0.4 0 0 0
Total Property Tax Refunds 1,815 100.0 70 75 88 Total Aids/Credits $62,881 100.0% $2,418 $2,301 $2,469
II. Property Tax Data A. Property Tax Levy (Payable 2011) County Levy $14,775 51.6% $568 $529 $466 City/Town Levy 6,196 21.6 238 263 359 School District Net Tax Capacity Levy 4,436 15.5 171 226 243 School District Referendum Market Value Levy 1,083 3.8 42 51 142 Miscellaneous District Levy 453 1.6 17 27 208 State Property Tax Levy 1,717 6.0 66 73 149
Total Levy $28,660 100.0% $1,102 $1,170 $1,568 Less Property Tax Credits 1,542 59 55 38
Net Property Taxes Payable 27,118 1,043 1,115 1,529 B. Property Valuation (2010 Assessment) Market Valuation $2,122,361 $81,620 $87,211 $105,022 Referendum Market Valuation 1,381,250 $53,119 64,446 83,805 Net Tax Capacity (NTC) 21,330 820 892 1,171 C. Average Local NTC Tax Rate 121.241 Avg. Referendum Mkt. Value Tax Rate 0.078
III. Major State Taxes Individual Income Tax (2010 filed 2011) $15,137 38.4% $582 $743 $1,225 Sales/Use Tax (Calendar 2011) 9,386 23.8 361 362 746 Motor Vehicle Sales Tax (Calendar 2011) 2,957 7.5 114 104 101 Motor Vehicle Registration Tax (Calendar 2011) 2,778 7.1 107 101 108 Motor Fuels Tax (Calendar 2011) 6,283 16.0 242 213 159 Corporate Income Tax (Calendar 2011) 1,128 2.9 43 43 147 State General Property Tax (Payable 2011) 1,717 4.4 66 73 149
Total State Taxes $39,385 100.0% $1,515 $1,639 $2,634

House Research Department May 2015Table 4 Page 178
MORRISON FIVE (5) STATEAmount
I. Major State Aids/Credits (000s) Percent Per Capita Per Capita Per Capita
A. Aids to Local Governments Education Aid (2010-2011) $44,334 53.7% $1,335 $1,273 $1,262 Human Services Aid (Calendar 2011) Medical Assistance 18,874 22.8 568 642 530 Minnesota Family Investment Program 238 0.3 7 11 14 General Assistance including GAMC 70 0.1 2 3 8 Social Services 7,255 8.8 218 247 247 Miscellaneous 629 0.8 19 26 30
Total 27,066 32.8 815 929 829 Highway Aid (Calendar 2011) County Aid 5,313 6.4 160 132 88 Municipal Aid 521 0.6 16 14 28 Township Aid 502 0.6 15 13 6
Total 6,336 7.7 191 158 122 Local Government Aid (Calendar 2011) 3,142 3.8 95 79 80 Disparity Reduction Aid (Calendar 2011) 61 0.1 2 2 3 County Program Aid (Payable 2011) 1,330 1.6 40 26 30 Community Corrections Funding (2011) 338 0.4 10 17 16
Total Aids 82,608 100.0 2,487 2,485 2,342 B. Property Tax Credits (Payable 2011) Homestead Market Value Credit 1,823 72.4 55 44 29 Agricultural Market Value Credit 695 27.6 21 13 4 Miscellaneous Credits 0 0.0 0 8 5
Total Property Tax Credits 2,518 100.0 76 65 38 C. Property Tax Refunds (10 filed 11) Regular (Homeowners) 1,128 55.9 34 33 51 Regular (Renters) 883 43.7 27 25 37 Targeting Refund 7 0.4 0 0 0
Total Property Tax Refunds 2,018 100.0 61 58 88 Total Aids/Credits $87,144 100.0% $2,624 $2,608 $2,469
II. Property Tax Data A. Property Tax Levy (Payable 2011) County Levy $15,882 44.8% $478 $561 $466 City/Town Levy 7,570 21.4 228 330 359 School District Net Tax Capacity Levy 4,935 13.9 149 223 243 School District Referendum Market Value Levy 3,283 9.3 99 66 142 Miscellaneous District Levy 829 2.3 25 29 208 State Property Tax Levy 2,936 8.3 88 176 149
Total Levy $35,435 100.0% $1,067 $1,386 $1,568 Less Property Tax Credits 2,518 76 65 38
Net Property Taxes Payable 32,917 991 1,322 1,529 B. Property Valuation (2010 Assessment) Market Valuation $3,273,712 $98,570 $150,534 $105,022 Referendum Market Valuation 1,876,292 $56,494 76,762 83,805 Net Tax Capacity (NTC) 31,460 947 1,557 1,171 C. Average Local NTC Tax Rate 92.774 Avg. Referendum Mkt. Value Tax Rate 0.177
III. Major State Taxes Individual Income Tax (2010 filed 2011) $20,724 38.9% $624 $674 $1,225 Sales/Use Tax (Calendar 2011) 12,513 23.5 377 581 746 Motor Vehicle Sales Tax (Calendar 2011) 3,639 6.8 110 106 101 Motor Vehicle Registration Tax (Calendar 2011) 3,484 6.5 105 105 108 Motor Fuels Tax (Calendar 2011) 7,448 14.0 224 201 159 Corporate Income Tax (Calendar 2011) 2,477 4.7 75 69 147 State General Property Tax (Payable 2011) 2,936 5.5 88 176 149
Total State Taxes $53,221 100.0% $1,602 $1,912 $2,634
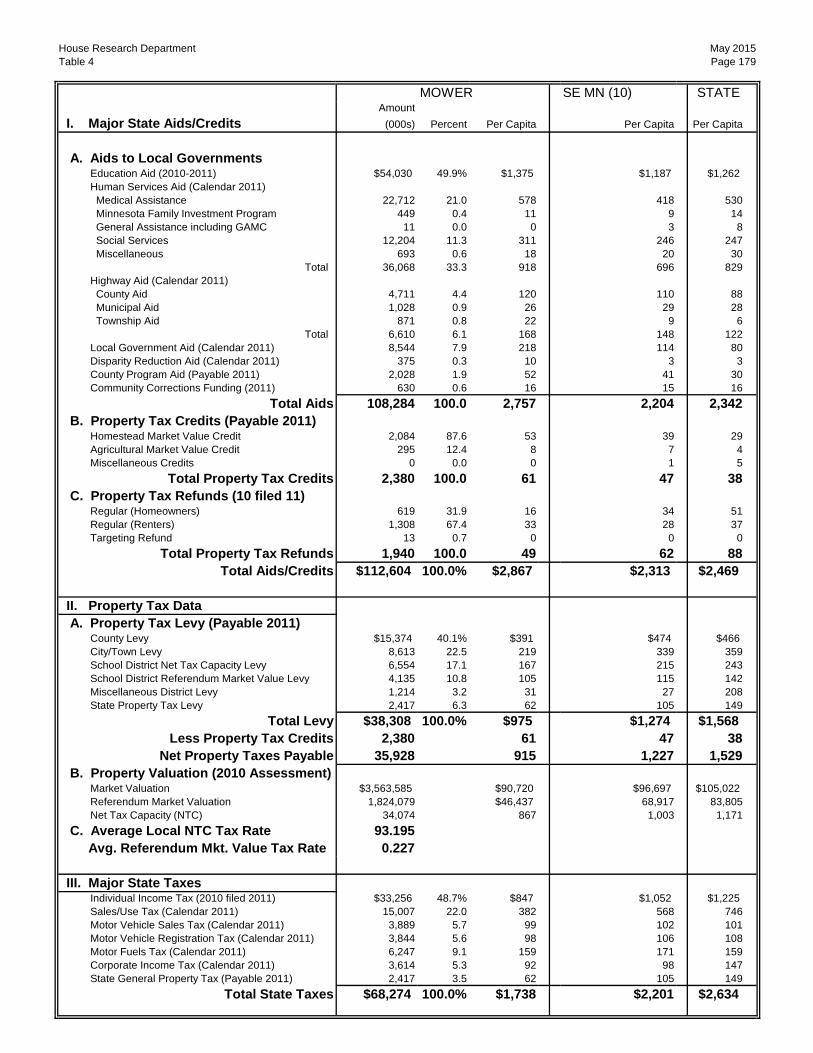
House Research Department May 2015Table 4 Page 179
MOWER SE MN (10) STATEAmount
I. Major State Aids/Credits (000s) Percent Per Capita Per Capita Per Capita
A. Aids to Local Governments Education Aid (2010-2011) $54,030 49.9% $1,375 $1,187 $1,262 Human Services Aid (Calendar 2011) Medical Assistance 22,712 21.0 578 418 530 Minnesota Family Investment Program 449 0.4 11 9 14 General Assistance including GAMC 11 0.0 0 3 8 Social Services 12,204 11.3 311 246 247 Miscellaneous 693 0.6 18 20 30
Total 36,068 33.3 918 696 829 Highway Aid (Calendar 2011) County Aid 4,711 4.4 120 110 88 Municipal Aid 1,028 0.9 26 29 28 Township Aid 871 0.8 22 9 6
Total 6,610 6.1 168 148 122 Local Government Aid (Calendar 2011) 8,544 7.9 218 114 80 Disparity Reduction Aid (Calendar 2011) 375 0.3 10 3 3 County Program Aid (Payable 2011) 2,028 1.9 52 41 30 Community Corrections Funding (2011) 630 0.6 16 15 16
Total Aids 108,284 100.0 2,757 2,204 2,342 B. Property Tax Credits (Payable 2011) Homestead Market Value Credit 2,084 87.6 53 39 29 Agricultural Market Value Credit 295 12.4 8 7 4 Miscellaneous Credits 0 0.0 0 1 5
Total Property Tax Credits 2,380 100.0 61 47 38 C. Property Tax Refunds (10 filed 11) Regular (Homeowners) 619 31.9 16 34 51 Regular (Renters) 1,308 67.4 33 28 37 Targeting Refund 13 0.7 0 0 0
Total Property Tax Refunds 1,940 100.0 49 62 88 Total Aids/Credits $112,604 100.0% $2,867 $2,313 $2,469
II. Property Tax Data A. Property Tax Levy (Payable 2011) County Levy $15,374 40.1% $391 $474 $466 City/Town Levy 8,613 22.5 219 339 359 School District Net Tax Capacity Levy 6,554 17.1 167 215 243 School District Referendum Market Value Levy 4,135 10.8 105 115 142 Miscellaneous District Levy 1,214 3.2 31 27 208 State Property Tax Levy 2,417 6.3 62 105 149
Total Levy $38,308 100.0% $975 $1,274 $1,568 Less Property Tax Credits 2,380 61 47 38
Net Property Taxes Payable 35,928 915 1,227 1,529 B. Property Valuation (2010 Assessment) Market Valuation $3,563,585 $90,720 $96,697 $105,022 Referendum Market Valuation 1,824,079 $46,437 68,917 83,805 Net Tax Capacity (NTC) 34,074 867 1,003 1,171 C. Average Local NTC Tax Rate 93.195 Avg. Referendum Mkt. Value Tax Rate 0.227
III. Major State Taxes Individual Income Tax (2010 filed 2011) $33,256 48.7% $847 $1,052 $1,225 Sales/Use Tax (Calendar 2011) 15,007 22.0 382 568 746 Motor Vehicle Sales Tax (Calendar 2011) 3,889 5.7 99 102 101 Motor Vehicle Registration Tax (Calendar 2011) 3,844 5.6 98 106 108 Motor Fuels Tax (Calendar 2011) 6,247 9.1 159 171 159 Corporate Income Tax (Calendar 2011) 3,614 5.3 92 98 147 State General Property Tax (Payable 2011) 2,417 3.5 62 105 149
Total State Taxes $68,274 100.0% $1,738 $2,201 $2,634
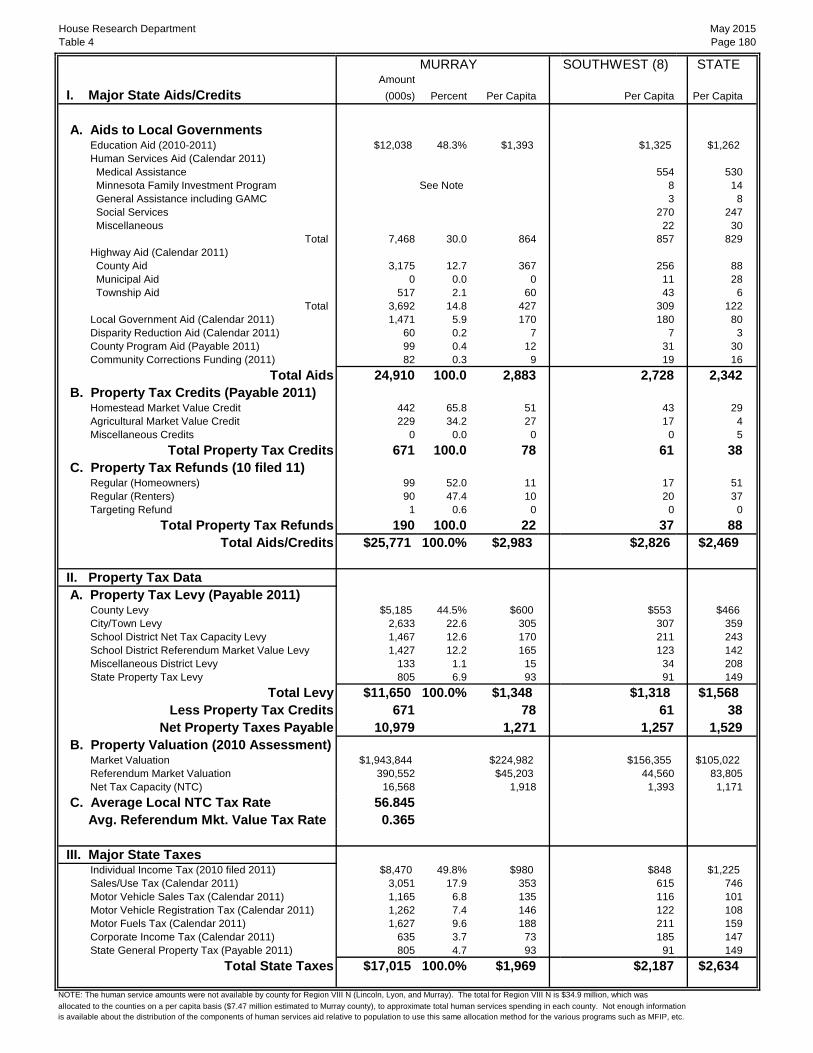
House Research Department May 2015Table 4 Page 180
MURRAY SOUTHWEST (8) STATEAmount
I. Major State Aids/Credits (000s) Percent Per Capita Per Capita Per Capita
A. Aids to Local Governments Education Aid (2010-2011) $12,038 48.3% $1,393 $1,325 $1,262 Human Services Aid (Calendar 2011) Medical Assistance 554 530 Minnesota Family Investment Program See Note 8 14 General Assistance including GAMC 3 8 Social Services 270 247 Miscellaneous 22 30
Total 7,468 30.0 864 857 829 Highway Aid (Calendar 2011) County Aid 3,175 12.7 367 256 88 Municipal Aid 0 0.0 0 11 28 Township Aid 517 2.1 60 43 6
Total 3,692 14.8 427 309 122 Local Government Aid (Calendar 2011) 1,471 5.9 170 180 80 Disparity Reduction Aid (Calendar 2011) 60 0.2 7 7 3 County Program Aid (Payable 2011) 99 0.4 12 31 30 Community Corrections Funding (2011) 82 0.3 9 19 16
Total Aids 24,910 100.0 2,883 2,728 2,342 B. Property Tax Credits (Payable 2011) Homestead Market Value Credit 442 65.8 51 43 29 Agricultural Market Value Credit 229 34.2 27 17 4 Miscellaneous Credits 0 0.0 0 0 5
Total Property Tax Credits 671 100.0 78 61 38 C. Property Tax Refunds (10 filed 11) Regular (Homeowners) 99 52.0 11 17 51 Regular (Renters) 90 47.4 10 20 37 Targeting Refund 1 0.6 0 0 0
Total Property Tax Refunds 190 100.0 22 37 88 Total Aids/Credits $25,771 100.0% $2,983 $2,826 $2,469
II. Property Tax Data A. Property Tax Levy (Payable 2011) County Levy $5,185 44.5% $600 $553 $466 City/Town Levy 2,633 22.6 305 307 359 School District Net Tax Capacity Levy 1,467 12.6 170 211 243 School District Referendum Market Value Levy 1,427 12.2 165 123 142 Miscellaneous District Levy 133 1.1 15 34 208 State Property Tax Levy 805 6.9 93 91 149
Total Levy $11,650 100.0% $1,348 $1,318 $1,568 Less Property Tax Credits 671 78 61 38
Net Property Taxes Payable 10,979 1,271 1,257 1,529 B. Property Valuation (2010 Assessment) Market Valuation $1,943,844 $224,982 $156,355 $105,022 Referendum Market Valuation 390,552 $45,203 44,560 83,805 Net Tax Capacity (NTC) 16,568 1,918 1,393 1,171 C. Average Local NTC Tax Rate 56.845 Avg. Referendum Mkt. Value Tax Rate 0.365
III. Major State Taxes Individual Income Tax (2010 filed 2011) $8,470 49.8% $980 $848 $1,225 Sales/Use Tax (Calendar 2011) 3,051 17.9 353 615 746 Motor Vehicle Sales Tax (Calendar 2011) 1,165 6.8 135 116 101 Motor Vehicle Registration Tax (Calendar 2011) 1,262 7.4 146 122 108 Motor Fuels Tax (Calendar 2011) 1,627 9.6 188 211 159 Corporate Income Tax (Calendar 2011) 635 3.7 73 185 147 State General Property Tax (Payable 2011) 805 4.7 93 91 149
Total State Taxes $17,015 100.0% $1,969 $2,187 $2,634
NOTE: The human service amounts were not available by county for Region VIII N (Lincoln, Lyon, and Murray). The total for Region VIII N is $34.9 million, which wasallocated to the counties on a per capita basis ($7.47 million estimated to Murray county), to approximate total human services spending in each county. Not enough informationis available about the distribution of the components of human services aid relative to population to use this same allocation method for the various programs such as MFIP, etc.

House Research Department May 2015Table 4 Page 181
NICOLLET NINE (9) STATEAmount
I. Major State Aids/Credits (000s) Percent Per Capita Per Capita Per Capita
A. Aids to Local Governments Education Aid (2010-2011) $32,725 51.8% $993 $1,075 $1,262 Human Services Aid (Calendar 2011) Medical Assistance 12,307 19.5 374 451 530 Minnesota Family Investment Program 461 0.7 14 8 14 General Assistance including GAMC 155 0.2 5 4 8 Social Services 5,156 8.2 156 253 247 Miscellaneous 532 0.8 16 21 30
Total 18,610 29.4 565 736 829 Highway Aid (Calendar 2011) County Aid 3,845 6.1 117 165 88 Municipal Aid 1,107 1.8 34 18 28 Township Aid 161 0.3 5 14 6
Total 5,113 8.1 155 197 122 Local Government Aid (Calendar 2011) 4,332 6.9 131 170 80 Disparity Reduction Aid (Calendar 2011) 27 0.0 1 4 3 County Program Aid (Payable 2011) 1,424 2.3 43 38 30 Community Corrections Funding (2011) 965 1.5 29 18 16
Total Aids 63,197 100.0 1,918 2,238 2,342 B. Property Tax Credits (Payable 2011) Homestead Market Value Credit 1,083 84.0 33 39 29 Agricultural Market Value Credit 207 16.0 6 10 4 Miscellaneous Credits 0 0.0 0 2 5
Total Property Tax Credits 1,290 100.0 39 51 38 C. Property Tax Refunds (10 filed 11) Regular (Homeowners) 994 49.7 30 27 51 Regular (Renters) 1,004 50.2 30 26 37 Targeting Refund 2 0.1 0 0 0
Total Property Tax Refunds 2,000 100.0 61 53 88 Total Aids/Credits $66,486 100.0% $2,018 $2,342 $2,469
II. Property Tax Data A. Property Tax Levy (Payable 2011) County Levy $15,462 43.2% $469 $498 $466 City/Town Levy 8,703 24.3 264 317 359 School District Net Tax Capacity Levy 5,109 14.3 155 182 243 School District Referendum Market Value Levy 3,056 8.5 93 96 142 Miscellaneous District Levy 1,072 3.0 33 21 208 State Property Tax Levy 2,356 6.6 72 97 149
Total Levy $35,758 100.0% $1,085 $1,211 $1,568 Less Property Tax Credits 1,290 39 51 38
Net Property Taxes Payable 34,468 1,046 1,160 1,529 B. Property Valuation (2010 Assessment) Market Valuation $3,053,068 $92,660 $115,995 $105,022 Referendum Market Valuation 1,978,398 $60,044 59,665 83,805 Net Tax Capacity (NTC) 29,877 907 1,116 1,171 C. Average Local NTC Tax Rate 101.567 Avg. Referendum Mkt. Value Tax Rate 0.154
III. Major State Taxes Individual Income Tax (2010 filed 2011) $31,832 53.9% $966 $867 $1,225 Sales/Use Tax (Calendar 2011) 10,424 17.7 316 579 746 Motor Vehicle Sales Tax (Calendar 2011) 3,065 5.2 93 106 101 Motor Vehicle Registration Tax (Calendar 2011) 3,261 5.5 99 110 108 Motor Fuels Tax (Calendar 2011) 5,691 9.6 173 169 159 Corporate Income Tax (Calendar 2011) 2,417 4.1 73 170 147 State General Property Tax (Payable 2011) 2,356 4.0 72 97 149
Total State Taxes $59,045 100.0% $1,792 $2,100 $2,634

House Research Department May 2015Table 4 Page 182
NOBLES SOUTHWEST (8) STATEAmount
I. Major State Aids/Credits (000s) Percent Per Capita Per Capita Per Capita
A. Aids to Local Governments Education Aid (2010-2011) $32,189 54.4% $1,507 $1,325 $1,262 Human Services Aid (Calendar 2011) Medical Assistance 11,580 19.6 542 554 530 Minnesota Family Investment Program 264 0.4 12 8 14 General Assistance including GAMC 28 0.0 1 3 8 Social Services 4,162 7.0 195 270 247 Miscellaneous 421 0.7 20 22 30
Total 16,455 27.8 770 857 829 Highway Aid (Calendar 2011) County Aid 4,475 7.6 209 256 88 Municipal Aid 417 0.7 20 11 28 Township Aid 445 0.8 21 43 6
Total 5,337 9.0 250 309 122 Local Government Aid (Calendar 2011) 3,854 6.5 180 180 80 Disparity Reduction Aid (Calendar 2011) 161 0.3 8 7 3 County Program Aid (Payable 2011) 802 1.4 38 31 30 Community Corrections Funding (2011) 336 0.6 16 19 16
Total Aids 59,134 100.0 2,768 2,728 2,342 B. Property Tax Credits (Payable 2011) Homestead Market Value Credit 787 74.3 37 43 29 Agricultural Market Value Credit 272 25.7 13 17 4 Miscellaneous Credits 0 0.0 0 0 5
Total Property Tax Credits 1,058 100.0 50 61 38 C. Property Tax Refunds (10 filed 11) Regular (Homeowners) 337 44.7 16 17 51 Regular (Renters) 416 55.2 19 20 37 Targeting Refund 1 0.1 0 0 0
Total Property Tax Refunds 754 100.0 35 37 88 Total Aids/Credits $60,946 100.0% $2,853 $2,826 $2,469
II. Property Tax Data A. Property Tax Levy (Payable 2011) County Levy $9,739 40.2% $456 $553 $466 City/Town Levy 5,417 22.3 254 307 359 School District Net Tax Capacity Levy 3,411 14.1 160 211 243 School District Referendum Market Value Levy 2,614 10.8 122 123 142 Miscellaneous District Levy 1,184 4.9 55 34 208 State Property Tax Levy 1,880 7.8 88 91 149
Total Levy $24,245 100.0% $1,135 $1,318 $1,568 Less Property Tax Credits 1,058 50 61 38
Net Property Taxes Payable 23,187 1,085 1,257 1,529 B. Property Valuation (2010 Assessment) Market Valuation $2,579,543 $120,737 $156,355 $105,022 Referendum Market Valuation 855,338 $40,035 44,560 83,805 Net Tax Capacity (NTC) 23,585 1,104 1,393 1,171 C. Average Local NTC Tax Rate 83.745 Avg. Referendum Mkt. Value Tax Rate 0.306
III. Major State Taxes Individual Income Tax (2010 filed 2011) $15,971 36.3% $748 $848 $1,225 Sales/Use Tax (Calendar 2011) 12,786 29.0 598 615 746 Motor Vehicle Sales Tax (Calendar 2011) 2,265 5.1 106 116 101 Motor Vehicle Registration Tax (Calendar 2011) 2,327 5.3 109 122 108 Motor Fuels Tax (Calendar 2011) 4,445 10.1 208 211 159 Corporate Income Tax (Calendar 2011) 4,353 9.9 204 185 147 State General Property Tax (Payable 2011) 1,880 4.3 88 91 149
Total State Taxes $44,028 100.0% $2,061 $2,187 $2,634
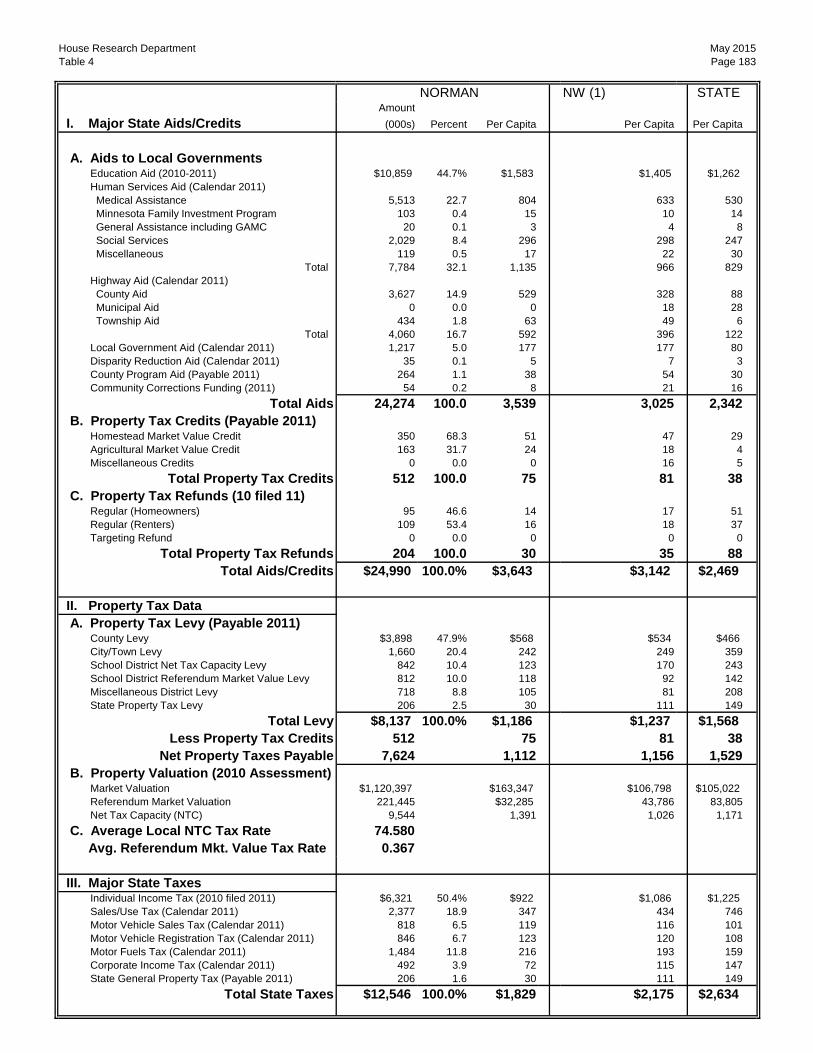
House Research Department May 2015Table 4 Page 183
NORMAN NW (1) STATEAmount
I. Major State Aids/Credits (000s) Percent Per Capita Per Capita Per Capita
A. Aids to Local Governments Education Aid (2010-2011) $10,859 44.7% $1,583 $1,405 $1,262 Human Services Aid (Calendar 2011) Medical Assistance 5,513 22.7 804 633 530 Minnesota Family Investment Program 103 0.4 15 10 14 General Assistance including GAMC 20 0.1 3 4 8 Social Services 2,029 8.4 296 298 247 Miscellaneous 119 0.5 17 22 30
Total 7,784 32.1 1,135 966 829 Highway Aid (Calendar 2011) County Aid 3,627 14.9 529 328 88 Municipal Aid 0 0.0 0 18 28 Township Aid 434 1.8 63 49 6
Total 4,060 16.7 592 396 122 Local Government Aid (Calendar 2011) 1,217 5.0 177 177 80 Disparity Reduction Aid (Calendar 2011) 35 0.1 5 7 3 County Program Aid (Payable 2011) 264 1.1 38 54 30 Community Corrections Funding (2011) 54 0.2 8 21 16
Total Aids 24,274 100.0 3,539 3,025 2,342 B. Property Tax Credits (Payable 2011) Homestead Market Value Credit 350 68.3 51 47 29 Agricultural Market Value Credit 163 31.7 24 18 4 Miscellaneous Credits 0 0.0 0 16 5
Total Property Tax Credits 512 100.0 75 81 38 C. Property Tax Refunds (10 filed 11) Regular (Homeowners) 95 46.6 14 17 51 Regular (Renters) 109 53.4 16 18 37 Targeting Refund 0 0.0 0 0 0
Total Property Tax Refunds 204 100.0 30 35 88 Total Aids/Credits $24,990 100.0% $3,643 $3,142 $2,469
II. Property Tax Data A. Property Tax Levy (Payable 2011) County Levy $3,898 47.9% $568 $534 $466 City/Town Levy 1,660 20.4 242 249 359 School District Net Tax Capacity Levy 842 10.4 123 170 243 School District Referendum Market Value Levy 812 10.0 118 92 142 Miscellaneous District Levy 718 8.8 105 81 208 State Property Tax Levy 206 2.5 30 111 149
Total Levy $8,137 100.0% $1,186 $1,237 $1,568 Less Property Tax Credits 512 75 81 38
Net Property Taxes Payable 7,624 1,112 1,156 1,529 B. Property Valuation (2010 Assessment) Market Valuation $1,120,397 $163,347 $106,798 $105,022 Referendum Market Valuation 221,445 $32,285 43,786 83,805 Net Tax Capacity (NTC) 9,544 1,391 1,026 1,171 C. Average Local NTC Tax Rate 74.580 Avg. Referendum Mkt. Value Tax Rate 0.367
III. Major State Taxes Individual Income Tax (2010 filed 2011) $6,321 50.4% $922 $1,086 $1,225 Sales/Use Tax (Calendar 2011) 2,377 18.9 347 434 746 Motor Vehicle Sales Tax (Calendar 2011) 818 6.5 119 116 101 Motor Vehicle Registration Tax (Calendar 2011) 846 6.7 123 120 108 Motor Fuels Tax (Calendar 2011) 1,484 11.8 216 193 159 Corporate Income Tax (Calendar 2011) 492 3.9 72 115 147 State General Property Tax (Payable 2011) 206 1.6 30 111 149
Total State Taxes $12,546 100.0% $1,829 $2,175 $2,634

House Research Department May 2015Table 4 Page 184
OLMSTED SE MN (10) STATEAmount
I. Major State Aids/Credits (000s) Percent Per Capita Per Capita Per Capita
A. Aids to Local Governments Education Aid (2010-2011) $167,943 57.2% $1,155 $1,187 $1,262 Human Services Aid (Calendar 2011) Medical Assistance 57,008 19.4 392 418 530 Minnesota Family Investment Program 1,491 0.5 10 9 14 General Assistance including GAMC 652 0.2 4 3 8 Social Services 37,436 12.8 258 246 247 Miscellaneous 3,949 1.3 27 20 30
Total 100,536 34.2 692 696 829 Highway Aid (Calendar 2011) County Aid 6,513 2.2 45 110 88 Municipal Aid 4,352 1.5 30 29 28 Township Aid 325 0.1 2 9 6
Total 11,190 3.8 77 148 122 Local Government Aid (Calendar 2011) 6,376 2.2 44 114 80 Disparity Reduction Aid (Calendar 2011) 33 0.0 0 3 3 County Program Aid (Payable 2011) 5,368 1.8 37 41 30 Community Corrections Funding (2011) 2,118 0.7 15 15 16
Total Aids 293,564 100.0 2,019 2,204 2,342 B. Property Tax Credits (Payable 2011) Homestead Market Value Credit 4,515 91.2 31 39 29 Agricultural Market Value Credit 420 8.5 3 7 4 Miscellaneous Credits 16 0.3 0 1 5
Total Property Tax Credits 4,952 100.0 34 47 38 C. Property Tax Refunds (10 filed 11) Regular (Homeowners) 4,758 50.2 33 34 51 Regular (Renters) 4,674 49.3 32 28 37 Targeting Refund 50 0.5 0 0 0
Total Property Tax Refunds 9,482 100.0 65 62 88 Total Aids/Credits $307,998 100.0% $2,119 $2,313 $2,469
II. Property Tax Data A. Property Tax Levy (Payable 2011) County Levy $80,312 38.6% $552 $474 $466 City/Town Levy 56,589 27.2 389 339 359 School District Net Tax Capacity Levy 34,550 16.6 238 215 243 School District Referendum Market Value Levy 13,060 6.3 90 115 142 Miscellaneous District Levy 2,445 1.2 17 27 208 State Property Tax Levy 21,150 10.2 145 105 149
Total Levy $208,107 100.0% $1,431 $1,274 $1,568 Less Property Tax Credits 4,952 34 47 38
Net Property Taxes Payable 203,155 1,397 1,227 1,529 B. Property Valuation (2010 Assessment) Market Valuation $12,974,903 $89,249 $96,697 $105,022 Referendum Market Valuation 11,774,139 $80,989 68,917 83,805 Net Tax Capacity (NTC) 148,881 1,024 1,003 1,171 C. Average Local NTC Tax Rate 116.694 Avg. Referendum Mkt. Value Tax Rate 0.112
III. Major State Taxes Individual Income Tax (2010 filed 2011) $220,934 50.9% $1,520 $1,052 $1,225 Sales/Use Tax (Calendar 2011) 127,203 29.3 875 568 746 Motor Vehicle Sales Tax (Calendar 2011) 14,446 3.3 99 102 101 Motor Vehicle Registration Tax (Calendar 2011) 15,677 3.6 108 106 108 Motor Fuels Tax (Calendar 2011) 20,683 4.8 142 171 159 Corporate Income Tax (Calendar 2011) 13,947 3.2 96 98 147 State General Property Tax (Payable 2011) 21,150 4.9 145 105 149
Total State Taxes $434,040 100.0% $2,986 $2,201 $2,634

House Research Department May 2015Table 4 Page 185
OTTER TAIL W CENTRAL (4) STATEAmount
I. Major State Aids/Credits (000s) Percent Per Capita Per Capita Per Capita
A. Aids to Local Governments Education Aid (2010-2011) $63,484 48.8% $1,109 $1,158 $1,262 Human Services Aid (Calendar 2011) Medical Assistance 28,456 21.9 497 564 530 Minnesota Family Investment Program 286 0.2 5 9 14 General Assistance including GAMC 272 0.2 5 5 8 Social Services 14,278 11.0 249 266 247 Miscellaneous 1,280 1.0 22 23 30
Total 44,571 34.3 779 868 829 Highway Aid (Calendar 2011) County Aid 10,133 7.8 177 170 88 Municipal Aid 2,634 2.0 46 26 28 Township Aid 1,178 0.9 21 20 6
Total 13,945 10.7 244 216 122 Local Government Aid (Calendar 2011) 6,174 4.7 108 115 80 Disparity Reduction Aid (Calendar 2011) 32 0.0 1 1 3 County Program Aid (Payable 2011) 1,255 1.0 22 34 30 Community Corrections Funding (2011) 630 0.5 11 17 16
Total Aids 130,091 100.0 2,273 2,409 2,342 B. Property Tax Credits (Payable 2011) Homestead Market Value Credit 2,746 75.1 48 43 29 Agricultural Market Value Credit 888 24.3 16 11 4 Miscellaneous Credits 21 0.6 0 24 5
Total Property Tax Credits 3,655 100.0 64 78 38 C. Property Tax Refunds (10 filed 11) Regular (Homeowners) 1,354 50.3 24 26 51 Regular (Renters) 1,329 49.4 23 25 37 Targeting Refund 8 0.3 0 1 0
Total Property Tax Refunds 2,691 100.0 47 52 88 Total Aids/Credits $136,438 100.0% $2,383 $2,539 $2,469
II. Property Tax Data A. Property Tax Levy (Payable 2011) County Levy $31,343 41.7% $548 $563 $466 City/Town Levy 16,813 22.4 294 275 359 School District Net Tax Capacity Levy 12,293 16.3 215 204 243 School District Referendum Market Value Levy 3,987 5.3 70 96 142 Miscellaneous District Levy 2,713 3.6 47 52 208 State Property Tax Levy 8,055 10.7 141 118 149
Total Levy $75,203 100.0% $1,314 $1,308 $1,568 Less Property Tax Credits 3,655 64 78 38
Net Property Taxes Payable 71,548 1,250 1,231 1,529 B. Property Valuation (2010 Assessment) Market Valuation $8,663,512 $151,346 $132,717 $105,022 Referendum Market Valuation 4,153,737 $72,563 66,557 83,805 Net Tax Capacity (NTC) 85,639 1,496 1,311 1,171 C. Average Local NTC Tax Rate 73.686 Avg. Referendum Mkt. Value Tax Rate 0.097
III. Major State Taxes Individual Income Tax (2010 filed 2011) $46,474 36.6% $812 $849 $1,225 Sales/Use Tax (Calendar 2011) 41,917 33.0 732 610 746 Motor Vehicle Sales Tax (Calendar 2011) 6,196 4.9 108 106 101 Motor Vehicle Registration Tax (Calendar 2011) 6,164 4.9 108 109 108 Motor Fuels Tax (Calendar 2011) 12,249 9.7 214 207 159 Corporate Income Tax (Calendar 2011) 5,790 4.6 101 83 147 State General Property Tax (Payable 2011) 8,055 6.4 141 118 149
Total State Taxes $126,845 100.0% $2,216 $2,081 $2,634

House Research Department May 2015Table 4 Page 186
PENNINGTON NW (1) STATEAmount
I. Major State Aids/Credits (000s) Percent Per Capita Per Capita Per Capita
A. Aids to Local Governments Education Aid (2010-2011) $17,501 47.4% $1,248 $1,405 $1,262 Human Services Aid (Calendar 2011) Medical Assistance 7,994 21.7 570 633 530 Minnesota Family Investment Program 90 0.2 6 10 14 General Assistance including GAMC -1 0.0 0 4 8 Social Services 3,704 10.0 264 298 247 Miscellaneous 372 1.0 27 22 30
Total 12,159 32.9 867 966 829 Highway Aid (Calendar 2011) County Aid 2,644 7.2 189 328 88 Municipal Aid 595 1.6 42 18 28 Township Aid 171 0.5 12 49 6
Total 3,410 9.2 243 396 122 Local Government Aid (Calendar 2011) 2,510 6.8 179 177 80 Disparity Reduction Aid (Calendar 2011) 194 0.5 14 7 3 County Program Aid (Payable 2011) 820 2.2 59 54 30 Community Corrections Funding (2011) 311 0.8 22 21 16
Total Aids 36,904 100.0 2,633 3,025 2,342 B. Property Tax Credits (Payable 2011) Homestead Market Value Credit 644 81.5 46 47 29 Agricultural Market Value Credit 146 18.5 10 18 4 Miscellaneous Credits 0 0.0 0 16 5
Total Property Tax Credits 790 100.0 56 81 38 C. Property Tax Refunds (10 filed 11) Regular (Homeowners) 275 45.9 20 17 51 Regular (Renters) 324 54.1 23 18 37 Targeting Refund 0 0.1 0 0 0
Total Property Tax Refunds 599 100.0 43 35 88 Total Aids/Credits $38,294 100.0% $2,732 $3,142 $2,469
II. Property Tax Data A. Property Tax Levy (Payable 2011) County Levy $6,718 45.4% $479 $534 $466 City/Town Levy 2,040 13.8 145 249 359 School District Net Tax Capacity Levy 2,587 17.5 185 170 243 School District Referendum Market Value Levy 1,141 7.7 81 92 142 Miscellaneous District Levy 939 6.3 67 81 208 State Property Tax Levy 1,379 9.3 98 111 149
Total Levy $14,804 100.0% $1,056 $1,237 $1,568 Less Property Tax Credits 790 56 81 38
Net Property Taxes Payable 14,015 1,000 1,156 1,529 B. Property Valuation (2010 Assessment) Market Valuation $914,003 $65,202 $106,798 $105,022 Referendum Market Valuation 604,084 $43,093 43,786 83,805 Net Tax Capacity (NTC) 9,524 679 1,026 1,171 C. Average Local NTC Tax Rate 126.876 Avg. Referendum Mkt. Value Tax Rate 0.222
III. Major State Taxes Individual Income Tax (2010 filed 2011) $34,086 63.4% $2,432 $1,086 $1,225 Sales/Use Tax (Calendar 2011) 10,027 18.7 715 434 746 Motor Vehicle Sales Tax (Calendar 2011) 1,497 2.8 107 116 101 Motor Vehicle Registration Tax (Calendar 2011) 1,513 2.8 108 120 108 Motor Fuels Tax (Calendar 2011) 2,111 3.9 151 193 159 Corporate Income Tax (Calendar 2011) 3,114 5.8 222 115 147 State General Property Tax (Payable 2011) 1,379 2.6 98 111 149
Total State Taxes $53,726 100.0% $3,833 $2,175 $2,634

House Research Department May 2015Table 4 Page 187
PINE E CENTRAL (7E) STATEAmount
I. Major State Aids/Credits (000s) Percent Per Capita Per Capita Per Capita
A. Aids to Local Governments Education Aid (2010-2011) $32,949 47.3% $1,111 $1,179 $1,262 Human Services Aid (Calendar 2011) Medical Assistance 18,421 26.5 621 493 530 Minnesota Family Investment Program 422 0.6 14 9 14 General Assistance including GAMC 157 0.2 5 4 8 Social Services 6,234 9.0 210 218 247 Miscellaneous 561 0.8 19 16 30
Total 25,796 37.0 870 740 829 Highway Aid (Calendar 2011) County Aid 6,931 10.0 234 131 88 Municipal Aid 0 0.0 0 13 28 Township Aid 416 0.6 14 8 6
Total 7,347 10.6 248 151 122 Local Government Aid (Calendar 2011) 1,806 2.6 61 41 80 Disparity Reduction Aid (Calendar 2011) 2 0.0 0 1 3 County Program Aid (Payable 2011) 1,199 1.7 40 38 30 Community Corrections Funding (2011) 532 0.8 18 20 16
Total Aids 69,631 100.0 2,349 2,171 2,342 B. Property Tax Credits (Payable 2011) Homestead Market Value Credit 1,525 76.5 51 43 29 Agricultural Market Value Credit 463 23.2 16 12 4 Miscellaneous Credits 6 0.3 0 0 5
Total Property Tax Credits 1,994 100.0 67 55 38 C. Property Tax Refunds (10 filed 11) Regular (Homeowners) 883 58.4 30 52 51 Regular (Renters) 625 41.4 21 23 37 Targeting Refund 3 0.2 0 0 0
Total Property Tax Refunds 1,511 100.0 51 75 88 Total Aids/Credits $73,135 100.0% $2,467 $2,301 $2,469
II. Property Tax Data A. Property Tax Levy (Payable 2011) County Levy $14,288 44.3% $482 $529 $466 City/Town Levy 6,514 20.2 220 263 359 School District Net Tax Capacity Levy 5,858 18.1 198 226 243 School District Referendum Market Value Levy 2,286 7.1 77 51 142 Miscellaneous District Levy 691 2.1 23 27 208 State Property Tax Levy 2,644 8.2 89 73 149
Total Levy $32,281 100.0% $1,089 $1,170 $1,568 Less Property Tax Credits 1,994 67 55 38
Net Property Taxes Payable 30,287 1,022 1,115 1,529 B. Property Valuation (2010 Assessment) Market Valuation $2,997,814 $101,117 $87,211 $105,022 Referendum Market Valuation 1,712,509 $57,763 64,446 83,805 Net Tax Capacity (NTC) 30,225 1,019 892 1,171 C. Average Local NTC Tax Rate 90.492 Avg. Referendum Mkt. Value Tax Rate 0.133
III. Major State Taxes Individual Income Tax (2010 filed 2011) $14,680 34.3% $495 $743 $1,225 Sales/Use Tax (Calendar 2011) 10,032 23.4 338 362 746 Motor Vehicle Sales Tax (Calendar 2011) 2,826 6.6 95 104 101 Motor Vehicle Registration Tax (Calendar 2011) 2,623 6.1 88 101 108 Motor Fuels Tax (Calendar 2011) 8,756 20.5 295 213 159 Corporate Income Tax (Calendar 2011) 1,254 2.9 42 43 147 State General Property Tax (Payable 2011) 2,644 6.2 89 73 149
Total State Taxes $42,815 100.0% $1,444 $1,639 $2,634

House Research Department May 2015Table 4 Page 188
PIPESTONE SOUTHWEST (8) STATEAmount
I. Major State Aids/Credits (000s) Percent Per Capita Per Capita Per Capita
A. Aids to Local Governments Education Aid (2010-2011) $12,148 45.1% $1,275 $1,325 $1,262 Human Services Aid (Calendar 2011) Medical Assistance 5,993 22.3 629 554 530 Minnesota Family Investment Program 80 0.3 8 8 14 General Assistance including GAMC 45 0.2 5 3 8 Social Services 2,061 7.7 216 270 247 Miscellaneous 225 0.8 24 22 30
Total 8,403 31.2 882 857 829 Highway Aid (Calendar 2011) County Aid 2,603 9.7 273 256 88 Municipal Aid 0 0.0 0 11 28 Township Aid 583 2.2 61 43 6
Total 3,186 11.8 335 309 122 Local Government Aid (Calendar 2011) 2,211 8.2 232 180 80 Disparity Reduction Aid (Calendar 2011) 142 0.5 15 7 3 County Program Aid (Payable 2011) 692 2.6 73 31 30 Community Corrections Funding (2011) 140 0.5 15 19 16
Total Aids 26,923 100.0 2,827 2,728 2,342 B. Property Tax Credits (Payable 2011) Homestead Market Value Credit 409 69.9 43 43 29 Agricultural Market Value Credit 176 30.1 18 17 4 Miscellaneous Credits 0 0.0 0 0 5
Total Property Tax Credits 585 100.0 61 61 38 C. Property Tax Refunds (10 filed 11) Regular (Homeowners) 125 50.1 13 17 51 Regular (Renters) 122 49.0 13 20 37 Targeting Refund 2 0.9 0 0 0
Total Property Tax Refunds 249 100.0 26 37 88 Total Aids/Credits $27,757 100.0% $2,914 $2,826 $2,469
II. Property Tax Data A. Property Tax Levy (Payable 2011) County Levy $4,301 39.8% $452 $553 $466 City/Town Levy 2,903 26.9 305 307 359 School District Net Tax Capacity Levy 1,816 16.8 191 211 243 School District Referendum Market Value Levy 1,003 9.3 105 123 142 Miscellaneous District Levy 163 1.5 17 34 208 State Property Tax Levy 615 5.7 65 91 149
Total Levy $10,802 100.0% $1,134 $1,318 $1,568 Less Property Tax Credits 585 61 61 38
Net Property Taxes Payable 10,217 1,073 1,257 1,529 B. Property Valuation (2010 Assessment) Market Valuation $1,282,214 $134,616 $156,355 $105,022 Referendum Market Valuation 339,682 $35,662 44,560 83,805 Net Tax Capacity (NTC) 11,070 1,162 1,393 1,171 C. Average Local NTC Tax Rate 80.798 Avg. Referendum Mkt. Value Tax Rate 0.366
III. Major State Taxes Individual Income Tax (2010 filed 2011) $6,953 41.6% $730 $848 $1,225 Sales/Use Tax (Calendar 2011) 4,309 25.8 452 615 746 Motor Vehicle Sales Tax (Calendar 2011) 1,169 7.0 123 116 101 Motor Vehicle Registration Tax (Calendar 2011) 1,197 7.2 126 122 108 Motor Fuels Tax (Calendar 2011) 1,699 10.2 178 211 159 Corporate Income Tax (Calendar 2011) 760 4.5 80 185 147 State General Property Tax (Payable 2011) 615 3.7 65 91 149
Total State Taxes $16,702 100.0% $1,753 $2,187 $2,634

House Research Department May 2015Table 4 Page 189
POLK NW (1) STATEAmount
I. Major State Aids/Credits (000s) Percent Per Capita Per Capita Per Capita
A. Aids to Local Governments Education Aid (2010-2011) $40,912 42.3% $1,299 $1,405 $1,262 Human Services Aid (Calendar 2011) Medical Assistance 22,907 23.7 727 633 530 Minnesota Family Investment Program 526 0.5 17 10 14 General Assistance including GAMC 230 0.2 7 4 8 Social Services 12,579 13.0 399 298 247 Miscellaneous 841 0.9 27 22 30
Total 37,083 38.3 1,178 966 829 Highway Aid (Calendar 2011) County Aid 7,105 7.3 226 328 88 Municipal Aid 984 1.0 31 18 28 Township Aid 1,328 1.4 42 49 6
Total 9,417 9.7 299 396 122 Local Government Aid (Calendar 2011) 6,884 7.1 219 177 80 Disparity Reduction Aid (Calendar 2011) 217 0.2 7 7 3 County Program Aid (Payable 2011) 1,418 1.5 45 54 30 Community Corrections Funding (2011) 897 0.9 28 21 16
Total Aids 96,827 100.0 3,075 3,025 2,342 B. Property Tax Credits (Payable 2011) Homestead Market Value Credit 1,262 46.8 40 47 29 Agricultural Market Value Credit 441 16.3 14 18 4 Miscellaneous Credits 996 36.9 32 16 5
Total Property Tax Credits 2,699 100.0 86 81 38 C. Property Tax Refunds (10 filed 11) Regular (Homeowners) 610 47.4 19 17 51 Regular (Renters) 675 52.4 21 18 37 Targeting Refund 3 0.2 0 0 0
Total Property Tax Refunds 1,287 100.0 41 35 88 Total Aids/Credits $100,813 100.0% $3,202 $3,142 $2,469
II. Property Tax Data A. Property Tax Levy (Payable 2011) County Levy $18,821 46.2% $598 $534 $466 City/Town Levy 8,945 21.9 284 249 359 School District Net Tax Capacity Levy 4,896 12.0 155 170 243 School District Referendum Market Value Levy 2,730 6.7 87 92 142 Miscellaneous District Levy 2,489 6.1 79 81 208 State Property Tax Levy 2,900 7.1 92 111 149
Total Levy $40,780 100.0% $1,295 $1,237 $1,568 Less Property Tax Credits 2,699 86 81 38
Net Property Taxes Payable 38,082 1,209 1,156 1,529 B. Property Valuation (2010 Assessment) Market Valuation $3,417,722 $108,537 $106,798 $105,022 Referendum Market Valuation 1,454,341 $46,186 43,786 83,805 Net Tax Capacity (NTC) 32,629 1,036 1,026 1,171 C. Average Local NTC Tax Rate 107.726 Avg. Referendum Mkt. Value Tax Rate 0.188
III. Major State Taxes Individual Income Tax (2010 filed 2011) $25,086 43.6% $797 $1,086 $1,225 Sales/Use Tax (Calendar 2011) 13,671 23.8 434 434 746 Motor Vehicle Sales Tax (Calendar 2011) 3,441 6.0 109 116 101 Motor Vehicle Registration Tax (Calendar 2011) 3,641 6.3 116 120 108 Motor Fuels Tax (Calendar 2011) 6,017 10.5 191 193 159 Corporate Income Tax (Calendar 2011) 2,768 4.8 88 115 147 State General Property Tax (Payable 2011) 2,900 5.0 92 111 149
Total State Taxes $57,524 100.0% $1,827 $2,175 $2,634

House Research Department May 2015Table 4 Page 190
POPE W CENTRAL (4) STATEAmount
I. Major State Aids/Credits (000s) Percent Per Capita Per Capita Per Capita
A. Aids to Local Governments Education Aid (2010-2011) $12,967 46.4% $1,190 $1,158 $1,262 Human Services Aid (Calendar 2011) Medical Assistance 6,741 24.1 619 564 530 Minnesota Family Investment Program 68 0.2 6 9 14 General Assistance including GAMC 61 0.2 6 5 8 Social Services 2,968 10.6 272 266 247 Miscellaneous 222 0.8 20 23 30
Total 10,060 36.0 923 868 829 Highway Aid (Calendar 2011) County Aid 2,920 10.4 268 170 88 Municipal Aid 0 0.0 0 26 28 Township Aid 336 1.2 31 20 6
Total 3,256 11.6 299 216 122 Local Government Aid (Calendar 2011) 1,139 4.1 105 115 80 Disparity Reduction Aid (Calendar 2011) 50 0.2 5 1 3 County Program Aid (Payable 2011) 327 1.2 30 34 30 Community Corrections Funding (2011) 167 0.6 15 17 16
Total Aids 27,965 100.0 2,567 2,409 2,342 B. Property Tax Credits (Payable 2011) Homestead Market Value Credit 567 71.9 52 43 29 Agricultural Market Value Credit 217 27.5 20 11 4 Miscellaneous Credits 5 0.6 0 24 5
Total Property Tax Credits 789 100.0 72 78 38 C. Property Tax Refunds (10 filed 11) Regular (Homeowners) 309 54.6 28 26 51 Regular (Renters) 255 45.1 23 25 37 Targeting Refund 2 0.3 0 1 0
Total Property Tax Refunds 566 100.0 52 52 88 Total Aids/Credits $29,320 100.0% $2,691 $2,539 $2,469
II. Property Tax Data A. Property Tax Levy (Payable 2011) County Levy $6,662 43.6% $611 $563 $466 City/Town Levy 3,450 22.6 317 275 359 School District Net Tax Capacity Levy 2,492 16.3 229 204 243 School District Referendum Market Value Levy 1,107 7.2 102 96 142 Miscellaneous District Levy 523 3.4 48 52 208 State Property Tax Levy 1,056 6.9 97 118 149
Total Levy $15,291 100.0% $1,403 $1,308 $1,568 Less Property Tax Credits 789 72 78 38
Net Property Taxes Payable 14,502 1,331 1,231 1,529 B. Property Valuation (2010 Assessment) Market Valuation $1,841,439 $169,001 $132,717 $105,022 Referendum Market Valuation 744,645 $68,341 66,557 83,805 Net Tax Capacity (NTC) 16,784 1,540 1,311 1,171 C. Average Local NTC Tax Rate 78.218 Avg. Referendum Mkt. Value Tax Rate 0.149
III. Major State Taxes Individual Income Tax (2010 filed 2011) $10,057 48.6% $923 $849 $1,225 Sales/Use Tax (Calendar 2011) 3,557 17.2 326 610 746 Motor Vehicle Sales Tax (Calendar 2011) 1,275 6.2 117 106 101 Motor Vehicle Registration Tax (Calendar 2011) 1,316 6.4 121 109 108 Motor Fuels Tax (Calendar 2011) 2,154 10.4 198 207 159 Corporate Income Tax (Calendar 2011) 1,298 6.3 119 83 147 State General Property Tax (Payable 2011) 1,056 5.1 97 118 149
Total State Taxes $20,713 100.0% $1,901 $2,081 $2,634

House Research Department May 2015Table 4 Page 191
RAMSEY METRO (11) STATEAmount
I. Major State Aids/Credits (000s) Percent Per Capita Per Capita Per Capita
A. Aids to Local Governments Education Aid (2010-2011) $730,511 50.2% $1,430 $1,307 $1,262 Human Services Aid (Calendar 2011) Medical Assistance 405,166 27.8 793 542 530 Minnesota Family Investment Program 19,034 1.3 37 17 14 General Assistance including GAMC 6,175 0.4 12 10 8 Social Services 163,838 11.3 321 246 247 Miscellaneous 20,084 1.4 39 36 30
Total 614,297 42.2 1,203 851 829 Highway Aid (Calendar 2011) County Aid 14,594 1.0 29 38 88 Municipal Aid 18,420 1.3 36 33 28 Township Aid 20 0.0 0 0 6
Total 33,034 2.3 65 71 122 Local Government Aid (Calendar 2011) 54,971 3.8 108 46 80 Disparity Reduction Aid (Calendar 2011) 656 0.0 1 0 3 County Program Aid (Payable 2011) 12,440 0.9 24 23 30 Community Corrections Funding (2011) 9,804 0.7 19 14 16
Total Aids 1,455,713 100.0 2,850 2,314 2,342 B. Property Tax Credits (Payable 2011) Homestead Market Value Credit 11,490 100.0 22 20 29 Agricultural Market Value Credit 1 0.0 0 0 4 Miscellaneous Credits 0 0.0 0 0 5
Total Property Tax Credits 11,491 100.0 22 21 38 C. Property Tax Refunds (10 filed 11) Regular (Homeowners) 31,259 50.9 61 67 51 Regular (Renters) 30,074 48.9 59 45 37 Targeting Refund 121 0.2 0 0 0
Total Property Tax Refunds 61,454 100.0 120 113 88 Total Aids/Credits $1,528,658 100.0% $2,993 $2,447 $2,469
II. Property Tax Data A. Property Tax Levy (Payable 2011) County Levy $224,103 26.8% $439 $424 $466 City/Town Levy 142,651 17.1 279 407 359 School District Net Tax Capacity Levy 120,280 14.4 235 267 243 School District Referendum Market Value Levy 74,979 9.0 147 187 142 Miscellaneous District Levy 182,060 21.8 356 352 208 State Property Tax Levy 91,537 11.0 179 181 149
Total Levy $835,611 100.0% $1,636 $1,818 $1,568 Less Property Tax Credits 11,491 22 21 38
Net Property Taxes Payable 824,120 1,613 1,797 1,529 B. Property Valuation (2010 Assessment) Market Valuation $43,220,047 $84,611 $101,259 $105,022 Referendum Market Valuation 43,024,297 $84,228 99,620 83,805 Net Tax Capacity (NTC) 534,739 1,047 1,219 1,171 C. Average Local NTC Tax Rate 124.697 Avg. Referendum Mkt. Value Tax Rate 0.180
III. Major State Taxes Individual Income Tax (2010 filed 2011) $565,115 42.2% $1,106 $1,519 $1,225 Sales/Use Tax (Calendar 2011) 444,105 33.2 869 888 746 Motor Vehicle Sales Tax (Calendar 2011) 45,275 3.4 89 98 101 Motor Vehicle Registration Tax (Calendar 2011) 47,602 3.6 93 108 108 Motor Fuels Tax (Calendar 2011) 67,210 5.0 132 138 159 Corporate Income Tax (Calendar 2011) 78,165 5.8 153 187 147 State General Property Tax (Payable 2011) 91,537 6.8 179 181 149
Total State Taxes $1,339,008 100.0% $2,621 $3,119 $2,634

House Research Department May 2015Table 4 Page 192
RED LAKE NW (1) STATEAmount
I. Major State Aids/Credits (000s) Percent Per Capita Per Capita Per Capita
A. Aids to Local Governments Education Aid (2010-2011) $6,760 48.3% $1,647 $1,405 $1,262 Human Services Aid (Calendar 2011) Medical Assistance 2,443 17.5 595 633 530 Minnesota Family Investment Program 30 0.2 7 10 14 General Assistance including GAMC 11 0.1 3 4 8 Social Services 746 5.3 182 298 247 Miscellaneous 63 0.5 15 22 30
Total 3,294 23.5 802 966 829 Highway Aid (Calendar 2011) County Aid 2,428 17.3 591 328 88 Municipal Aid 0 0.0 0 18 28 Township Aid 144 1.0 35 49 6
Total 2,572 18.4 626 396 122 Local Government Aid (Calendar 2011) 731 5.2 178 177 80 Disparity Reduction Aid (Calendar 2011) 122 0.9 30 7 3 County Program Aid (Payable 2011) 489 3.5 119 54 30 Community Corrections Funding (2011) 29 0.2 7 21 16
Total Aids 13,997 100.0 3,410 3,025 2,342 B. Property Tax Credits (Payable 2011) Homestead Market Value Credit 192 63.9 47 47 29 Agricultural Market Value Credit 108 36.1 26 18 4 Miscellaneous Credits 0 0.0 0 16 5
Total Property Tax Credits 300 100.0 73 81 38 C. Property Tax Refunds (10 filed 11) Regular (Homeowners) 98 62.5 24 17 51 Regular (Renters) 59 37.5 14 18 37 Targeting Refund 0 0.0 0 0 0
Total Property Tax Refunds 157 100.0 38 35 88 Total Aids/Credits $14,454 100.0% $3,521 $3,142 $2,469
II. Property Tax Data A. Property Tax Levy (Payable 2011) County Levy $2,018 36.5% $492 $534 $466 City/Town Levy 1,194 21.6 291 249 359 School District Net Tax Capacity Levy 689 12.5 168 170 243 School District Referendum Market Value Levy 574 10.4 140 92 142 Miscellaneous District Levy 244 4.4 60 81 208 State Property Tax Levy 808 14.6 197 111 149
Total Levy $5,527 100.0% $1,346 $1,237 $1,568 Less Property Tax Credits 300 73 81 38
Net Property Taxes Payable 5,227 1,273 1,156 1,529 B. Property Valuation (2010 Assessment) Market Valuation $408,468 $99,505 $106,798 $105,022 Referendum Market Valuation 179,643 $43,762 43,786 83,805 Net Tax Capacity (NTC) 4,148 1,010 1,026 1,171 C. Average Local NTC Tax Rate 99.914 Avg. Referendum Mkt. Value Tax Rate 0.320
III. Major State Taxes Individual Income Tax (2010 filed 2011) $2,455 36.3% $598 $1,086 $1,225 Sales/Use Tax (Calendar 2011) 1,516 22.4 369 434 746 Motor Vehicle Sales Tax (Calendar 2011) 508 7.5 124 116 101 Motor Vehicle Registration Tax (Calendar 2011) 505 7.5 123 120 108 Motor Fuels Tax (Calendar 2011) 829 12.3 202 193 159 Corporate Income Tax (Calendar 2011) 141 2.1 34 115 147 State General Property Tax (Payable 2011) 808 12.0 197 111 149
Total State Taxes $6,761 100.0% $1,647 $2,175 $2,634

House Research Department May 2015Table 4 Page 193
REDWOOD SOUTHWEST (8) STATEAmount
I. Major State Aids/Credits (000s) Percent Per Capita Per Capita Per Capita
A. Aids to Local Governments Education Aid (2010-2011) $19,610 47.4% $1,227 $1,325 $1,262 Human Services Aid (Calendar 2011) Medical Assistance 8,634 20.9 540 554 530 Minnesota Family Investment Program 94 0.2 6 8 14 General Assistance including GAMC 29 0.1 2 3 8 Social Services 3,960 9.6 248 270 247 Miscellaneous 401 1.0 25 22 30
Total 13,117 31.7 821 857 829 Highway Aid (Calendar 2011) County Aid 4,219 10.2 264 256 88 Municipal Aid 268 0.6 17 11 28 Township Aid 846 2.0 53 43 6
Total 5,333 12.9 334 309 122 Local Government Aid (Calendar 2011) 2,588 6.3 162 180 80 Disparity Reduction Aid (Calendar 2011) 99 0.2 6 7 3 County Program Aid (Payable 2011) 378 0.9 24 31 30 Community Corrections Funding (2011) 245 0.6 15 19 16
Total Aids 41,369 100.0 2,588 2,728 2,342 B. Property Tax Credits (Payable 2011) Homestead Market Value Credit 691 68.7 43 43 29 Agricultural Market Value Credit 315 31.3 20 17 4 Miscellaneous Credits 0 0.0 0 0 5
Total Property Tax Credits 1,006 100.0 63 61 38 C. Property Tax Refunds (10 filed 11) Regular (Homeowners) 328 49.6 21 17 51 Regular (Renters) 331 49.9 21 20 37 Targeting Refund 4 0.5 0 0 0
Total Property Tax Refunds 663 100.0 41 37 88 Total Aids/Credits $43,038 100.0% $2,692 $2,826 $2,469
II. Property Tax Data A. Property Tax Levy (Payable 2011) County Levy $10,541 48.7% $659 $553 $466 City/Town Levy 5,302 24.5 332 307 359 School District Net Tax Capacity Levy 3,343 15.5 209 211 243 School District Referendum Market Value Levy 1,266 5.9 79 123 142 Miscellaneous District Levy 174 0.8 11 34 208 State Property Tax Levy 1,000 4.6 63 91 149
Total Levy $21,626 100.0% $1,353 $1,318 $1,568 Less Property Tax Credits 1,006 63 61 38
Net Property Taxes Payable 20,620 1,290 1,257 1,529 B. Property Valuation (2010 Assessment) Market Valuation $2,694,299 $168,541 $156,355 $105,022 Referendum Market Valuation 625,862 $39,151 44,560 83,805 Net Tax Capacity (NTC) 22,955 1,436 1,393 1,171 C. Average Local NTC Tax Rate 84.317 Avg. Referendum Mkt. Value Tax Rate 0.203
III. Major State Taxes Individual Income Tax (2010 filed 2011) $14,859 43.8% $930 $848 $1,225 Sales/Use Tax (Calendar 2011) 9,338 27.5 584 615 746 Motor Vehicle Sales Tax (Calendar 2011) 1,957 5.8 122 116 101 Motor Vehicle Registration Tax (Calendar 2011) 2,076 6.1 130 122 108 Motor Fuels Tax (Calendar 2011) 3,343 9.8 209 211 159 Corporate Income Tax (Calendar 2011) 1,371 4.0 86 185 147 State General Property Tax (Payable 2011) 1,000 2.9 63 91 149
Total State Taxes $33,946 100.0% $2,123 $2,187 $2,634

House Research Department May 2015Table 4 Page 194
RENVILLE SIX EAST (6E) STATEAmount
I. Major State Aids/Credits (000s) Percent Per Capita Per Capita Per Capita
A. Aids to Local Governments Education Aid (2010-2011) $16,529 42.0% $1,064 $1,237 $1,262 Human Services Aid (Calendar 2011) Medical Assistance 8,354 21.2 538 519 530 Minnesota Family Investment Program 112 0.3 7 9 14 General Assistance including GAMC 102 0.3 7 4 8 Social Services 4,703 12.0 303 235 247 Miscellaneous 233 0.6 15 18 30
Total 13,502 34.3 869 786 829 Highway Aid (Calendar 2011) County Aid 5,013 12.7 323 146 88 Municipal Aid 0 0.0 0 17 28 Township Aid 684 1.7 44 15 6
Total 5,697 14.5 367 178 122 Local Government Aid (Calendar 2011) 2,963 7.5 191 130 80 Disparity Reduction Aid (Calendar 2011) 152 0.4 10 3 3 County Program Aid (Payable 2011) 233 0.6 15 35 30 Community Corrections Funding (2011) 256 0.7 16 17 16
Total Aids 39,332 100.0 2,531 2,385 2,342 B. Property Tax Credits (Payable 2011) Homestead Market Value Credit 745 68.9 48 43 29 Agricultural Market Value Credit 337 31.1 22 11 4 Miscellaneous Credits 0 0.0 0 0 5
Total Property Tax Credits 1,082 100.0 70 54 38 C. Property Tax Refunds (10 filed 11) Regular (Homeowners) 210 44.1 14 40 51 Regular (Renters) 265 55.7 17 29 37 Targeting Refund 1 0.2 0 0 0
Total Property Tax Refunds 476 100.0 31 69 88 Total Aids/Credits $40,890 100.0% $2,631 $2,508 $2,469
II. Property Tax Data A. Property Tax Levy (Payable 2011) County Levy $11,906 47.8% $766 $592 $466 City/Town Levy 6,730 27.0 433 318 359 School District Net Tax Capacity Levy 2,120 8.5 136 173 243 School District Referendum Market Value Levy 1,962 7.9 126 119 142 Miscellaneous District Levy 452 1.8 29 29 208 State Property Tax Levy 1,737 7.0 112 95 149
Total Levy $24,906 100.0% $1,603 $1,326 $1,568 Less Property Tax Credits 1,082 70 54 38
Net Property Taxes Payable 23,824 1,533 1,272 1,529 B. Property Valuation (2010 Assessment) Market Valuation $3,295,886 $212,090 $122,057 $105,022 Referendum Market Valuation 749,218 $48,212 62,987 83,805 Net Tax Capacity (NTC) 28,954 1,863 1,171 1,171 C. Average Local NTC Tax Rate 73.247 Avg. Referendum Mkt. Value Tax Rate 0.262
III. Major State Taxes Individual Income Tax (2010 filed 2011) $16,277 49.5% $1,047 $887 $1,225 Sales/Use Tax (Calendar 2011) 4,863 14.8 313 593 746 Motor Vehicle Sales Tax (Calendar 2011) 1,942 5.9 125 110 101 Motor Vehicle Registration Tax (Calendar 2011) 2,066 6.3 133 112 108 Motor Fuels Tax (Calendar 2011) 3,586 10.9 231 170 159 Corporate Income Tax (Calendar 2011) 2,440 7.4 157 116 147 State General Property Tax (Payable 2011) 1,737 5.3 112 95 149
Total State Taxes $32,911 100.0% $2,118 $2,082 $2,634

House Research Department May 2015Table 4 Page 195
RICE SE MN (10) STATEAmount
I. Major State Aids/Credits (000s) Percent Per Capita Per Capita Per Capita
A. Aids to Local Governments Education Aid (2010-2011) $72,994 56.3% $1,128 $1,187 $1,262 Human Services Aid (Calendar 2011) Medical Assistance 22,208 17.1 343 418 530 Minnesota Family Investment Program 637 0.5 10 9 14 General Assistance including GAMC 107 0.1 2 3 8 Social Services 14,792 11.4 229 246 247 Miscellaneous 1,083 0.8 17 20 30
Total 38,827 29.9 600 696 829 Highway Aid (Calendar 2011) County Aid 4,544 3.5 70 110 88 Municipal Aid 1,644 1.3 25 29 28 Township Aid 271 0.2 4 9 6
Total 6,460 5.0 100 148 122 Local Government Aid (Calendar 2011) 7,555 5.8 117 114 80 Disparity Reduction Aid (Calendar 2011) 75 0.1 1 3 3 County Program Aid (Payable 2011) 2,787 2.1 43 41 30 Community Corrections Funding (2011) 961 0.7 15 15 16
Total Aids 129,659 100.0 2,003 2,204 2,342 B. Property Tax Credits (Payable 2011) Homestead Market Value Credit 1,891 82.1 29 39 29 Agricultural Market Value Credit 402 17.5 6 7 4 Miscellaneous Credits 10 0.5 0 1 5
Total Property Tax Credits 2,303 100.0 36 47 38 C. Property Tax Refunds (10 filed 11) Regular (Homeowners) 2,180 54.8 34 34 51 Regular (Renters) 1,786 44.9 28 28 37 Targeting Refund 9 0.2 0 0 0
Total Property Tax Refunds 3,975 100.0 61 62 88 Total Aids/Credits $135,937 100.0% $2,100 $2,313 $2,469
II. Property Tax Data A. Property Tax Levy (Payable 2011) County Levy $18,506 26.1% $286 $474 $466 City/Town Levy 17,316 24.4 268 339 359 School District Net Tax Capacity Levy 16,860 23.8 261 215 243 School District Referendum Market Value Levy 8,248 11.6 127 115 142 Miscellaneous District Levy 3,266 4.6 50 27 208 State Property Tax Levy 6,644 9.4 103 105 149
Total Levy $70,839 100.0% $1,095 $1,274 $1,568 Less Property Tax Credits 2,303 36 47 38
Net Property Taxes Payable 68,536 1,059 1,227 1,529 B. Property Valuation (2010 Assessment) Market Valuation $5,814,139 $89,839 $96,697 $105,022 Referendum Market Valuation 4,496,934 $69,486 68,917 83,805 Net Tax Capacity (NTC) 61,259 947 1,003 1,171 C. Average Local NTC Tax Rate 90.999 Avg. Referendum Mkt. Value Tax Rate 0.188
III. Major State Taxes Individual Income Tax (2010 filed 2011) $55,002 47.4% $850 $1,052 $1,225 Sales/Use Tax (Calendar 2011) 25,420 21.9 393 568 746 Motor Vehicle Sales Tax (Calendar 2011) 5,946 5.1 92 102 101 Motor Vehicle Registration Tax (Calendar 2011) 6,089 5.3 94 106 108 Motor Fuels Tax (Calendar 2011) 10,512 9.1 162 171 159 Corporate Income Tax (Calendar 2011) 6,349 5.5 98 98 147 State General Property Tax (Payable 2011) 6,644 5.7 103 105 149
Total State Taxes $115,962 100.0% $1,792 $2,201 $2,634

House Research Department May 2015Table 4 Page 196
ROCK SOUTHWEST (8) STATEAmount
I. Major State Aids/Credits (000s) Percent Per Capita Per Capita Per Capita
A. Aids to Local Governments Education Aid (2010-2011) $13,268 52.4% $1,376 $1,325 $1,262 Human Services Aid (Calendar 2011) Medical Assistance 4,167 16.5 432 554 530 Minnesota Family Investment Program 103 0.4 11 8 14 General Assistance including GAMC 12 0.0 1 3 8 Social Services 2,559 10.1 265 270 247 Miscellaneous 191 0.8 20 22 30
Total 7,032 27.8 729 857 829 Highway Aid (Calendar 2011) County Aid 2,793 11.0 290 256 88 Municipal Aid 0 0.0 0 11 28 Township Aid 407 1.6 42 43 6
Total 3,200 12.6 332 309 122 Local Government Aid (Calendar 2011) 1,507 6.0 156 180 80 Disparity Reduction Aid (Calendar 2011) 26 0.1 3 7 3 County Program Aid (Payable 2011) 157 0.6 16 31 30 Community Corrections Funding (2011) 115 0.5 12 19 16
Total Aids 25,305 100.0 2,624 2,728 2,342 B. Property Tax Credits (Payable 2011) Homestead Market Value Credit 571 76.5 59 43 29 Agricultural Market Value Credit 175 23.5 18 17 4 Miscellaneous Credits 0 0.0 0 0 5
Total Property Tax Credits 747 100.0 77 61 38 C. Property Tax Refunds (10 filed 11) Regular (Homeowners) 98 34.5 10 17 51 Regular (Renters) 183 64.2 19 20 37 Targeting Refund 4 1.3 0 0 0
Total Property Tax Refunds 285 100.0 30 37 88 Total Aids/Credits $26,337 100.0% $2,731 $2,826 $2,469
II. Property Tax Data A. Property Tax Levy (Payable 2011) County Levy $4,474 37.5% $464 $553 $466 City/Town Levy 2,831 23.7 294 307 359 School District Net Tax Capacity Levy 2,753 23.0 285 211 243 School District Referendum Market Value Levy 1,228 10.3 127 123 142 Miscellaneous District Levy 97 0.8 10 34 208 State Property Tax Levy 561 4.7 58 91 149
Total Levy $11,945 100.0% $1,239 $1,318 $1,568 Less Property Tax Credits 747 77 61 38
Net Property Taxes Payable 11,198 1,161 1,257 1,529 B. Property Valuation (2010 Assessment) Market Valuation $1,715,861 $177,920 $156,355 $105,022 Referendum Market Valuation 420,495 $43,602 44,560 83,805 Net Tax Capacity (NTC) 15,198 1,576 1,393 1,171 C. Average Local NTC Tax Rate 66.821 Avg. Referendum Mkt. Value Tax Rate 0.292
III. Major State Taxes Individual Income Tax (2010 filed 2011) $7,630 44.8% $791 $848 $1,225 Sales/Use Tax (Calendar 2011) 3,167 18.6 328 615 746 Motor Vehicle Sales Tax (Calendar 2011) 1,081 6.3 112 116 101 Motor Vehicle Registration Tax (Calendar 2011) 1,153 6.8 120 122 108 Motor Fuels Tax (Calendar 2011) 2,632 15.5 273 211 159 Corporate Income Tax (Calendar 2011) 803 4.7 83 185 147 State General Property Tax (Payable 2011) 561 3.3 58 91 149
Total State Taxes $17,027 100.0% $1,766 $2,187 $2,634

House Research Department May 2015Table 4 Page 197
ROSEAU NW (1) STATEAmount
I. Major State Aids/Credits (000s) Percent Per Capita Per Capita Per Capita
A. Aids to Local Governments Education Aid (2010-2011) $23,573 56.1% $1,517 $1,405 $1,262 Human Services Aid (Calendar 2011) Medical Assistance 7,133 17.0 459 633 530 Minnesota Family Investment Program 49 0.1 3 10 14 General Assistance including GAMC 41 0.1 3 4 8 Social Services 2,959 7.0 190 298 247 Miscellaneous 172 0.4 11 22 30
Total 10,354 24.6 666 966 829 Highway Aid (Calendar 2011) County Aid 4,720 11.2 304 328 88 Municipal Aid 0 0.0 0 18 28 Township Aid 694 1.7 45 49 6
Total 5,414 12.9 348 396 122 Local Government Aid (Calendar 2011) 1,645 3.9 106 177 80 Disparity Reduction Aid (Calendar 2011) 6 0.0 0 7 3 County Program Aid (Payable 2011) 842 2.0 54 54 30 Community Corrections Funding (2011) 199 0.5 13 21 16
Total Aids 42,033 100.0 2,706 3,025 2,342 B. Property Tax Credits (Payable 2011) Homestead Market Value Credit 878 59.0 57 47 29 Agricultural Market Value Credit 289 19.4 19 18 4 Miscellaneous Credits 321 21.6 21 16 5
Total Property Tax Credits 1,489 100.0 96 81 38 C. Property Tax Refunds (10 filed 11) Regular (Homeowners) 371 63.4 24 17 51 Regular (Renters) 214 36.6 14 18 37 Targeting Refund 0 0.0 0 0 0
Total Property Tax Refunds 585 100.0 38 35 88 Total Aids/Credits $44,107 100.0% $2,839 $3,142 $2,469
II. Property Tax Data A. Property Tax Levy (Payable 2011) County Levy $6,595 40.1% $425 $534 $466 City/Town Levy 3,173 19.3 204 249 359 School District Net Tax Capacity Levy 3,693 22.5 238 170 243 School District Referendum Market Value Levy 967 5.9 62 92 142 Miscellaneous District Levy 1,077 6.6 69 81 208 State Property Tax Levy 929 5.7 60 111 149
Total Levy $16,435 100.0% $1,058 $1,237 $1,568 Less Property Tax Credits 1,489 96 81 38
Net Property Taxes Payable 14,946 962 1,156 1,529 B. Property Valuation (2010 Assessment) Market Valuation $1,085,862 $69,893 $106,798 $105,022 Referendum Market Valuation 616,224 $39,664 43,786 83,805 Net Tax Capacity (NTC) 10,300 663 1,026 1,171 C. Average Local NTC Tax Rate 141.143 Avg. Referendum Mkt. Value Tax Rate 0.157
III. Major State Taxes Individual Income Tax (2010 filed 2011) $12,170 44.9% $783 $1,086 $1,225 Sales/Use Tax (Calendar 2011) 5,565 20.5 358 434 746 Motor Vehicle Sales Tax (Calendar 2011) 1,796 6.6 116 116 101 Motor Vehicle Registration Tax (Calendar 2011) 1,744 6.4 112 120 108 Motor Fuels Tax (Calendar 2011) 2,550 9.4 164 193 159 Corporate Income Tax (Calendar 2011) 2,331 8.6 150 115 147 State General Property Tax (Payable 2011) 929 3.4 60 111 149
Total State Taxes $27,085 100.0% $1,743 $2,175 $2,634

House Research Department May 2015Table 4 Page 198
ST. LOUIS ARROWHEAD (3) STATEAmount
I. Major State Aids/Credits (000s) Percent Per Capita Per Capita Per Capita
A. Aids to Local Governments Education Aid (2010-2011) $210,703 39.5% $1,053 $1,104 $1,262 Human Services Aid (Calendar 2011) Medical Assistance 133,278 25.0 666 653 530 Minnesota Family Investment Program 3,197 0.6 16 14 14 General Assistance including GAMC 2,449 0.5 12 10 8 Social Services 63,779 12.0 319 314 247 Miscellaneous 10,017 1.9 50 41 30
Total 212,720 39.9 1,063 1,032 829 Highway Aid (Calendar 2011) County Aid 24,747 4.6 124 160 88 Municipal Aid 9,221 1.7 46 33 28 Township Aid 782 0.1 4 5 6
Total 34,751 6.5 174 199 122 Local Government Aid (Calendar 2011) 51,712 9.7 258 198 80 Disparity Reduction Aid (Calendar 2011) 9,128 1.7 46 33 3 County Program Aid (Payable 2011) 9,809 1.8 49 42 30 Community Corrections Funding (2011) 4,809 0.9 24 21 16
Total Aids 533,631 100.0 2,666 2,630 2,342 B. Property Tax Credits (Payable 2011) Homestead Market Value Credit 7,960 47.2 40 42 29 Agricultural Market Value Credit 161 1.0 1 3 4 Miscellaneous Credits 8,743 51.8 44 48 5
Total Property Tax Credits 16,865 100.0 84 93 38 C. Property Tax Refunds (10 filed 11) Regular (Homeowners) 5,191 43.0 26 26 51 Regular (Renters) 6,790 56.3 34 29 37 Targeting Refund 90 0.7 0 0 0
Total Property Tax Refunds 12,071 100.0 60 56 88 Total Aids/Credits $562,567 100.0% $2,811 $2,778 $2,469
II. Property Tax Data A. Property Tax Levy (Payable 2011) County Levy $100,909 43.4% $504 $545 $466 City/Town Levy 52,167 22.5 261 269 359 School District Net Tax Capacity Levy 33,670 14.5 168 187 243 School District Referendum Market Value Levy 11,404 4.9 57 51 142 Miscellaneous District Levy 12,210 5.3 61 66 208 State Property Tax Levy 21,939 9.4 110 122 149
Total Levy $232,300 100.0% $1,161 $1,239 $1,568 Less Property Tax Credits 16,865 84 93 38
Net Property Taxes Payable 215,435 1,076 1,147 1,529 B. Property Valuation (2010 Assessment) Market Valuation $16,151,982 $80,702 $99,574 $105,022 Referendum Market Valuation 12,850,077 $64,204 67,723 83,805 Net Tax Capacity (NTC) 180,679 903 1,088 1,171 C. Average Local NTC Tax Rate 110.026 Avg. Referendum Mkt. Value Tax Rate 0.090
III. Major State Taxes Individual Income Tax (2010 filed 2011) $167,552 38.2% $837 $783 $1,225 Sales/Use Tax (Calendar 2011) 159,797 36.4 798 720 746 Motor Vehicle Sales Tax (Calendar 2011) 19,706 4.5 98 102 101 Motor Vehicle Registration Tax (Calendar 2011) 20,330 4.6 102 104 108 Motor Fuels Tax (Calendar 2011) 31,726 7.2 159 175 159 Corporate Income Tax (Calendar 2011) 18,040 4.1 90 79 147 State General Property Tax (Payable 2011) 21,939 5.0 110 122 149
Total State Taxes $439,091 100.0% $2,194 $2,085 $2,634
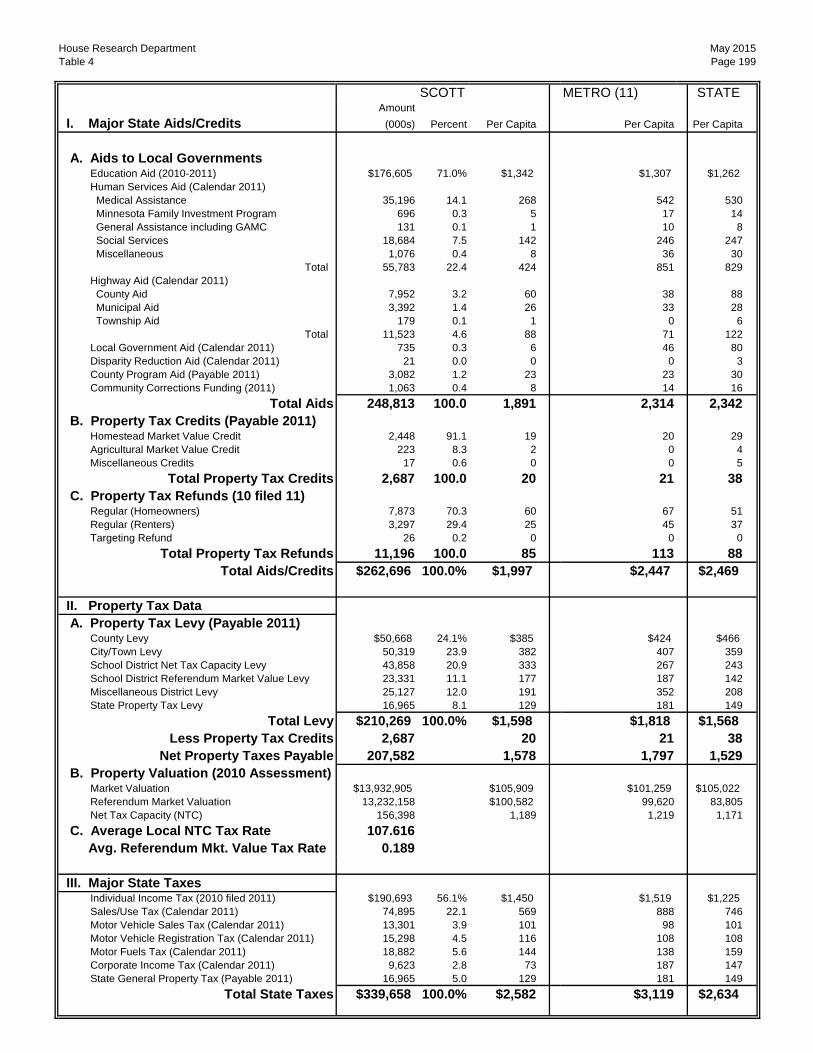
House Research Department May 2015Table 4 Page 199
SCOTT METRO (11) STATEAmount
I. Major State Aids/Credits (000s) Percent Per Capita Per Capita Per Capita
A. Aids to Local Governments Education Aid (2010-2011) $176,605 71.0% $1,342 $1,307 $1,262 Human Services Aid (Calendar 2011) Medical Assistance 35,196 14.1 268 542 530 Minnesota Family Investment Program 696 0.3 5 17 14 General Assistance including GAMC 131 0.1 1 10 8 Social Services 18,684 7.5 142 246 247 Miscellaneous 1,076 0.4 8 36 30
Total 55,783 22.4 424 851 829 Highway Aid (Calendar 2011) County Aid 7,952 3.2 60 38 88 Municipal Aid 3,392 1.4 26 33 28 Township Aid 179 0.1 1 0 6
Total 11,523 4.6 88 71 122 Local Government Aid (Calendar 2011) 735 0.3 6 46 80 Disparity Reduction Aid (Calendar 2011) 21 0.0 0 0 3 County Program Aid (Payable 2011) 3,082 1.2 23 23 30 Community Corrections Funding (2011) 1,063 0.4 8 14 16
Total Aids 248,813 100.0 1,891 2,314 2,342 B. Property Tax Credits (Payable 2011) Homestead Market Value Credit 2,448 91.1 19 20 29 Agricultural Market Value Credit 223 8.3 2 0 4 Miscellaneous Credits 17 0.6 0 0 5
Total Property Tax Credits 2,687 100.0 20 21 38 C. Property Tax Refunds (10 filed 11) Regular (Homeowners) 7,873 70.3 60 67 51 Regular (Renters) 3,297 29.4 25 45 37 Targeting Refund 26 0.2 0 0 0
Total Property Tax Refunds 11,196 100.0 85 113 88 Total Aids/Credits $262,696 100.0% $1,997 $2,447 $2,469
II. Property Tax Data A. Property Tax Levy (Payable 2011) County Levy $50,668 24.1% $385 $424 $466 City/Town Levy 50,319 23.9 382 407 359 School District Net Tax Capacity Levy 43,858 20.9 333 267 243 School District Referendum Market Value Levy 23,331 11.1 177 187 142 Miscellaneous District Levy 25,127 12.0 191 352 208 State Property Tax Levy 16,965 8.1 129 181 149
Total Levy $210,269 100.0% $1,598 $1,818 $1,568 Less Property Tax Credits 2,687 20 21 38
Net Property Taxes Payable 207,582 1,578 1,797 1,529 B. Property Valuation (2010 Assessment) Market Valuation $13,932,905 $105,909 $101,259 $105,022 Referendum Market Valuation 13,232,158 $100,582 99,620 83,805 Net Tax Capacity (NTC) 156,398 1,189 1,219 1,171 C. Average Local NTC Tax Rate 107.616 Avg. Referendum Mkt. Value Tax Rate 0.189
III. Major State Taxes Individual Income Tax (2010 filed 2011) $190,693 56.1% $1,450 $1,519 $1,225 Sales/Use Tax (Calendar 2011) 74,895 22.1 569 888 746 Motor Vehicle Sales Tax (Calendar 2011) 13,301 3.9 101 98 101 Motor Vehicle Registration Tax (Calendar 2011) 15,298 4.5 116 108 108 Motor Fuels Tax (Calendar 2011) 18,882 5.6 144 138 159 Corporate Income Tax (Calendar 2011) 9,623 2.8 73 187 147 State General Property Tax (Payable 2011) 16,965 5.0 129 181 149
Total State Taxes $339,658 100.0% $2,582 $3,119 $2,634
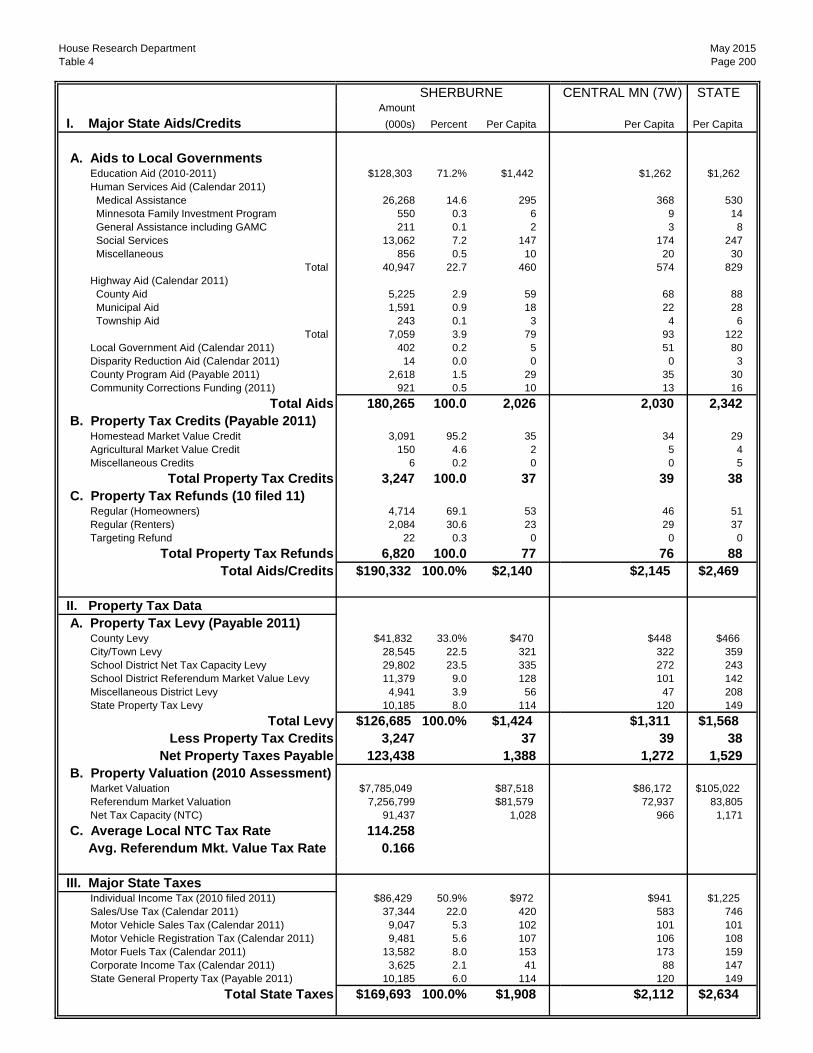
House Research Department May 2015Table 4 Page 200
SHERBURNE CENTRAL MN (7W) STATEAmount
I. Major State Aids/Credits (000s) Percent Per Capita Per Capita Per Capita
A. Aids to Local Governments Education Aid (2010-2011) $128,303 71.2% $1,442 $1,262 $1,262 Human Services Aid (Calendar 2011) Medical Assistance 26,268 14.6 295 368 530 Minnesota Family Investment Program 550 0.3 6 9 14 General Assistance including GAMC 211 0.1 2 3 8 Social Services 13,062 7.2 147 174 247 Miscellaneous 856 0.5 10 20 30
Total 40,947 22.7 460 574 829 Highway Aid (Calendar 2011) County Aid 5,225 2.9 59 68 88 Municipal Aid 1,591 0.9 18 22 28 Township Aid 243 0.1 3 4 6
Total 7,059 3.9 79 93 122 Local Government Aid (Calendar 2011) 402 0.2 5 51 80 Disparity Reduction Aid (Calendar 2011) 14 0.0 0 0 3 County Program Aid (Payable 2011) 2,618 1.5 29 35 30 Community Corrections Funding (2011) 921 0.5 10 13 16
Total Aids 180,265 100.0 2,026 2,030 2,342 B. Property Tax Credits (Payable 2011) Homestead Market Value Credit 3,091 95.2 35 34 29 Agricultural Market Value Credit 150 4.6 2 5 4 Miscellaneous Credits 6 0.2 0 0 5
Total Property Tax Credits 3,247 100.0 37 39 38 C. Property Tax Refunds (10 filed 11) Regular (Homeowners) 4,714 69.1 53 46 51 Regular (Renters) 2,084 30.6 23 29 37 Targeting Refund 22 0.3 0 0 0
Total Property Tax Refunds 6,820 100.0 77 76 88 Total Aids/Credits $190,332 100.0% $2,140 $2,145 $2,469
II. Property Tax Data A. Property Tax Levy (Payable 2011) County Levy $41,832 33.0% $470 $448 $466 City/Town Levy 28,545 22.5 321 322 359 School District Net Tax Capacity Levy 29,802 23.5 335 272 243 School District Referendum Market Value Levy 11,379 9.0 128 101 142 Miscellaneous District Levy 4,941 3.9 56 47 208 State Property Tax Levy 10,185 8.0 114 120 149
Total Levy $126,685 100.0% $1,424 $1,311 $1,568 Less Property Tax Credits 3,247 37 39 38
Net Property Taxes Payable 123,438 1,388 1,272 1,529 B. Property Valuation (2010 Assessment) Market Valuation $7,785,049 $87,518 $86,172 $105,022 Referendum Market Valuation 7,256,799 $81,579 72,937 83,805 Net Tax Capacity (NTC) 91,437 1,028 966 1,171 C. Average Local NTC Tax Rate 114.258 Avg. Referendum Mkt. Value Tax Rate 0.166
III. Major State Taxes Individual Income Tax (2010 filed 2011) $86,429 50.9% $972 $941 $1,225 Sales/Use Tax (Calendar 2011) 37,344 22.0 420 583 746 Motor Vehicle Sales Tax (Calendar 2011) 9,047 5.3 102 101 101 Motor Vehicle Registration Tax (Calendar 2011) 9,481 5.6 107 106 108 Motor Fuels Tax (Calendar 2011) 13,582 8.0 153 173 159 Corporate Income Tax (Calendar 2011) 3,625 2.1 41 88 147 State General Property Tax (Payable 2011) 10,185 6.0 114 120 149
Total State Taxes $169,693 100.0% $1,908 $2,112 $2,634

House Research Department May 2015Table 4 Page 201
SIBLEY NINE (9) STATEAmount
I. Major State Aids/Credits (000s) Percent Per Capita Per Capita Per Capita
A. Aids to Local Governments Education Aid (2010-2011) $19,403 51.1% $1,277 $1,075 $1,262 Human Services Aid (Calendar 2011) Medical Assistance 7,305 19.2 481 451 530 Minnesota Family Investment Program 71 0.2 5 8 14 General Assistance including GAMC 24 0.1 2 4 8 Social Services 3,632 9.6 239 253 247 Miscellaneous 192 0.5 13 21 30
Total 11,224 29.5 739 736 829 Highway Aid (Calendar 2011) County Aid 3,908 10.3 257 165 88 Municipal Aid 0 0.0 0 18 28 Township Aid 452 1.2 30 14 6
Total 4,361 11.5 287 197 122 Local Government Aid (Calendar 2011) 2,440 6.4 161 170 80 Disparity Reduction Aid (Calendar 2011) 121 0.3 8 4 3 County Program Aid (Payable 2011) 273 0.7 18 38 30 Community Corrections Funding (2011) 182 0.5 12 18 16
Total Aids 38,003 100.0 2,501 2,238 2,342 B. Property Tax Credits (Payable 2011) Homestead Market Value Credit 712 70.1 47 39 29 Agricultural Market Value Credit 303 29.9 20 10 4 Miscellaneous Credits 0 0.0 0 2 5
Total Property Tax Credits 1,014 100.0 67 51 38 C. Property Tax Refunds (10 filed 11) Regular (Homeowners) 578 64.5 38 27 51 Regular (Renters) 318 35.5 21 26 37 Targeting Refund 0 0.0 0 0 0
Total Property Tax Refunds 896 100.0 59 53 88 Total Aids/Credits $39,914 100.0% $2,627 $2,342 $2,469
II. Property Tax Data A. Property Tax Levy (Payable 2011) County Levy $10,650 49.7% $701 $498 $466 City/Town Levy 5,967 27.9 393 317 359 School District Net Tax Capacity Levy 2,329 10.9 153 182 243 School District Referendum Market Value Levy 1,150 5.4 76 96 142 Miscellaneous District Levy 441 2.1 29 21 208 State Property Tax Levy 872 4.1 57 97 149
Total Levy $21,409 100.0% $1,409 $1,211 $1,568 Less Property Tax Credits 1,014 67 51 38
Net Property Taxes Payable 20,394 1,342 1,160 1,529 B. Property Valuation (2010 Assessment) Market Valuation $2,364,575 $155,636 $115,995 $105,022 Referendum Market Valuation 864,116 $56,876 59,665 83,805 Net Tax Capacity (NTC) 20,319 1,337 1,116 1,171 C. Average Local NTC Tax Rate 95.410 Avg. Referendum Mkt. Value Tax Rate 0.133
III. Major State Taxes Individual Income Tax (2010 filed 2011) $12,812 50.5% $843 $867 $1,225 Sales/Use Tax (Calendar 2011) 2,638 10.4 174 579 746 Motor Vehicle Sales Tax (Calendar 2011) 1,573 6.2 104 106 101 Motor Vehicle Registration Tax (Calendar 2011) 1,577 6.2 104 110 108 Motor Fuels Tax (Calendar 2011) 2,855 11.3 188 169 159 Corporate Income Tax (Calendar 2011) 3,030 12.0 199 170 147 State General Property Tax (Payable 2011) 872 3.4 57 97 149
Total State Taxes $25,357 100.0% $1,669 $2,100 $2,634

House Research Department May 2015Table 4 Page 202
STEARNS CENTRAL MN (7W) STATEAmount
I. Major State Aids/Credits (000s) Percent Per Capita Per Capita Per Capita
A. Aids to Local Governments Education Aid (2010-2011) $164,595 54.3% $1,090 $1,262 $1,262 Human Services Aid (Calendar 2011) Medical Assistance 64,333 21.2 426 368 530 Minnesota Family Investment Program 2,069 0.7 14 9 14 General Assistance including GAMC 828 0.3 5 3 8 Social Services 27,756 9.2 184 174 247 Miscellaneous 4,495 1.5 30 20 30
Total 99,481 32.8 659 574 829 Highway Aid (Calendar 2011) County Aid 10,309 3.4 68 68 88 Municipal Aid 3,617 1.2 24 22 28 Township Aid 691 0.2 5 4 6
Total 14,617 4.8 97 93 122 Local Government Aid (Calendar 2011) 15,494 5.1 103 51 80 Disparity Reduction Aid (Calendar 2011) 110 0.0 1 0 3 County Program Aid (Payable 2011) 6,360 2.1 42 35 30 Community Corrections Funding (2011) 2,419 0.8 16 13 16
Total Aids 303,076 100.0 2,007 2,030 2,342 B. Property Tax Credits (Payable 2011) Homestead Market Value Credit 4,939 84.0 33 34 29 Agricultural Market Value Credit 930 15.8 6 5 4 Miscellaneous Credits 7 0.1 0 0 5
Total Property Tax Credits 5,877 100.0 39 39 38 C. Property Tax Refunds (10 filed 11) Regular (Homeowners) 6,222 54.4 41 46 51 Regular (Renters) 5,194 45.4 34 29 37 Targeting Refund 31 0.3 0 0 0
Total Property Tax Refunds 11,447 100.0 76 76 88 Total Aids/Credits $320,400 100.0% $2,122 $2,145 $2,469
II. Property Tax Data A. Property Tax Levy (Payable 2011) County Levy $69,639 36.7% $461 $448 $466 City/Town Levy 48,867 25.7 324 322 359 School District Net Tax Capacity Levy 29,547 15.6 196 272 243 School District Referendum Market Value Levy 12,901 6.8 85 101 142 Miscellaneous District Levy 8,704 4.6 58 47 208 State Property Tax Levy 20,275 10.7 134 120 149
Total Levy $189,932 100.0% $1,258 $1,311 $1,568 Less Property Tax Credits 5,877 39 39 38
Net Property Taxes Payable 184,055 1,219 1,272 1,529 B. Property Valuation (2010 Assessment) Market Valuation $12,581,780 $83,325 $86,172 $105,022 Referendum Market Valuation 10,126,615 $67,065 72,937 83,805 Net Tax Capacity (NTC) 139,759 926 966 1,171 C. Average Local NTC Tax Rate 110.514 Avg. Referendum Mkt. Value Tax Rate 0.150
III. Major State Taxes Individual Income Tax (2010 filed 2011) $137,902 39.5% $913 $941 $1,225 Sales/Use Tax (Calendar 2011) 112,355 32.2 744 583 746 Motor Vehicle Sales Tax (Calendar 2011) 15,290 4.4 101 101 101 Motor Vehicle Registration Tax (Calendar 2011) 15,941 4.6 106 106 108 Motor Fuels Tax (Calendar 2011) 26,988 7.7 179 173 159 Corporate Income Tax (Calendar 2011) 20,680 5.9 137 88 147 State General Property Tax (Payable 2011) 20,275 5.8 134 120 149
Total State Taxes $349,430 100.0% $2,314 $2,112 $2,634

House Research Department May 2015Table 4 Page 203
STEELE SE MN (10) STATEAmount
I. Major State Aids/Credits (000s) Percent Per Capita Per Capita Per Capita
A. Aids to Local Governments Education Aid (2010-2011) $48,159 55.5% $1,318 $1,187 $1,262 Human Services Aid (Calendar 2011) Medical Assistance 16,228 18.7 444 418 530 Minnesota Family Investment Program 443 0.5 12 9 14 General Assistance including GAMC 156 0.2 4 3 8 Social Services 9,226 10.6 253 246 247 Miscellaneous 699 0.8 19 20 30
Total 26,752 30.8 732 696 829 Highway Aid (Calendar 2011) County Aid 4,307 5.0 118 110 88 Municipal Aid 1,017 1.2 28 29 28 Township Aid 312 0.4 9 9 6
Total 5,636 6.5 154 148 122 Local Government Aid (Calendar 2011) 4,087 4.7 112 114 80 Disparity Reduction Aid (Calendar 2011) 65 0.1 2 3 3 County Program Aid (Payable 2011) 1,569 1.8 43 41 30 Community Corrections Funding (2011) 536 0.6 15 15 16
Total Aids 86,803 100.0 2,376 2,204 2,342 B. Property Tax Credits (Payable 2011) Homestead Market Value Credit 1,562 84.2 43 39 29 Agricultural Market Value Credit 227 12.2 6 7 4 Miscellaneous Credits 66 3.6 2 1 5
Total Property Tax Credits 1,855 100.0 51 47 38 C. Property Tax Refunds (10 filed 11) Regular (Homeowners) 1,379 54.2 38 34 51 Regular (Renters) 1,164 45.7 32 28 37 Targeting Refund 2 0.1 0 0 0
Total Property Tax Refunds 2,545 100.0 70 62 88 Total Aids/Credits $91,204 100.0% $2,497 $2,313 $2,469
II. Property Tax Data A. Property Tax Levy (Payable 2011) County Levy $18,868 41.0% $517 $474 $466 City/Town Levy 12,301 26.7 337 339 359 School District Net Tax Capacity Levy 6,540 14.2 179 215 243 School District Referendum Market Value Levy 3,976 8.6 109 115 142 Miscellaneous District Levy 568 1.2 16 27 208 State Property Tax Levy 3,741 8.1 102 105 149
Total Levy $45,994 100.0% $1,259 $1,274 $1,568 Less Property Tax Credits 1,855 51 47 38
Net Property Taxes Payable 44,139 1,208 1,227 1,529 B. Property Valuation (2010 Assessment) Market Valuation $3,288,453 $90,021 $96,697 $105,022 Referendum Market Valuation 2,367,828 $64,819 68,917 83,805 Net Tax Capacity (NTC) 34,096 933 1,003 1,171 C. Average Local NTC Tax Rate 112.264 Avg. Referendum Mkt. Value Tax Rate 0.168
III. Major State Taxes Individual Income Tax (2010 filed 2011) $33,386 39.1% $914 $1,052 $1,225 Sales/Use Tax (Calendar 2011) 26,463 31.0 724 568 746 Motor Vehicle Sales Tax (Calendar 2011) 3,823 4.5 105 102 101 Motor Vehicle Registration Tax (Calendar 2011) 3,934 4.6 108 106 108 Motor Fuels Tax (Calendar 2011) 7,694 9.0 211 171 159 Corporate Income Tax (Calendar 2011) 6,322 7.4 173 98 147 State General Property Tax (Payable 2011) 3,741 4.4 102 105 149
Total State Taxes $85,364 100.0% $2,337 $2,201 $2,634

House Research Department May 2015Table 4 Page 204
STEVENS W CENTRAL (4) STATEAmount
I. Major State Aids/Credits (000s) Percent Per Capita Per Capita Per Capita
A. Aids to Local Governments Education Aid (2010-2011) $10,670 45.2% $1,094 $1,158 $1,262 Human Services Aid (Calendar 2011) Medical Assistance 3,999 16.9 410 564 530 Minnesota Family Investment Program 51 0.2 5 9 14 General Assistance including GAMC 29 0.1 3 5 8 Social Services 2,235 9.5 229 266 247 Miscellaneous 179 0.8 18 23 30
Total 6,494 27.5 666 868 829 Highway Aid (Calendar 2011) County Aid 2,428 10.3 249 170 88 Municipal Aid 226 1.0 23 26 28 Township Aid 243 1.0 25 20 6
Total 2,897 12.3 297 216 122 Local Government Aid (Calendar 2011) 2,539 10.8 260 115 80 Disparity Reduction Aid (Calendar 2011) 111 0.5 11 1 3 County Program Aid (Payable 2011) 772 3.3 79 34 30 Community Corrections Funding (2011) 121 0.5 12 17 16
Total Aids 23,604 100.0 2,421 2,409 2,342 B. Property Tax Credits (Payable 2011) Homestead Market Value Credit 317 68.7 33 43 29 Agricultural Market Value Credit 144 31.2 15 11 4 Miscellaneous Credits 0 0.1 0 24 5
Total Property Tax Credits 462 100.0 47 78 38 C. Property Tax Refunds (10 filed 11) Regular (Homeowners) 159 47.8 16 26 51 Regular (Renters) 174 52.2 18 25 37 Targeting Refund 0 0.0 0 1 0
Total Property Tax Refunds 334 100.0 34 52 88 Total Aids/Credits $24,399 100.0% $2,503 $2,539 $2,469
II. Property Tax Data A. Property Tax Levy (Payable 2011) County Levy $5,469 42.0% $561 $563 $466 City/Town Levy 2,497 19.2 256 275 359 School District Net Tax Capacity Levy 2,629 20.2 270 204 243 School District Referendum Market Value Levy 1,187 9.1 122 96 142 Miscellaneous District Levy 435 3.3 45 52 208 State Property Tax Levy 793 6.1 81 118 149
Total Levy $13,009 100.0% $1,334 $1,308 $1,568 Less Property Tax Credits 462 47 78 38
Net Property Taxes Payable 12,548 1,287 1,231 1,529 B. Property Valuation (2010 Assessment) Market Valuation $1,364,480 $139,961 $132,717 $105,022 Referendum Market Valuation 415,548 $42,625 66,557 83,805 Net Tax Capacity (NTC) 12,119 1,243 1,311 1,171 C. Average Local NTC Tax Rate 90.576 Avg. Referendum Mkt. Value Tax Rate 0.298
III. Major State Taxes Individual Income Tax (2010 filed 2011) $9,317 43.8% $956 $849 $1,225 Sales/Use Tax (Calendar 2011) 6,342 29.8 651 610 746 Motor Vehicle Sales Tax (Calendar 2011) 1,061 5.0 109 106 101 Motor Vehicle Registration Tax (Calendar 2011) 1,167 5.5 120 109 108 Motor Fuels Tax (Calendar 2011) 1,485 7.0 152 207 159 Corporate Income Tax (Calendar 2011) 1,119 5.3 115 83 147 State General Property Tax (Payable 2011) 793 3.7 81 118 149
Total State Taxes $21,283 100.0% $2,183 $2,081 $2,634

House Research Department May 2015Table 4 Page 205
SWIFT MN VALLEY (6W) STATEAmount
I. Major State Aids/Credits (000s) Percent Per Capita Per Capita Per Capita
A. Aids to Local Governments Education Aid (2010-2011) $12,630 42.8% $1,305 $1,347 $1,262 Human Services Aid (Calendar 2011) Medical Assistance 7,339 24.9 758 696 530 Minnesota Family Investment Program 57 0.2 6 8 14 General Assistance including GAMC 52 0.2 5 3 8 Social Services 3,062 10.4 316 299 247 Miscellaneous 243 0.8 25 21 30
Total 10,753 36.5 1,111 1,026 829 Highway Aid (Calendar 2011) County Aid 2,931 9.9 303 313 88 Municipal Aid 0 0.0 0 5 28 Township Aid 566 1.9 58 58 6
Total 3,497 11.9 361 376 122 Local Government Aid (Calendar 2011) 1,973 6.7 204 198 80 Disparity Reduction Aid (Calendar 2011) 49 0.2 5 13 3 County Program Aid (Payable 2011) 385 1.3 40 34 30 Community Corrections Funding (2011) 204 0.7 21 17 16
Total Aids 29,491 100.0 3,048 3,012 2,342 B. Property Tax Credits (Payable 2011) Homestead Market Value Credit 421 68.1 44 45 29 Agricultural Market Value Credit 197 31.9 20 21 4 Miscellaneous Credits 0 0.0 0 0 5
Total Property Tax Credits 619 100.0 64 66 38 C. Property Tax Refunds (10 filed 11) Regular (Homeowners) 101 33.8 10 16 51 Regular (Renters) 193 64.4 20 19 37 Targeting Refund 5 1.8 1 0 0
Total Property Tax Refunds 300 100.0 31 34 88 Total Aids/Credits $30,410 100.0% $3,142 $3,112 $2,469
II. Property Tax Data A. Property Tax Levy (Payable 2011) County Levy $7,828 48.3% $809 $696 $466 City/Town Levy 4,138 25.6 428 361 359 School District Net Tax Capacity Levy 1,622 10.0 168 210 243 School District Referendum Market Value Levy 900 5.6 93 97 142 Miscellaneous District Levy 228 1.4 24 36 208 State Property Tax Levy 1,479 9.1 153 82 149
Total Levy $16,196 100.0% $1,674 $1,482 $1,568 Less Property Tax Credits 619 64 66 38
Net Property Taxes Payable 15,577 1,610 1,416 1,529 B. Property Valuation (2010 Assessment) Market Valuation $1,775,615 $183,488 $177,801 $105,022 Referendum Market Valuation 477,481 $49,342 41,733 83,805 Net Tax Capacity (NTC) 16,234 1,678 1,527 1,171 C. Average Local NTC Tax Rate 84.608 Avg. Referendum Mkt. Value Tax Rate 0.205
III. Major State Taxes Individual Income Tax (2010 filed 2011) $8,627 40.2% $892 $923 $1,225 Sales/Use Tax (Calendar 2011) 4,703 21.9 486 453 746 Motor Vehicle Sales Tax (Calendar 2011) 1,222 5.7 126 123 101 Motor Vehicle Registration Tax (Calendar 2011) 1,265 5.9 131 130 108 Motor Fuels Tax (Calendar 2011) 1,951 9.1 202 200 159 Corporate Income Tax (Calendar 2011) 2,192 10.2 226 201 147 State General Property Tax (Payable 2011) 1,479 6.9 153 82 149
Total State Taxes $21,440 100.0% $2,216 $2,114 $2,634

House Research Department May 2015Table 4 Page 206
TODD FIVE (5) STATEAmount
I. Major State Aids/Credits (000s) Percent Per Capita Per Capita Per Capita
A. Aids to Local Governments Education Aid (2010-2011) $30,872 49.0% $1,244 $1,273 $1,262 Human Services Aid (Calendar 2011) Medical Assistance 16,364 26.0 659 642 530 Minnesota Family Investment Program 169 0.3 7 11 14 General Assistance including GAMC -2 0.0 0 3 8 Social Services 6,528 10.4 263 247 247 Miscellaneous 609 1.0 25 26 30
Total 23,668 37.6 953 929 829 Highway Aid (Calendar 2011) County Aid 3,539 5.6 143 132 88 Municipal Aid 0 0.0 0 14 28 Township Aid 491 0.8 20 13 6
Total 4,030 6.4 162 158 122 Local Government Aid (Calendar 2011) 2,498 4.0 101 79 80 Disparity Reduction Aid (Calendar 2011) 134 0.2 5 2 3 County Program Aid (Payable 2011) 1,202 1.9 48 26 30 Community Corrections Funding (2011) 555 0.9 22 17 16
Total Aids 62,960 100.0 2,536 2,485 2,342 B. Property Tax Credits (Payable 2011) Homestead Market Value Credit 1,372 67.2 55 44 29 Agricultural Market Value Credit 671 32.8 27 13 4 Miscellaneous Credits 0 0.0 0 8 5
Total Property Tax Credits 2,043 100.0 82 65 38 C. Property Tax Refunds (10 filed 11) Regular (Homeowners) 959 68.4 39 33 51 Regular (Renters) 423 30.2 17 25 37 Targeting Refund 19 1.3 1 0 0
Total Property Tax Refunds 1,401 100.0 56 58 88 Total Aids/Credits $66,404 100.0% $2,675 $2,608 $2,469
II. Property Tax Data A. Property Tax Levy (Payable 2011) County Levy $12,009 47.5% $484 $561 $466 City/Town Levy 5,323 21.1 214 330 359 School District Net Tax Capacity Levy 4,515 17.9 182 223 243 School District Referendum Market Value Levy 1,792 7.1 72 66 142 Miscellaneous District Levy 264 1.0 11 29 208 State Property Tax Levy 1,370 5.4 55 176 149
Total Levy $25,273 100.0% $1,018 $1,386 $1,568 Less Property Tax Credits 2,043 82 65 38
Net Property Taxes Payable 23,230 936 1,322 1,529 B. Property Valuation (2010 Assessment) Market Valuation $2,364,463 $95,253 $150,534 $105,022 Referendum Market Valuation 1,130,919 $45,559 76,762 83,805 Net Tax Capacity (NTC) 21,320 859 1,557 1,171 C. Average Local NTC Tax Rate 103.706 Avg. Referendum Mkt. Value Tax Rate 0.158
III. Major State Taxes Individual Income Tax (2010 filed 2011) $12,972 43.4% $523 $674 $1,225 Sales/Use Tax (Calendar 2011) 4,339 14.5 175 581 746 Motor Vehicle Sales Tax (Calendar 2011) 2,378 8.0 96 106 101 Motor Vehicle Registration Tax (Calendar 2011) 2,191 7.3 88 105 108 Motor Fuels Tax (Calendar 2011) 4,430 14.8 178 201 159 Corporate Income Tax (Calendar 2011) 2,198 7.4 89 69 147 State General Property Tax (Payable 2011) 1,370 4.6 55 176 149
Total State Taxes $29,878 100.0% $1,204 $1,912 $2,634
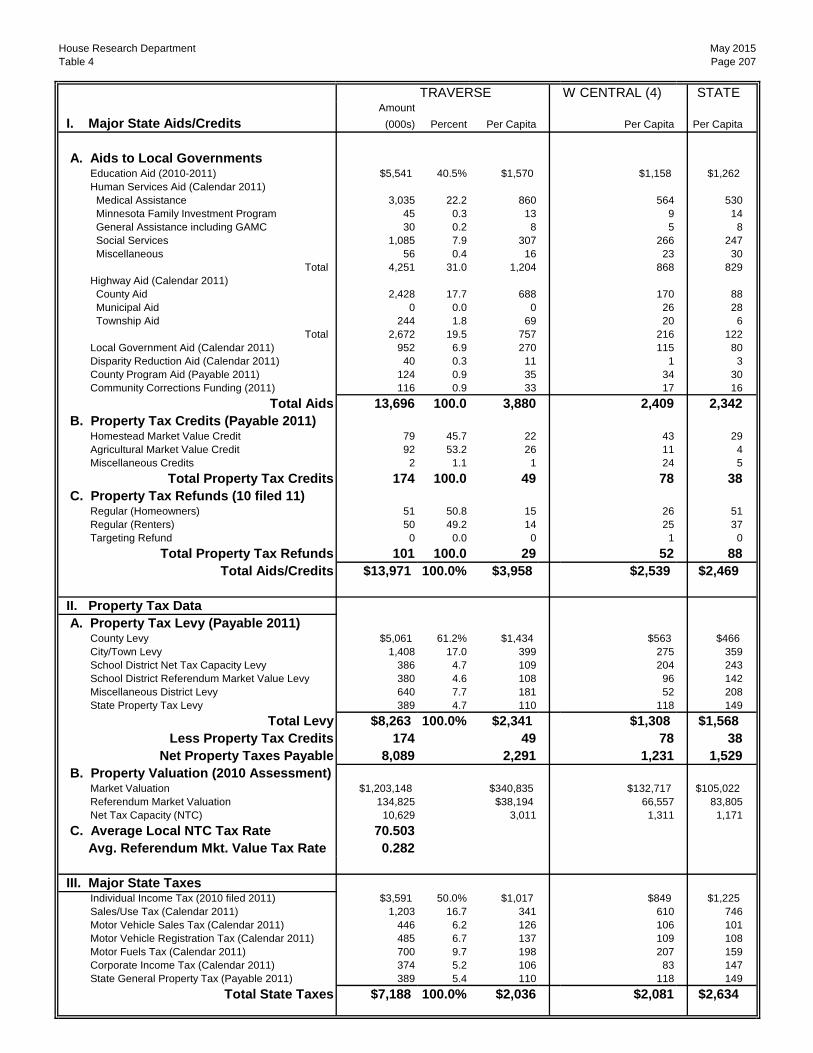
House Research Department May 2015Table 4 Page 207
TRAVERSE W CENTRAL (4) STATEAmount
I. Major State Aids/Credits (000s) Percent Per Capita Per Capita Per Capita
A. Aids to Local Governments Education Aid (2010-2011) $5,541 40.5% $1,570 $1,158 $1,262 Human Services Aid (Calendar 2011) Medical Assistance 3,035 22.2 860 564 530 Minnesota Family Investment Program 45 0.3 13 9 14 General Assistance including GAMC 30 0.2 8 5 8 Social Services 1,085 7.9 307 266 247 Miscellaneous 56 0.4 16 23 30
Total 4,251 31.0 1,204 868 829 Highway Aid (Calendar 2011) County Aid 2,428 17.7 688 170 88 Municipal Aid 0 0.0 0 26 28 Township Aid 244 1.8 69 20 6
Total 2,672 19.5 757 216 122 Local Government Aid (Calendar 2011) 952 6.9 270 115 80 Disparity Reduction Aid (Calendar 2011) 40 0.3 11 1 3 County Program Aid (Payable 2011) 124 0.9 35 34 30 Community Corrections Funding (2011) 116 0.9 33 17 16
Total Aids 13,696 100.0 3,880 2,409 2,342 B. Property Tax Credits (Payable 2011) Homestead Market Value Credit 79 45.7 22 43 29 Agricultural Market Value Credit 92 53.2 26 11 4 Miscellaneous Credits 2 1.1 1 24 5
Total Property Tax Credits 174 100.0 49 78 38 C. Property Tax Refunds (10 filed 11) Regular (Homeowners) 51 50.8 15 26 51 Regular (Renters) 50 49.2 14 25 37 Targeting Refund 0 0.0 0 1 0
Total Property Tax Refunds 101 100.0 29 52 88 Total Aids/Credits $13,971 100.0% $3,958 $2,539 $2,469
II. Property Tax Data A. Property Tax Levy (Payable 2011) County Levy $5,061 61.2% $1,434 $563 $466 City/Town Levy 1,408 17.0 399 275 359 School District Net Tax Capacity Levy 386 4.7 109 204 243 School District Referendum Market Value Levy 380 4.6 108 96 142 Miscellaneous District Levy 640 7.7 181 52 208 State Property Tax Levy 389 4.7 110 118 149
Total Levy $8,263 100.0% $2,341 $1,308 $1,568 Less Property Tax Credits 174 49 78 38
Net Property Taxes Payable 8,089 2,291 1,231 1,529 B. Property Valuation (2010 Assessment) Market Valuation $1,203,148 $340,835 $132,717 $105,022 Referendum Market Valuation 134,825 $38,194 66,557 83,805 Net Tax Capacity (NTC) 10,629 3,011 1,311 1,171 C. Average Local NTC Tax Rate 70.503 Avg. Referendum Mkt. Value Tax Rate 0.282
III. Major State Taxes Individual Income Tax (2010 filed 2011) $3,591 50.0% $1,017 $849 $1,225 Sales/Use Tax (Calendar 2011) 1,203 16.7 341 610 746 Motor Vehicle Sales Tax (Calendar 2011) 446 6.2 126 106 101 Motor Vehicle Registration Tax (Calendar 2011) 485 6.7 137 109 108 Motor Fuels Tax (Calendar 2011) 700 9.7 198 207 159 Corporate Income Tax (Calendar 2011) 374 5.2 106 83 147 State General Property Tax (Payable 2011) 389 5.4 110 118 149
Total State Taxes $7,188 100.0% $2,036 $2,081 $2,634

House Research Department May 2015Table 4 Page 208
WABASHA SE MN (10) STATEAmount
I. Major State Aids/Credits (000s) Percent Per Capita Per Capita Per Capita
A. Aids to Local Governments Education Aid (2010-2011) $23,215 49.8% $1,075 $1,187 $1,262 Human Services Aid (Calendar 2011) Medical Assistance 8,508 18.3 394 418 530 Minnesota Family Investment Program 80 0.2 4 9 14 General Assistance including GAMC 34 0.1 2 3 8 Social Services 4,621 9.9 214 246 247 Miscellaneous 327 0.7 15 20 30
Total 13,569 29.1 629 696 829 Highway Aid (Calendar 2011) County Aid 5,725 12.3 265 110 88 Municipal Aid 226 0.5 10 29 28 Township Aid 188 0.4 9 9 6
Total 6,139 13.2 284 148 122 Local Government Aid (Calendar 2011) 2,366 5.1 110 114 80 Disparity Reduction Aid (Calendar 2011) 37 0.1 2 3 3 County Program Aid (Payable 2011) 842 1.8 39 41 30 Community Corrections Funding (2011) 439 0.9 20 15 16
Total Aids 46,607 100.0 2,159 2,204 2,342 B. Property Tax Credits (Payable 2011) Homestead Market Value Credit 984 73.6 46 39 29 Agricultural Market Value Credit 262 19.6 12 7 4 Miscellaneous Credits 91 6.8 4 1 5
Total Property Tax Credits 1,337 100.0 62 47 38 C. Property Tax Refunds (10 filed 11) Regular (Homeowners) 1,026 70.4 48 34 51 Regular (Renters) 428 29.4 20 28 37 Targeting Refund 3 0.2 0 0 0
Total Property Tax Refunds 1,458 100.0 68 62 88 Total Aids/Credits $49,401 100.0% $2,288 $2,313 $2,469
II. Property Tax Data A. Property Tax Levy (Payable 2011) County Levy $12,249 42.7% $567 $474 $466 City/Town Levy 7,539 26.3 349 339 359 School District Net Tax Capacity Levy 3,763 13.1 174 215 243 School District Referendum Market Value Levy 2,614 9.1 121 115 142 Miscellaneous District Levy 1,097 3.8 51 27 208 State Property Tax Levy 1,406 4.9 65 105 149
Total Levy $28,669 100.0% $1,328 $1,274 $1,568 Less Property Tax Credits 1,337 62 47 38
Net Property Taxes Payable 27,332 1,266 1,227 1,529 B. Property Valuation (2010 Assessment) Market Valuation $2,534,873 $117,415 $96,697 $105,022 Referendum Market Valuation 1,542,635 $71,455 68,917 83,805 Net Tax Capacity (NTC) 23,613 1,094 1,003 1,171 C. Average Local NTC Tax Rate 104.045 Avg. Referendum Mkt. Value Tax Rate 0.175
III. Major State Taxes Individual Income Tax (2010 filed 2011) $19,528 51.7% $905 $1,052 $1,225 Sales/Use Tax (Calendar 2011) 6,622 17.5 307 568 746 Motor Vehicle Sales Tax (Calendar 2011) 2,636 7.0 122 102 101 Motor Vehicle Registration Tax (Calendar 2011) 2,673 7.1 124 106 108 Motor Fuels Tax (Calendar 2011) 3,185 8.4 148 171 159 Corporate Income Tax (Calendar 2011) 1,714 4.5 79 98 147 State General Property Tax (Payable 2011) 1,406 3.7 65 105 149
Total State Taxes $37,764 100.0% $1,749 $2,201 $2,634

House Research Department May 2015Table 4 Page 209
WADENA FIVE (5) STATEAmount
I. Major State Aids/Credits (000s) Percent Per Capita Per Capita Per Capita
A. Aids to Local Governments Education Aid (2010-2011) $19,861 46.9% $1,449 $1,273 $1,262 Human Services Aid (Calendar 2011) Medical Assistance 11,633 27.5 849 642 530 Minnesota Family Investment Program 260 0.6 19 11 14 General Assistance including GAMC 40 0.1 3 3 8 Social Services 4,096 9.7 299 247 247 Miscellaneous 505 1.2 37 26 30
Total 16,535 39.1 1,206 929 829 Highway Aid (Calendar 2011) County Aid 2,755 6.5 201 132 88 Municipal Aid 0 0.0 0 14 28 Township Aid 235 0.6 17 13 6
Total 2,990 7.1 218 158 122 Local Government Aid (Calendar 2011) 1,782 4.2 130 79 80 Disparity Reduction Aid (Calendar 2011) 94 0.2 7 2 3 County Program Aid (Payable 2011) 791 1.9 58 26 30 Community Corrections Funding (2011) 272 0.6 20 17 16
Total Aids 42,324 100.0 3,087 2,485 2,342 B. Property Tax Credits (Payable 2011) Homestead Market Value Credit 769 63.1 56 44 29 Agricultural Market Value Credit 249 20.4 18 13 4 Miscellaneous Credits 200 16.4 15 8 5
Total Property Tax Credits 1,218 100.0 89 65 38 C. Property Tax Refunds (10 filed 11) Regular (Homeowners) 413 52.4 30 33 51 Regular (Renters) 369 46.8 27 25 37 Targeting Refund 6 0.8 0 0 0
Total Property Tax Refunds 788 100.0 57 58 88 Total Aids/Credits $44,330 100.0% $3,234 $2,608 $2,469
II. Property Tax Data A. Property Tax Levy (Payable 2011) County Levy $7,850 55.5% $573 $561 $466 City/Town Levy 2,458 17.4 179 330 359 School District Net Tax Capacity Levy 1,830 12.9 134 223 243 School District Referendum Market Value Levy 903 6.4 66 66 142 Miscellaneous District Levy 162 1.1 12 29 208 State Property Tax Levy 947 6.7 69 176 149
Total Levy $14,150 100.0% $1,032 $1,386 $1,568 Less Property Tax Credits 1,218 89 65 38
Net Property Taxes Payable 12,932 943 1,322 1,529 B. Property Valuation (2010 Assessment) Market Valuation $1,028,366 $75,014 $150,534 $105,022 Referendum Market Valuation 591,715 $43,163 76,762 83,805 Net Tax Capacity (NTC) 10,025 731 1,557 1,171 C. Average Local NTC Tax Rate 122.695 Avg. Referendum Mkt. Value Tax Rate 0.153
III. Major State Taxes Individual Income Tax (2010 filed 2011) $7,092 32.0% $517 $674 $1,225 Sales/Use Tax (Calendar 2011) 8,055 36.3 588 581 746 Motor Vehicle Sales Tax (Calendar 2011) 1,560 7.0 114 106 101 Motor Vehicle Registration Tax (Calendar 2011) 1,466 6.6 107 105 108 Motor Fuels Tax (Calendar 2011) 2,328 10.5 170 201 159 Corporate Income Tax (Calendar 2011) 734 3.3 54 69 147 State General Property Tax (Payable 2011) 947 4.3 69 176 149
Total State Taxes $22,182 100.0% $1,618 $1,912 $2,634

House Research Department May 2015Table 4 Page 210
WASECA NINE (9) STATEAmount
I. Major State Aids/Credits (000s) Percent Per Capita Per Capita Per Capita
A. Aids to Local Governments Education Aid (2010-2011) $23,150 52.3% $1,208 $1,075 $1,262 Human Services Aid (Calendar 2011) Medical Assistance 8,732 19.7 456 451 530 Minnesota Family Investment Program 147 0.3 8 8 14 General Assistance including GAMC 53 0.1 3 4 8 Social Services 3,971 9.0 207 253 247 Miscellaneous 380 0.9 20 21 30
Total 13,284 30.0 693 736 829 Highway Aid (Calendar 2011) County Aid 2,788 6.3 145 165 88 Municipal Aid 312 0.7 16 18 28 Township Aid 185 0.4 10 14 6
Total 3,284 7.4 171 197 122 Local Government Aid (Calendar 2011) 3,366 7.6 176 170 80 Disparity Reduction Aid (Calendar 2011) 27 0.1 1 4 3 County Program Aid (Payable 2011) 820 1.9 43 38 30 Community Corrections Funding (2011) 307 0.7 16 18 16
Total Aids 44,238 100.0 2,308 2,238 2,342 B. Property Tax Credits (Payable 2011) Homestead Market Value Credit 865 72.4 45 39 29 Agricultural Market Value Credit 207 17.3 11 10 4 Miscellaneous Credits 123 10.3 6 2 5
Total Property Tax Credits 1,195 100.0 62 51 38 C. Property Tax Refunds (10 filed 11) Regular (Homeowners) 534 51.4 28 27 51 Regular (Renters) 504 48.6 26 26 37 Targeting Refund 0 0.0 0 0 0
Total Property Tax Refunds 1,038 100.0 54 53 88 Total Aids/Credits $46,471 100.0% $2,425 $2,342 $2,469
II. Property Tax Data A. Property Tax Levy (Payable 2011) County Levy $10,386 47.7% $542 $498 $466 City/Town Levy 5,619 25.8 293 317 359 School District Net Tax Capacity Levy 3,193 14.7 167 182 243 School District Referendum Market Value Levy 677 3.1 35 96 142 Miscellaneous District Levy 387 1.8 20 21 208 State Property Tax Levy 1,527 7.0 80 97 149
Total Levy $21,789 100.0% $1,137 $1,211 $1,568 Less Property Tax Credits 1,195 62 51 38
Net Property Taxes Payable 20,594 1,075 1,160 1,529 B. Property Valuation (2010 Assessment) Market Valuation $2,200,033 $114,788 $115,995 $105,022 Referendum Market Valuation 1,101,698 $57,482 59,665 83,805 Net Tax Capacity (NTC) 20,559 1,073 1,116 1,171 C. Average Local NTC Tax Rate 94.458 Avg. Referendum Mkt. Value Tax Rate 0.076
III. Major State Taxes Individual Income Tax (2010 filed 2011) $15,133 47.4% $790 $867 $1,225 Sales/Use Tax (Calendar 2011) 7,181 22.5 375 579 746 Motor Vehicle Sales Tax (Calendar 2011) 2,029 6.4 106 106 101 Motor Vehicle Registration Tax (Calendar 2011) 2,059 6.4 107 110 108 Motor Fuels Tax (Calendar 2011) 2,790 8.7 146 169 159 Corporate Income Tax (Calendar 2011) 1,212 3.8 63 170 147 State General Property Tax (Payable 2011) 1,527 4.8 80 97 149
Total State Taxes $31,932 100.0% $1,666 $2,100 $2,634

House Research Department May 2015Table 4 Page 211
WASHINGTON METRO (11) STATEAmount
I. Major State Aids/Credits (000s) Percent Per Capita Per Capita Per Capita
A. Aids to Local Governments Education Aid (2010-2011) $315,261 71.4% $1,310 $1,307 $1,262 Human Services Aid (Calendar 2011) Medical Assistance 60,936 13.8 253 542 530 Minnesota Family Investment Program 1,254 0.3 5 17 14 General Assistance including GAMC 519 0.1 2 10 8 Social Services 36,196 8.2 150 246 247 Miscellaneous 2,134 0.5 9 36 30
Total 101,038 22.9 420 851 829 Highway Aid (Calendar 2011) County Aid 8,574 1.9 36 38 88 Municipal Aid 7,137 1.6 30 33 28 Township Aid 79 0.0 0 0 6
Total 15,791 3.6 66 71 122 Local Government Aid (Calendar 2011) 1,436 0.3 6 46 80 Disparity Reduction Aid (Calendar 2011) 1 0.0 0 0 3 County Program Aid (Payable 2011) 5,507 1.2 23 23 30 Community Corrections Funding (2011) 2,295 0.5 10 14 16
Total Aids 441,329 100.0 1,834 2,314 2,342 B. Property Tax Credits (Payable 2011) Homestead Market Value Credit 5,074 96.9 21 20 29 Agricultural Market Value Credit 140 2.7 1 0 4 Miscellaneous Credits 22 0.4 0 0 5
Total Property Tax Credits 5,236 100.0 22 21 38 C. Property Tax Refunds (10 filed 11) Regular (Homeowners) 12,368 65.0 51 67 51 Regular (Renters) 6,574 34.6 27 45 37 Targeting Refund 83 0.4 0 0 0
Total Property Tax Refunds 19,025 100.0 79 113 88 Total Aids/Credits $465,590 100.0% $1,935 $2,447 $2,469
II. Property Tax Data A. Property Tax Levy (Payable 2011) County Levy $78,043 21.2% $324 $424 $466 City/Town Levy 87,477 23.8 364 407 359 School District Net Tax Capacity Levy 70,393 19.2 293 267 243 School District Referendum Market Value Levy 45,213 12.3 188 187 142 Miscellaneous District Levy 54,995 15.0 229 352 208 State Property Tax Levy 31,195 8.5 130 181 149
Total Levy $367,316 100.0% $1,526 $1,818 $1,568 Less Property Tax Credits 5,236 22 21 38
Net Property Taxes Payable 362,080 1,505 1,797 1,529 B. Property Valuation (2010 Assessment) Market Valuation $25,892,220 $107,597 $101,259 $105,022 Referendum Market Valuation 25,103,579 $104,320 99,620 83,805 Net Tax Capacity (NTC) 295,060 1,226 1,219 1,171 C. Average Local NTC Tax Rate 97.824 Avg. Referendum Mkt. Value Tax Rate 0.189
III. Major State Taxes Individual Income Tax (2010 filed 2011) $389,609 58.3% $1,619 $1,519 $1,225 Sales/Use Tax (Calendar 2011) 130,920 19.6 544 888 746 Motor Vehicle Sales Tax (Calendar 2011) 26,112 3.9 109 98 101 Motor Vehicle Registration Tax (Calendar 2011) 29,574 4.4 123 108 108 Motor Fuels Tax (Calendar 2011) 33,633 5.0 140 138 159 Corporate Income Tax (Calendar 2011) 27,528 4.1 114 187 147 State General Property Tax (Payable 2011) 31,195 4.7 130 181 149
Total State Taxes $668,570 100.0% $2,778 $3,119 $2,634

House Research Department May 2015Table 4 Page 212
WATONWAN NINE (9) STATEAmount
I. Major State Aids/Credits (000s) Percent Per Capita Per Capita Per Capita
A. Aids to Local Governments Education Aid (2010-2011) $15,272 48.4% $1,364 $1,075 $1,262 Human Services Aid (Calendar 2011) Medical Assistance 6,217 19.7 555 451 530 Minnesota Family Investment Program 70 0.2 6 8 14 General Assistance including GAMC 42 0.1 4 4 8 Social Services 3,312 10.5 296 253 247 Miscellaneous 170 0.5 15 21 30
Total 9,811 31.1 876 736 829 Highway Aid (Calendar 2011) County Aid 2,880 9.1 257 165 88 Municipal Aid 0 0.0 0 18 28 Township Aid 258 0.8 23 14 6
Total 3,138 9.9 280 197 122 Local Government Aid (Calendar 2011) 2,528 8.0 226 170 80 Disparity Reduction Aid (Calendar 2011) 11 0.0 1 4 3 County Program Aid (Payable 2011) 628 2.0 56 38 30 Community Corrections Funding (2011) 157 0.5 14 18 16
Total Aids 31,543 100.0 2,817 2,238 2,342 B. Property Tax Credits (Payable 2011) Homestead Market Value Credit 529 76.0 47 39 29 Agricultural Market Value Credit 160 23.1 14 10 4 Miscellaneous Credits 6 0.9 1 2 5
Total Property Tax Credits 696 100.0 62 51 38 C. Property Tax Refunds (10 filed 11) Regular (Homeowners) 160 47.6 14 27 51 Regular (Renters) 175 52.1 16 26 37 Targeting Refund 1 0.3 0 0 0
Total Property Tax Refunds 336 100.0 30 53 88 Total Aids/Credits $32,575 100.0% $2,909 $2,342 $2,469
II. Property Tax Data A. Property Tax Levy (Payable 2011) County Levy $7,132 53.1% $637 $498 $466 City/Town Levy 2,584 19.2 231 317 359 School District Net Tax Capacity Levy 1,874 14.0 167 182 243 School District Referendum Market Value Levy 1,038 7.7 93 96 142 Miscellaneous District Levy 186 1.4 17 21 208 State Property Tax Levy 618 4.6 55 97 149
Total Levy $13,432 100.0% $1,200 $1,211 $1,568 Less Property Tax Credits 696 62 51 38
Net Property Taxes Payable 12,736 1,137 1,160 1,529 B. Property Valuation (2010 Assessment) Market Valuation $1,501,572 $134,105 $115,995 $105,022 Referendum Market Valuation 432,342 $38,612 59,665 83,805 Net Tax Capacity (NTC) 13,165 1,176 1,116 1,171 C. Average Local NTC Tax Rate 89.449 Avg. Referendum Mkt. Value Tax Rate 0.240
III. Major State Taxes Individual Income Tax (2010 filed 2011) $7,381 41.4% $659 $867 $1,225 Sales/Use Tax (Calendar 2011) 3,694 20.7 330 579 746 Motor Vehicle Sales Tax (Calendar 2011) 1,248 7.0 111 106 101 Motor Vehicle Registration Tax (Calendar 2011) 1,244 7.0 111 110 108 Motor Fuels Tax (Calendar 2011) 2,558 14.3 228 169 159 Corporate Income Tax (Calendar 2011) 1,100 6.2 98 170 147 State General Property Tax (Payable 2011) 618 3.5 55 97 149
Total State Taxes $17,843 100.0% $1,594 $2,100 $2,634
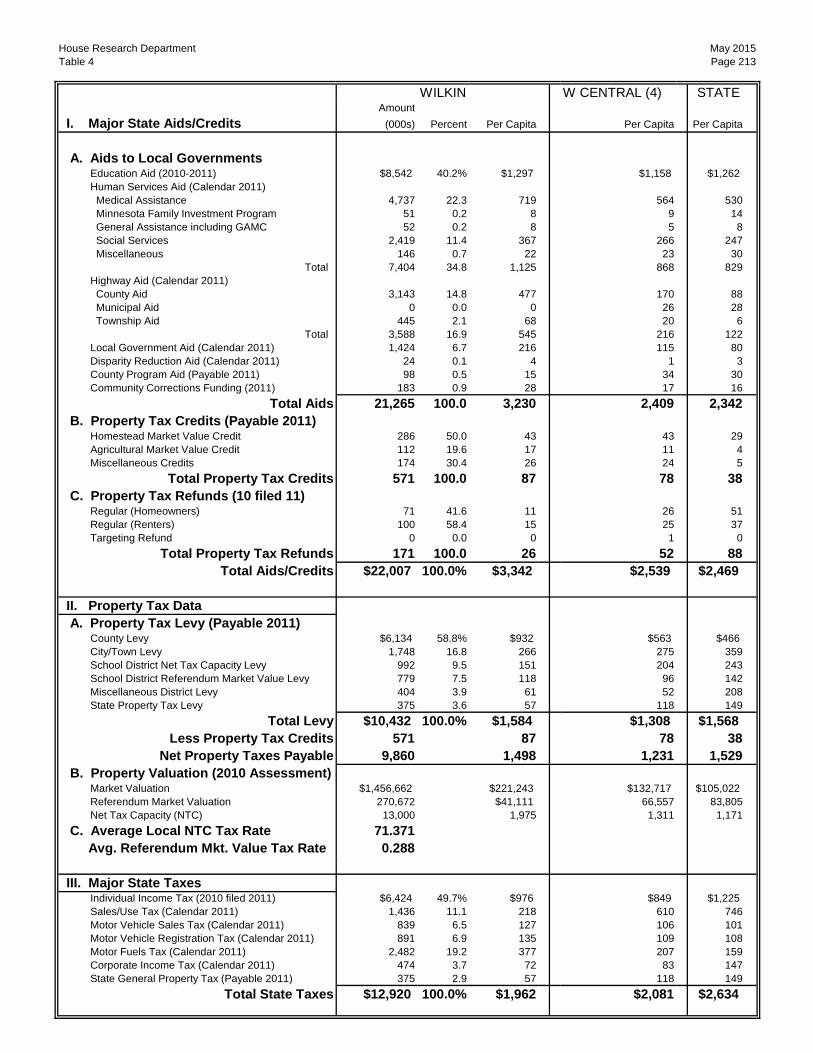
House Research Department May 2015Table 4 Page 213
WILKIN W CENTRAL (4) STATEAmount
I. Major State Aids/Credits (000s) Percent Per Capita Per Capita Per Capita
A. Aids to Local Governments Education Aid (2010-2011) $8,542 40.2% $1,297 $1,158 $1,262 Human Services Aid (Calendar 2011) Medical Assistance 4,737 22.3 719 564 530 Minnesota Family Investment Program 51 0.2 8 9 14 General Assistance including GAMC 52 0.2 8 5 8 Social Services 2,419 11.4 367 266 247 Miscellaneous 146 0.7 22 23 30
Total 7,404 34.8 1,125 868 829 Highway Aid (Calendar 2011) County Aid 3,143 14.8 477 170 88 Municipal Aid 0 0.0 0 26 28 Township Aid 445 2.1 68 20 6
Total 3,588 16.9 545 216 122 Local Government Aid (Calendar 2011) 1,424 6.7 216 115 80 Disparity Reduction Aid (Calendar 2011) 24 0.1 4 1 3 County Program Aid (Payable 2011) 98 0.5 15 34 30 Community Corrections Funding (2011) 183 0.9 28 17 16
Total Aids 21,265 100.0 3,230 2,409 2,342 B. Property Tax Credits (Payable 2011) Homestead Market Value Credit 286 50.0 43 43 29 Agricultural Market Value Credit 112 19.6 17 11 4 Miscellaneous Credits 174 30.4 26 24 5
Total Property Tax Credits 571 100.0 87 78 38 C. Property Tax Refunds (10 filed 11) Regular (Homeowners) 71 41.6 11 26 51 Regular (Renters) 100 58.4 15 25 37 Targeting Refund 0 0.0 0 1 0
Total Property Tax Refunds 171 100.0 26 52 88 Total Aids/Credits $22,007 100.0% $3,342 $2,539 $2,469
II. Property Tax Data A. Property Tax Levy (Payable 2011) County Levy $6,134 58.8% $932 $563 $466 City/Town Levy 1,748 16.8 266 275 359 School District Net Tax Capacity Levy 992 9.5 151 204 243 School District Referendum Market Value Levy 779 7.5 118 96 142 Miscellaneous District Levy 404 3.9 61 52 208 State Property Tax Levy 375 3.6 57 118 149
Total Levy $10,432 100.0% $1,584 $1,308 $1,568 Less Property Tax Credits 571 87 78 38
Net Property Taxes Payable 9,860 1,498 1,231 1,529 B. Property Valuation (2010 Assessment) Market Valuation $1,456,662 $221,243 $132,717 $105,022 Referendum Market Valuation 270,672 $41,111 66,557 83,805 Net Tax Capacity (NTC) 13,000 1,975 1,311 1,171 C. Average Local NTC Tax Rate 71.371 Avg. Referendum Mkt. Value Tax Rate 0.288
III. Major State Taxes Individual Income Tax (2010 filed 2011) $6,424 49.7% $976 $849 $1,225 Sales/Use Tax (Calendar 2011) 1,436 11.1 218 610 746 Motor Vehicle Sales Tax (Calendar 2011) 839 6.5 127 106 101 Motor Vehicle Registration Tax (Calendar 2011) 891 6.9 135 109 108 Motor Fuels Tax (Calendar 2011) 2,482 19.2 377 207 159 Corporate Income Tax (Calendar 2011) 474 3.7 72 83 147 State General Property Tax (Payable 2011) 375 2.9 57 118 149
Total State Taxes $12,920 100.0% $1,962 $2,081 $2,634

House Research Department May 2015Table 4 Page 214
WINONA SE MN (10) STATEAmount
I. Major State Aids/Credits (000s) Percent Per Capita Per Capita Per Capita
A. Aids to Local Governments Education Aid (2010-2011) $45,844 45.5% $892 $1,187 $1,262 Human Services Aid (Calendar 2011) Medical Assistance 19,889 19.7 387 418 530 Minnesota Family Investment Program 333 0.3 6 9 14 General Assistance including GAMC 175 0.2 3 3 8 Social Services 13,134 13.0 256 246 247 Miscellaneous 1,118 1.1 22 20 30
Total 34,650 34.4 674 696 829 Highway Aid (Calendar 2011) County Aid 5,084 5.0 99 110 88 Municipal Aid 940 0.9 18 29 28 Township Aid 330 0.3 6 9 6
Total 6,354 6.3 124 148 122 Local Government Aid (Calendar 2011) 10,810 10.7 210 114 80 Disparity Reduction Aid (Calendar 2011) 94 0.1 2 3 3 County Program Aid (Payable 2011) 2,483 2.5 48 41 30 Community Corrections Funding (2011) 590 0.6 11 15 16
Total Aids 100,825 100.0 1,962 2,204 2,342 B. Property Tax Credits (Payable 2011) Homestead Market Value Credit 1,941 84.1 38 39 29 Agricultural Market Value Credit 305 13.2 6 7 4 Miscellaneous Credits 61 2.6 1 1 5
Total Property Tax Credits 2,307 100.0 45 47 38 C. Property Tax Refunds (10 filed 11) Regular (Homeowners) 1,501 55.8 29 34 51 Regular (Renters) 1,183 44.0 23 28 37 Targeting Refund 3 0.1 0 0 0
Total Property Tax Refunds 2,687 100.0 52 62 88 Total Aids/Credits $105,819 100.0% $2,059 $2,313 $2,469
II. Property Tax Data A. Property Tax Levy (Payable 2011) County Levy $17,640 35.2% $343 $474 $466 City/Town Levy 12,367 24.7 241 339 359 School District Net Tax Capacity Levy 7,053 14.1 137 215 243 School District Referendum Market Value Levy 7,718 15.4 150 115 142 Miscellaneous District Levy 757 1.5 15 27 208 State Property Tax Levy 4,571 9.1 89 105 149
Total Levy $50,106 100.0% $975 $1,274 $1,568 Less Property Tax Credits 2,307 45 47 38
Net Property Taxes Payable 47,799 930 1,227 1,529 B. Property Valuation (2010 Assessment) Market Valuation $3,987,997 $77,609 $96,697 $105,022 Referendum Market Valuation 3,029,480 $58,955 68,917 83,805 Net Tax Capacity (NTC) 41,491 807 1,003 1,171 C. Average Local NTC Tax Rate 91.147 Avg. Referendum Mkt. Value Tax Rate 0.255
III. Major State Taxes Individual Income Tax (2010 filed 2011) $44,487 45.5% $866 $1,052 $1,225 Sales/Use Tax (Calendar 2011) 25,435 26.0 495 568 746 Motor Vehicle Sales Tax (Calendar 2011) 4,481 4.6 87 102 101 Motor Vehicle Registration Tax (Calendar 2011) 4,617 4.7 90 106 108 Motor Fuels Tax (Calendar 2011) 8,914 9.1 173 171 159 Corporate Income Tax (Calendar 2011) 5,343 5.5 104 98 147 State General Property Tax (Payable 2011) 4,571 4.7 89 105 149
Total State Taxes $97,848 100.0% $1,904 $2,201 $2,634
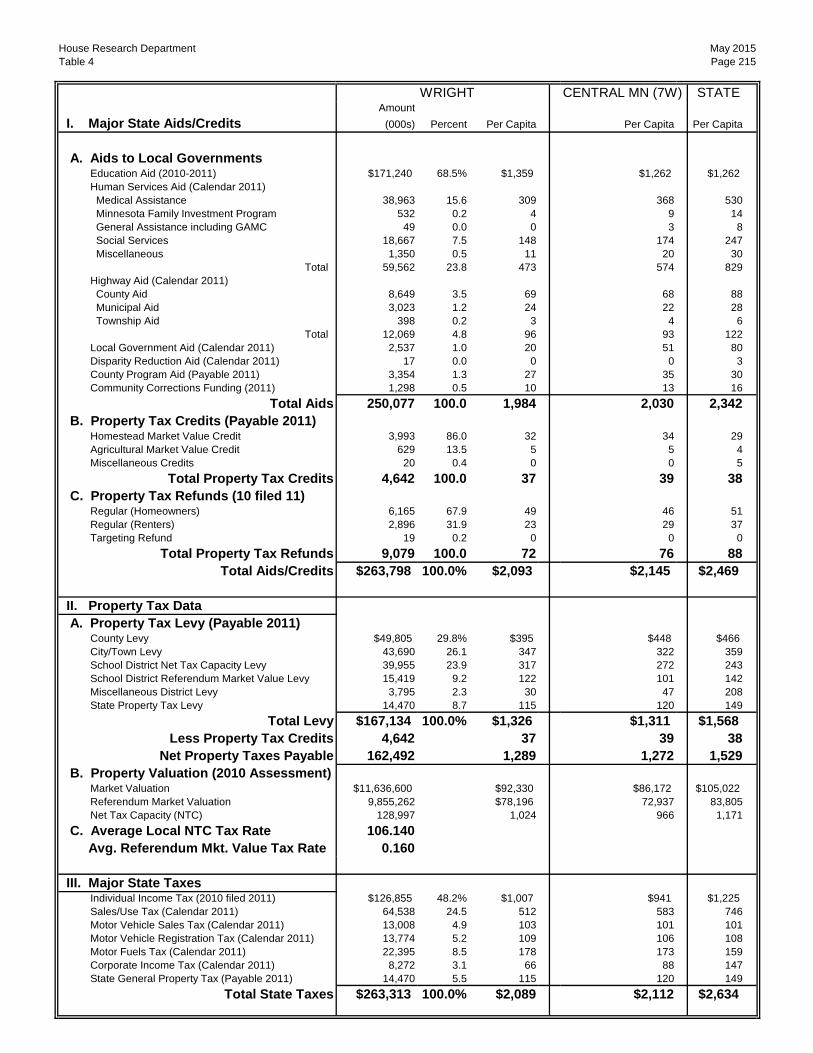
House Research Department May 2015Table 4 Page 215
WRIGHT CENTRAL MN (7W) STATEAmount
I. Major State Aids/Credits (000s) Percent Per Capita Per Capita Per Capita
A. Aids to Local Governments Education Aid (2010-2011) $171,240 68.5% $1,359 $1,262 $1,262 Human Services Aid (Calendar 2011) Medical Assistance 38,963 15.6 309 368 530 Minnesota Family Investment Program 532 0.2 4 9 14 General Assistance including GAMC 49 0.0 0 3 8 Social Services 18,667 7.5 148 174 247 Miscellaneous 1,350 0.5 11 20 30
Total 59,562 23.8 473 574 829 Highway Aid (Calendar 2011) County Aid 8,649 3.5 69 68 88 Municipal Aid 3,023 1.2 24 22 28 Township Aid 398 0.2 3 4 6
Total 12,069 4.8 96 93 122 Local Government Aid (Calendar 2011) 2,537 1.0 20 51 80 Disparity Reduction Aid (Calendar 2011) 17 0.0 0 0 3 County Program Aid (Payable 2011) 3,354 1.3 27 35 30 Community Corrections Funding (2011) 1,298 0.5 10 13 16
Total Aids 250,077 100.0 1,984 2,030 2,342 B. Property Tax Credits (Payable 2011) Homestead Market Value Credit 3,993 86.0 32 34 29 Agricultural Market Value Credit 629 13.5 5 5 4 Miscellaneous Credits 20 0.4 0 0 5
Total Property Tax Credits 4,642 100.0 37 39 38 C. Property Tax Refunds (10 filed 11) Regular (Homeowners) 6,165 67.9 49 46 51 Regular (Renters) 2,896 31.9 23 29 37 Targeting Refund 19 0.2 0 0 0
Total Property Tax Refunds 9,079 100.0 72 76 88 Total Aids/Credits $263,798 100.0% $2,093 $2,145 $2,469
II. Property Tax Data A. Property Tax Levy (Payable 2011) County Levy $49,805 29.8% $395 $448 $466 City/Town Levy 43,690 26.1 347 322 359 School District Net Tax Capacity Levy 39,955 23.9 317 272 243 School District Referendum Market Value Levy 15,419 9.2 122 101 142 Miscellaneous District Levy 3,795 2.3 30 47 208 State Property Tax Levy 14,470 8.7 115 120 149
Total Levy $167,134 100.0% $1,326 $1,311 $1,568 Less Property Tax Credits 4,642 37 39 38
Net Property Taxes Payable 162,492 1,289 1,272 1,529 B. Property Valuation (2010 Assessment) Market Valuation $11,636,600 $92,330 $86,172 $105,022 Referendum Market Valuation 9,855,262 $78,196 72,937 83,805 Net Tax Capacity (NTC) 128,997 1,024 966 1,171 C. Average Local NTC Tax Rate 106.140 Avg. Referendum Mkt. Value Tax Rate 0.160
III. Major State Taxes Individual Income Tax (2010 filed 2011) $126,855 48.2% $1,007 $941 $1,225 Sales/Use Tax (Calendar 2011) 64,538 24.5 512 583 746 Motor Vehicle Sales Tax (Calendar 2011) 13,008 4.9 103 101 101 Motor Vehicle Registration Tax (Calendar 2011) 13,774 5.2 109 106 108 Motor Fuels Tax (Calendar 2011) 22,395 8.5 178 173 159 Corporate Income Tax (Calendar 2011) 8,272 3.1 66 88 147 State General Property Tax (Payable 2011) 14,470 5.5 115 120 149
Total State Taxes $263,313 100.0% $2,089 $2,112 $2,634

House Research Department May 2015Table 4 Page 216
YELLOW MEDICINE MN VALLEY (6W) STATEAmount
I. Major State Aids/Credits (000s) Percent Per Capita Per Capita Per Capita
A. Aids to Local Governments Education Aid (2010-2011) $14,268 46.7% $1,381 $1,347 $1,262 Human Services Aid (Calendar 2011) Medical Assistance 6,159 20.1 596 696 530 Minnesota Family Investment Program 63 0.2 6 8 14 General Assistance including GAMC 46 0.2 4 3 8 Social Services 3,465 11.3 335 299 247 Miscellaneous 207 0.7 20 21 30
Total 9,939 32.5 962 1,026 829 Highway Aid (Calendar 2011) County Aid 3,293 10.8 319 313 88 Municipal Aid 0 0.0 0 5 28 Township Aid 626 2.0 61 58 6
Total 3,919 12.8 379 376 122 Local Government Aid (Calendar 2011) 1,959 6.4 190 198 80 Disparity Reduction Aid (Calendar 2011) 92 0.3 9 13 3 County Program Aid (Payable 2011) 265 0.9 26 34 30 Community Corrections Funding (2011) 130 0.4 13 17 16
Total Aids 30,573 100.0 2,959 3,012 2,342 B. Property Tax Credits (Payable 2011) Homestead Market Value Credit 444 65.8 43 45 29 Agricultural Market Value Credit 231 34.2 22 21 4 Miscellaneous Credits 0 0.0 0 0 5
Total Property Tax Credits 675 100.0 65 66 38 C. Property Tax Refunds (10 filed 11) Regular (Homeowners) 196 52.5 19 16 51 Regular (Renters) 174 46.6 17 19 37 Targeting Refund 3 0.9 0 0 0
Total Property Tax Refunds 374 100.0 36 34 88 Total Aids/Credits $31,622 100.0% $3,061 $3,112 $2,469
II. Property Tax Data A. Property Tax Levy (Payable 2011) County Levy $7,903 51.5% $765 $696 $466 City/Town Levy 3,380 22.0 327 361 359 School District Net Tax Capacity Levy 2,347 15.3 227 210 243 School District Referendum Market Value Levy 884 5.8 86 97 142 Miscellaneous District Levy 309 2.0 30 36 208 State Property Tax Levy 538 3.5 52 82 149
Total Levy $15,360 100.0% $1,487 $1,482 $1,568 Less Property Tax Credits 675 65 66 38
Net Property Taxes Payable 14,685 1,421 1,416 1,529 B. Property Valuation (2010 Assessment) Market Valuation $1,945,554 $188,322 $177,801 $105,022 Referendum Market Valuation 394,247 $38,162 41,733 83,805 Net Tax Capacity (NTC) 16,202 1,568 1,527 1,171 C. Average Local NTC Tax Rate 85.593 Avg. Referendum Mkt. Value Tax Rate 0.242
III. Major State Taxes Individual Income Tax (2010 filed 2011) $9,389 42.1% $909 $923 $1,225 Sales/Use Tax (Calendar 2011) 3,654 16.4 354 453 746 Motor Vehicle Sales Tax (Calendar 2011) 1,273 5.7 123 123 101 Motor Vehicle Registration Tax (Calendar 2011) 1,347 6.0 130 130 108 Motor Fuels Tax (Calendar 2011) 2,042 9.2 198 200 159 Corporate Income Tax (Calendar 2011) 4,065 18.2 393 201 147 State General Property Tax (Payable 2011) 538 2.4 52 82 149
Total State Taxes $22,307 100.0% $2,159 $2,114 $2,634
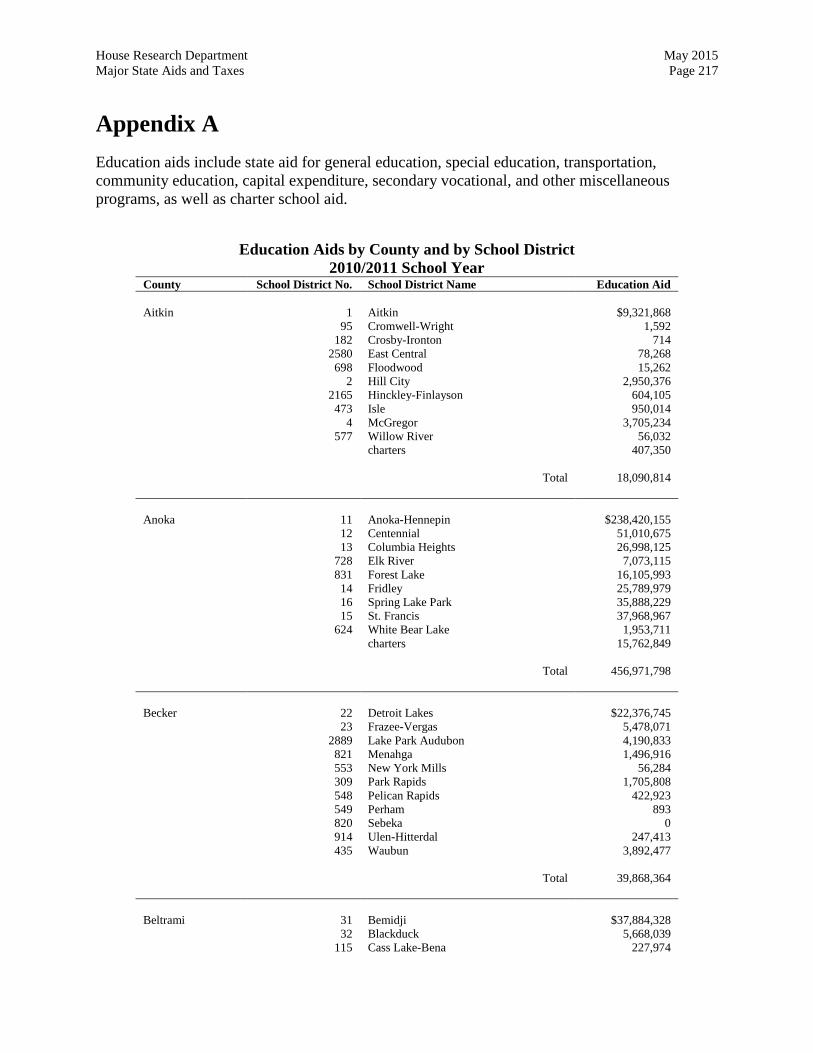
House Research Department May 2015 Major State Aids and Taxes Page 217
Appendix A Education aids include state aid for general education, special education, transportation, community education, capital expenditure, secondary vocational, and other miscellaneous programs, as well as charter school aid.
Education Aids by County and by School District 2010/2011 School Year
County School District No. School District Name Education Aid Aitkin 1 Aitkin $9,321,868 95 Cromwell-Wright 1,592 182 Crosby-Ironton 714 2580 East Central 78,268 698 Floodwood 15,262 2 Hill City 2,950,376 2165 Hinckley-Finlayson 604,105 473 Isle 950,014 4 McGregor 3,705,234 577 Willow River 56,032 charters 407,350 Total 18,090,814 Anoka 11 Anoka-Hennepin $238,420,155 12 Centennial 51,010,675 13 Columbia Heights 26,998,125 728 Elk River 7,073,115 831 Forest Lake 16,105,993 14 Fridley 25,789,979 16 Spring Lake Park 35,888,229 15 St. Francis 37,968,967 624 White Bear Lake 1,953,711 charters 15,762,849 Total 456,971,798 Becker 22 Detroit Lakes $22,376,745 23 Frazee-Vergas 5,478,071 2889 Lake Park Audubon 4,190,833 821 Menahga 1,496,916 553 New York Mills 56,284 309 Park Rapids 1,705,808 548 Pelican Rapids 422,923 549 Perham 893 820 Sebeka 0 914 Ulen-Hitterdal 247,413 435 Waubun 3,892,477 Total 39,868,364 Beltrami 31 Bemidji $37,884,328 32 Blackduck 5,668,039 115 Cass Lake-Bena 227,974
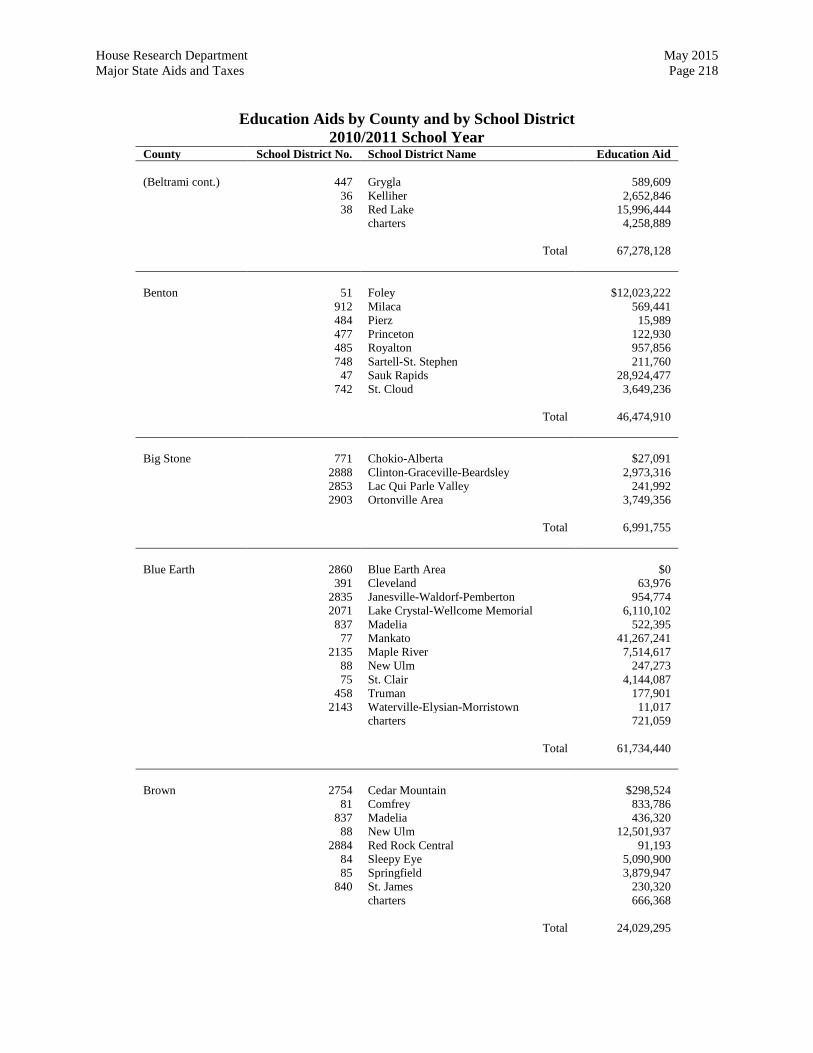
House Research Department May 2015 Major State Aids and Taxes Page 218
Education Aids by County and by School District 2010/2011 School Year
County School District No. School District Name Education Aid (Beltrami cont.) 447 Grygla 589,609 36 Kelliher 2,652,846 38 Red Lake 15,996,444 charters 4,258,889 Total 67,278,128 Benton 51 Foley $12,023,222 912 Milaca 569,441 484 Pierz 15,989 477 Princeton 122,930 485 Royalton 957,856 748 Sartell-St. Stephen 211,760 47 Sauk Rapids 28,924,477 742 St. Cloud 3,649,236 Total 46,474,910 Big Stone 771 Chokio-Alberta $27,091 2888 Clinton-Graceville-Beardsley 2,973,316 2853 Lac Qui Parle Valley 241,992 2903 Ortonville Area 3,749,356 Total 6,991,755 Blue Earth 2860 Blue Earth Area $0 391 Cleveland 63,976 2835 Janesville-Waldorf-Pemberton 954,774 2071 Lake Crystal-Wellcome Memorial 6,110,102 837 Madelia 522,395 77 Mankato 41,267,241 2135 Maple River 7,514,617 88 New Ulm 247,273 75 St. Clair 4,144,087 458 Truman 177,901 2143 Waterville-Elysian-Morristown 11,017 charters 721,059 Total 61,734,440 Brown 2754 Cedar Mountain $298,524 81 Comfrey 833,786 837 Madelia 436,320 88 New Ulm 12,501,937 2884 Red Rock Central 91,193 84 Sleepy Eye 5,090,900 85 Springfield 3,879,947 840 St. James 230,320 charters 666,368 Total 24,029,295
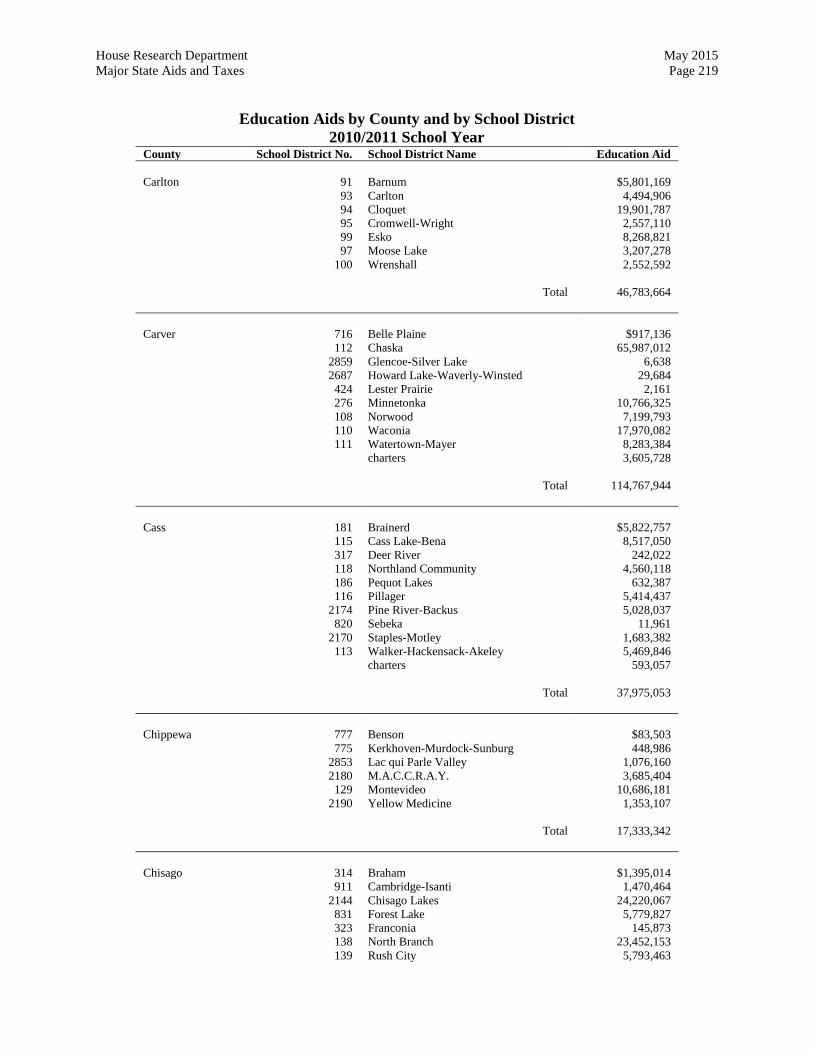
House Research Department May 2015 Major State Aids and Taxes Page 219
Education Aids by County and by School District 2010/2011 School Year
County School District No. School District Name Education Aid Carlton 91 Barnum $5,801,169 93 Carlton 4,494,906 94 Cloquet 19,901,787 95 Cromwell-Wright 2,557,110 99 Esko 8,268,821 97 Moose Lake 3,207,278 100 Wrenshall 2,552,592 Total 46,783,664 Carver 716 Belle Plaine $917,136 112 Chaska 65,987,012 2859 Glencoe-Silver Lake 6,638 2687 Howard Lake-Waverly-Winsted 29,684 424 Lester Prairie 2,161 276 Minnetonka 10,766,325 108 Norwood 7,199,793 110 Waconia 17,970,082 111 Watertown-Mayer 8,283,384 charters 3,605,728 Total 114,767,944 Cass 181 Brainerd $5,822,757 115 Cass Lake-Bena 8,517,050 317 Deer River 242,022 118 Northland Community 4,560,118 186 Pequot Lakes 632,387 116 Pillager 5,414,437 2174 Pine River-Backus 5,028,037 820 Sebeka 11,961 2170 Staples-Motley 1,683,382 113 Walker-Hackensack-Akeley 5,469,846 charters 593,057 Total 37,975,053 Chippewa 777 Benson $83,503 775 Kerkhoven-Murdock-Sunburg 448,986 2853 Lac qui Parle Valley 1,076,160 2180 M.A.C.C.R.A.Y. 3,685,404 129 Montevideo 10,686,181 2190 Yellow Medicine 1,353,107 Total 17,333,342 Chisago 314 Braham $1,395,014 911 Cambridge-Isanti 1,470,464 2144 Chisago Lakes 24,220,067 831 Forest Lake 5,779,827 323 Franconia 145,873 138 North Branch 23,452,153 139 Rush City 5,793,463
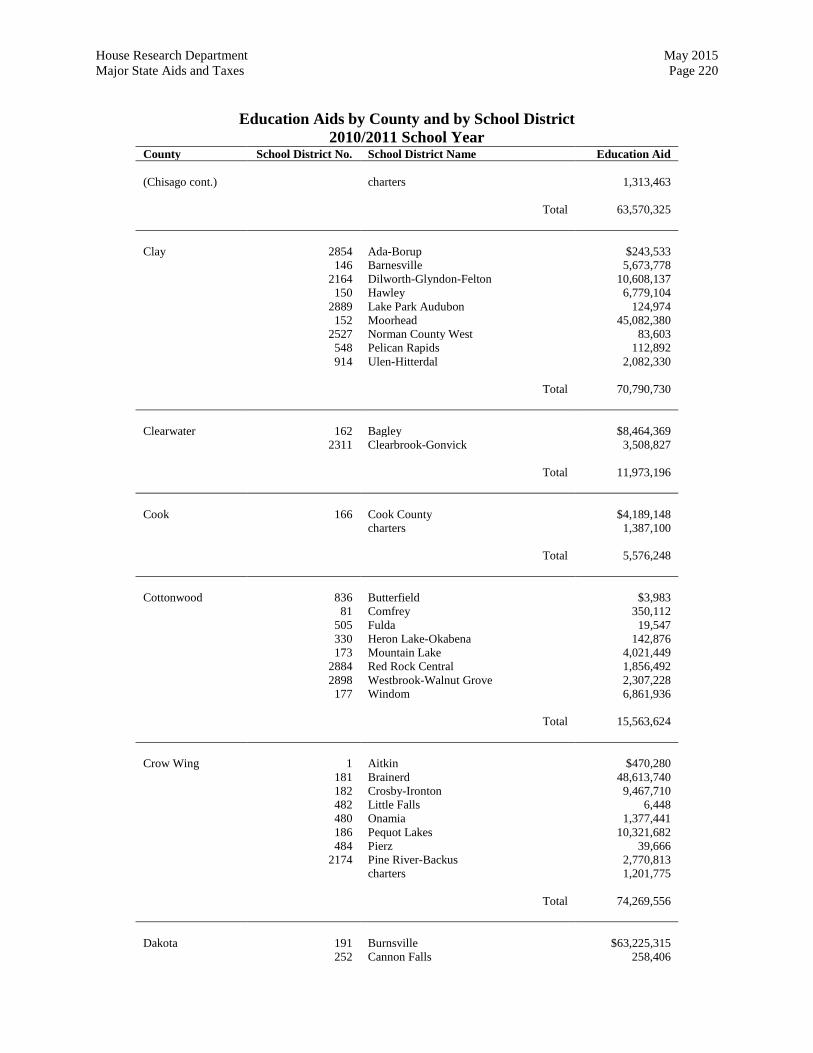
House Research Department May 2015 Major State Aids and Taxes Page 220
Education Aids by County and by School District 2010/2011 School Year
County School District No. School District Name Education Aid (Chisago cont.) charters 1,313,463 Total 63,570,325 Clay 2854 Ada-Borup $243,533 146 Barnesville 5,673,778 2164 Dilworth-Glyndon-Felton 10,608,137 150 Hawley 6,779,104 2889 Lake Park Audubon 124,974 152 Moorhead 45,082,380 2527 Norman County West 83,603 548 Pelican Rapids 112,892 914 Ulen-Hitterdal 2,082,330 Total 70,790,730 Clearwater 162 Bagley $8,464,369 2311 Clearbrook-Gonvick 3,508,827 Total 11,973,196 Cook 166 Cook County $4,189,148 charters 1,387,100 Total 5,576,248 Cottonwood 836 Butterfield $3,983 81 Comfrey 350,112 505 Fulda 19,547 330 Heron Lake-Okabena 142,876 173 Mountain Lake 4,021,449 2884 Red Rock Central 1,856,492 2898 Westbrook-Walnut Grove 2,307,228 177 Windom 6,861,936 Total 15,563,624 Crow Wing 1 Aitkin $470,280 181 Brainerd 48,613,740 182 Crosby-Ironton 9,467,710 482 Little Falls 6,448 480 Onamia 1,377,441 186 Pequot Lakes 10,321,682 484 Pierz 39,666 2174 Pine River-Backus 2,770,813 charters 1,201,775 Total 74,269,556 Dakota 191 Burnsville $63,225,315 252 Cannon Falls 258,406
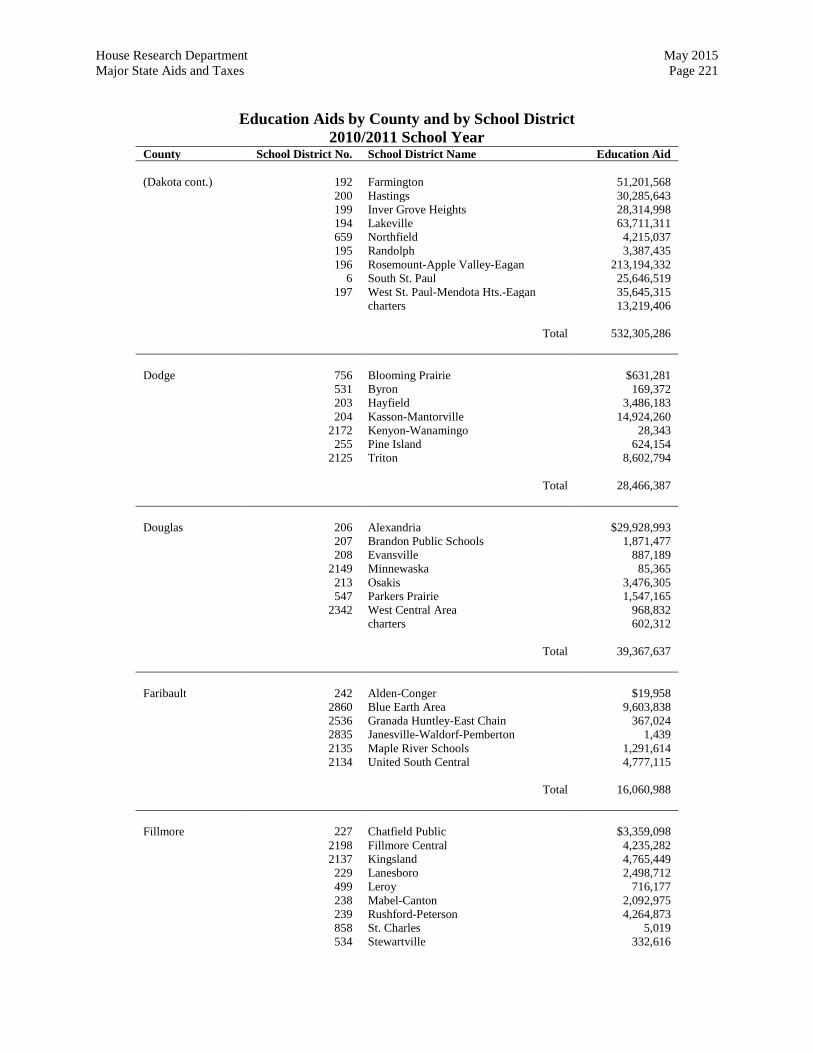
House Research Department May 2015 Major State Aids and Taxes Page 221
Education Aids by County and by School District 2010/2011 School Year
County School District No. School District Name Education Aid (Dakota cont.) 192 Farmington 51,201,568 200 Hastings 30,285,643 199 Inver Grove Heights 28,314,998 194 Lakeville 63,711,311 659 Northfield 4,215,037 195 Randolph 3,387,435 196 Rosemount-Apple Valley-Eagan 213,194,332 6 South St. Paul 25,646,519 197 West St. Paul-Mendota Hts.-Eagan 35,645,315 charters 13,219,406 Total 532,305,286 Dodge 756 Blooming Prairie $631,281 531 Byron 169,372 203 Hayfield 3,486,183 204 Kasson-Mantorville 14,924,260 2172 Kenyon-Wanamingo 28,343 255 Pine Island 624,154 2125 Triton 8,602,794 Total 28,466,387 Douglas 206 Alexandria $29,928,993 207 Brandon Public Schools 1,871,477 208 Evansville 887,189 2149 Minnewaska 85,365 213 Osakis 3,476,305 547 Parkers Prairie 1,547,165 2342 West Central Area 968,832 charters 602,312 Total 39,367,637 Faribault 242 Alden-Conger $19,958 2860 Blue Earth Area 9,603,838 2536 Granada Huntley-East Chain 367,024 2835 Janesville-Waldorf-Pemberton 1,439 2135 Maple River Schools 1,291,614 2134 United South Central 4,777,115 Total 16,060,988 Fillmore 227 Chatfield Public $3,359,098 2198 Fillmore Central 4,235,282 2137 Kingsland 4,765,449 229 Lanesboro 2,498,712 499 Leroy 716,177 238 Mabel-Canton 2,092,975 239 Rushford-Peterson 4,264,873 858 St. Charles 5,019 534 Stewartville 332,616

House Research Department May 2015 Major State Aids and Taxes Page 222
Education Aids by County and by School District 2010/2011 School Year
County School District No. School District Name Education Aid (Fillmore cont.) Total 22,270,202 Freeborn 241 Albert Lea $28,638,578 242 Alden-Conger 4,580,712 492 Austin 1,085,578 756 Blooming Prairie 670,356 2886 Glenville-Emmons 2,970,804 497 Lyle 166,780 2168 N.R.H.E.G. 1,923,636 2134 United South Central 1,149,852 Total 41,186,296 Goodhue 252 Cannon Falls $8,031,610 656 Faribault 3,213 253 Goodhue 4,394,971 200 Hastings 31,690 2172 Kenyon-Wanamingo 5,843,428 813 Lake City 2,766,042 659 Northfield 251,909 255 Pine Island 3,573,987 195 Randolph 405,235 256 Red Wing 21,505,383 2125 Triton 63,162 2805 Zumbrota-Mazeppa 5,375,134 Total 52,245,764 Grant 261 Ashby $1,032,651 852 Campbell-Tintah 4,986 208 Evansville 165,480 264 Herman-Norcross 1,086,666 2342 West Central Area 4,247,075 Total 6,536,858 Hennepin 11 Anoka-Hennepin $67,175,688 271 Bloomington 83,332,767 286 Brooklyn Center 22,817,105 877 Buffalo 8,051,842 879 Delano 5,972,223 272 Eden Prairie 71,772,833 273 Edina 60,252,034 728 Elk River 19,147,985 270 Hopkins 58,755,554 1 Minneapolis 357,178,342 276 Minnetonka 50,034,106 278 Orono 19,622,158 279 Osseo 171,871,743 280 Richfield 36,175,524 281 Robbinsdale 96,407,638 883 Rockford 7,031,376 282 St. Anthony-New Brighton 7,904,710

House Research Department May 2015 Major State Aids and Taxes Page 223
Education Aids by County and by School District 2010/2011 School Year
County School District No. School District Name Education Aid (Hennepin cont.) 283 St. Louis Park 34,644,987 110 Waconia 5,054,285 111 Watertown-Mayer 1,906,368 284 Wayzata 75,147,264 277 Westonka 16,014,904 charters 153,635,126 Total 1,429,906,562 Houston 299 Caledonia $6,178,434 294 Houston 13,312,087 300 La Crescent-Hokah 9,237,787 238 Mabel-Canton 54,647 239 Rushford-Peterson 322,095 297 Spring Grove 2,428,468 charters 932,435 Total 32,465,952 Hubbard 31 Bemidji $4,367,472 115 Cass Lake-Bena 3,717,117 306 Laporte 2,283,190 821 Menahga 271,965 308 Nevis 4,167,567 309 Park Rapids 10,048,536 25 Pine Point 890,743 113 Walker-Hackensack-Akeley 928,861 Total 26,675,449 Isanti 314 Braham $3,700,087 911 Cambridge-Isanti 36,240,478 728 Elk River 4,583 912 Milaca 67,421 332 Mora 1,802 138 North Branch 2,812,039 333 Ogilvie 253,812 477 Princeton 3,611,925 15 St. Francis 2,959,043 Total 49,651,189 Itasca 32 Blackduck $26,622 317 Deer River 7,501,797 318 Grand Rapids 29,578,250 316 Greenway 8,902,260 319 Nashwauk-Keewatin 5,267,402 charters 1,323,592 Total 52,599,923 Jackson 513 Brewster $335,615
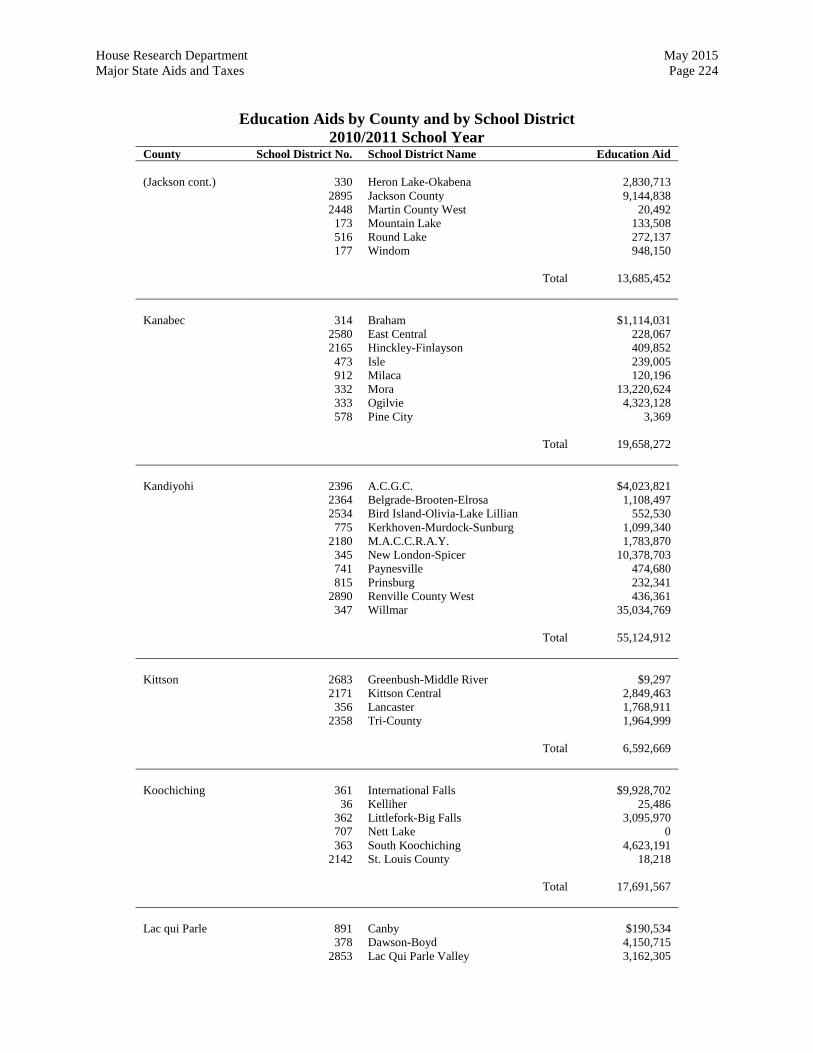
House Research Department May 2015 Major State Aids and Taxes Page 224
Education Aids by County and by School District 2010/2011 School Year
County School District No. School District Name Education Aid (Jackson cont.) 330 Heron Lake-Okabena 2,830,713 2895 Jackson County 9,144,838 2448 Martin County West 20,492 173 Mountain Lake 133,508 516 Round Lake 272,137 177 Windom 948,150 Total 13,685,452 Kanabec 314 Braham $1,114,031 2580 East Central 228,067 2165 Hinckley-Finlayson 409,852 473 Isle 239,005 912 Milaca 120,196 332 Mora 13,220,624 333 Ogilvie 4,323,128 578 Pine City 3,369 Total 19,658,272 Kandiyohi 2396 A.C.G.C. $4,023,821 2364 Belgrade-Brooten-Elrosa 1,108,497 2534 Bird Island-Olivia-Lake Lillian 552,530 775 Kerkhoven-Murdock-Sunburg 1,099,340 2180 M.A.C.C.R.A.Y. 1,783,870 345 New London-Spicer 10,378,703 741 Paynesville 474,680 815 Prinsburg 232,341 2890 Renville County West 436,361 347 Willmar 35,034,769 Total 55,124,912 Kittson 2683 Greenbush-Middle River $9,297 2171 Kittson Central 2,849,463 356 Lancaster 1,768,911 2358 Tri-County 1,964,999 Total 6,592,669 Koochiching 361 International Falls $9,928,702 36 Kelliher 25,486 362 Littlefork-Big Falls 3,095,970 707 Nett Lake 0 363 South Koochiching 4,623,191 2142 St. Louis County 18,218 Total 17,691,567 Lac qui Parle 891 Canby $190,534 378 Dawson-Boyd 4,150,715 2853 Lac Qui Parle Valley 3,162,305
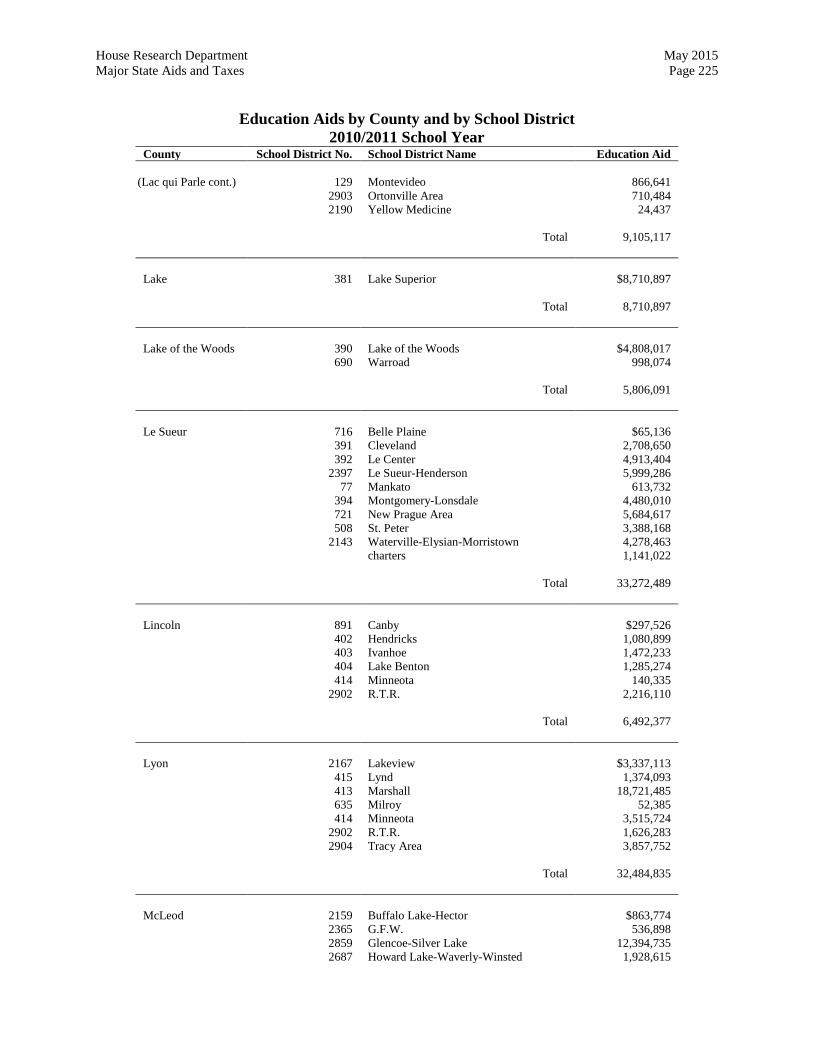
House Research Department May 2015 Major State Aids and Taxes Page 225
Education Aids by County and by School District 2010/2011 School Year
County School District No. School District Name Education Aid
(Lac qui Parle cont.) 129 Montevideo 866,641 2903 Ortonville Area 710,484 2190 Yellow Medicine 24,437 Total 9,105,117 Lake 381 Lake Superior $8,710,897 Total 8,710,897 Lake of the Woods 390 Lake of the Woods $4,808,017 690 Warroad 998,074 Total 5,806,091 Le Sueur 716 Belle Plaine $65,136 391 Cleveland 2,708,650 392 Le Center 4,913,404 2397 Le Sueur-Henderson 5,999,286 77 Mankato 613,732 394 Montgomery-Lonsdale 4,480,010 721 New Prague Area 5,684,617 508 St. Peter 3,388,168 2143 Waterville-Elysian-Morristown 4,278,463 charters 1,141,022 Total 33,272,489 Lincoln 891 Canby $297,526 402 Hendricks 1,080,899 403 Ivanhoe 1,472,233 404 Lake Benton 1,285,274 414 Minneota 140,335 2902 R.T.R. 2,216,110 Total 6,492,377 Lyon 2167 Lakeview $3,337,113 415 Lynd 1,374,093 413 Marshall 18,721,485 635 Milroy 52,385 414 Minneota 3,515,724 2902 R.T.R. 1,626,283 2904 Tracy Area 3,857,752 Total 32,484,835 McLeod 2159 Buffalo Lake-Hector $863,774 2365 G.F.W. 536,898 2859 Glencoe-Silver Lake 12,394,735 2687 Howard Lake-Waverly-Winsted 1,928,615
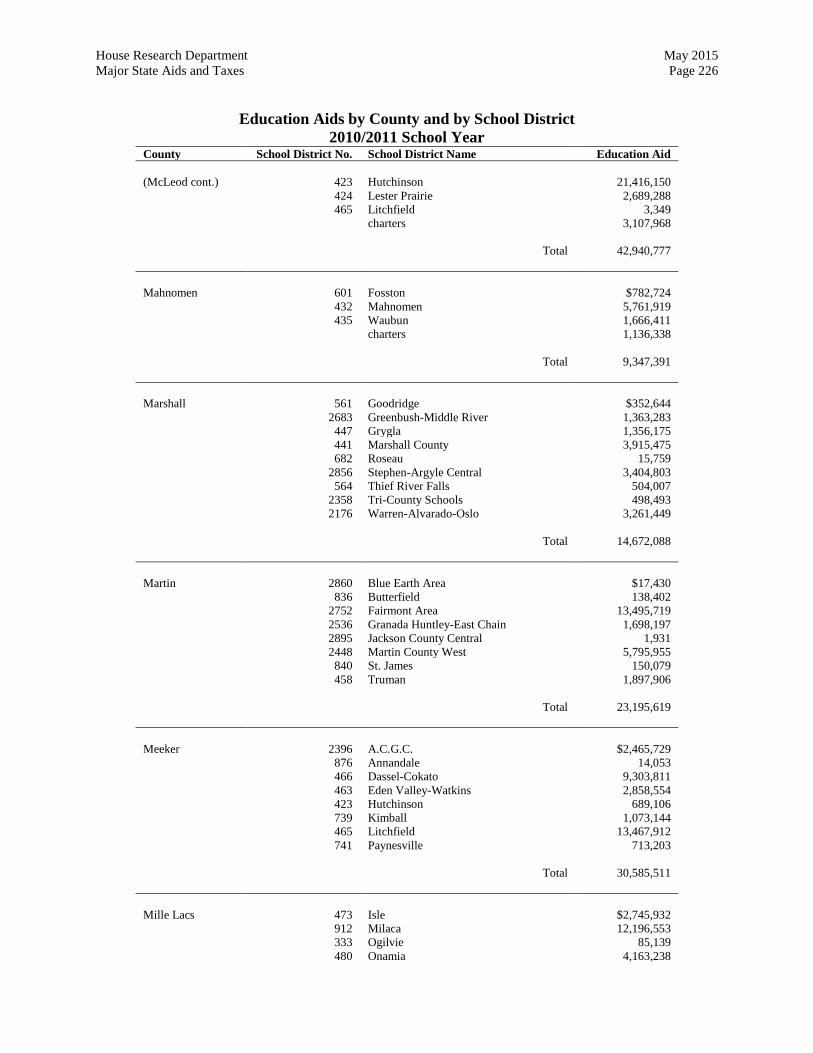
House Research Department May 2015 Major State Aids and Taxes Page 226
Education Aids by County and by School District 2010/2011 School Year
County School District No. School District Name Education Aid (McLeod cont.) 423 Hutchinson 21,416,150 424 Lester Prairie 2,689,288 465 Litchfield 3,349 charters 3,107,968 Total 42,940,777 Mahnomen 601 Fosston $782,724 432 Mahnomen 5,761,919 435 Waubun 1,666,411 charters 1,136,338 Total 9,347,391 Marshall 561 Goodridge $352,644 2683 Greenbush-Middle River 1,363,283 447 Grygla 1,356,175 441 Marshall County 3,915,475 682 Roseau 15,759 2856 Stephen-Argyle Central 3,404,803 564 Thief River Falls 504,007 2358 Tri-County Schools 498,493 2176 Warren-Alvarado-Oslo 3,261,449 Total 14,672,088 Martin 2860 Blue Earth Area $17,430 836 Butterfield 138,402 2752 Fairmont Area 13,495,719 2536 Granada Huntley-East Chain 1,698,197 2895 Jackson County Central 1,931 2448 Martin County West 5,795,955 840 St. James 150,079 458 Truman 1,897,906 Total 23,195,619 Meeker 2396 A.C.G.C. $2,465,729 876 Annandale 14,053 466 Dassel-Cokato 9,303,811 463 Eden Valley-Watkins 2,858,554 423 Hutchinson 689,106 739 Kimball 1,073,144 465 Litchfield 13,467,912 741 Paynesville 713,203 Total 30,585,511 Mille Lacs 473 Isle $2,745,932 912 Milaca 12,196,553 333 Ogilvie 85,139 480 Onamia 4,163,238

House Research Department May 2015 Major State Aids and Taxes Page 227
Education Aids by County and by School District 2010/2011 School Year
County School District No. School District Name Education Aid (Mille Lacs cont.) 477 Princeton 8,224,674 Total 27,415,536 Morrison 181 Brainerd $4,849 51 Foley 653,570 738 Holdingford 175,780 482 Little Falls 19,509,461 2753 Long Prairie-Grey Eagle 52,386 740 Melrose 1,938 912 Milaca 510,811 480 Onamia 1,175,471 484 Pierz 8,809,985 116 Pillager 945,022 485 Royalton 4,859,896 2170 Staples-Motley 3,297,056 486 Swanville 1,154,913 487 Upsala 3,183,310 Total 44,334,448 Mower 492 Austin $38,303,044 756 Blooming Prairie 733,901 495 Grand Meadow 2,912,877 203 Hayfield 2,181,985 2137 Kingsland 159,428 499 Leroy 1,662,418 497 Lyle 1,917,359 500 Southland 4,530,609 534 Stewartville 1,628,505 Total 54,030,127 Murray 581 Edgerton $146,438 505 Fulda 2,564,159 2169 Murray County Central 6,268,828 2689 Pipestone Area 29,491 2902 R.T.R. 146,792 2904 Tracy Area 2,254,950 2898 Westbrook-Walnut Grove 626,882 Total 12,037,541 Nicollet 2365 G.F.W. $486,939 2397 Le Sueur-Henderson 154,294 77 Mankato 15,270,110 88 New Ulm 2,781,917 507 Nicollet 2,632,193 2310 Sibley East 302,432 508 St. Peter 11,097,577 Total 32,725,462
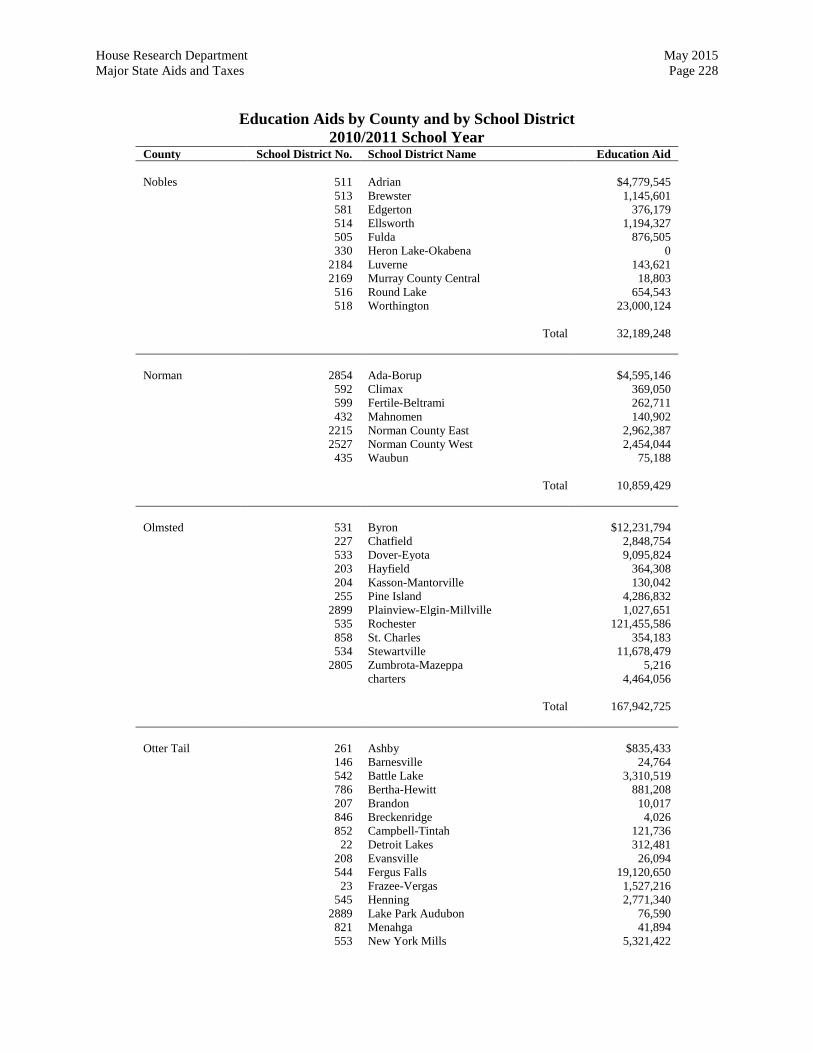
House Research Department May 2015 Major State Aids and Taxes Page 228
Education Aids by County and by School District 2010/2011 School Year
County School District No. School District Name Education Aid Nobles 511 Adrian $4,779,545 513 Brewster 1,145,601 581 Edgerton 376,179 514 Ellsworth 1,194,327 505 Fulda 876,505 330 Heron Lake-Okabena 0 2184 Luverne 143,621 2169 Murray County Central 18,803 516 Round Lake 654,543 518 Worthington 23,000,124 Total 32,189,248 Norman 2854 Ada-Borup $4,595,146 592 Climax 369,050 599 Fertile-Beltrami 262,711 432 Mahnomen 140,902 2215 Norman County East 2,962,387 2527 Norman County West 2,454,044 435 Waubun 75,188 Total 10,859,429 Olmsted 531 Byron $12,231,794 227 Chatfield 2,848,754 533 Dover-Eyota 9,095,824 203 Hayfield 364,308 204 Kasson-Mantorville 130,042 255 Pine Island 4,286,832 2899 Plainview-Elgin-Millville 1,027,651 535 Rochester 121,455,586 858 St. Charles 354,183 534 Stewartville 11,678,479 2805 Zumbrota-Mazeppa 5,216 charters 4,464,056 Total 167,942,725 Otter Tail 261 Ashby $835,433 146 Barnesville 24,764 542 Battle Lake 3,310,519 786 Bertha-Hewitt 881,208 207 Brandon 10,017 846 Breckenridge 4,026 852 Campbell-Tintah 121,736 22 Detroit Lakes 312,481 208 Evansville 26,094 544 Fergus Falls 19,120,650 23 Frazee-Vergas 1,527,216 545 Henning 2,771,340 2889 Lake Park Audubon 76,590 821 Menahga 41,894 553 New York Mills 5,321,422
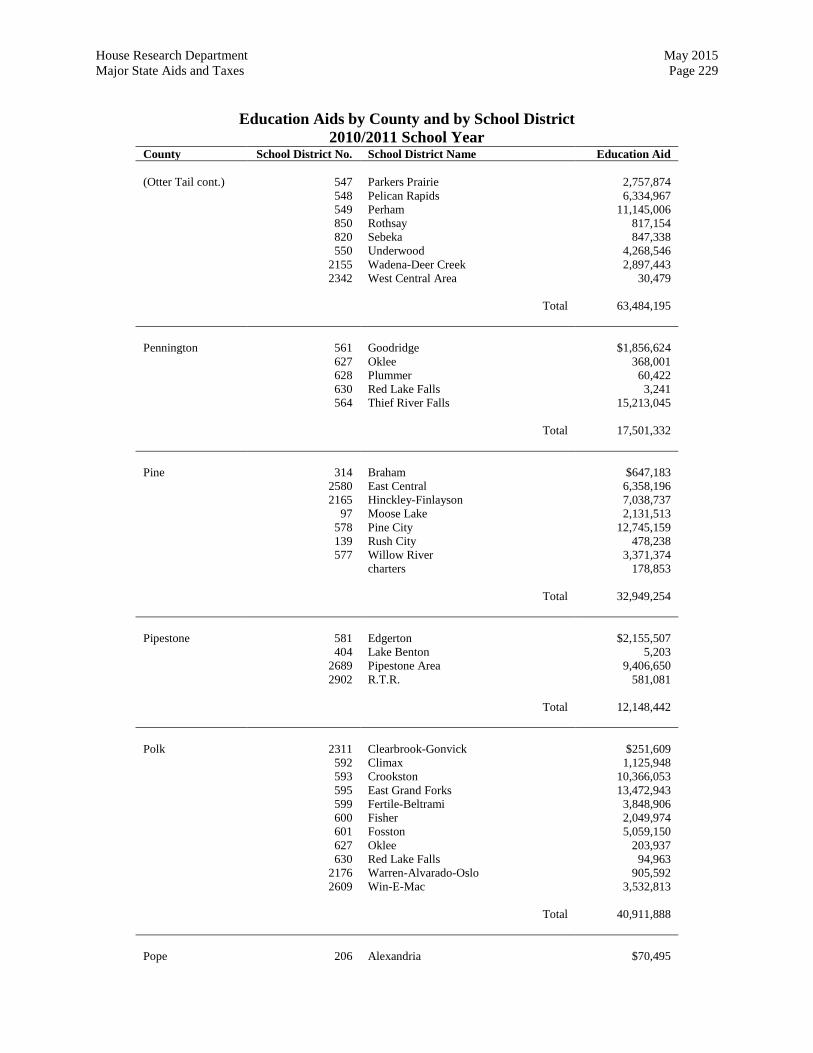
House Research Department May 2015 Major State Aids and Taxes Page 229
Education Aids by County and by School District 2010/2011 School Year
County School District No. School District Name Education Aid (Otter Tail cont.) 547 Parkers Prairie 2,757,874 548 Pelican Rapids 6,334,967 549 Perham 11,145,006 850 Rothsay 817,154 820 Sebeka 847,338 550 Underwood 4,268,546 2155 Wadena-Deer Creek 2,897,443 2342 West Central Area 30,479 Total 63,484,195 Pennington 561 Goodridge $1,856,624 627 Oklee 368,001 628 Plummer 60,422 630 Red Lake Falls 3,241 564 Thief River Falls 15,213,045 Total 17,501,332 Pine 314 Braham $647,183 2580 East Central 6,358,196 2165 Hinckley-Finlayson 7,038,737 97 Moose Lake 2,131,513 578 Pine City 12,745,159 139 Rush City 478,238 577 Willow River 3,371,374 charters 178,853 Total 32,949,254 Pipestone 581 Edgerton $2,155,507 404 Lake Benton 5,203 2689 Pipestone Area 9,406,650 2902 R.T.R. 581,081 Total 12,148,442 Polk 2311 Clearbrook-Gonvick $251,609 592 Climax 1,125,948 593 Crookston 10,366,053 595 East Grand Forks 13,472,943 599 Fertile-Beltrami 3,848,906 600 Fisher 2,049,974 601 Fosston 5,059,150 627 Oklee 203,937 630 Red Lake Falls 94,963 2176 Warren-Alvarado-Oslo 905,592 2609 Win-E-Mac 3,532,813 Total 40,911,888 Pope 206 Alexandria $70,495
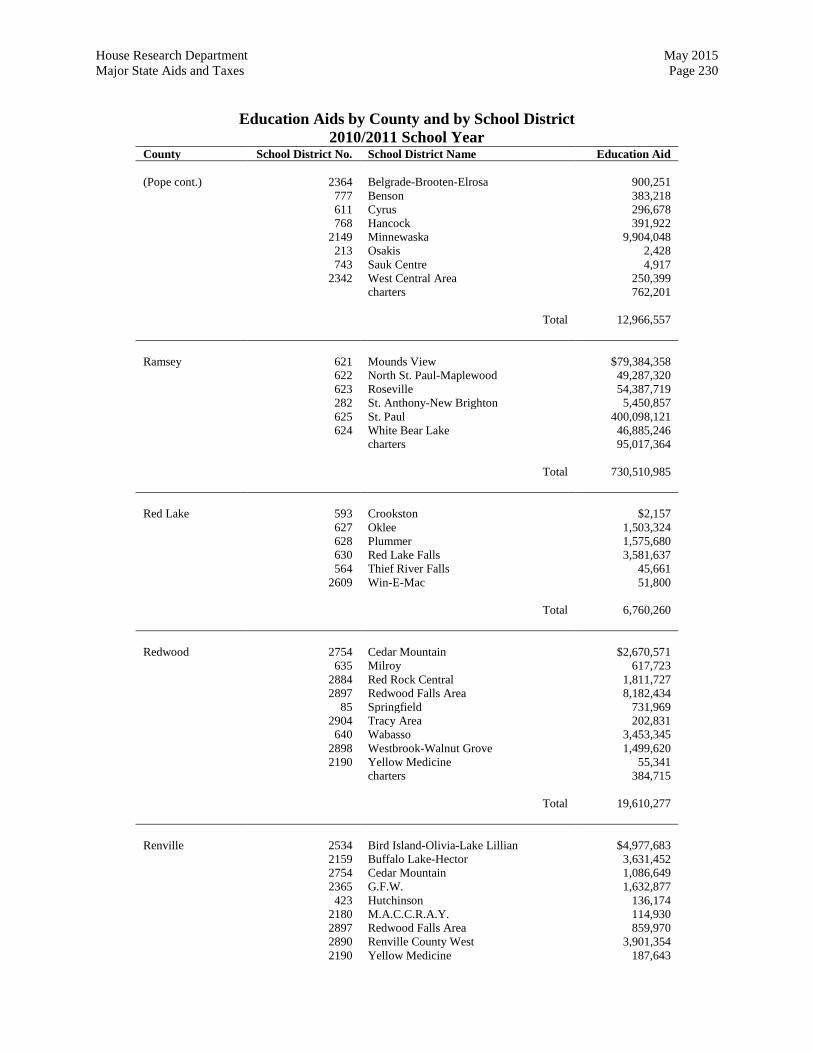
House Research Department May 2015 Major State Aids and Taxes Page 230
Education Aids by County and by School District 2010/2011 School Year
County School District No. School District Name Education Aid (Pope cont.) 2364 Belgrade-Brooten-Elrosa 900,251 777 Benson 383,218 611 Cyrus 296,678 768 Hancock 391,922 2149 Minnewaska 9,904,048 213 Osakis 2,428 743 Sauk Centre 4,917 2342 West Central Area 250,399 charters 762,201 Total 12,966,557 Ramsey 621 Mounds View $79,384,358 622 North St. Paul-Maplewood 49,287,320 623 Roseville 54,387,719 282 St. Anthony-New Brighton 5,450,857 625 St. Paul 400,098,121 624 White Bear Lake 46,885,246 charters 95,017,364 Total 730,510,985 Red Lake 593 Crookston $2,157 627 Oklee 1,503,324 628 Plummer 1,575,680 630 Red Lake Falls 3,581,637 564 Thief River Falls 45,661 2609 Win-E-Mac 51,800 Total 6,760,260 Redwood 2754 Cedar Mountain $2,670,571 635 Milroy 617,723 2884 Red Rock Central 1,811,727 2897 Redwood Falls Area 8,182,434 85 Springfield 731,969 2904 Tracy Area 202,831 640 Wabasso 3,453,345 2898 Westbrook-Walnut Grove 1,499,620 2190 Yellow Medicine 55,341 charters 384,715 Total 19,610,277 Renville 2534 Bird Island-Olivia-Lake Lillian $4,977,683 2159 Buffalo Lake-Hector 3,631,452 2754 Cedar Mountain 1,086,649 2365 G.F.W. 1,632,877 423 Hutchinson 136,174 2180 M.A.C.C.R.A.Y. 114,930 2897 Redwood Falls Area 859,970 2890 Renville County West 3,901,354 2190 Yellow Medicine 187,643

House Research Department May 2015 Major State Aids and Taxes Page 231
Education Aids by County and by School District 2010/2011 School Year
County School District No. School District Name Education Aid (Renville cont.) Total 16,528,733 Rice 656 Faribault $32,985,345 2172 Kenyon-Wanamingo 223,216 763 Medford 1,079,770 394 Montgomery-Lonsdale 3,540,461 721 New Prague Area 3,208,320 659 Northfield 24,207,769 829 Waseca 29,996 2143 Waterville-Elysian-Morristown 1,780,471 charters 5,938,158 Total 72,993,508 Rock 581 Edgerton $176,289 514 Ellsworth 235,192 671 Hills-Beaver Creek 2,905,528 2184 Luverne 9,318,234 2689 Pipestone Area 632,663 Total 13,267,905 Roseau 676 Badger $1,940,754 2683 Greenbush-Middle River 2,990,934 447 Grygla 199,202 682 Roseau 10,204,512 2358 Tri-County 61,401 690 Warroad 8,176,273 Total 23,573,076 St. Louis 695 Chisholm $5,903,566 94 Cloquet 1,229,489 709 Duluth 76,620,500 696 Ely 4,102,796 2154 Eveleth-Gilbert 8,655,685 698 Floodwood 2,980,175 700 Hermantown 14,835,110 701 Hibbing 18,689,665 381 Lake Superior 2,289,569 2711 Mesabi East 6,718,847 712 Mountain Iron-Buhl 5,043,043 707 Nett Lake 1,421,095 704 Proctor 12,812,536 2142 St. Louis County 18,591,121 706 Virginia 12,823,844 charters 17,985,663 Total 210,702,704 Scott 716 Belle Plaine $9,232,808 271 Bloomington 0
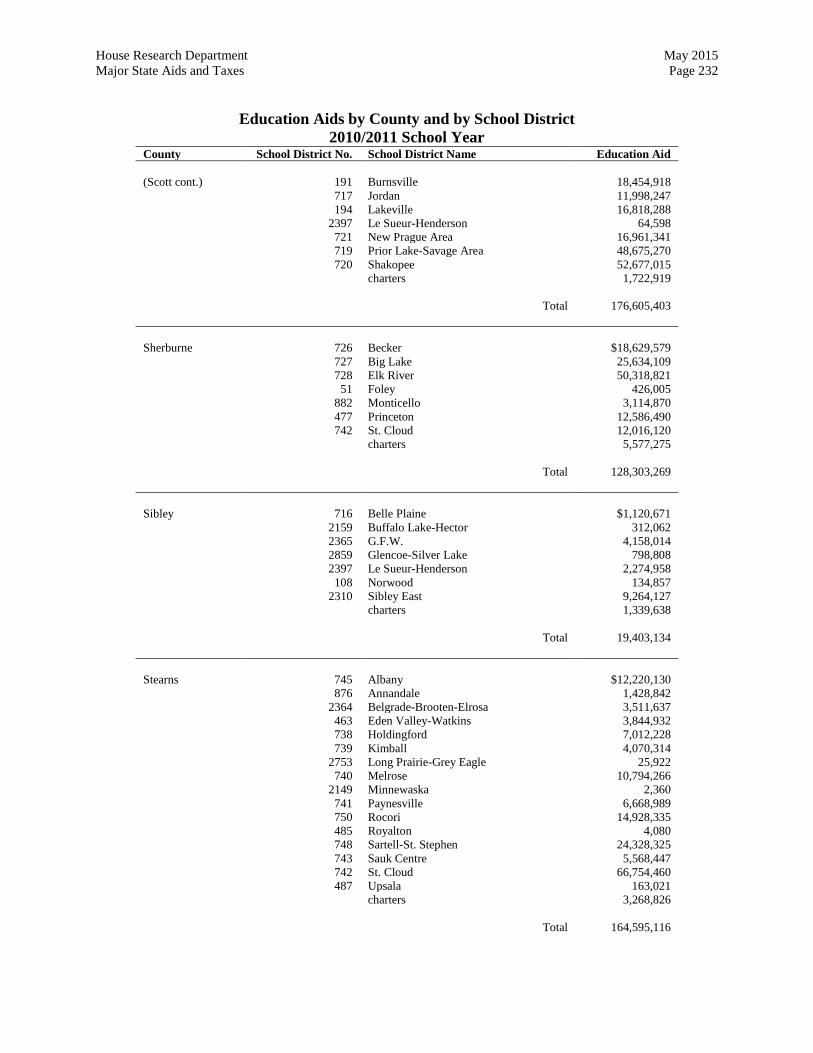
House Research Department May 2015 Major State Aids and Taxes Page 232
Education Aids by County and by School District 2010/2011 School Year
County School District No. School District Name Education Aid (Scott cont.) 191 Burnsville 18,454,918 717 Jordan 11,998,247 194 Lakeville 16,818,288 2397 Le Sueur-Henderson 64,598 721 New Prague Area 16,961,341 719 Prior Lake-Savage Area 48,675,270 720 Shakopee 52,677,015 charters 1,722,919 Total 176,605,403 Sherburne 726 Becker $18,629,579 727 Big Lake 25,634,109 728 Elk River 50,318,821 51 Foley 426,005 882 Monticello 3,114,870 477 Princeton 12,586,490 742 St. Cloud 12,016,120 charters 5,577,275 Total 128,303,269 Sibley 716 Belle Plaine $1,120,671 2159 Buffalo Lake-Hector 312,062 2365 G.F.W. 4,158,014 2859 Glencoe-Silver Lake 798,808 2397 Le Sueur-Henderson 2,274,958 108 Norwood 134,857 2310 Sibley East 9,264,127 charters 1,339,638 Total 19,403,134 Stearns 745 Albany $12,220,130 876 Annandale 1,428,842 2364 Belgrade-Brooten-Elrosa 3,511,637 463 Eden Valley-Watkins 3,844,932 738 Holdingford 7,012,228 739 Kimball 4,070,314 2753 Long Prairie-Grey Eagle 25,922 740 Melrose 10,794,266 2149 Minnewaska 2,360 741 Paynesville 6,668,989 750 Rocori 14,928,335 485 Royalton 4,080 748 Sartell-St. Stephen 24,328,325 743 Sauk Centre 5,568,447 742 St. Cloud 66,754,460 487 Upsala 163,021 charters 3,268,826 Total 164,595,116

House Research Department May 2015 Major State Aids and Taxes Page 233
Education Aids by County and by School District 2010/2011 School Year
County School District No. School District Name Education Aid Steele 756 Blooming Prairie $3,291,656 2172 Kenyon-Wanamingo 25,431 763 Medford 4,459,547 2168 N.R.H.E.G. 2,385,937 761 Owatonna 37,938,311 2125 Triton 42,312 829 Waseca 15,795 Total 48,158,990 Stevens 771 Chokio-Alberta $1,222,277 2888 Clinton-Graceville-Beardsley 0 611 Cyrus 133,687 768 Hancock 1,625,493 264 Herman-Norcross 85,934 2853 Lac Qui Parle Valley 1,715 769 Morris 7,565,380 2342 West Central Area 35,541 Total 10,670,027 Swift 777 Benson $7,243,387 768 Hancock 54,057 775 Kerkhoven-Murdock 2,930,832 2853 Lac Qui Parle Valley 2,396,769 769 Morris 5,097 Total 12,630,142 Todd 786 Bertha-Hewitt $3,067,463 787 Browerville 4,278,287 2759 Eagle Valley 2,526,148 482 Little Falls 7,857 2753 Long Prairie-Grey Eagle 8,901,616 740 Melrose 518,455 213 Osakis 2,866,112 743 Sauk Centre 2,090,345 2170 Staples-Motley 4,404,208 486 Swanville 1,679,057 487 Upsala 29,112 818 Verndale 487,369 2155 Wadena-Deer Creek 15,765 Total 30,871,794 Traverse 801 Browns Valley $1,166,759 852 Campbell-Tintah 267,914 771 Chokio-Alberta 2,728 2888 Clinton-Graceville-Beardsley 466,367 264 Herman-Norcross 49,986 803 Wheaton Area 3,587,730 Total 5,541,484
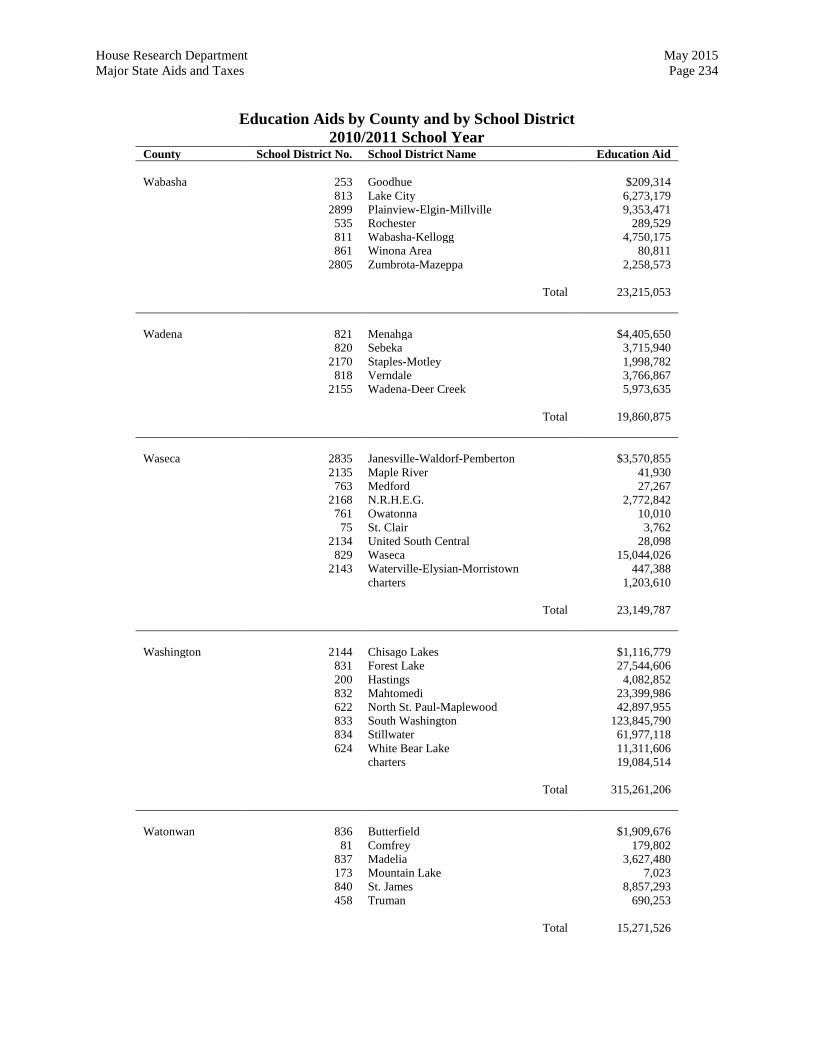
House Research Department May 2015 Major State Aids and Taxes Page 234
Education Aids by County and by School District 2010/2011 School Year
County School District No. School District Name Education Aid Wabasha 253 Goodhue $209,314 813 Lake City 6,273,179 2899 Plainview-Elgin-Millville 9,353,471 535 Rochester 289,529 811 Wabasha-Kellogg 4,750,175 861 Winona Area 80,811 2805 Zumbrota-Mazeppa 2,258,573 Total 23,215,053 Wadena 821 Menahga $4,405,650 820 Sebeka 3,715,940 2170 Staples-Motley 1,998,782 818 Verndale 3,766,867 2155 Wadena-Deer Creek 5,973,635 Total 19,860,875 Waseca 2835 Janesville-Waldorf-Pemberton $3,570,855 2135 Maple River 41,930 763 Medford 27,267 2168 N.R.H.E.G. 2,772,842 761 Owatonna 10,010 75 St. Clair 3,762 2134 United South Central 28,098 829 Waseca 15,044,026 2143 Waterville-Elysian-Morristown 447,388 charters 1,203,610 Total 23,149,787 Washington 2144 Chisago Lakes $1,116,779 831 Forest Lake 27,544,606 200 Hastings 4,082,852 832 Mahtomedi 23,399,986 622 North St. Paul-Maplewood 42,897,955 833 South Washington 123,845,790 834 Stillwater 61,977,118 624 White Bear Lake 11,311,606 charters 19,084,514 Total 315,261,206 Watonwan 836 Butterfield $1,909,676 81 Comfrey 179,802 837 Madelia 3,627,480 173 Mountain Lake 7,023 840 St. James 8,857,293 458 Truman 690,253 Total 15,271,526
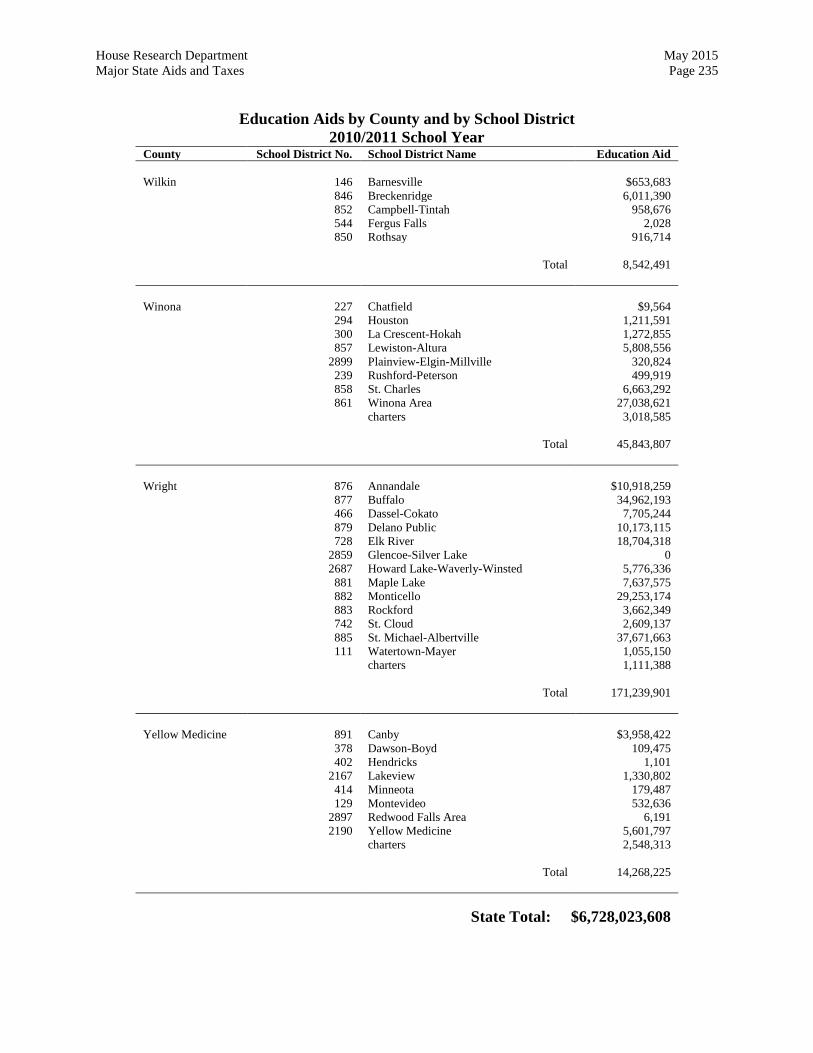
House Research Department May 2015 Major State Aids and Taxes Page 235
Education Aids by County and by School District 2010/2011 School Year
County School District No. School District Name Education Aid Wilkin 146 Barnesville $653,683 846 Breckenridge 6,011,390 852 Campbell-Tintah 958,676 544 Fergus Falls 2,028 850 Rothsay 916,714 Total 8,542,491 Winona 227 Chatfield $9,564 294 Houston 1,211,591 300 La Crescent-Hokah 1,272,855 857 Lewiston-Altura 5,808,556 2899 Plainview-Elgin-Millville 320,824 239 Rushford-Peterson 499,919 858 St. Charles 6,663,292 861 Winona Area 27,038,621 charters 3,018,585 Total 45,843,807 Wright 876 Annandale $10,918,259 877 Buffalo 34,962,193 466 Dassel-Cokato 7,705,244 879 Delano Public 10,173,115 728 Elk River 18,704,318 2859 Glencoe-Silver Lake 0 2687 Howard Lake-Waverly-Winsted 5,776,336 881 Maple Lake 7,637,575 882 Monticello 29,253,174 883 Rockford 3,662,349 742 St. Cloud 2,609,137 885 St. Michael-Albertville 37,671,663 111 Watertown-Mayer 1,055,150 charters 1,111,388 Total 171,239,901 Yellow Medicine 891 Canby $3,958,422 378 Dawson-Boyd 109,475 402 Hendricks 1,101 2167 Lakeview 1,330,802 414 Minneota 179,487 129 Montevideo 532,636 2897 Redwood Falls Area 6,191 2190 Yellow Medicine 5,601,797 charters 2,548,313 Total 14,268,225 State Total: $6,728,023,608
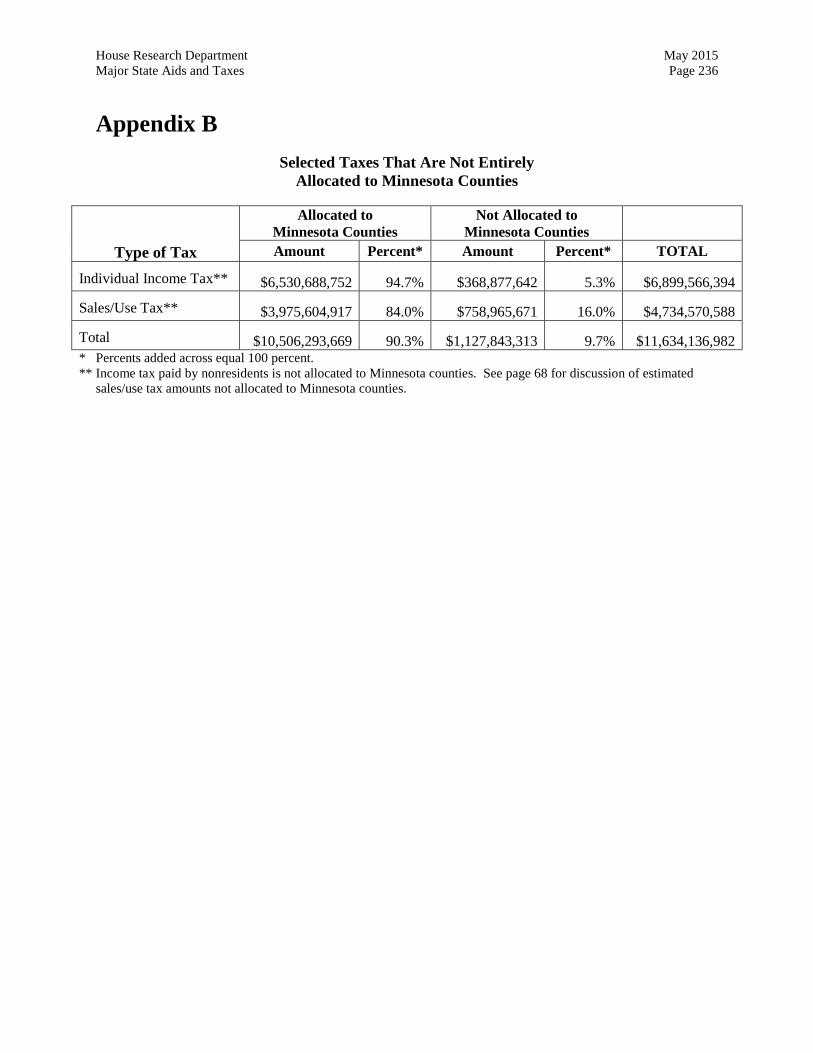
House Research Department May 2015 Major State Aids and Taxes Page 236
Appendix B Selected Taxes That Are Not Entirely
Allocated to Minnesota Counties
Type of Tax
Allocated to Minnesota Counties
Not Allocated to Minnesota Counties
Amount Percent* Amount Percent* TOTAL
Individual Income Tax** $6,530,688,752 94.7% $368,877,642 5.3% $6,899,566,394
Sales/Use Tax** $3,975,604,917 84.0% $758,965,671 16.0% $4,734,570,588
Total $10,506,293,669 90.3% $1,127,843,313 9.7% $11,634,136,982 * Percents added across equal 100 percent. ** Income tax paid by nonresidents is not allocated to Minnesota counties. See page 68 for discussion of estimated sales/use tax amounts not allocated to Minnesota counties.
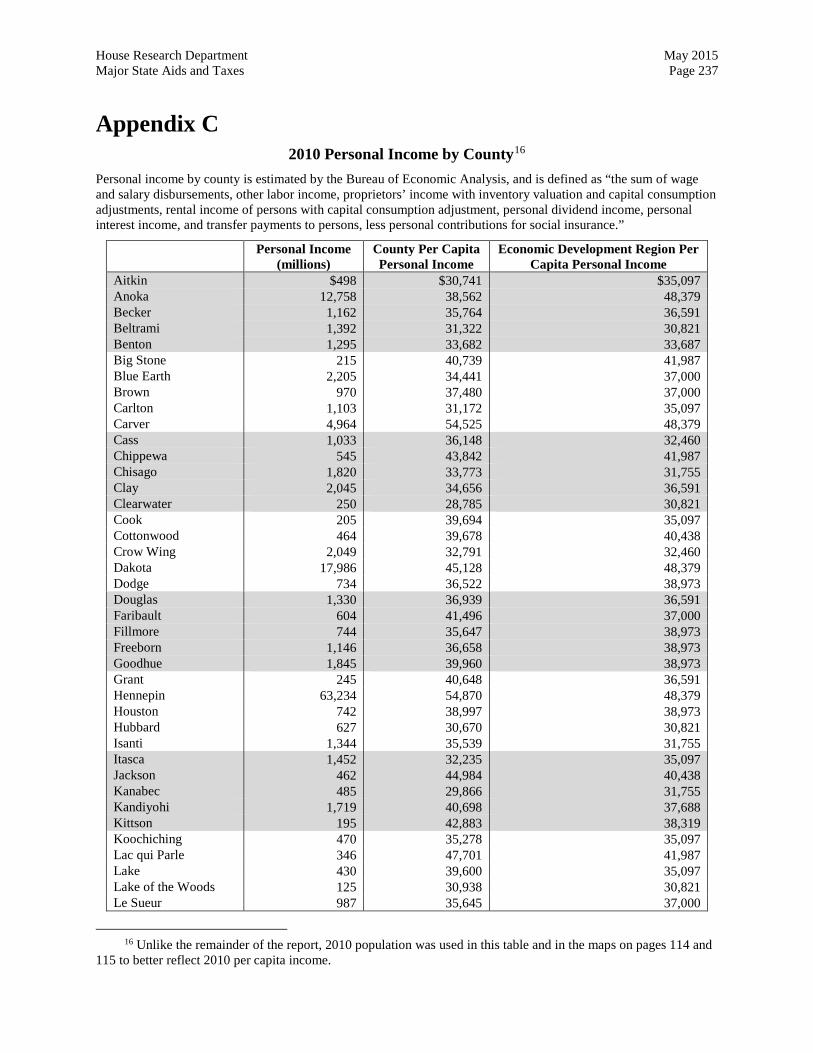
House Research Department May 2015 Major State Aids and Taxes Page 237
Appendix C 2010 Personal Income by County16
Personal income by county is estimated by the Bureau of Economic Analysis, and is defined as “the sum of wage and salary disbursements, other labor income, proprietors’ income with inventory valuation and capital consumption adjustments, rental income of persons with capital consumption adjustment, personal dividend income, personal interest income, and transfer payments to persons, less personal contributions for social insurance.”
Personal Income (millions)
County Per Capita Personal Income
Economic Development Region Per Capita Personal Income
Aitkin $498 $30,741 $35,097 Anoka 12,758 38,562 48,379 Becker 1,162 35,764 36,591 Beltrami 1,392 31,322 30,821 Benton 1,295 33,682 33,687 Big Stone 215 40,739 41,987 Blue Earth 2,205 34,441 37,000 Brown 970 37,480 37,000 Carlton 1,103 31,172 35,097 Carver 4,964 54,525 48,379 Cass 1,033 36,148 32,460 Chippewa 545 43,842 41,987 Chisago 1,820 33,773 31,755 Clay 2,045 34,656 36,591 Clearwater 250 28,785 30,821 Cook 205 39,694 35,097 Cottonwood 464 39,678 40,438 Crow Wing 2,049 32,791 32,460 Dakota 17,986 45,128 48,379 Dodge 734 36,522 38,973 Douglas 1,330 36,939 36,591 Faribault 604 41,496 37,000 Fillmore 744 35,647 38,973 Freeborn 1,146 36,658 38,973 Goodhue 1,845 39,960 38,973 Grant 245 40,648 36,591 Hennepin 63,234 54,870 48,379 Houston 742 38,997 38,973 Hubbard 627 30,670 30,821 Isanti 1,344 35,539 31,755 Itasca 1,452 32,235 35,097 Jackson 462 44,984 40,438 Kanabec 485 29,866 31,755 Kandiyohi 1,719 40,698 37,688 Kittson 195 42,883 38,319 Koochiching 470 35,278 35,097 Lac qui Parle 346 47,701 41,987 Lake 430 39,600 35,097 Lake of the Woods 125 30,938 30,821 Le Sueur 987 35,645 37,000
16 Unlike the remainder of the report, 2010 population was used in this table and in the maps on pages 114 and 115 to better reflect 2010 per capita income.
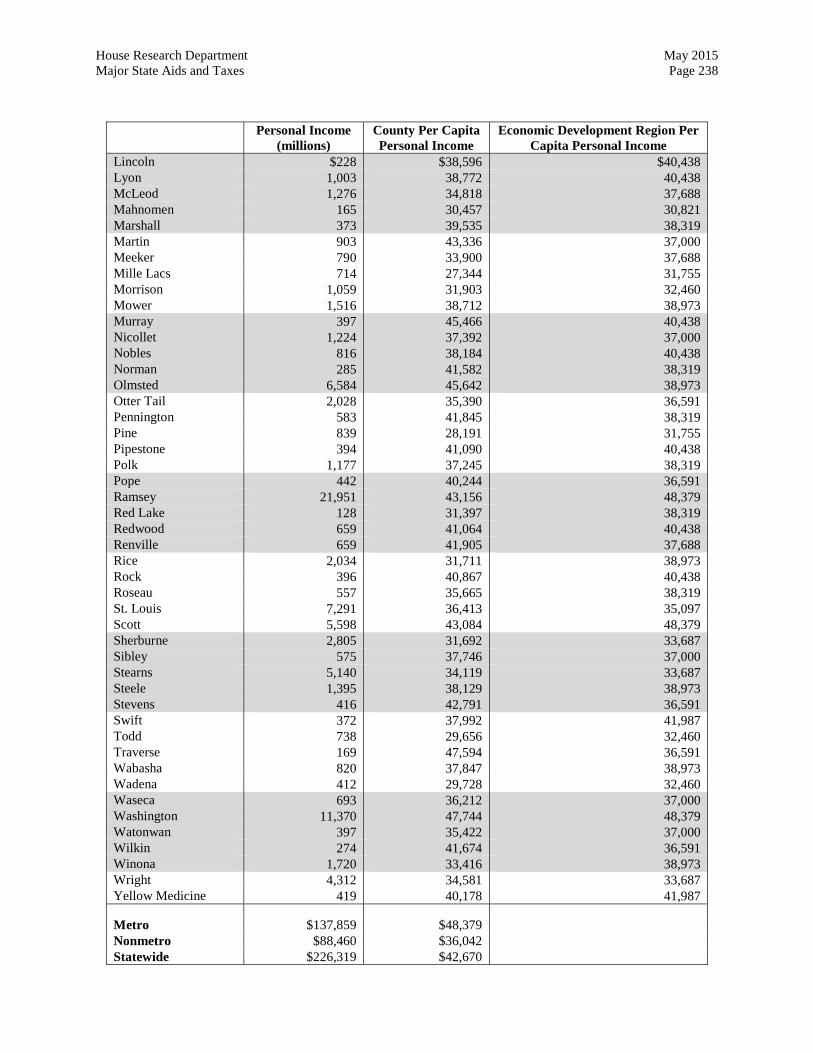
House Research Department May 2015 Major State Aids and Taxes Page 238
Personal Income (millions)
County Per Capita Personal Income
Economic Development Region Per Capita Personal Income
Lincoln $228 $38,596 $40,438 Lyon 1,003 38,772 40,438 McLeod 1,276 34,818 37,688 Mahnomen 165 30,457 30,821 Marshall 373 39,535 38,319 Martin 903 43,336 37,000 Meeker 790 33,900 37,688 Mille Lacs 714 27,344 31,755 Morrison 1,059 31,903 32,460 Mower 1,516 38,712 38,973 Murray 397 45,466 40,438 Nicollet 1,224 37,392 37,000 Nobles 816 38,184 40,438 Norman 285 41,582 38,319 Olmsted 6,584 45,642 38,973 Otter Tail 2,028 35,390 36,591 Pennington 583 41,845 38,319 Pine 839 28,191 31,755 Pipestone 394 41,090 40,438 Polk 1,177 37,245 38,319 Pope 442 40,244 36,591 Ramsey 21,951 43,156 48,379 Red Lake 128 31,397 38,319 Redwood 659 41,064 40,438 Renville 659 41,905 37,688 Rice 2,034 31,711 38,973 Rock 396 40,867 40,438 Roseau 557 35,665 38,319 St. Louis 7,291 36,413 35,097 Scott 5,598 43,084 48,379 Sherburne 2,805 31,692 33,687 Sibley 575 37,746 37,000 Stearns 5,140 34,119 33,687 Steele 1,395 38,129 38,973 Stevens 416 42,791 36,591 Swift 372 37,992 41,987 Todd 738 29,656 32,460 Traverse 169 47,594 36,591 Wabasha 820 37,847 38,973 Wadena 412 29,728 32,460 Waseca 693 36,212 37,000 Washington 11,370 47,744 48,379 Watonwan 397 35,422 37,000 Wilkin 274 41,674 36,591 Winona 1,720 33,416 38,973 Wright 4,312 34,581 33,687 Yellow Medicine 419 40,178 41,987 Metro $137,859 $48,379 Nonmetro $88,460 $36,042 Statewide $226,319 $42,670
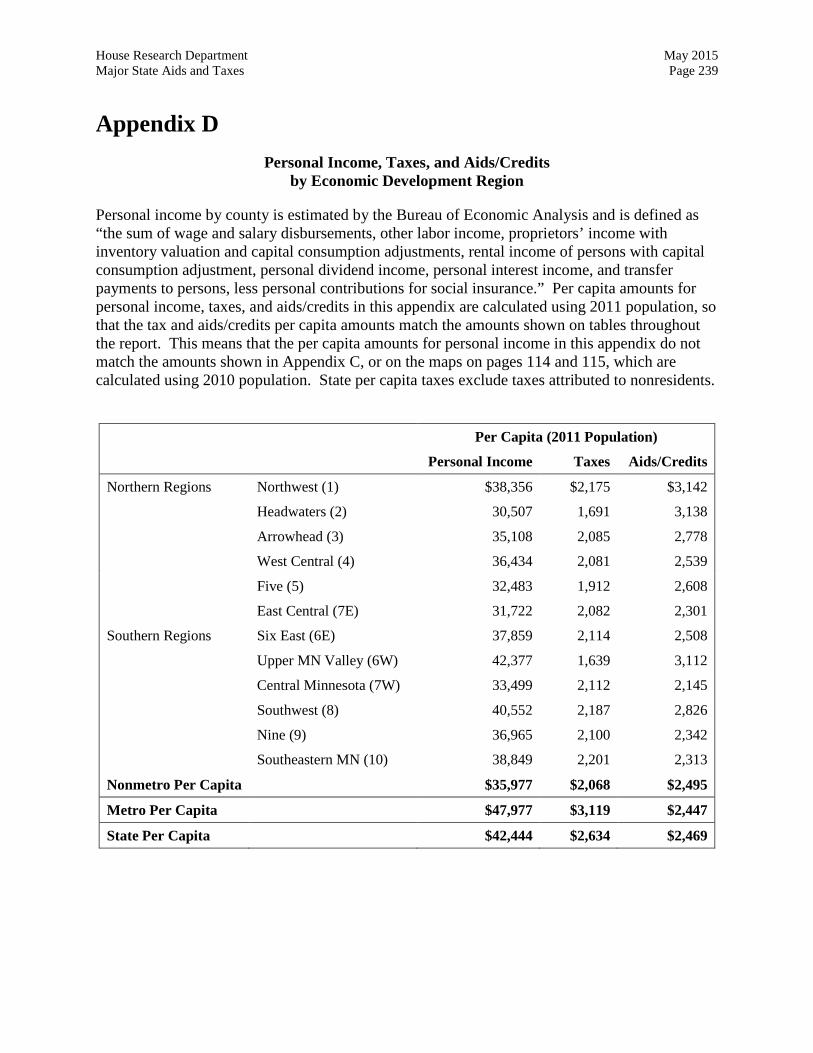
House Research Department May 2015 Major State Aids and Taxes Page 239
Appendix D Personal Income, Taxes, and Aids/Credits
by Economic Development Region
Personal income by county is estimated by the Bureau of Economic Analysis and is defined as “the sum of wage and salary disbursements, other labor income, proprietors’ income with inventory valuation and capital consumption adjustments, rental income of persons with capital consumption adjustment, personal dividend income, personal interest income, and transfer payments to persons, less personal contributions for social insurance.” Per capita amounts for personal income, taxes, and aids/credits in this appendix are calculated using 2011 population, so that the tax and aids/credits per capita amounts match the amounts shown on tables throughout the report. This means that the per capita amounts for personal income in this appendix do not match the amounts shown in Appendix C, or on the maps on pages 114 and 115, which are calculated using 2010 population. State per capita taxes exclude taxes attributed to nonresidents.
Per Capita (2011 Population)
Personal Income Taxes Aids/Credits
Northern Regions Northwest (1) $38,356 $2,175 $3,142
Headwaters (2) 30,507 1,691 3,138
Arrowhead (3) 35,108 2,085 2,778
West Central (4) 36,434 2,081 2,539
Five (5) 32,483 1,912 2,608
East Central (7E) 31,722 2,082 2,301
Southern Regions Six East (6E) 37,859 2,114 2,508
Upper MN Valley (6W) 42,377 1,639 3,112
Central Minnesota (7W) 33,499 2,112 2,145
Southwest (8) 40,552 2,187 2,826
Nine (9) 36,965 2,100 2,342
Southeastern MN (10) 38,849 2,201 2,313
Nonmetro Per Capita $35,977 $2,068 $2,495
Metro Per Capita $47,977 $3,119 $2,447
State Per Capita $42,444 $2,634 $2,469