a collaboration between ten national measurement...
TRANSCRIPT
NPL REPORT CMAM 36(a)
A Collaboration Between Ten
National Measurement Institutes
To Measure The Mass Of Two
One Kilogram Mass Standards
This Report Supersedes NPL Report CMAM 36 I Severn SEPTEMBER 2000

NPL Report CMAM 36(a)

NPL Report CMAM 36(a)
A Collaboration Between Ten National Measurement Institutes
To Measure The Mass of Two One Kilogram Mass Standards
I Severn Centre for Mechanical and Acoustical Metrology
National Physical Laboratory Queens Road, Teddington, TW11 0LW
United Kingdom
September 2000 ABSTRACT A comparison has been carried out in which ten Western European national metrology institutes have determined the mass difference between a pair of 1 kg mass standards and assigned mass values to each of the weights. The results obtained illustrate that the measurements of the participants agree to within their quoted uncertainties (for a coverage factor of k=2), so demonstrating the metrological equivalence of mass measurements using stainless steel 1 kg standards in each of these institutes.

NPL Report CMAM 36(a)
� Crown copyright 2000 Reproduced by permission of the controller of HMSO
ISSN 1369 - 6785
National Physical Laboratory Teddington, Middlesex, United Kingdom, TW11 0LW
No extracts from this report may be reproduced without the prior written consent of Managing Director, National Physical Laboratory; if consent is given the source must be acknowledged and may not be used out of context.
Approved on behalf of the Managing Director, NPL, by Dr G R Torr, Head of Centre
Centre for Mechanical and Acoustical Metrology.
NPL Report CMAM 36(a)
CONTENTS
1. INTRODUCTION 1
2. MEASUREMENTS 1 2.1 ARTEFACTS 1 2.2 CIRCULATION SCHEME 2 2.3 TRANSPORTATION 2
3. MEASUREMENTS 3 3.1 PILOT LABORATORY ACTIVITY 3 3.2 PARTICIPANT LABORATORY ACTIVITY 3
4. RESULTS OF MEASUREMENTS 4 4.1 PILOT LABORATORY 4
4.1.1 Comparison of Standards 4 4.1.2 Assignment of Mass Values 5
4.2 PARTICIPANT LABORATORY RESULTS 5 4.2.1 Assignment of Reference Values and Uncertainties 5 4.2.2Mass Difference Between The Transport Standards 6 4.2.3 Assignment of Mass Value to PTB C 10 4.2.4 Assignment of a Mass Value to INM 11 13 4.2.5 Combined Results 17
5. UNCERTAINTY ESTIMATES 20 5.1 MASS STANDARDS 20 5.2 TRANSPORT STANDARD VOLUME 20 5.3 PARTICIPANT STANDARD VOLUME 20 5.4 AIR DENSITY MEASUREMENT 20 5.5 ADDITIONAL WEIGHTS 20 5.6 MASS COMPARATOR 21
5.6.1 Sensitivity Error 21 5.6.2 Weight Exchanger Anomalies 21 5.6.3 Long Term Repeatability 21
5.7 SPREAD OF RESULTS 21 5.8 OTHER SOURCES 21
6. SUMMARY 22
7. PROPOSED FUTURE WORK 22
8. REFERENCES 22
9. ACKNOWLEDGEMENTS 23
APPENDIX 1: MEASUREMENT DATES 24 APPENDIX 2: TRANSPORTATION DETAILS 24 APPENDIX 3: AIR DENSITY DURING MEASUREMENTS 25


NPL Report CMAM 36(a)
1. INTRODUCTION
The third periodic verification of National Prototypes of the Kilogram took place at the International Bureau of Weight and Measures (BIPM) during the period 1988 To 1992 [1]. Each of the countries that possess National Prototypes of the Kilogram submitted their national standard to the BIPM for re-verification. The process of transferring a national mass scale from a platinum-iridium (Pt-Ir) standard, such as a National Prototype, to a stainless steel standard introduces a large source of uncertainty due to the difference in air buoyancy experienced by weights of differing densities [2],[3]. It was agreed that a comparison would be carried out between Western European national measurement institutes (NMIs), under the auspices of EUROMET, to establish metrological equivalence in the measurement of stainless steel 1 kg mass standards in these institutes. This comparison, EUROMET Project 215, involves the assignment of mass values to two 1 kg mass standards and the determination of the mass difference between them. The participants in the comparison are:- Belgium Service de la Métrologie (SMB) Denmark Danish Institute of Fundamental Metrology (DFM) Finland Centre for Metrology and Accreditation (MIKES) France Bureau National de Métrologie - Laboratoire National d’Essais (LNE) Germany Physikalisch-Technische Bundesanstalt (PTB) Italy Istituto de Metrologia “G Colonnetti” (IMGC) Norway Justervesenet (JV) Spain Centro Español de Metrologia (CEM) Sweden Sveriges Provnings (SP) United Kingdom National Physical Laboratory (NPL) The results obtained by each of these institutes, and their respective uncertainties are described here along with a summary of the equipment used in the measurements. The National Physical Laboratory acted as the pilot laboratory for this comparison, making regular measurements on the mass standards, both before and during the comparison, in order to monitor their stability. The analysis of the results has been carried out by the NPL and the IMGC.
2. MEASUREMENTS
2.1 ARTEFACTS
Four 1 kg mass standards were used during this comparison. Two of the weights, denoted as INM 10 and INM 11 throughout this report, were provided by the Bureau National de Métrologie - Institute National de Métrologie (BNM-INM) of France. These weights are cylindrical in shape, having a diameter equal to their height, and are manufactured from alacrite1. INM 10 has the number 10 etched on its vertical surface for the purpose of
1 Composition of alacrite: 55 % cobalt, 20 % chromium, 15 % tungsten, 10 % nickel
1

NPL Report CMAM 36(a)
identification while INM 11 is etched with a number 11. As may be seen from Table 2.1 these two weights have similar physical properties. The second pair of weights, denoted as PTB B and PTB C, was supplied by the PTB of Germany. These weights are integral knobbed weights of the shape recommended in the International Organization for Legal Metrology Recommendation 111 [4] and are manufactured from austenitic stainless steel2. These weights are stamped with the letters B and C respectively on their top surfaces. Once more these two weights have similar physical properties.
WEIGHT INM 10 INM 11 PTB B PTB C PROPERTY Density (kg m-3) 9 148.39
± 0.2 9 146.66 ± 0.2
8 037.44 ± 0.07
8 037.45 ± 0.07
Coefficient of cubic thermal expansion (10-6 °C-1)
39.3 ± 0.2 39.3 ± 0.2 45.7 ± 0.3 45.7 ± 0.3
Height of centre of gravity (mm)
26 26 35.6 35.6
Magnetic Susceptibility 0.001 27 0.001 27 0.003 0.004 Table 2.1: Physical Properties Of The Weights
All of the data shown in Table 2.1 have been supplied by the laboratory which owns the relevant weight. Weights PTB B and INM 10 were selected to be kept at NPL throughout the period of the comparison to act as monitoring standards. PTB C and INM 11 were circulated amongst the participants for measurements and are referred to as the transport standards.
2.2 CIRCULATION SCHEME
The transport standards were circulated around the participants in a series of four ‘petals’. Each petal consists of the pilot laboratory making measurements before and after two or three of the participant laboratories make measurements. A period of two months was assigned for each laboratory, including the pilot laboratory, to make its measurements. The dates of the measurements made by each laboratory are given in Appendix 1. It should be noted that the three laboratories in the penultimate petal of the comparison, PTB, IMGC and NPL, also took part in a world-wide ‘Key Comparison’ of 1 kg weights organised by the Consultative Committee for Mass (CCM). It was agreed that a better overlap between these two comparisons would be achieved if these three laboratories made their measurements sequentially. With this exception the measurement order was arranged so that the transportation distance between any two successive laboratories was minimised.
2.3 TRANSPORTATION
Each participant laboratory was charged with the delivery of the transport standards to the next
2 Composition of PTB weights: 19 - 20 % chromium, 24 - 25 % nickel, 4.5 % molybdenum, 1 - 1.5 % copper, 0.3 % silicon, 0.002 % carbon, remainder iron
2

NPL Report CMAM 36(a)
laboratory. This was done either by air or overland transport. When the standards were transported by air they were carried in the cabin as hand luggage. The storage cases were packed inside a thermally insulated carrying case during transportation. Appendix 2 gives details of the transportation dates and methods used to transport the weights between laboratories.
3. MEASUREMENTS
3.1 PILOT LABORATORY ACTIVITY
The pilot laboratory compared each of the transport standards with its matching monitoring standard over a fourteen month period prior to the start of the comparison. The mass value of each of the four weights was determined by comparison with NPL’s reference standards on receipt from its owner, immediately prior to the start of the circulation of the transport standards, and at the end of the comparison. The comparison scheme shown in Table 3.1 was used to compare all four of the weights at the start and end of the comparison and on each occasion that the transport standards were returned to the pilot laboratory. These comparisons were carried out on a Mettler HK1000MC comparator using its two weight comparison mode.
Weighing No
Weight on Station 1
Weight on Station 3
1 PTB B + 1 mg PTB C
2 PTB B PTB C
3 PTB C PTB B
4 PTB C INM 10
5 PTB C INM 11
6 PTB B INM 11
7 PTB B INM 10
8 INM 11 INM 10
9 INM 10 INM 11
10 INM 10 + 2 mg INM 11
Table 3.1: Pilot Laboratory Weighing Scheme The 1 mg and 2 mg weights used in the first and final comparison are intended to check the scale sensitivity of the comparator. Weighings 2 and 3, and also 8 and 9, check whether there is any systematic error introduced by changing the relative locations of the test weights on the weight exchanger.
3.2 PARTICIPANT LABORATORY ACTIVITY
Each of the participant laboratories was required to measure the mass difference between the
3

NPL Report CMAM 36(a)
transport standards and assign mass values to each of them. The assignment of the mass values was carried out using stainless steel reference standards that are traceable to the participant laboratory’s official copy of the Prototype of the Kilogram. The mass difference between the two transport standards was carried out by direct comparison of the two weights. Pre-printed sheets were provided for use by the participants to report their measurement results and record the following data:-
�� Traceability of reference standards used �� Physical properties of the reference standards used �� Details of balance used �� Traceability of all ancillary equipment (eg air density measurement apparatus) �� Ambient atmospheric conditions at the time of each measurement �� A detailed uncertainty budget
4. RESULTS OF MEASUREMENTS
4.1 PILOT LABORATORY
4.1.1 Comparison of Standards
The weighing scheme shown in Section 3.1 was used by the Pilot Laboratory to compare the weights on each occasion that it made measurements during the period of the comparison. The results of these measurements are shown in Table 4.1.
Weights Compared 11-10 11-B 11-C 10-B 10-C B-C Measurement Date Mass Difference (µg) January 1995 298 2819 3001 2519 2696 166 August 1995 295 2842 3003 2549 2715 164 January 1996 293 2844 3009 2548 2714 168 September 1996 280 2836 3010 2557 2734 173 June 1997 290 2848 3006 2562 2717 162 Spread 18 29 9 43 38 11 Table 4.1: Results of Comparisons of Standards Undertaken By The Pilot Laboratory The values in Table 4.1 represent direct comparisons of each pair of weights. When one of the stainless steel standards has been compared with one of the alacrite weights a 20 mg weight has been added to the stainless steel weight to compensate for the difference in air buoyancy effect. The results of the comparison of the two transport standards (11 and C) are good, with only a 9 �g variation in the measured mass difference over a thirty month period. The comparisons of the two stainless steel standards and the two alacrite standards also give reasonable results, with 11 �g and 18 �g variations in their respective mass differences. On initial examination the comparison of the two monitoring standards (10 and B) is disappointing over the same 30 month period. However, if the result from January 1995 is not considered then the range in the mass difference is only 14 �g. The most likely cause of this anomaly is that there was some form of contamination on PTB B when the two weights were
4
NPL Report CMAM 36(a)
compared.
4.1.2 Assignment of Mass Values
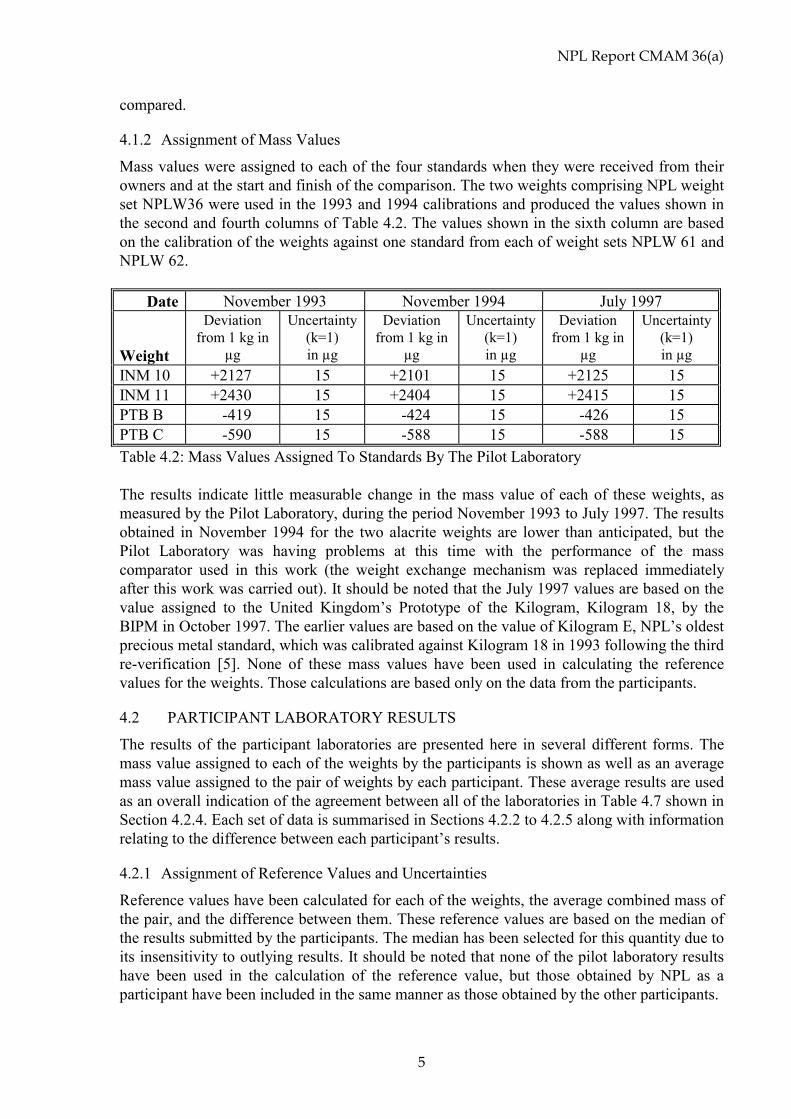
Mass values were assigned to each of the four standards when they were received from their owners and at the start and finish of the comparison. The two weights comprising NPL weight set NPLW36 were used in the 1993 and 1994 calibrations and produced the values shown in the second and fourth columns of Table 4.2. The values shown in the sixth column are based on the calibration of the weights against one standard from each of weight sets NPLW 61 and NPLW 62.
Date November 1993 November 1994 July 1997 Weight
Deviation from 1 kg in
µg
Uncertainty (k=1) in µg
Deviation from 1 kg in
µg
Uncertainty (k=1) in µg
Deviation from 1 kg in
µg
Uncertainty (k=1) in µg
INM 10 +2127 15 +2101 15 +2125 15 INM 11 +2430 15 +2404 15 +2415 15 PTB B -419 15 -424 15 -426 15 PTB C -590 15 -588 15 -588 15 Table 4.2: Mass Values Assigned To Standards By The Pilot Laboratory The results indicate little measurable change in the mass value of each of these weights, as measured by the Pilot Laboratory, during the period November 1993 to July 1997. The results obtained in November 1994 for the two alacrite weights are lower than anticipated, but the Pilot Laboratory was having problems at this time with the performance of the mass comparator used in this work (the weight exchange mechanism was replaced immediately after this work was carried out). It should be noted that the July 1997 values are based on the value assigned to the United Kingdom’s Prototype of the Kilogram, Kilogram 18, by the BIPM in October 1997. The earlier values are based on the value of Kilogram E, NPL’s oldest precious metal standard, which was calibrated against Kilogram 18 in 1993 following the third re-verification [5]. None of these mass values have been used in calculating the reference values for the weights. Those calculations are based only on the data from the participants.
4.2 PARTICIPANT LABORATORY RESULTS
The results of the participant laboratories are presented here in several different forms. The mass value assigned to each of the weights by the participants is shown as well as an average mass value assigned to the pair of weights by each participant. These average results are used as an overall indication of the agreement between all of the laboratories in Table 4.7 shown in Section 4.2.4. Each set of data is summarised in Sections 4.2.2 to 4.2.5 along with information relating to the difference between each participant’s results.
4.2.1 Assignment of Reference Values and Uncertainties
Reference values have been calculated for each of the weights, the average combined mass of the pair, and the difference between them. These reference values are based on the median of the results submitted by the participants. The median has been selected for this quantity due to its insensitivity to outlying results. It should be noted that none of the pilot laboratory results have been used in the calculation of the reference value, but those obtained by NPL as a participant have been included in the same manner as those obtained by the other participants.
5

NPL Report CMAM 36(a)
The uncertainty in the median has been calculated as described by Müller [6]. This calculation is based on taking the median of absolute deviations from the median of the results reported by the participants, multiplying by 1.858 (derived in [6]) and dividing the answer by the square root of one less than the number of results.
sn
MAD�
�
18581
.
where s = uncertainty n = number of results MAD = median of absolute deviations from the median
4.2.2 Mass Difference Between The Transport Standards
The mass difference between the two transport standards obtained by each laboratory is shown in Table 4.3. These results, which are illustrated graphically in Figure 4.1, show a good agreement between all of the participants except for MIKES. With the exception of this laboratory the measurements in any two successive laboratories agree to within the quoted k=1 uncertainties. The error bars on the graph indicate k=2 uncertainties. The reference value is indicated by a solid line with the uncertainty (k=2) in this value being represented by broken lines.
6

NPL Report CMAM 36(a)
Laboratory Measurement Date
INM 11 -PTB C Mass Difference
in µg
Uncertainty (k=1) in µg
Pilot Jan 1995 3001 4.5 JV Apr 1995 3005 12.5 SP Jun 1995 3000 15� Pilot Aug 1995 3003 4.5 MIKES Sep 1995 2988 5.8 DFM Nov 1995 3015 2.2 Pilot Jan 1996 3009 4.5 PTB May 1996 3011.1 2.4 IMGC June 1996 3011 3.5 NPL Sep 1996 3010.8 4.5 Pilot Sep 1996 3010 4.5 SMB Nov 1996 3003 3.0 BNM-LNE Jan 1997 3006 4.4 CEM Feb 1997 3011.7 2.3 Pilot Jun 1997 3009 4.4 Median
Not including pilot 3008.4 2.1
Median Including pilot 3009.0 1.7 Table 4.3: Mass Difference Between The Transport Standards
The overall spread of the measurements is 15 �g if the anomalous result is not included in the analysis (or 27 �g if it is). This value is higher than the 9 �g observed by the pilot laboratory for the repeated comparison of this pair of weights, but is comparable with the observed stability of each transport standard against its matching monitoring standard. Hence it may be concluded that, with one exception, a good agreement was achieved for this part of the comparison.
A comparison of the results obtained by each pair of participants, and their combined uncertainties is shown in Table 4.4.
� SP has since re-calculated the k=1 uncertainty in this quantity to be 8.5 µg
7

NPL Report CMAM 36(a)
Pilot
JV SP
Pilot
MIKES
DFMPilot PTB
IMGC NPL
PilotCEMBNM-LNE
SMB
Pilot
2960
2970
2980
2990
3000
3010
3020
3030
3040
0 5 10 15 20 25 30 35
Time From Start of Comparison (months)
Mas
s D
iffer
ence
Bet
wee
n th
e T
rans
port
Sta
ndar
ds (µ
g)
Figure 4-1: Mass Difference Between Transport Standards (Solid line: reference value, broken lines: uncertainty in reference value, all uncertainties at k=2)
8

NPL Report CMAM 36(a)
Table 4.4 indicates the difference between the results obtained by each pair of participants. The combined uncertainties of each pair of laboratories (k=2) are indicated in parentheses next to the calculated offset. The numbers shown in the table below are in micrograms and represent the offset in the results between the laboratories shown in the relevant row and column. An example of how to read the table is that NPL obtained a result 4 µg lower than DFM for the comparison of the two transport standards. The combined uncertainty of this difference is 11 µg. Laboratory Reference JV SP MIKES DFM PTB IMGC NPL SMB BNM-LNE CEMReference +3 (26) +8 (31) +20 (13) -7 (7) -3 (7) -3 (9) -2 (10) +5 (8) +2 (10) -3 (7) JV -3 (26) +5 (40) +17 (28) -10 (26) -6 (26) -6 (26) -6 (27) +2 (26) -1 (27) -7 (26) SP -8 (31) -5 (40) +12 (33) -15 (31) -11 (31) -11 (31) -11 (32) -3 (31) -6 (32) -12 (31) MIKES -20 (13) -17 (28) -12 (33) -27 (13) -23 (13) -23 (14) -23 (15) -15 (14) -18 (15) -24 (13) DFM +7 (7) +10 (26) +15 (31) +27 (13) +4 (7) +4 (9) +4 (11) +12 (8) +9 (10) +3 (7) PTB +3 (7) +6 (26) +11 (31) +23 (13) -4 (7) 0 (9) 0 (11) +8 (8) +5 (11) -1 (7) IMGC +3 (9) +6 (26) +11 (31) +23 (14) -4 (9) 0 (9) 0 (12) +8 (10) +5 (12) -1 (9) NPL +2 (10) +6 (27) +11 (32) +23 (15) -4 (11) 0 (11) 0 (12) +8 (11) +5 (13) -1 (11) SMB -5 (8) -2 (26) +3 (31) +15 (14) -12 (8) -8 (8) -8 (10) -8 (11) -3 (11) -9 (8) BNM-LNE -2 (10) +1 (27) +6 (32) +18 (15) -9 (10) -5 (11) -5 (12) -5 (13) +3 (11) -6 (10) CEM +3 (7) +7 (26) +12 (31) +24 (13) -3 (7) +1 (7) +1 (9) +1 (11) +9 (8) +6 (10) TABLE 4.4: Comparison Of Results Obtained By The Participants For The Comparison Of The Transport Standards (All values in µg)
9

NPL Report CMAM 36(a)
4.2.3 Assignment of Mass Value to PTB C
The mass values assigned to transport standard PTB C by each participating laboratory are shown in Table 4.5 and graphically in Figure 4.2. The median, indicated on the graph by a solid line, is considered as the reference value with its uncertainty being indicated by broken lines. The pilot laboratory results are for information only and have not been included in the evaluation of the reference value. The agreement between the results is excellent with the results of all the laboratories agreeing to within the quoted k=2 uncertainties, which is a good result for an artefact standard being circulated throughout Western Europe over a thirty month period.
Laboratory Measurement Date
Mass of PTB C (Deviation from
1 kg in µg)
Uncertainty (k = 1) in µg
Pilot Jan 1995 -591 16 JV Apr 1995 -577 23.5 SP Jun 1995 -589 25� Pilot Aug 1995 -589 16 MIKES Sep-Oct 1995 -596 17.2 DFM Nov 1995 -571 20 Pilot Jan 1996 -593 16 PTB May 1996 -589 14.8 IMGC Jun-Aug 1996 -559 13.6 NPL Sep 1996 -572 14.4 Pilot Sep 1996 -598 16 SMB Nov 1996 -599 21 BNM-LNE Jan-Feb 1997 -591 18 CEM Mar-Apr 1997 -600 17 Pilot Jun 1997 -587 16 Median Not including
pilot -589 6.5
Median Including Pilot -589 3.5 Table 4.5: Mass Values Assigned to the Weight PTB C
The differences between the mass values assigned to this weight by the participants are shown in Table 4.6 along with the combined uncertainty of each pair of laboratories’ measurements. It may been seen from the table that all of the laboratories’ measurements agree to within their combined uncertainties for a coverage factor of k=2.
� SP has since re-calculated the k=1 uncertainty in this quantity to be 18 µg
10

NPL Report CMAM 36(a)
JV
SP
Pilot
MIKES
DFM
Pilot
PTB
IMGC
NPL
Pilot
Pilot
Pilot
CEM
BNM-LNE
SMB
-660
-640
-620
-600
-580
-560
-540
-520
-500
0 5 10 15 20 25 30 35
Time from Start of Comparison (Months)
Dep
artu
re fr
om 1
kg
for P
TB C
(µg)
Pilot
Figure 4-2: Mass Values Assigned to Weight PTB C (Solid line: reference value, broken lines: uncertainty in reference value, all
uncertainties at k=2)
11

NPL Report CMAM 36(a) Table 4.6 indicates the difference between the results obtained by each pair of participants. The combined uncertainties of each pair of laboratories (k=2) are indicated in parentheses next to the calculated offset. The numbers shown in the table below are in micrograms and represent the offset in the results between the laboratories shown in the relevant row and column. An example of how to read the table is that NPL obtained a result 1 µg lower than DFM for the assignment of a mass value to weight PTB C. The combined uncertainty of this difference is 50 µg. Laboratory Reference JV SP MIKES DFM PTB IMGC NPL SMB BNM-LNE CEMReference -12 (49) 0 (52) +7 (37) -18 (42) 0 (33) -30 (31) -17 (32) +10 (44) +2 (39) +11 (37) JV 12 (49) +12 (69) +19 (59) -6 (62) +12 (56) -18 (55) -5 (56) +22 (63) +14 (60) +23 (58) SP 0 (52) -12 (69) +7 (61) -18 (64) 0 (59) -30 (57) -17 (58) +10 (66) +2 (62) +11 (61) MIKES -7 (37) -19 (59) -7 (61) -25 (53) -7 (46) -37 (44) -24 (45) +3 (55) -5 (50) +4 (49) DFM +18 (42) +6 (62) +18 (64) +25 (53) +18 (50) -12 (49) +1 (50) +28 (58) +20 (54) +29 (53) PTB 0 (33) -12 (56) 0 (59) +7 (46) -18 (50) -30 (41) -17 (42) +10 (52) +2 (47) +11 (46) IMGC +30 (31) +18 (55) +30 (57) +37 (44) +12 (49) +30 (41) +13 (40) +40 (50) +32 (46) +41 (44) NPL +17 (32) +5 (56) +17 (58) +24 (45) -1 (50) +17 (42) -13 (40) +27 (51) +19 (47) +28 (45) SMB -10 (44) -22 (63) -10 (66) -3 (55) -28 (58) -10 (52) -40 (50) -27 (51) -8 (56) +1 (54) BNM-LNE -2 (39) -14 (60) -2 (62) +5 (50) -20 (54) -2 (47) -32 (46) -19 (47) +8 (56) +9 (50) CEM -11 (37) -23 (58) -11 (61) -4 (49) -29 (53) -11 (46) -41 (44) -28 (45) -1 (54) -9 (50) TABLE 4.6: Comparison of Mass Values Assigned To PTB C By The Participants (All values in µg)
12

NPL Report CMAM 36(a)
4.2.4 Assignment of a Mass Value to INM 11
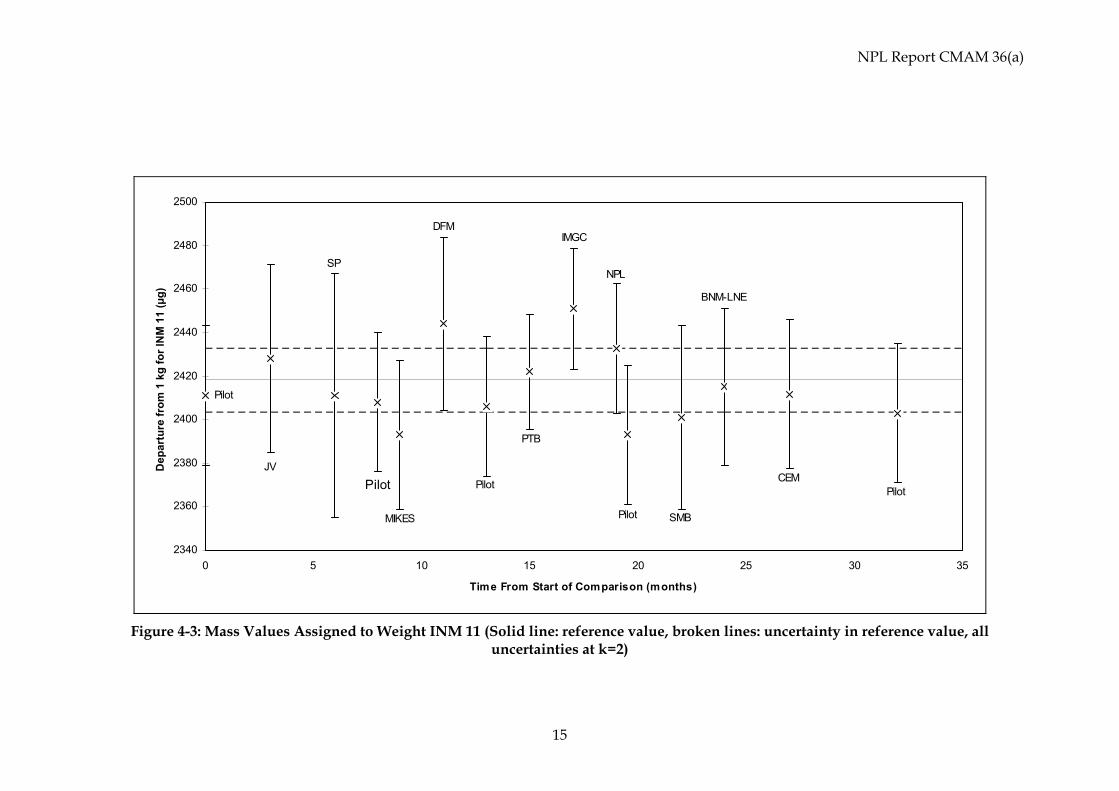
The transport standard INM 11 is a more challenging weight to calibrate than PTB C as it has a density of 9 150 kg m-3, rather then a density of approximately 8 000 kg m-3 (the usual density of mass standards). The results obtained, together with the quoted uncertainties and the assigned reference value are shown in Table 4.7 and Figure 4.3. The pilot laboratory results are for information only and have not been used in the evaluation of the reference value.
Laboratory Date INM 11= 1 kg + Uncertainty (k=1)
Pilot Jan 1995 2411 16 JV Apr 1995 2428 21.5 SP Jun 1995 2411 28� Pilot Aug 1995 2408 16 MIKES Sep-Oct 1995 2393 17.1 DFM Nov 1995 2444 20 Pilot Jan 1996 2406 16 PTB May 1996 2422 13.2 IMGC Jun-Aug 1996 2451 13.9 NPL Sep 1996 2432 14.9 Pilot Sep 1996 2393 16 SMB Nov 1996 2401 21 BNM-LNE Dec 1996-Feb 1997 2415 18 CEM Mar-Apr 1997 2412 17.1 Pilot Jun 1997 2403 16 Median Not including pilot 2418.5 7.3 Median Including pilot 2411 4.0
Table 4.7: Mass Values Assigned to Weight INM 11 (All numbers in �g) The spread of these results is 58 µg, which is larger than the 41 µg obtained for the other transport standard. This additional spread is related to the results of the comparison of the two standards. MIKES obtained a value which was lower than all of the other participants for comparing the standards, but the value assigned to PTB C is comparable with the reference value for that weight. This would imply that that a problem occurred during the measurement of INM 11 but not PTB C. The measurement on INM 11 made by MIKES is no further from the reference value than those made by DFM and IMGC, but those two institutes appear to have assigned values to both of the transport standards that are systematically offset relative to the reference value. This means that both of these institutes measured the difference between the two transport standards to be similar to most of the other participants.
� SP has since re-calculated the k=1 uncertainty in this quantity to be 18 µg
13

NPL Report CMAM 36(a)
One explanation for problems in measuring this weight is that it has an unusual density which means that a larger air buoyancy correction must be applied during its calibration than during the calibration of the other transport standard. However, this is an unlikely explanation as, unless the air density instrumentation had either been changed, or re-calibrated and assigned grossly different corrections, a laboratory would assign an incorrect mass value to its stainless steel standards when calibrating them against a Pt-Ir standard. Hence an incorrect value would also be assigned to PTB C. The offsets between the mass values assigned to INM 11, along with their combined uncertainty, between each pair of participants is shown in Table 4.8.
14
NPL Report CMAM 36(a)
Pilot
Pilot
Pilot
JV
SP
MIKES
DFM
PTB
IMGC
NPL
SMB
BNM-LNE
CEM
Pilot
2340
2360
2380
2400
2420
2440
2460
2480
2500
0 5 10 15 20 25 30 35
Time From Start of Comparison (months)
Dep
artu
re fr
om 1
kg
for I
NM
11
(µg)
Pilot
Figure 4-3: Mass Values Assigned to Weight INM 11 (Solid line: reference value, broken lines: uncertainty in reference value, all
uncertainties at k=2)
15

NPL Report CMAM 36(a)
Table 4.8 indicates the difference between the results obtained by each pair of participants. The combined uncertainties of each pair of laboratories (k=2) are indicated in parentheses next to the calculated offset. The numbers shown in the table below are in micrograms and represent the offset in the results between the laboratories shown in the relevant row and column. An example of how to read the table is that NPL obtained a result 12µg lower than DFM for the assignment of a value to weight INM 11. The combined uncertainty of this difference is 50 µg.
Laboratory Reference JV SP MIKES DFM PTB IMGC NPL SMB BNM-LNE CEMReference -10 (46) +8 (58) +26 (38) -26 (43) -4 (31) -32 (32) -14 (34) +18 (45) +4 (39) +7 (38) JV +10 (46) +17 (71) +35 (55) -16 (59) +6 (51) -23 (52) -4 (53) +27 (61) +13 (57) +16 (55) SP -8 (58) -17 (71) +18 (66) -33 (69) -11 (62) -40 (63) -22 (64) +10 (70) -4 (67) -1 (66) MIKES -26 (38) -35 (55) -18 (66) -51 (53) -29 (44) -58 (45) -40 (46) -8 (55) -22 (50) -19 (49) DFM +26 (43) +16 (59) +33 (69) +51 (53) +22 (48) -7 (49) +12 (50) +43 (58) +29 (54) +32 (53) PTB +4 (31) -6 (51) +11 (62) +29 (44) -22 (48) -29 (39) -10 (40) +21 (50) +7 (45) +10 (44) IMGC +32 (32) +23 (52) +40 (63) +58 (45) +7 (49) +29 (39) +18 (41) +50 (51) +36 (46) +39 (45) NPL +14 (34) +4 (53) +22 (64) +40 (46) -12 (50) +10 (40) -18 (41) +32 (52) +18 (47) +21 (46) SMB -18 (45) -27 (61) -10 (70) +8 (55) -43 (58) -21 (50) -50 (51) -32 (52) -14 (56) -11 (55) BNM-LNE -4 (39) -13 (57) +4 (67) +22 (50) -29 (54) -7 (45) -36 (46) -18 (47) +14 (56) +3 (50) CEM -7 (38) -16 (55) +1 (66) +19 (49) -32 (53) -10 (44) -39 (45) -21 (46) +11 (55) -3 (50) TABLE 4.8: Comparison of Mass Values Assigned To INM 11 By The Participants (All values in µg)
16

NPL Report CMAM 36(a)
4.2.5 Combined Results
An additional parameter that may be considered is the mean of the mass values assigned to the pair of weights by each laboratory. This offers an overall figure for the assignment of mass to the pair of weights by each participant which may be used to compare the overall results of all the laboratories. Table 4.9 shows the values obtained in this manner. The uncertainties displayed in this table are the arithmetic mean of the uncertainties quoted for each weight by the laboratory in question. Once more the median of the results is taken to be the reference value for this quantity.
Laboratory Date Mean = 1 kg + (µg)
Uncertainty (k=1)
Pilot Jan 1995 910 16 JV Apr 1995 925.5 22.5 SP Jun 1995 911.0 26.5� Pilot Aug 1995 909.5 16 MIKES Sep-Oct 1995 898.5 17.2 DFM Nov 1995 936.5 20 Pilot Jan 1996 906.5 16 PTB May 1996 916.5 14 IMGC Jun-Aug 1996 946.0 13.8 NPL Sep 1996 930.2 14.7 Pilot Sep 1996 897.5 16 SMB Nov 1996 901.0 21 BNM-LNE Dec 1996-Feb 1997 912.0 18 CEM Mar-Apr 1997 905.8 17.1 Pilot Jun 1997 908 16 Median Not including pilot 914.2 7.6 Median Including pilot 910 4.2
Table 4.9: Mean Mass Values Of The Two Transport Standards (All numbers in �g) A comparison between all the participants results is shown in Table 4.10. From this it can be seen that all of the ten participants agree with the reference value to within the quoted uncertainties for a coverage factor of k=2.
� The re-calculated SP uncertainties mean that this uncertainty (k=1) should read 18 µg
17

NPL Report CMAM 36(a)
Pilot
Pilot
PilotCEM
DFM
MIKESSP
JV
PTB
IMGC
NPL
SMB
BNM-LNE
Pilot
Pilot
840
860
880
900
920
940
960
980
0 5 10 15 20 25 30 35
Time From Start of Comparison (months)
Dep
artu
re fr
om 1
kg
for M
ean
Mas
s O
f Tra
nspo
rt S
tand
ards
(µg)
Figure 4-4: Mean Combined Mass Values Assigned to The Transport Standards(Solid line: reference value, broken lines: uncertainty in
reference value, all uncertainties at k=2)
18

NPL Report CMAM 36(a)
Table 4.10 indicates the difference between the results obtained by each pair of participants. The combined uncertainties of each pair of laboratories (k=2) are indicated in parentheses next to the calculated offset. The numbers shown in the table below are in micrograms and represent the offset in the results between the laboratories shown in the relevant row and column. An example of how to read the table is that NPL obtained a result 6 µg lower than DFM for the assignment of a mean mass value to the pair of transport standards. The combined uncertainty of this difference is 50 µg.
Laboratory Reference JV SP MIKES DFM PTB IMGC NPL SMB BNM-LNE CEMReference -11 (48) +3 (56) +16 (38) -22 (43) -2 (32) -32 (32) -16 (33) +13 (45) +2 (40) +8 (38) JV 11 (48) +14 (70) +27 (57) -11 (61) +9 (53) -20 (53) -5 (54) +24 (62) +14 (58) +20 (57) SP -3 (56) -14 (70) +12 (64) -26 (67) -6 (60) -35 (60) -19 (61) +10 (68) -1 (65) +5 (64) MIKES -16 (38) -27 (57) -12 (64) -38 (53) -18 (45) -48 (44) -32 (46) -2 (55) -14 (50) -7 (49) DFM +22 (43) +11 (61) +26 (67) +38 (53) +20 (49) -10 (49) +6 (50) +36 (58) +24 (54) +31 (53) PTB +2 (32) -9 (53) +6 (60) +18 (45) -20 (49) -30 (40) -14 (41) +16 (51) +4 (46) +11 (45) IMGC +32 (32) +20 (53) +35 (60) +48 (44) +10 (49) +30 (40) +16 (41) +45 (51) +34 (46) +40 (44) NPL +16 (33) +5 (54) +19 (61) +32 (46) -6 (50) +14 (41) -16 (41) +29 (52) +18 (47) +24 (45) SMB -13 (45) -24 (62) -10 (68) +2 (55) -36 (58) -16 (51) -45 (51) -29 (52) -11 (56) -5 (55) BNM-LNE -2 (40) -14 (58) +1 (65) +14 (50) -24 (54) -4 (46) -34 (46) -18 (47) +11 (56) +6 (50) CEM -8 (38) -20 (57) -5 (64) +7 (49) -31 (53) -11 (45) -40 (44) -24 (45) +5 (55) -6 (50) TABLE 4.10: Differences between the participants in the mean of the mass values assigned to each of the two transport standards (all values in µg)
19

NPL Report CMAM 36(a)
5. UNCERTAINTY ESTIMATES
Uncertainty estimates were provided by each of the laboratories for all of the measurements that they carried out. Each laboratory calculated its measurement uncertainties in the manner that it would normally make such calculations. As would be anticipated, the major contributions were considered in a similar manner by each participant with the only differences being in the smaller contributions, which tend not to be significant. All of the uncertainties quoted in this section are for a coverage factor of k=1.
5.1 MASS STANDARDS
The uncertainty in the values of the mass standards that were used in the comparison ranged from 13.0 �g to 20 �g, typical of the uncertainties that would be expected for such stainless steel mass standards. All of the standards used were traceable to the official copy of the Prototype of the Kilogram held in that particular country.
5.2 TRANSPORT STANDARD VOLUME
The information relating to the uncertainty in the density of each of the transport standards was provided by the owner of each weight and is shown in Table 2.1. From these figures the uncertainty in the volume of PTB C may be calculated to be 0.0011 cm3 while that for INM 11 is 0.0024 cm3. The volume uncertainty is multiplied by the air density at the time of the calibration of the weight to give the equivalent uncertainty in mass units. The figures quoted for this contribution by the participants range from 0.6 µg to 2.4 µg when considering PTB C and that for INM 11 was from 0.7 µg to 3.4 µg. It should be noted that some participants combined the uncertainty in the volume of their own standards with that in the test weight to give a larger figure.
5.3 PARTICIPANT STANDARD VOLUME
There is an uncertainty in the volume of the weights used as mass standards by each participating laboratory that may be considered in the same manner as discussed in Section 5.2. However, if the uncertainty in the volume of the standard has already been included in its own calibration it will be possible to ignore this contribution. A further option that has been considered by one participant is that the uncertainty in the volume of the standard should be multiplied by the difference in air density at the time of calibration of the standard from that at the time when it is used as a standard.
5.4 AIR DENSITY MEASUREMENT
All of the laboratories involved in this comparison have used the empirical equation recommended by the CIPM [7], [8] to calculate the air density at the time of making measurements on the transport standards. There is an uncertainty associated with this equation, as well as with the measurement of the temperature, air pressure, humidity and carbon dioxide concentration, which are the quantities fed into the equation to calculate air density.
5.5 ADDITIONAL WEIGHTS
The high density, and hence low volume, of INM 11 means it experiences approximately 20 mg less upthrust from the air than a stainless steel weight. Most laboratories have taken this into account when comparing INM 11 with their own standards and PTB C by adding a 20 mg
20
NPL Report CMAM 36(a)
standard to the stainless steel weight. This means that only a small part of the mass comparator’s measurement window is used in the comparison process. There is an uncertainty associated with the mass of such additional weights.
5.6 MASS COMPARATOR
There are uncertainties associated with the mass comparators used in this comparison which may be broken down into the following categories.
5.6.1 Sensitivity Error
The mass difference between two weights under comparison is usually indicated by an electronic scale on the comparator in use. Often there is a linear error in this scale which some laboratories have taken into account in their uncertainty budgets. Others have minimised the problem by matching the apparent mass of the weights under comparison using additional weights (see Section 5.5).
5.6.2 Weight Exchanger Anomalies
Many of the mass comparators used in this comparison have automatic mechanisms that allow for the automatic comparison of several weights. Some of these mechanisms are prone to influencing the results of a comparison such that the measured mass difference is dependent on the relative location of the weights. Several participants who were aware of this potential problem with their comparator made comparisons with the weights in many different positions on the exchanger in order to eliminate the effects of this problem, while others have made an allowance for it in the uncertainty budgets.
5.6.3 Long Term Repeatability
Some laboratories have included a component in the uncertainty budget to take into account the reproducibility of the mass comparator used. The remainder have considered that making several measurements, including the repositioning of the weights on the weight exchange mechanism, during the comparison means this contribution is accounted for in the standard deviation of all the measurements (see Section 5.7).
5.7 SPREAD OF RESULTS
The spread of the results contributing to the final values assigned to each quantity have been included in the uncertainty budget of every participant. There is some variation between the different laboratories, with some using the sample standard deviation of their measurements while others have used the standard uncertainty as a measure of this quantity.
5.8 OTHER SOURCES
Many other minor sources of uncertainty have also been considered by various participants. These all have negligible influence on the final uncertainty quoted for each quantity and are summarised below:- �� The uncertainty in the determination of the height of the centre of gravity of the weights �� The uncertainty in the measurement of the gradient in the local gravitational field �� The effect of changes in relative humidity on weights having different surface areas �� Magnetic interaction between the weight and the mass comparator �� Dust contamination
21

NPL Report CMAM 36(a)
6. SUMMARY
The values assigned to each of the two mass standards show that the measurements made by all of the participants agree with the reference mass value for the standards to within their quoted uncertainties (k=2). Eight of the ten participants assigned a mass value to the stainless steel weight that agrees with the reference value to within the quoted k=1 uncertainties while seven of the participants assigned values to the alacrite weight that are within the quoted k=1 uncertainty. It may be concluded that measurements made in all of these laboratories on stainless steel 1 kg standards were metrologically equivalent at the time of this comparison (for a k=2 coverage factor).
7. PROPOSED FUTURE WORK
A further EUROMET project which involves the comparison of Pt-Ir 1 kg standards has been agreed with the aim of establishing whether there are systematic offsets in the way that some NMIs treat the value assigned to their national copy of the Prototype of the Kilogram. Such standards were cleaned at the BIPM prior to being calibrated at the time of the third verification of National Prototypes of the Kilogram. It is well documented that Pt-Ir prototypes gain mass following cleaning [1]. Several of the participants have used mathematical models to predict the magnitude of this mass gain while others have not taken it into account. The purpose of the Pt-Ir comparison will be to establish whether this difference in approaches leads to significant differences in value that various NMIs assign to their national copy of the Prototype of the Kilogram. The importance of the Pt-Ir comparison is further demonstrated by a problem that arose at the IMGC at the time of this comparison. Shortly after submitting its results, the IMGC became aware that, following an attempt to clean its official copy of the kilogram (number 62), it had a problem with its assigned value. It is almost certain that the results of the IMGC would have been much closer to the reference value had this problem, which has now been addressed, not occurred. A second additional 1 kg comparison, using 1 kg stainless steel weights, will be organised under the auspices of EUROMET. This will allow NMIs that did not participate in this exercise to demonstrate metrological equivalence with the participants of this comparison, and hence the CCM ‘Key Comparison’ at 1 kg.
8. REFERENCES
[1] Girard, G., Metrologia, 1994, 31, 317-336 [2] Armitage, D.R., Pendrill, L., Davis, R.S., “European comparison of air density
determination with buoyancy artefacts”, XIV IMEKO World Congress, III, 1997, 212-215
[3] Davidson, S., “Measurement of air density for high accuracy mass calibration”, Proceedings of the Conference on Weighing and Measurement in the Year 2000, Sheffield, September 1997, edited by M. Buckley, South Yorkshire Trading Standards Unit, 1997, 37-46
[4] International Recommendation 111. Weights of classes E1, E2, F1, F2, M1, M2, M3. OIML, 1994
22

NPL Report CMAM 36(a)
[5] Severn, I. and Raymond, N.M., “The Assignment of Values to NPL’s 1 kg Standards Following the Third International Verification of Prototype Kilograms”, NPL Report MOT2, 1996
[6] Müller, J.W., Rapport BIPM-95/2,1995 [7] Giacomo, P., Metrologia, 1982, 18, 33-40 [8] Davis, R.S., Metrologia, 1990, 27, 139-144
9. ACKNOWLEDGEMENTS
The author would like to thank all of the participants for their help throughout this comparison. NPL’s activities in this comparison, both as pilot laboratory and participant, were funded by the National Measurement System Policy Unit of the Department of Trade and Industry under the Term Contract for Research and Development.
23
NPL Report CMAM 36(a)
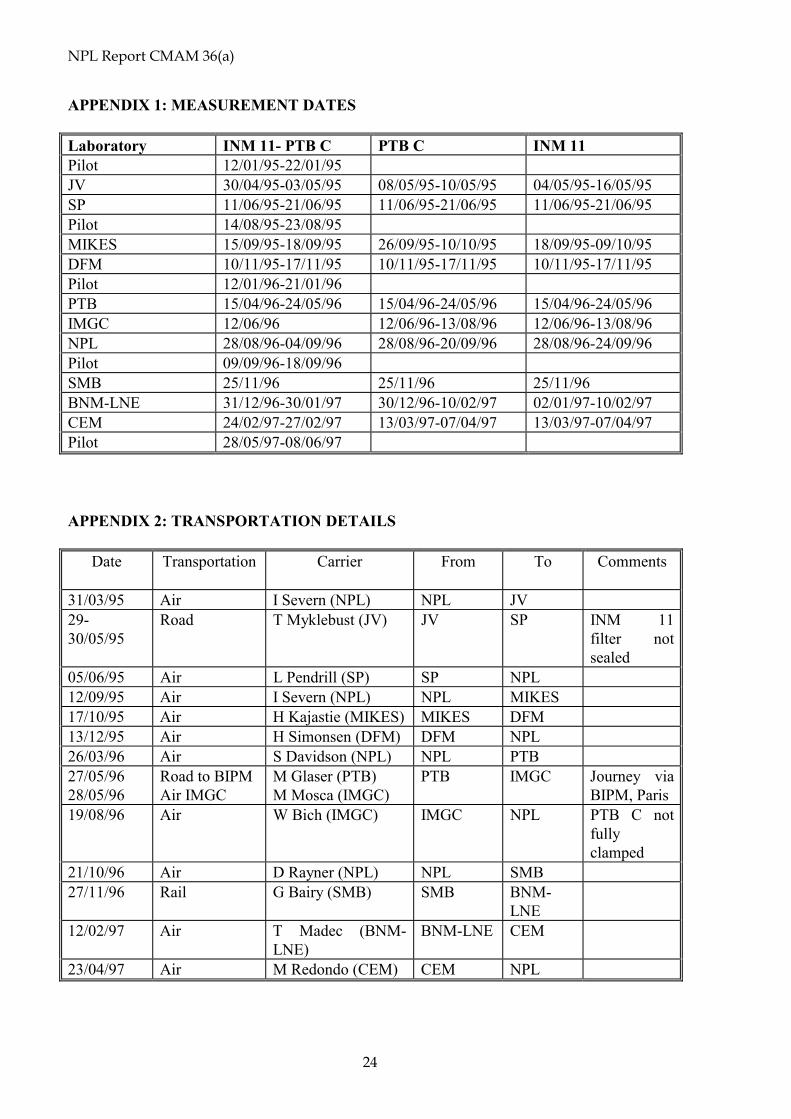
APPENDIX 1: MEASUREMENT DATES Laboratory INM 11- PTB C PTB C INM 11 Pilot 12/01/95-22/01/95 JV 30/04/95-03/05/95 08/05/95-10/05/95 04/05/95-16/05/95 SP 11/06/95-21/06/95 11/06/95-21/06/95 11/06/95-21/06/95 Pilot 14/08/95-23/08/95 MIKES 15/09/95-18/09/95 26/09/95-10/10/95 18/09/95-09/10/95 DFM 10/11/95-17/11/95 10/11/95-17/11/95 10/11/95-17/11/95 Pilot 12/01/96-21/01/96 PTB 15/04/96-24/05/96 15/04/96-24/05/96 15/04/96-24/05/96 IMGC 12/06/96 12/06/96-13/08/96 12/06/96-13/08/96 NPL 28/08/96-04/09/96 28/08/96-20/09/96 28/08/96-24/09/96 Pilot 09/09/96-18/09/96 SMB 25/11/96 25/11/96 25/11/96 BNM-LNE 31/12/96-30/01/97 30/12/96-10/02/97 02/01/97-10/02/97 CEM 24/02/97-27/02/97 13/03/97-07/04/97 13/03/97-07/04/97 Pilot 28/05/97-08/06/97 APPENDIX 2: TRANSPORTATION DETAILS
Date Transportation Carrier From To
Comments
31/03/95 Air I Severn (NPL) NPL JV 29-30/05/95
Road T Myklebust (JV) JV SP INM 11 filter not sealed
05/06/95 Air L Pendrill (SP) SP NPL 12/09/95 Air I Severn (NPL) NPL MIKES 17/10/95 Air H Kajastie (MIKES) MIKES DFM 13/12/95 Air H Simonsen (DFM) DFM NPL 26/03/96 Air S Davidson (NPL) NPL PTB 27/05/96 28/05/96
Road to BIPM Air IMGC
M Glaser (PTB) M Mosca (IMGC)
PTB IMGC Journey via BIPM, Paris
19/08/96 Air W Bich (IMGC) IMGC NPL PTB C not fully clamped
21/10/96 Air D Rayner (NPL) NPL SMB 27/11/96 Rail G Bairy (SMB) SMB BNM-
LNE
12/02/97 Air T Madec (BNM-LNE)
BNM-LNE CEM
23/04/97 Air M Redondo (CEM) CEM NPL
24

NPL Report CMAM 36(a)
25
APPENDIX 3: AIR DENSITY DURING MEASUREMENTS Laboratory Minimum Maximum Mean Pilot 1.1696 1.2253 1.1915 JV 1.2073 1.2145 1.2105 SP 1.1672 1.1755 1.1703 Pilot 1.1852 1.1984 1.1930 MIKES 1.188 1.219 1.204 DFM 1.1505 1.1978 1.18 Pilot 1.1777 1.2157 1.20163 PTB 1.1881 1.1902 1.1892 IMGC 1.1651 1.1656 1.1654 NPL 1.1977 1.2111 1.2044 Pilot 1.1985 1.2173 1.2098 SMB 1.17109 1.17118 1.17114 BNM-LNE 1.18556 1.21991 1.20074 CEM 1.0529 1.0529 1.0529 Pilot 1.1811 1.2175 1.1990 Table A3.1: Air density during comparison of transport standards (all values in kg m-3) Laboratory Minimum Maximum Mean JV 1.1909 1.1981 1.1931 SP 1.1672 1.1755 1.1703 MIKES 1.174 1.204 1.190 DFM 1.1505 1.1978 1.18 PTB 1.1881 1.1902 1.1892 IMGC 1.148 1.180 1.165 NPL 1.1951 1.2111 1.2031 SMB 1.17100 1.17118 1.17108 BNM-LNE 1.18542 1.21470 1.19880 CEM 1.0501 1.0501 1.0501 Table A3.2: Air density during determination of mass of PTB C (all values in kg m-3) Laboratory Minimum Maximum Mean JV 1.1789 1.2027 1.1921 SP 1.1672 1.1755 1.1703 MIKES 1.196 1.270 1.204 DFM 1.1505 1.1978 1.18 PTB 1.1881 1.1902 1.1892 IMGC 1.148 1.180 1.165 NPL 1.1977 1.2111 1.2044 SMB 1.17112 1.17119 1.17116 BNM-LNE 1.18736 1.21606 1.20219 CEM 1.0501 1.0501 1.0501 Table A3.3:Air density during determination of mass of INM 11 (all values in kg m-3)