a clinical utility study of personality inventories ... · viii table of contents chapter page i....
TRANSCRIPT
A CLINICAL UTILITY STUDY OF PERSONALITY INVENTORIES: CONCORDANCE OF
THE MCMI-III, THE MMPI-2, THE MMPI-RC, TWO ALTERNATIVE PERSONALITY
DISORDER SCALES, AND AXIS II DISCHARGE DIAGNOSIS IN PSYCHIATRIC
INPATIENTS
A Dissertation by
Ronald W. Partridge
Masters of Arts, Wichita State University, 2010
Bachelors of Arts, Weber State University, 2008
Submitted to the Department of Psychology
and the faculty of the Graduate School of
Wichita State University
in partial fulfillment of
the requirements for the degree of
Doctor of Philosophy
December 2013

© Copyrights 2013 by Ronald W. Partridge
All Rights Reserved
Note that thesis and dissertation work is protected by copyright, with all rights reserved.
Only the author has the legal right to publish, produce, sell or distribute this work. Author
permission is needed for others to directly quote significant amounts of information in their
own work or to summarize substantial amounts of information in their own work. Limited
amounts of information cited, paraphrased, or summarized from the work may be used
with proper citation of where to find the original work.
iii
A CLINICAL UTILITY STUDY OF PERSONALITY INVENTORIES: CONCORDANCE OF
THE MCMI-III, THE MMPI-2, THE MMPI-RC, TWO ALTERNATIVE PERSONALITY
DISORDER SCALES, AND AXIS II DISCHARGE DIAGNOSIS IN PSYCHIATRIC
INPATIENTS
The following faculty have examined the final copy of this dissertation for form and content, and
recommend that it be accepted in partial fulfillment of the requirement for the degree of Doctor
of Philosophy with a major in Psychology.
Darwin Dorr, Committee Chair
Charles Burdsal, Committee Member
Gregory Meissen, Committee Member
Paul Ackerman, Committee Member
Nancy McKellar, Committee Member
Donald Morgan, Committee Member
Accepted for the Fairmount College of Liberal Arts and Sciences
Ron Matson, Interim Dean
Accepted for the Graduate School
Abu Masud, Interim Dean

iv
DEDICATION
The completion of my academic goals could not have been achieved without the
unconditional love and support from my family. To my parents, Ron and Annette Partridge, I will
be forever grateful for your inspiration, compassion, and patience. I would have never
accomplished all that I have without the perseverance, inquisitiveness, passion, and empathy you
have instilled in me. To my siblings, Jason, Corinne, and Brad, your unwavering loyalty and
support have carried me through some pretty rough patches and provided me with the strength
needed to overcome any obstacle. Lastly, to my two amazing daughters Halle and Chloe, you
bring so much beauty, joy, and love to my life. I hope that my accomplishments will someday
inspire you both to achieve all your hopes and dreams.

v
"Don't become a mere recorder of facts, but try to penetrate the mystery of their origin."
Ivan Pavlov

vi
ACKNOWLEDGEMENT
I would like to thank Dr. Darwin Dorr for your invaluable mentorship. Your wealth of
knowledge and passion for psychology is inspiring. I am thankful that I had you in my corner
throughout this journey to provide me with support, guidance, and advice both professionally and
personally. That which I have learned from you will serve me far beyond my professional life, for
that, I thank you.
I would also like to thank Dr. Don Morgan for sharing with me your immense knowledge
and wisdom. The ease in which you skillfully interpret an M&M is awe inspiring. I truly
appreciate your willingness to take me under your wing and share your time and experiences.
Additionally, I would like to thank the University of Kansas School of Medicine for supporting the
collaboration between KU’s department of psychiatry and WSU’s department of psychology.
Thank you to my committee members for offering your knowledge and time in support of
this research. Your expertise is truly appreciated.
I must also give special thanks to Dr. Todd Baird and to Dr. Brenda Kowalewski for
guiding and supporting me from the beginning. You taught me to question the status quo and
instilled in me a passion for the pursuit of knowledge. I know with certainty that I would not be
where I am today without your mentorship and friendship. I am so blessed to have such incredible
individuals in my life.
Finally, I would like to thank all my friends who have come into my life along the way.
This voyage would not have been the same without each one of you. The good times and the bad,
I treasure them all. I look forward to the adventures that will surely come.

vii
ABSTRACT
The Millon Clinical Multiaxial Inventory and the Minnesota Multiphasic Personality Inventory
are two of the most common personality inventories used by clinicians for diagnostic purposes.
Discriminant functions of the MMPI-2, MMPI-RC (Restructured Clinical), two alternative MMPI
Personality Disorder Scales, and the MCMI-III were compared in a sample of 371 hospitalized
psychiatric patients with Axis II discharge diagnoses. Participants were grouped by Cluster B
Personality Disorders (93), Cluster C Personality Disorders (38), and participants without an Axis
II diagnosis (240). Diagnostic utility of the instruments was compared in regards to DSM-IV-TR
Axis II diagnoses. Analyses included utilizing discriminant function analysis to evaluate the
diagnostic accuracy of each personality inventory. Further analyses provided information on two
diagnostic validity statistics which included: positive predictive power (PPP) and incremental
validity of positive test diagnoses (IPPP). The diagnostic validity statistics were used to evaluate
which instrument has the most clinical and diagnostic utility in the differentiation of
psychopathology. Analyses indicated that each of the instruments effectively predicted group
membership at a rate better than chance and that no single instrument performed better or worse in
this task. However, the MCMI-III possessed the greatest diagnostic validity as defined by the PPP
and IPPP statistics. Thus, the initial hypothesis that the MCMI-III would have the most clinical
utility in the assessment of personality disorders is partially supported.
viii
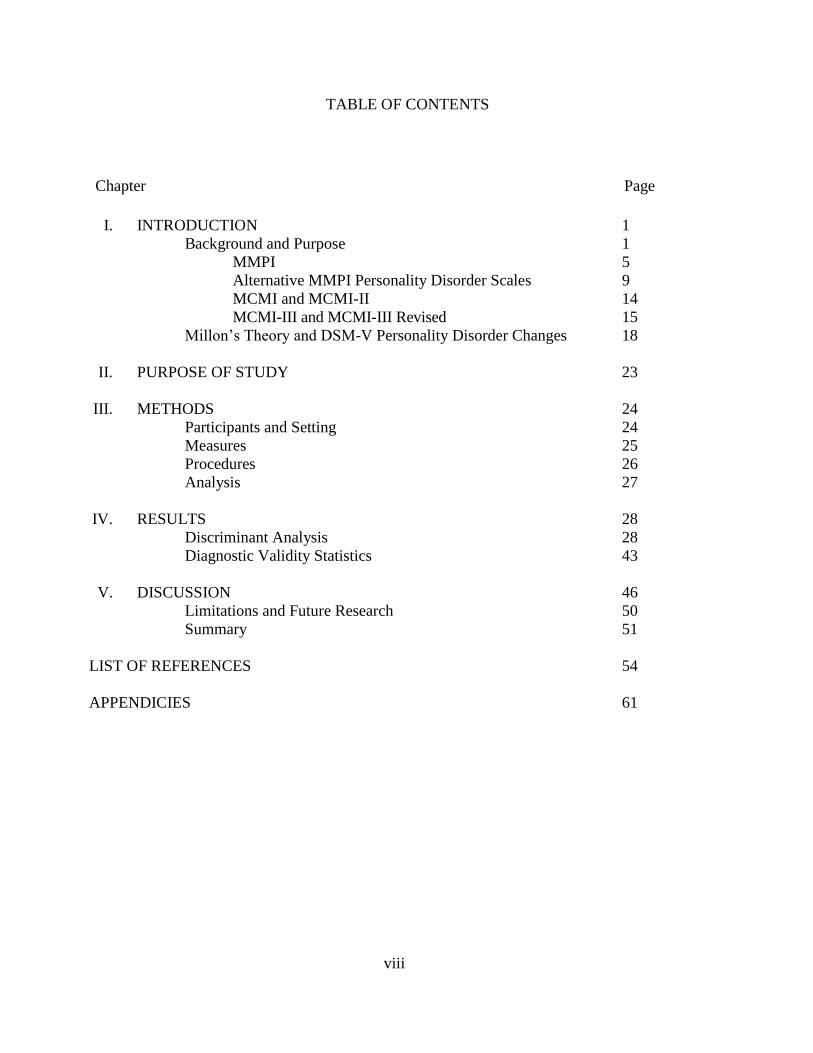
TABLE OF CONTENTS
Chapter Page
I. INTRODUCTION 1
Background and Purpose 1
MMPI 5
Alternative MMPI Personality Disorder Scales 9
MCMI and MCMI-II 14
MCMI-III and MCMI-III Revised 15
Millon’s Theory and DSM-V Personality Disorder Changes 18
II. PURPOSE OF STUDY 23
III. METHODS 24
Participants and Setting 24
Measures 25
Procedures 26
Analysis 27
IV. RESULTS 28
Discriminant Analysis 28
Diagnostic Validity Statistics 43
V. DISCUSSION 46
Limitations and Future Research 50
Summary 51
LIST OF REFERENCES 54
APPENDICIES 61
ix
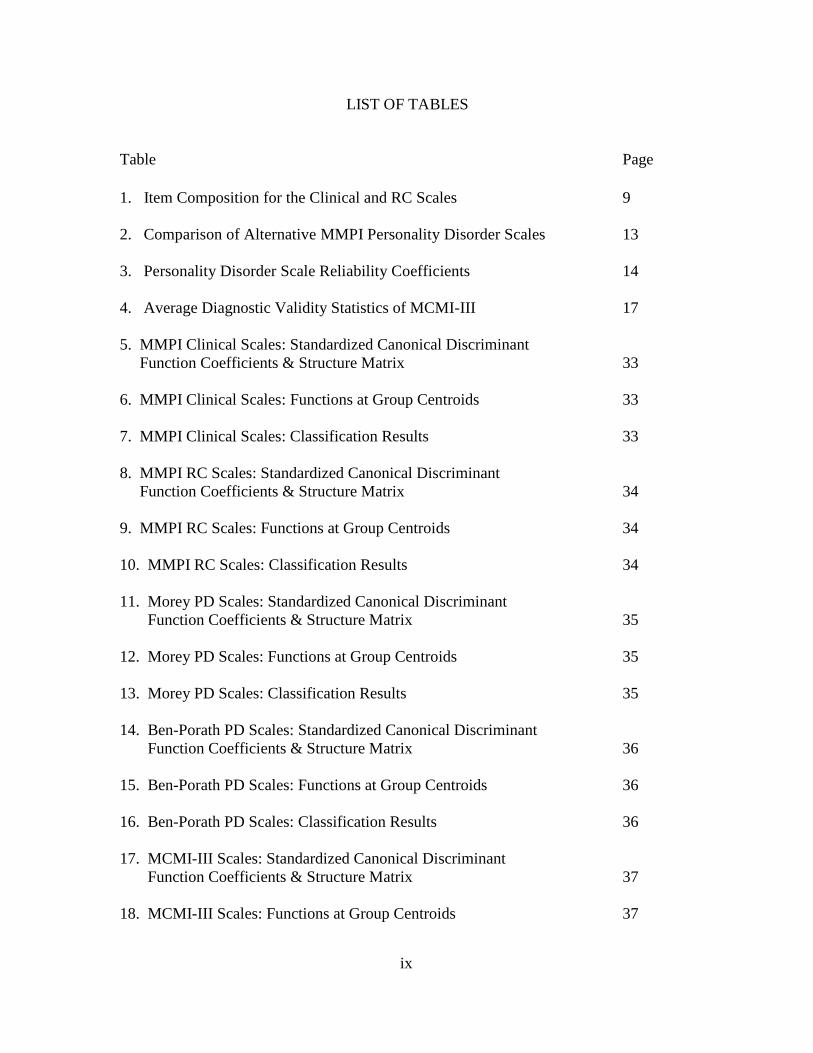
LIST OF TABLES
Table Page
1. Item Composition for the Clinical and RC Scales 9
2. Comparison of Alternative MMPI Personality Disorder Scales 13
3. Personality Disorder Scale Reliability Coefficients 14
4. Average Diagnostic Validity Statistics of MCMI-III 17
5. MMPI Clinical Scales: Standardized Canonical Discriminant
Function Coefficients & Structure Matrix 33
6. MMPI Clinical Scales: Functions at Group Centroids 33
7. MMPI Clinical Scales: Classification Results 33
8. MMPI RC Scales: Standardized Canonical Discriminant
Function Coefficients & Structure Matrix 34
9. MMPI RC Scales: Functions at Group Centroids 34
10. MMPI RC Scales: Classification Results 34
11. Morey PD Scales: Standardized Canonical Discriminant
Function Coefficients & Structure Matrix 35
12. Morey PD Scales: Functions at Group Centroids 35
13. Morey PD Scales: Classification Results 35
14. Ben-Porath PD Scales: Standardized Canonical Discriminant
Function Coefficients & Structure Matrix 36
15. Ben-Porath PD Scales: Functions at Group Centroids 36
16. Ben-Porath PD Scales: Classification Results 36
17. MCMI-III Scales: Standardized Canonical Discriminant
Function Coefficients & Structure Matrix 37
18. MCMI-III Scales: Functions at Group Centroids 37

x
LIST OF TABLES (continued)
Table Page
19. MCMI-III Scales: Classification Results 37
20. Comparison of Average Diagnostic Validity Statistics of the
Morey PD Scales, the Ben-Porath PD Scales, and the MCMI-III 44
21. Summary Comparison of Wilks λ 46
xi
LIST OF FIGURES
Figure Page
1. Personality Circulargram 20
2. MMPI-2 Clinical Scale Profile 38
3. MMPI-RC Scale Profile 39
4. Morey Personality Disorder Scale Profile 40
5. Ben-Porath Personality Disorder Scale Profile 41
6. MCMI-III Personality Pattern Scale Profile 42
1
CHAPTER ONE
INTRODUCTION
Background and Purpose
Establishing a diagnosis is one of the first tasks a clinician faces when treating a patient.
Valid diagnostic information is vital for the long-term treatment planning and care of psychiatric
patients. After all, the purpose of diagnosing is to inform and guide treatment. As Millon (2000)
noted, “diagnostic constructs are only reference points that facilitate understanding, against
which the individual should be compared and contrasted” (p. 73).
Two general procedures used for gaining understanding of an individual are clinical
judgment and mechanical/statistical prediction. Grove, Zald, Lebow, Snitz, and Nelson (2000)
describe clinical judgment as “the typical procedure long used by applied psychologists and
physicians, in which the judge puts data together using informal, subjective methods” (pg. 19).
They describe statistical prediction as actuarial or algorithmic prediction which is well specified
and once developed, requires no expert judgment (Grove et al., 2000). A large amount of
research has been done on the accuracy of clinical judgment versus statistical prediction (Dawes,
Faust, & Meehl, 1989; Garb, 1994; Grove et al., 2000; Grove & Meehl, 1996; Holt, 1970;
Marchese, 1992; Sines, 1971; Meehl, 1954; Sawyer, 1966; Wiggins, 1981). The findings of
these studies have largely supported the use of statistical prediction over clinical judgment in
regards to diagnostic accuracy. Additionally, two extensive meta-analyses have nicely
summarized the findings regarding the clinical judgment versus statistical prediction controversy
(Egisdottir et al., 2006; Grove et al., 2000).
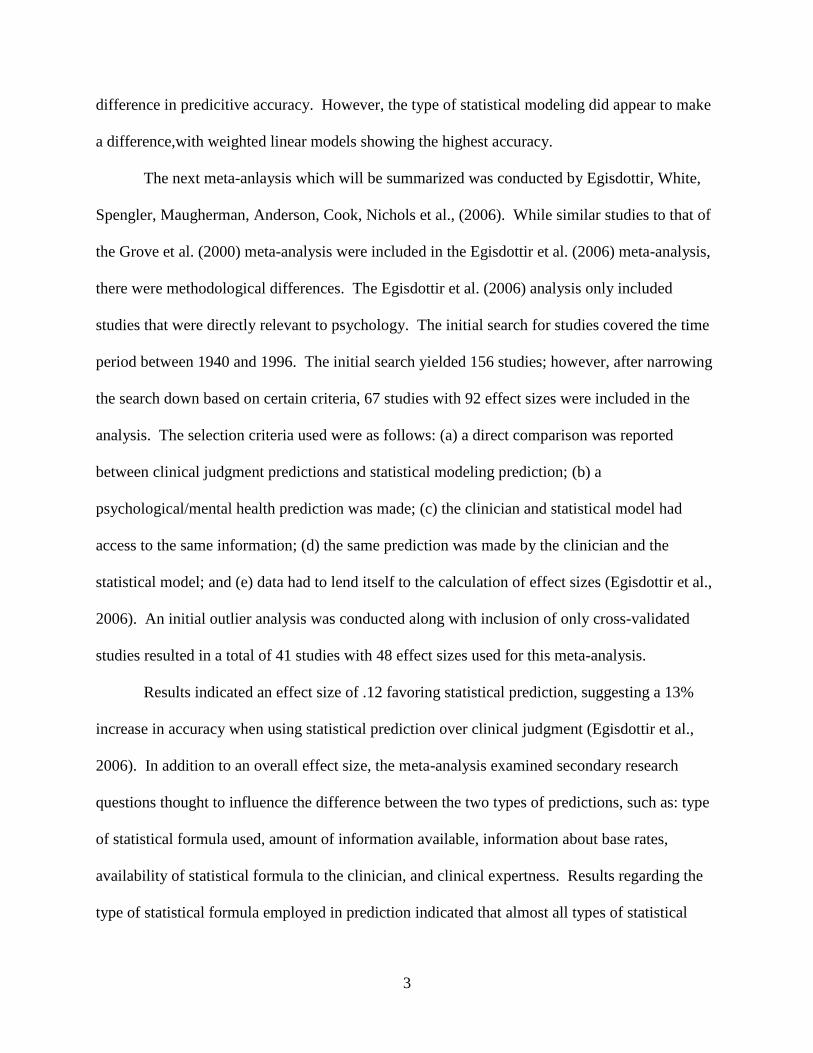
The Grove et al. (2000) meta-analysis included 136 studies consisting of 617 independent
comparisons between clinical judgment and statistical prediction models. Studies which met the
2
following crieteria were included in the meta-analysis: published in English since 1920,
predicted health-related phenomena and/or human behavior, and contained a description of the
empirical outcome between predictions made using clinical judgment and predictions made
using statistical models (Grove et al., 2000). The predictive criteria ranged from medical and
mental health diagnosis to bankruptcy of firms. The clinicians utilized in the many studies
analyzed ranged from psychologists and psychiatrists to members of parole boards and
admissions committees. Their level of education ranged from less than a High School diploma
to credentialed medical subspecialists. The clinicians’ experience levels ranged from none to
many years of task-specific experience. The statistical models used in the studies analyzed
ranged from simplistic single variable models to highly sophisticated methods such as artificial
intelligence and pattern recognition software. The data used by clinicians and statistical models
for prediction purposes ranged from simple life history facts to refined medical tests (Grove et
al., 2000).
In all of the studies included in this meta-anlaysis the clinicians had at least as much
information available to them as was included in the statistical models, with the clincians having
more available information in many of the studies. Even with this biases towards the clincians,
results indicated that of the 136 studies; statistical prediction models outperformed clincial
judgment in 64 studies, perfomred equivalently in 64 other studies, and clincial judgment
outperformed statistical modeling in just 8 studies (Grove et al., 2000). Of note, the 8 studies
which favored clinicians were not focused in any one specific predicitive area, did not represent
any specific type of clinician, and did not display and obvious common characteristics.
Additional results indicated that clincial experience and professional training made little
3
difference in predicitive accuracy. However, the type of statistical modeling did appear to make
a difference,with weighted linear models showing the highest accuracy.
The next meta-anlaysis which will be summarized was conducted by Egisdottir, White,
Spengler, Maugherman, Anderson, Cook, Nichols et al., (2006). While similar studies to that of
the Grove et al. (2000) meta-analysis were included in the Egisdottir et al. (2006) meta-analysis,
there were methodological differences. The Egisdottir et al. (2006) analysis only included
studies that were directly relevant to psychology. The initial search for studies covered the time
period between 1940 and 1996. The initial search yielded 156 studies; however, after narrowing
the search down based on certain criteria, 67 studies with 92 effect sizes were included in the
analysis. The selection criteria used were as follows: (a) a direct comparison was reported
between clinical judgment predictions and statistical modeling prediction; (b) a
psychological/mental health prediction was made; (c) the clinician and statistical model had
access to the same information; (d) the same prediction was made by the clinician and the
statistical model; and (e) data had to lend itself to the calculation of effect sizes (Egisdottir et al.,
2006). An initial outlier analysis was conducted along with inclusion of only cross-validated
studies resulted in a total of 41 studies with 48 effect sizes used for this meta-analysis.
Results indicated an effect size of .12 favoring statistical prediction, suggesting a 13%
increase in accuracy when using statistical prediction over clinical judgment (Egisdottir et al.,
2006). In addition to an overall effect size, the meta-analysis examined secondary research
questions thought to influence the difference between the two types of predictions, such as: type
of statistical formula used, amount of information available, information about base rates,
availability of statistical formula to the clinician, and clinical expertness. Results regarding the
type of statistical formula employed in prediction indicated that almost all types of statistical
4
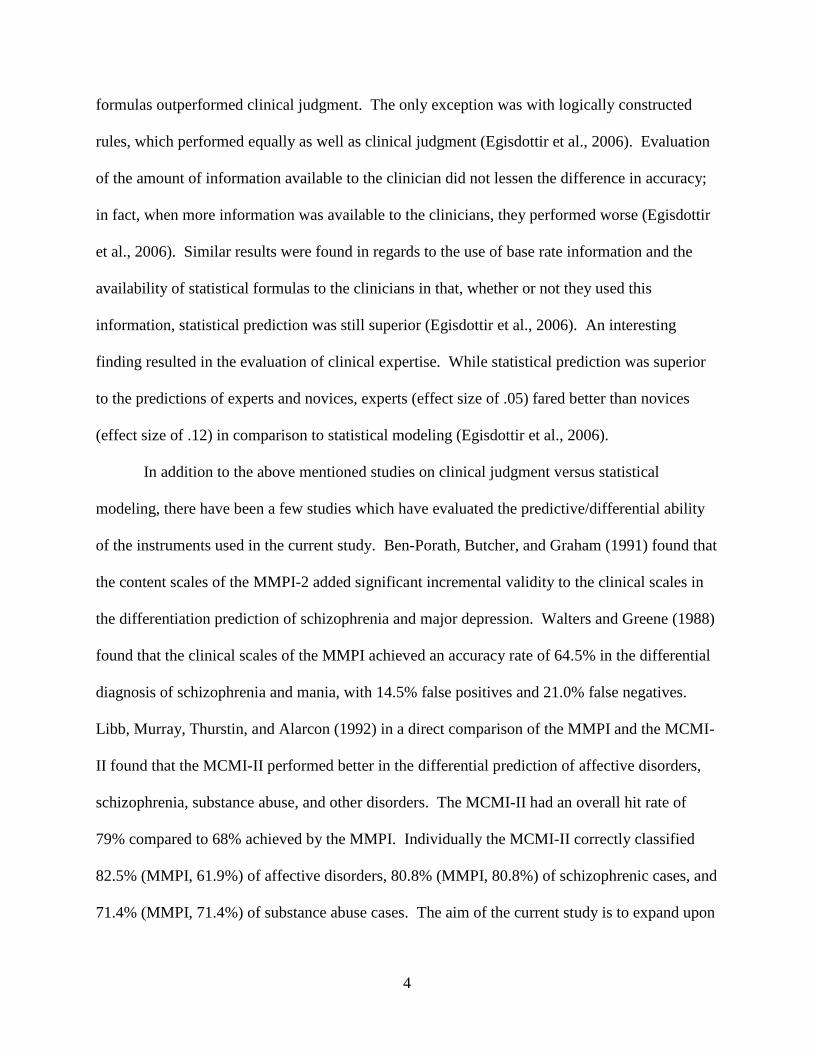
formulas outperformed clinical judgment. The only exception was with logically constructed
rules, which performed equally as well as clinical judgment (Egisdottir et al., 2006). Evaluation
of the amount of information available to the clinician did not lessen the difference in accuracy;
in fact, when more information was available to the clinicians, they performed worse (Egisdottir
et al., 2006). Similar results were found in regards to the use of base rate information and the
availability of statistical formulas to the clinicians in that, whether or not they used this
information, statistical prediction was still superior (Egisdottir et al., 2006). An interesting
finding resulted in the evaluation of clinical expertise. While statistical prediction was superior
to the predictions of experts and novices, experts (effect size of .05) fared better than novices
(effect size of .12) in comparison to statistical modeling (Egisdottir et al., 2006).
In addition to the above mentioned studies on clinical judgment versus statistical
modeling, there have been a few studies which have evaluated the predictive/differential ability
of the instruments used in the current study. Ben-Porath, Butcher, and Graham (1991) found that
the content scales of the MMPI-2 added significant incremental validity to the clinical scales in
the differentiation prediction of schizophrenia and major depression. Walters and Greene (1988)
found that the clinical scales of the MMPI achieved an accuracy rate of 64.5% in the differential
diagnosis of schizophrenia and mania, with 14.5% false positives and 21.0% false negatives.
Libb, Murray, Thurstin, and Alarcon (1992) in a direct comparison of the MMPI and the MCMI-
II found that the MCMI-II performed better in the differential prediction of affective disorders,
schizophrenia, substance abuse, and other disorders. The MCMI-II had an overall hit rate of
79% compared to 68% achieved by the MMPI. Individually the MCMI-II correctly classified
82.5% (MMPI, 61.9%) of affective disorders, 80.8% (MMPI, 80.8%) of schizophrenic cases, and
71.4% (MMPI, 71.4%) of substance abuse cases. The aim of the current study is to expand upon

5
the existing literature by examining and directly comparing the predictive/differential ability of
five widely used personality inventories. This author did not find any previous studies that
compared these instruments regarding Axis II differentiation.
This study compared the statistical predictive ability of the original clinical scales of the
Minnesota Multiphasic Personality Inventory-2 (MMPI-2), the Minnesota Multiphasic
Personality Inventory – Restructured Clinical scales (MMPI-RC), the Ben-Porath Personality
Disorder Scales, the Morey Personality Disorder Scales, and the Personality Pattern scales of the
Millon Clinical Multiaxial Inventory – 3rd
Edition (MCMI-III) in the task of classifying Axis II
diagnostic clusters (See Appendix A & B for brief descriptions of the five inventories and the
associated scales).
MMPI
The Minnesota Multiphasic Personality Inventory (MMPI; Hathaway & McKinley, 1940)
has long been used as an aid in the differential diagnosis of psychopathology. In fact, the
original version of the MMPI was designed to guide differential diagnosis of common clinical
syndromes or disorders (Hathaway, 1964; Hoelzle & Meyer, 2008; Sellbom & Ben-Porath,
2005). In developing the MMPI, Hathaway and McKinley employed a technique called
empirical keying with the goal of creating an instrument which could differentiate between
psychologically distinctive groups. In order to create a scale, Hathaway and McKinley used a
specific criterion group made up of psychiatric inpatients sharing a common diagnosis (e.g.,
depression, schizophrenia, etc.) and a comparison group of non-psychiatric individuals. Scales
were constructed with items that were endorsed in the keyed direction by the psychiatric patients
and not by the comparison group. This procedure produced eight primary scales used to guide
diagnosis: Scale 1 (Hypochondriasis), 2 (Depression), 3 (Hysteria), 4 (Psychopathic Deviance), 6

6
(Paranoia), 7 (Psychasthenia), 8 (Schizophrenia), and 9 (Hypomania) (Hoelzle & Meyer, 2008;
Tellegen, Ben-Porath, McNulty, Arbisi, Graham, & Kaemmer, 2003). Over the next 40 years,
empirical research supported the clinical utility of the MMPI, but it never fully realized its
original purpose of differentiating psychopathology and went untouched for over 40 years. This
resulted in a need for the instrument to be revised (Sellbom & Ben-Porath, 2005).
Unfortunately, even with the revisions (Butcher, Dahlstrom, Graham, Tellegen, &
Kaemmer, 1989) not much changed psychometrically with the instrument. Other than
addressing some outdated language issues, the clinical scales went unchanged. The reason the
original clinical scales were left intact was due to the 50 years of empirical research supporting
the clinical utility of these scales (Sellbom & Ben-Porath, 2005; Tellegen et al., 2003). While
the newly updated MMPI-2 provided contemporary norms and additional content and
supplementary scales, the clinical scales continued to have psychometric problems due primarily
to item overlap and large intercorrelations among the scales (Handel & Archer, 2008; Sellbom &
Ben-Porath, 2005; Simms, Casillas, Clark, Watson, & Doebbeling, 2005; Tellegen et al., 2003).
These psychometric shortcomings made differential diagnosis difficult due to the lack of
discriminant validity. These continued shortcomings once again resulted in more revisions, this
time on a much grander scale.
The Restructured Clinical scales were created to address the psychometric issues of
previous versions of the MMPI. Several studies had consistently found a common or general
factor amongst the clinical scales that was contributing to the high intercorrelations and other
psychometric problems (Eichman, 1961; Millimet, 1970; Simms et al., 2005; Tellegen et al.,
2003). One of the major reasons for the overhauling of the MMPI was the problems the earlier
versions had with discriminative power. Tellegen et al. (2003) undertook the task of correcting
7
the inherent problems of the original “basic nine” scales of the MMPI. Sellbom and Ben-Porath
(2005) summarize the four stage test construction as follows:
Stage 1: Creation of a Demoralization scale that accounted for the general factor
Stage 2: Identification of “core” components for each clinical scale that were distinct and
independent from any other scale
Stage 3: Using the “core” components to develop “seed scales” which would serve as the
foundation for the new RC scales
Stage 4: Build upon the “seed scales” using the remaining items from the original MMPI-
2 item pool to finalize the new RC scales. (pp. 179-180)
What follows is a brief description of each of the four stages of the Restructured Clinical Scales
development. For a more detailed description of the techniques used in the creation of the RC
scales, the reader is referred to the technical manual (Tellegen et al., 2003).
The first stage in the construction of the RC scales was to empirically extract from each
of the clinical scales the general factor, which accounted for a portion of the variance, thus
leading to poor discriminate validity. The items that made up the general factor were extracted
using exploratory factor analysis. These extracted items were then used to create the foundation
of a separate clinical scale. Using Watson’s and Tellegen’s (1985) model of affect, other items
from the MMPI pool that were consistent with their theory were then used to build upon the
foundation of this new scale. What resulted was the “Demoralization” (Rcd) scale.
The second stage of the development consisted of developing a foundational core for
each of the new RC scales (Nichols, 2006; Tellegen et al., 2003). This was accomplished by
another set of factor analyses. Tellegen et al. factored the items from the newly created
Demoralization scale with the items from each of the nine clinical scales. For each analysis, the
8
items that loaded higher on the demoralization factor were eliminated from the original scale.
The items that remained for each of the scales were determined to be the foundational core for
the nine subsequent RC scales. Tellegen et al. (2003) referred to these core scales as “the
distinctive substantive core” (Nichols, 2006).
During the third stage of the developmental process, Tellegen et al. utilized items from
the original MMPI Clinical Scales to build upon the foundational core for each of the nine new
RC scales to create “seed scales”. For an item to be included on a seed scale, it had to meet two
criteria: (a) the item had to correlate higher with its parent Clinical Scale than with any of the
other Clinical Scales and (b) the item could not correlate highly with the Demoralization Scale
(Nichols, 2006). In all, a total of 73 items were used to create the “seed scales” (Tellegen et al.,
2003).
The final stage consisted of augmenting and refining each of the new RC Scales.
Additional items from the original MMPI item pool were analyzed and placed on a “seed scale”
if they met certain criteria. These criteria included: (a) convergence criterion, which meant an
item had to correlate above a minimum value with a specific “seed scale” and (b) discrimination
criterion, which meant an item had to correlate below a maximum value with all of the other
“seed scales” (Tellegen et al., 2003). As noted by Nichols (2006), the minimum and maximum
correlation values differed for each scale. It should also be pointed out that Scales 5
(Masculine/Feminine) and 0 (Social Introversion) were completely removed from the RC version
of the MMPI. A comparison of the Clinical Scales and the RC Scales is provided in Table 1.

9
Table 1
Item Composition for the Clinical and Restructured Clinical (RC)
Scales
Clinical
Scales Length
RC
Scales Length Seed Items
Scale 1 32
RC1 27 15
Scale 2 57
RC2 17 4
Scale 3 60
RC3 15 5
Scale 4 50
RC4 22 5
Scale 6 40
RC6 17 6
Scale 7 48
RC7 24 7
Scale 8 78
RC8 18 6
Scale 9 46
RC9 28 8
RCd 24 Note: Scale 1 = HS - Hypochondriasis; RC1 = Somatic Complaints; Scale 2 = D - Depression;
RC2 = Low Positive Emotions; Scale 3 = Hysteria; RC3 = Cynicism; Scale 4 = Pd -
Psychopathic Deviate; RC4 = Antisocial Behavior; Scale 6 = Pa - Paranoia; RC6 = Ideas of
Persecution; Scale 7 = Pt - Psychasthenia; RC7 = Dysfunctional Negative Emotions; Scale 8 =
Sc - Schizophrenia; RC8 = Aberrant Experiences; Scale 9 = Ma - Hypomania; RC9 =
Hypomanic Activation.
The psychometric properties of the RC scales have been found to be acceptable by
numerous studies such as Handel and Archer (2008); Hoelzle and Meyer (2008); Sellbom, Ben-
Porath, and Graham (2006); Sellbom, Ben-Porath, McNulty, Arbisi, and Graham (2006);
Sellbom and Ben-Porath (2005); Sellbom, Graham, and Schenk (2006); Simms et al. (2005);
Tellegen et al. (2003); and Wallace and Liljequist (2005).
Alternative MMPI Personality Disorder Scales
The introduction of the third edition of the Diagnostic and Statistical Manual of Mental
Disorder (DSM-III, American Psychiatric Association, 1980) brought about significant changes
to the diagnostic and classification process. The DSM-III introduced a multidimensional model
of classification in which personality disorders would now be classified on a different axis and
separate from clinical syndromes. This change in the diagnostic process brought with it the
10
introduction of new assessment tools and instruments such as the MCMI. This also informed
changes to the MMPI.
The original purpose of the MMPI was to measure pathologic personality conditions or
what we now call Axis I syndromes, but it was believed the MMPI contained a rich item pool
which could have diagnostic utility for the assessment of personality disorders or the new Axis II
classifications (Hicklin & Widiger, 2000; Morey, Waugh, & Blashfield, 1985). In 1985, Leslie
Morey, Waugh, and Blashfield (1985) set out to devise reliable and valid personality disorder
scales using existing items from the MMPI.
A rational and empirical method was used to devise the scales. The first step in the
process was to have four experienced clinical psychologists search the MMPI for items they
believed represented the criteria for DSM-III personality disorders. Items were included for a
scale if two of the four clinicians had selected that item for a particular scale and items could be
included on multiple scales. The second phase included empirical analyses of the scales to
establish sound psychometric properties. This included item analysis to examine the
discriminative utility of each item. If an item could not statistically discriminate between high
and low scores on its scale, it was dropped from the scale. This process continued until each
scale achieved stabilization. Ultimately 11 personality disorder scales were created which
included: Paranoid (PAR), Schizoid (SZD), Borderline (BDL), Compulsive (CPS), Passive-
Aggressive (PAG), Narcissistic (NAR), Antisocial (ANT), Histrionic (HST), Schizotypal (STY),
Dependent (DEP), and Avoidant (AVD) (Hicklin & Widiger, 2000; Morey, Waugh, &
Blashfield, 1985). The 11 scales were comprised of a total of 265 (164 non-overlap) items with
scale length ranging from 14 (Passive-Aggressive) to 38 (Avoidant), with a mean of 24 items per
scale.

11
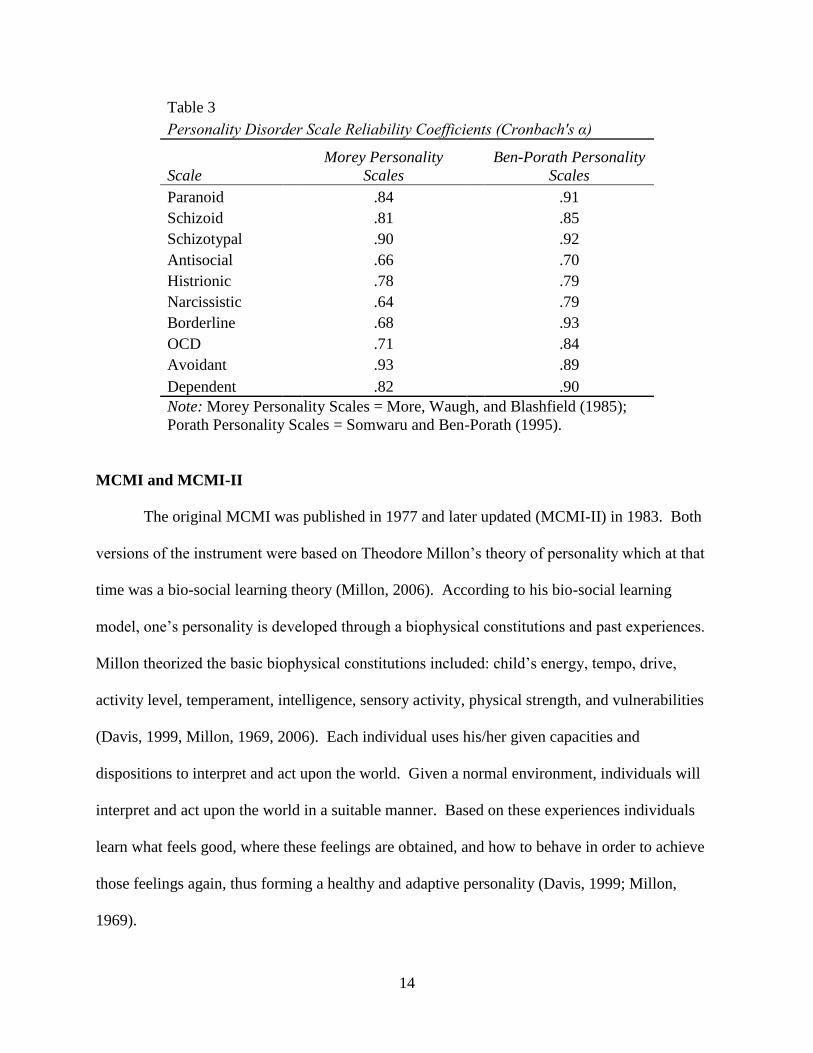
The personality disorder scales of the MMPI created by Morey et al. (1985) have
consistently been shown to have adequate psychometric properties. A full description of the
internal consistencies is listed in Table 3. For initial information on the psychometric properties
the reader is referred to Morey et al. (1985). Since the creation of these scales in 1985, a
significant amount of research has been done to demonstrate the validity of the scales (Dubro &
Wetzler, 1989; Hills, 1995; McCann, 1989, 1991; Miller, Streiner, & Parkinson, 1992; Morey &
Le Vine, 1988; O’Maille & Fine, 1995; Streiner & Miller, 1988; Trull, 1993; Trull & Larson
1994; Zarrella, Schuerger, & Ritz, 1990).
The publication of the fourth edition of the Diagnostic and Statistical Manual of Mental
Disorder (DSM-IV, American Psychiatric Association, 1994) created a need for revised
personality disorder scales derived from the MMPI. Additionally, since Morey et al. (1985)
created the original MMPI personality disorder scales, the MMPI underwent a revision as well.
In 1989 the second edition of the inventory (Minnesota Multiphasic Personality Inventory – 2;
Butcher et al., 1989) was released with revised and updated items.
Somwaru and Ben-Porath (1995) used similar methodology to that of Morey et al. (1985)
in the derivation of their MMPI-2 personality disorder scales. They utilized three clinical
psychologists who were familiar with the DSM-IV criteria for personality disorders. These three
psychologists rationally selected items from the MMPI-2 item pool which they believed
represented specific criteria for the diagnosis of personality disorders. Their hand-selected items
were then used to create scales representing each of the 10 personality disorders in the DSM-IV.
Once the 10 scales were created they were subjected to a series of internal consistency analyses
until adequate stabilization was achieved. The 10 scales created by Somwaru and Ben-Porath
(1995) included: Paranoid (PAR), Schizoid (SZD), Borderline (BDL), Compulsive (CPS),
12
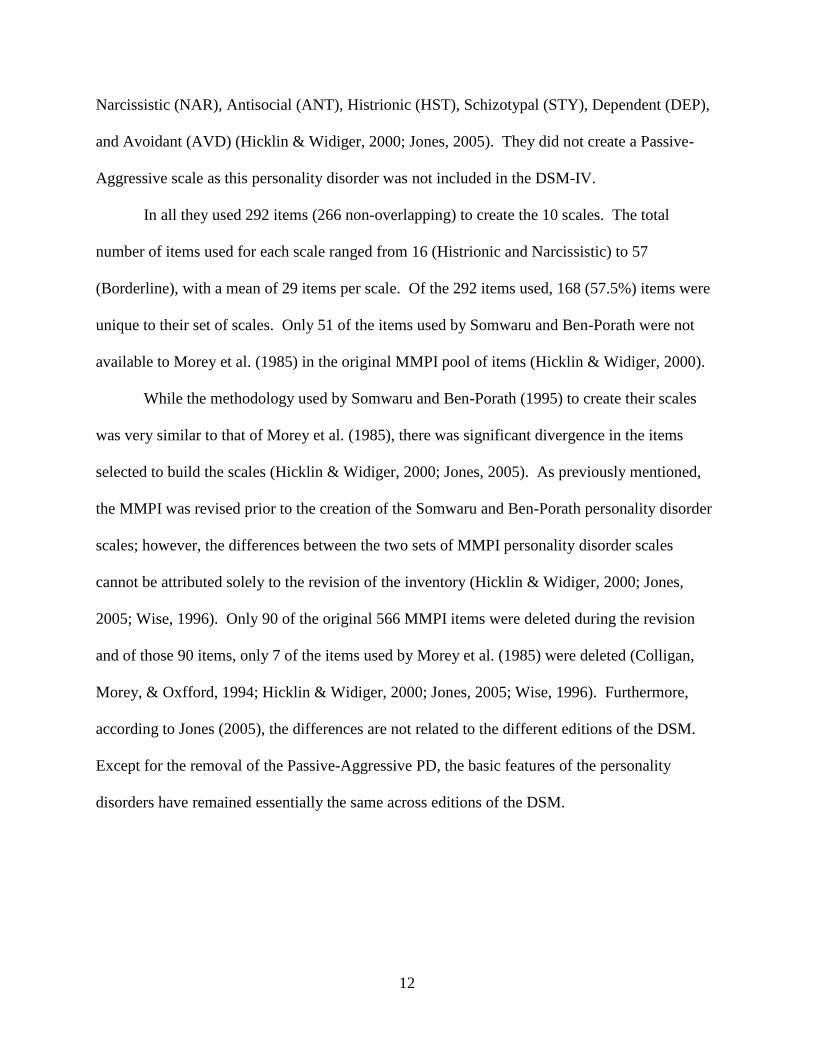
Narcissistic (NAR), Antisocial (ANT), Histrionic (HST), Schizotypal (STY), Dependent (DEP),
and Avoidant (AVD) (Hicklin & Widiger, 2000; Jones, 2005). They did not create a Passive-
Aggressive scale as this personality disorder was not included in the DSM-IV.
In all they used 292 items (266 non-overlapping) to create the 10 scales. The total
number of items used for each scale ranged from 16 (Histrionic and Narcissistic) to 57
(Borderline), with a mean of 29 items per scale. Of the 292 items used, 168 (57.5%) items were
unique to their set of scales. Only 51 of the items used by Somwaru and Ben-Porath were not
available to Morey et al. (1985) in the original MMPI pool of items (Hicklin & Widiger, 2000).
While the methodology used by Somwaru and Ben-Porath (1995) to create their scales
was very similar to that of Morey et al. (1985), there was significant divergence in the items
selected to build the scales (Hicklin & Widiger, 2000; Jones, 2005). As previously mentioned,
the MMPI was revised prior to the creation of the Somwaru and Ben-Porath personality disorder
scales; however, the differences between the two sets of MMPI personality disorder scales
cannot be attributed solely to the revision of the inventory (Hicklin & Widiger, 2000; Jones,
2005; Wise, 1996). Only 90 of the original 566 MMPI items were deleted during the revision
and of those 90 items, only 7 of the items used by Morey et al. (1985) were deleted (Colligan,
Morey, & Oxfford, 1994; Hicklin & Widiger, 2000; Jones, 2005; Wise, 1996). Furthermore,
according to Jones (2005), the differences are not related to the different editions of the DSM.
Except for the removal of the Passive-Aggressive PD, the basic features of the personality
disorders have remained essentially the same across editions of the DSM.

13
Table 2
Comparison of Morey, Waugh, and Blashfield (1985) and Somwaru and Ben-Porath (1995)
MMPI-2 Personality Disorder Scales
Morey et al.
(1985)
Somwaru and Ben-Porath
(1995)
Scale Shared Total Unique Deleted
Total Unique New
Paranoid 9 22 13 0
27 18 0
Schizoid 13 20 7 2
26 13 5
Schizotypal 15 35 20 1
39 24 3
Antisocial 15 23 8 2
28 13 4
Borderline 12 22 10 0
57 45 19
Histrionic 9 20 10 0
16 7 1
Narcissistic 7 31 24 0
16 9 2
Avoidant 21 38 17 0
35 14 5
Dependent 13 20 7 0
29 16 7
Obsessive-Compulsive 10 13 3 2
19 9 5
Total 124 244 119 7 292 168 51
Note: shared = number of items that appear on both the Morey et al. (1985) and Somwaru and
Ben-Porath (1995) scales; deleted = number of items deleted in the revision of the MMPI to the
MMPI-2; new = number of items that appeared on the MMPI-2 and not the MMPI.
Some of the differences can be attributed to the 107 new items added to the MMPI-2;
however, 70% of the unique items used in the Somwaru and Ben-Porath scales were available to
Morey et al. (1985). Another major difference between the two sets of scales is in the amount of
overlapping items used. The Morey et al. (1985) scales had 101 overlapping items, with only 26
overlapping items in the scales created by Somwaru and Ben-Porath (1995). See Table 2 for a
comparison of the items selected by Ben-Porath (1995) and Morey et al. (1985) for their
equivalent personality scales. Studies by Jones (2005), Hicklin and Widiger (2010), and
Somwaru and Ben-Porath (1995) have shown the psychometric properties of the personality
scales to be adequate. A full description of the reliability coefficients are listed in Table 3 for
both the Morey and Ben-Porath personality disorder scales.
14
Table 3
Personality Disorder Scale Reliability Coefficients (Cronbach's α)
Scale
Morey Personality
Scales
Ben-Porath Personality
Scales
Paranoid
.84
.91
Schizoid
.81
.85
Schizotypal
.90
.92
Antisocial
.66
.70
Histrionic
.78
.79
Narcissistic
.64
.79
Borderline
.68
.93
OCD
.71
.84
Avoidant
.93
.89
Dependent .82 .90
Note: Morey Personality Scales = More, Waugh, and Blashfield (1985);
Porath Personality Scales = Somwaru and Ben-Porath (1995).
MCMI and MCMI-II
The original MCMI was published in 1977 and later updated (MCMI-II) in 1983. Both
versions of the instrument were based on Theodore Millon’s theory of personality which at that
time was a bio-social learning theory (Millon, 2006). According to his bio-social learning
model, one’s personality is developed through a biophysical constitutions and past experiences.
Millon theorized the basic biophysical constitutions included: child’s energy, tempo, drive,
activity level, temperament, intelligence, sensory activity, physical strength, and vulnerabilities
(Davis, 1999, Millon, 1969, 2006). Each individual uses his/her given capacities and
dispositions to interpret and act upon the world. Given a normal environment, individuals will
interpret and act upon the world in a suitable manner. Based on these experiences individuals
learn what feels good, where these feelings are obtained, and how to behave in order to achieve
those feelings again, thus forming a healthy and adaptive personality (Davis, 1999; Millon,
1969).
15
However, under abnormal environments individuals may succumb to pressures and
demands resulting in the formation of negative behavioral patterns and coping strategies that are
contrary to their natural dispositions. According to Millon, this process resulted in maladaptive
personality styles or personality disorders (Davis, 1999; Millon, 1969). The first and second
editions of the MCMI were designed to measure Axis I and Axis II syndromes based on Millon’s
bio-social learning theory. According to Millon, both play a role in an individual’s functional
style. Millon theorized that Axis I syndromes accentuate the basic personality style and that
evaluating for both Axis I and Axis II syndromes would provide beneficial information for a
therapist (Millon, 2006).
The MCMI and MCMI-II consisted of the following scales: Schizoid; Avoidant;
Dependent; Histrionic; Narcissistic; Antisocial; Sadistic (Aggressive); Compulsive; Negativistic
(Passive-Aggressive); Masochistic (Self-Defeating); Schizotypal; Borderline; Paranoid; Anxiety;
Somatoform; Bipolar: Manic; Dysthymia; Alcohol Dependence; Drug Dependence; Thought
Disorder; Major Depression; Delusional Disorder; and validity scales. While the MCMI-II is an
updated version of the MCMI-I, Craig and Weinberg (1993) in an extensive literature review
reported that little, if any differences were found among the two versions.
MCMI-III and MCMI-III Revised
In the early 1990s a decision was made to revise the MCMI-II based on theoretical,
professional, and empirical concerns (Millon, 2006). Whereas as the MCMI-I and MCMI-II
were based on a bio-social learning theory, Millon’s model of personality shifted to one based on
evolutionary theory (Davis, 1999). According to Millon, each individual possess a limited set of
genes that are passed down from generation to generation and serve as personality trait
potentials. Similar to other evolutionary theories outside the field of psychology, Millon
16
theorized that both phylogenesis and ontogenesis played a role in the formation and expression
of one’s personality style. In phylogenesis, genes are passed down from generation to generation
based on the usefulness they serve to the species. Over successive generations, the proportion
and frequency of these genes passed down will likely change based on how well the expressed
traits function for the species (Choca, 1999; Davis, 1999; Millon, 1990).
According to Millon, an individual’s unique personality is determined by ontogenesis. In
ontogenesis, an individual organism (i.e., a child) is born with a limited set of genes or trait
potentials. Which traits become prominent and salient is determined by the organism’s
interaction with its environment. Stable and enduring personality styles are established as
underlying personality trait potentials change to expressed styles of perceiving, feeling, thinking,
and acting (Choca, 1999; Davis, 1999; Millon, 1990). The development of personality disorders
occurs when individuals develop maladaptive styles for interacting with the environment.
Millon describes the human existence as an individual’s struggle with pleasure versus
pain, an individual’s efforts to engage in their environment either passively or actively, and one’s
strategy to make reproductive investments as either self-focused or other focused (Millon, 1990;
Millon & Davis, 1996). The measurement of personality characteristics on the MCMI-III is
based on these three polarities. When one’s personality style falls to either extreme end of the
polarities, a personality disorder is said to be present. Additional details of Millon’s taxonomy
of personality disorders will be provided later in this paper.
Unlike the MMPI, the MCMI is theoretically based and was constructed to provide
correspondence with the Diagnostic and Statistical Manual – 4th
Edition (DSM-IV). As the
DSM-IV was published after the MCMI-II was constructed, the MCMI-III replaced 95 questions
from the MCMI-II in order to reflect the current criteria of the DSM-IV. Additionally, two new
17
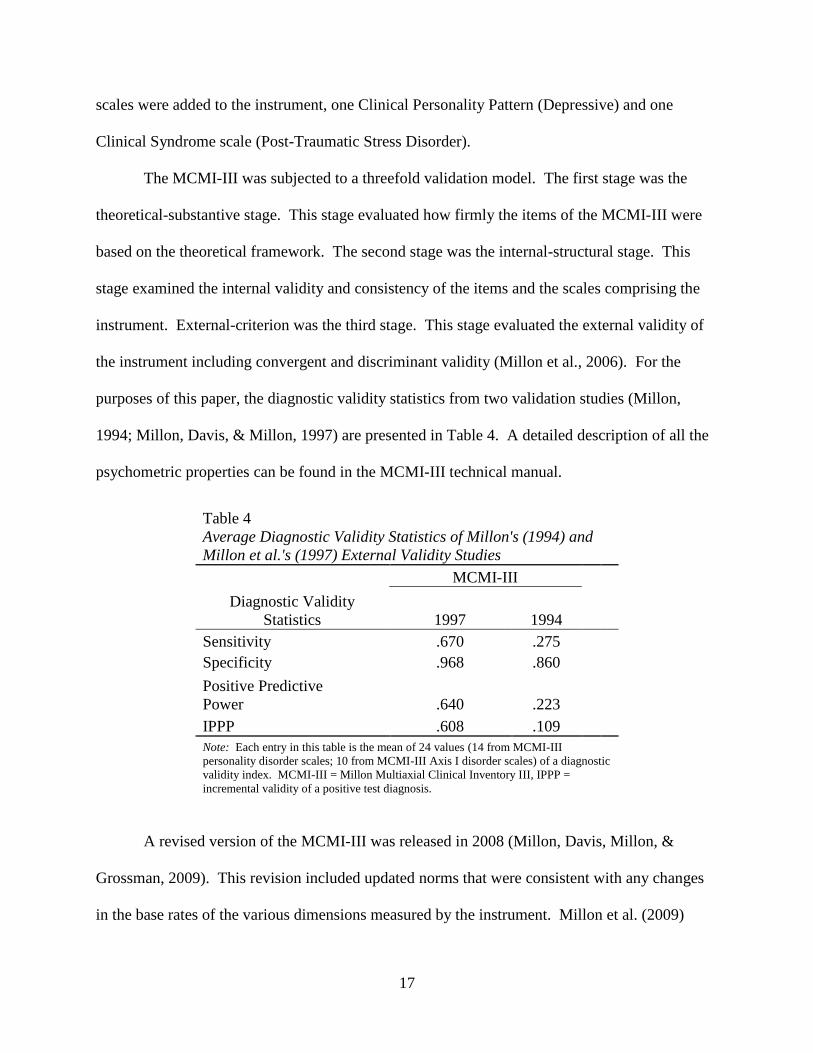
scales were added to the instrument, one Clinical Personality Pattern (Depressive) and one
Clinical Syndrome scale (Post-Traumatic Stress Disorder).
The MCMI-III was subjected to a threefold validation model. The first stage was the
theoretical-substantive stage. This stage evaluated how firmly the items of the MCMI-III were
based on the theoretical framework. The second stage was the internal-structural stage. This
stage examined the internal validity and consistency of the items and the scales comprising the
instrument. External-criterion was the third stage. This stage evaluated the external validity of
the instrument including convergent and discriminant validity (Millon et al., 2006). For the
purposes of this paper, the diagnostic validity statistics from two validation studies (Millon,
1994; Millon, Davis, & Millon, 1997) are presented in Table 4. A detailed description of all the
psychometric properties can be found in the MCMI-III technical manual.
Table 4
Average Diagnostic Validity Statistics of Millon's (1994) and
Millon et al.'s (1997) External Validity Studies
MCMI-III
Diagnostic Validity
Statistics 1997 1994
Sensitivity .670 .275
Specificity .968 .860
Positive Predictive
Power .640 .223
IPPP .608 .109
Note: Each entry in this table is the mean of 24 values (14 from MCMI-III
personality disorder scales; 10 from MCMI-III Axis I disorder scales) of a diagnostic
validity index. MCMI-III = Millon Multiaxial Clinical Inventory III, IPPP =
incremental validity of a positive test diagnosis.
A revised version of the MCMI-III was released in 2008 (Millon, Davis, Millon, &
Grossman, 2009). This revision included updated norms that were consistent with any changes
in the base rates of the various dimensions measured by the instrument. Millon et al. (2009)
18
anticipated that there might be an increase in the number of subjects who have elevations on the
Major Depression (CC), Bipolar: Manic (N), and Drug Dependence (T) scales, and a potential
decrease in the number of patients who display elevation on the Masochistic (8B) scale.
Although the original MCMI-III norms were gender specific, the norms derived in 2008 did not
distinguish between males and females, similar to the most recent version of the MMPI.
Millon’s Theory and DSM-V Personality Disorder Changes
Millon’s theory is far too complex for a detailed description in this paper; however, a
brief summary follows in order to provide the reader with a rudimentary understanding of how
his theory influenced the classification of personality disorders. The classification of personality
disorders according to Millon’s evolutionary theory are based on three domains or polarities.
The three domains are Aims of Existence (pleasure-pain polarity), Modes of Adaptation (passive-
active polarity), and Strategies of Replication (self-other polarity) (Choca, 1999; Davis, 1999;
Millon, Davis, Millon, Escovar, & Meagher, 2000; Widiger, 1999).
According to Millon, the most important task for any organism is to survive. In order to
survive an organism must first achieve existence and then preserve that existence. In a
psychological perspective, the aim of existence is the enhancement of life (pleasure) and the aim
of preservation is the avoidance of harmful events (pain) (Millon et al., 2000). Within normal
personality, an individual devises strategies to achieve balance between pleasure seeking and
pain avoiding behaviors. On the other hand, personality disorders can begin to emerge when an
individual’s behaviors or mind set become too focused on either pleasure seeking or avoiding
pain (Davis, 1999).
Once an organism exists, it must take on an accommodating (passive) or modifying
(active) strategy in order to differentiate itself from the larger system. In other words, an

19
individual who adopts a passive approach to life will attempt to merely “fit in” or adapt to the
environment around them. Individuals who adopts an active approach to life will seek to change
or adapt the environment to fit their needs (Millon et al., 2000). Similar to the first polarity,
individuals who achieves balance between active and passive engagement with their
surroundings are said to be functioning normally; however, engaging one’s environment too
actively or passively may result in personality disorders (Davis, 1999).
Lastly according to Millon et al. (2000), an organism must adopt a strategy of
reproduction that is either self-predicating (self) or nurturing (other). In biological terms, an
organism that is focused on the self will produce as many offspring as possible, while an
organism that is other focused has few offspring and expends his/her energy caring for them. In
psychological terms, a self-focused individual is said to be egoistic, insensitive, inconsiderate,
and uncaring. An other-focused individual is more affiliative, intimate, protective, and solicitous
(Davis, 1999; Millon et al., 2000). Once again, a balanced focus between self and other results
in healthy functioning, while too much focus on self or other leads to maladaptive functioning
(Davis, 1999).
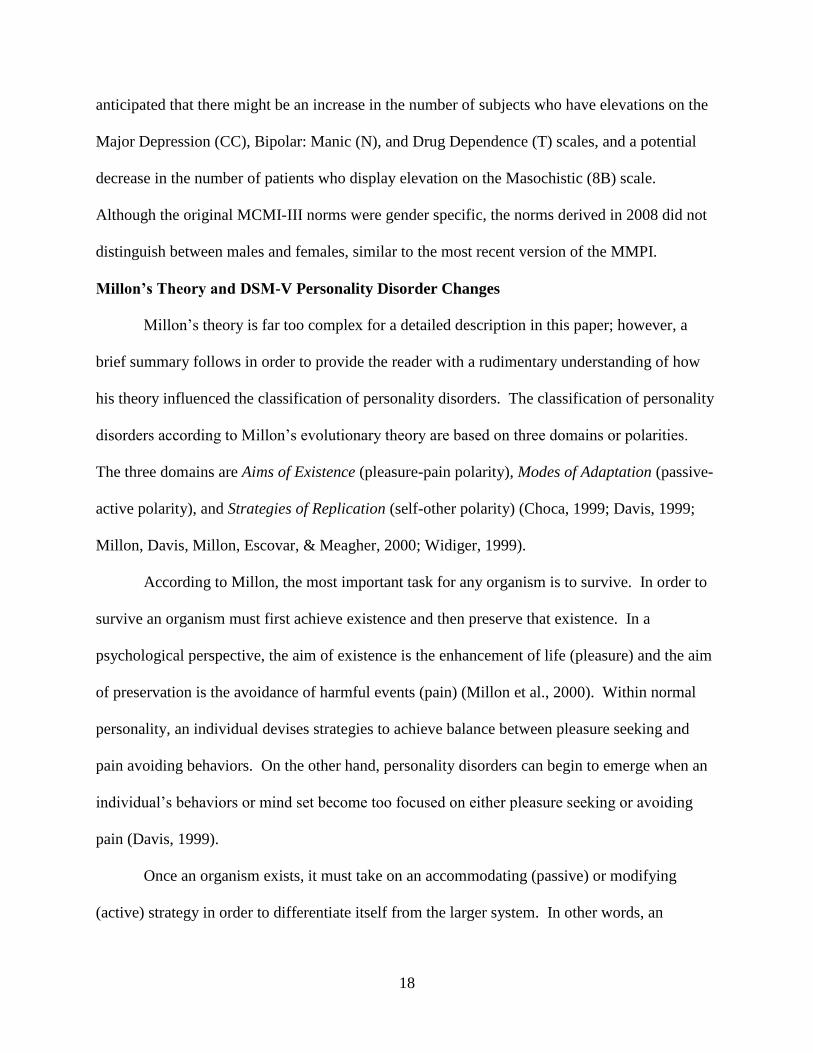
According to Millon’s evolutionary and polarity theory, combinations and degrees of
each polarity constitute differing personality prototypes (Choca, 1999; Davis, 1999; Millon et al.,
2000). For example, the Antisocial Personality Prototype is low on the pain, passive, and other
domains, and high on the active domain. The Schizoid Personality Prototype is low on the
pleasure, pain, active, and other domains, and high on the passive domain (Choca, 1999). See
Figure 1 for a description of each of the personality disorders as they relate to Millon’s domains.
20
FIGURE 1. Personality Circulargram I: Normal and abnormal personality patterns. Evolutionary foundations of
the normal and abnormal extremes of each personality prototype of the 15 spectra. I: Existential orientation; II:
Normal prototype; III: Abnormal prototype; IV: Adaptation style; V: MCMI–III scale number/letter. RS = Retiring
Schizoid, ES = Eccentric Schizotypal, SA = Shy Avoidant, CD = Cooperative Dependent, EM = Exuberant
Hypomanic, SH = Sociable Histrionic, CN = Confident Narcissistic, SP = Suspicious Paranoid, NA =
Nonconforming Antisocial, PM = Pessimistic Melancholic, AM = Aggrieved Masochistic, SN = Skeptical
Negativistic, CB = Capricious Borderline, CC = Conscientious Compulsive (Strack & Millon, 2007).

21
Millon theorizes that individuals can exhibit characteristics of many personality disorders
and therefore, individuals cannot be classified in merely a categorical manner. Thus, his
personality prototypes take on a categorical and a dimensional nature (Choca, 1999). Using a
dimensional approach to the classification of personality disorders allows clinicians to get a more
individualized picture of their clients. Millon’s theory and personality prototypes have informed
the development of the classification criteria for Axis II disorders in the DSM-III, DSM-IV, and
DSM-IV-TR (Choca, 1999; Davis, 1999; Widiger, 1999).
While Millon may not have had as much of a direct influence on the DSM-V, the new
classification system of Axis II disorders appears to be even more congruent with his theory than
in previous editions. In contrast to previous editions, the DSM-V has adopted a dimensional
approach regarding the classification of personality disorders. This was done to address the issue
of comorbidity and overlapping diagnostic criteria which has been an issue in previous editions
of the DSM (American Psychiatric Association, 2012).
The DSM-V will discontinue the categorization of personality disorders, opting rather to
describe them in terms of impairing characteristics and levels of severity. The 10 personality
disorders that are currently outlined in the DSM-IV-TR will be reduced to 6 personality disorder
types. The 6 types of personality disorder types will include: Antisocial, Avoidant, Borderline,
Narcissistic, Obsessive/Compulsive, and Schizotypal. The remaining 3 personality disorder
classifications, along with “Personality Disorder Not Otherwise Specified (NOS)” will be
lumped into a new classification type, referred to as “Personality Disorder Trait Specified
(PDTS)”. The PDTS classification will also be described by the specific impairing personality
trait or characteristic and by the level of severity (American Psychiatric Association, 2012).
22
This study utilized a hybrid model of the classification systems of the DSM-IV-TR and
the DSM-V in order to classify individuals with personality disorders. Rather than solely using
categorically specific diagnoses (i.e. Antisocial PD or Borderline PD), this researcher adopted a
trait/characteristic approach to classify personality disorders, similar to that of the DSM-V.
Personality traits and characteristics were used to classify and group research participants in
accordance with the personality disorder clusters (See Appendix C for description of clusters)
described in the DSM-IV-TR.
23
CHAPTER TWO
PURPOSE OF THIS STUDY
The purpose of this study was to conduct an evaluation of the statistical predictive ability
of the original Clinical Scales of the Minnesota Multiphasic Personality Inventory-2 (MMPI-2),
the Minnesota Multiphasic Personality Inventory – Restructured Clinical scales (MMPI-RC), the
Ben-Porath Personality Disorder Scales, the Morey Personality Disorder Scales, and the
Personality Pattern scales of the Millon Clinical Multiaxial Inventory – 3rd
Edition (MCMI-III)
in the task of classifying Axis II diagnostic clusters. Participants with Axis II discharge
diagnoses were grouped according to DSM-IV-TR personality disorder clusters and the
personality disorder clusters were closely aligned with Millon’s grouping of personality
disorders.
Additionally, this study sought to contribute to the body of literature in the area of
personality assessment. This was accomplished by directly comparing each clinical measure in
order to evaluate its usefulness, with the expectation that the MCMI-III will be shown to be the
most useful measure for the purposes of Axis II diagnosis. This result was expected based in
part on the design of the MCMI-III. Millon theoretically designed the instrument to measure
Axis II disorders. Furthermore, the characteristics of the personality disorders and the
subsequent personality disorder clusters found in the DSM-IV-TR were influenced by Millon’s
theory.
Establishing the statistical ability of these instruments to predict Axis II diagnoses will
aid clinicians in the diagnostic process. A better understanding of the psychometric properties of
personality inventories will help clinicians know how to more effectively utilize these
instruments in practice and will ultimately lead to more accurate diagnosing.

24
CHAPTER THREE
METHOD
Participants and Setting
This sample consisted of 440 inpatients hospitalized in a psychiatric facility in a
Midwestern city. MMPI-2 protocols were excluded for nonresponsiveness if omitted items were
≥ 32, TRIN raw scores ≤ 5 or ≥ 13, or Fp T scores > 100. MCMI-III protocols were excluded if
2 or more items on scale V were endorsed (Morgan, Schoenberg, Dorr, & Burke, 2002). Of the
440 individuals, 47.5% were male and 52.5% were female. The sample participants had a mean
age of 34 years and 12.8 years of education. The sample was predominately White (88.3%).
Other reported ethnicities included African-American (6.1%), Native American (3%), Hispanic
(1.6%), Asian (.5%), and "other" (.5%). Diagnoses for this sample are as follows: 60% mood
disorders, 8.3% schizophrenic and other psychotic disorders, 6.7% substance abuse disorders,
4.3% anxiety disorders, and 13.8% "other". Additionally, 45% (N = 200) of this sample was
given a comorbid Axis II diagnosis. The 200 individuals with Axis II diagnoses were the focus
of this study. The additional 240 participants were assigned into a separate group as those
without an Axis II diagnosis.
Patient diagnoses were based on DSM-IV-TR criteria and were made at discharge by a
multidisciplinary treatment team that was led by a staff psychiatrist. Patient’s histories,
observations, progress notes, team discussions, and findings from medical procedures were all
used in the diagnostic process. This type of diagnostic process is in line with the findings of
Kenrick and Funder (1988) which indicated that to accurately evaluate personality, diagnoses
should be based on multiple data points and multiple behavioral observations. Subjects were
then grouped into three general Axis II categories in accordance with Millon’s theory and DSM-
25
IV-TR Axis II cluster A, cluster B, and cluster C. Due to a small sample size, participants with a
Cluster A diagnosis were not included in any analysis.
Measures
Minnesota Multiphasic Personality Inventory-2 (MMPI-2)
The MMPI-2 (Butcher, Graham, Ben-Porath, Tellegen, Dahlstrom, & Kaemmer et al.,
2001) is a self-report measure consisting of 567 items designed to measure patterns of
personality and psychopathology. Respondents answer the 567 items in a true-false format
depending on whether the statement applies to them. Reliability and validity of the MMPI-2
have been empirically supported in countless studies including Butcher and Williams (2000) and
Graham (2006). Protocols were scored using NCS and Pearson Assessment's computerized
scoring program Microtest-Q which calculates scaled scores reported as T-scores.
Morey (MMPI) Personality Scales
Morey, Waugh, and Blashfield (1985) utilized 265 items of the original 567 MMPI items
to create 11 scales purported to measure the 11 personality disorders of the DSM-III. The scales
include: Paranoid; Schizoid; Borderline; Compulsive; Passive-Aggressive; Narcissistic;
Antisocial; Histrionic; Schizotypal; Dependent; and Avoidant. Reliability coefficients range
from .675 (CPS) to .859 (AVD). A full description of the reliability coefficients are listed in
Table 3.
Ben-Porath (MMPI) Personality Scales
Somwaru and Porath (1995) utilized 292 items of the original 567 MMPI items to create
10 scales that measured characteristics of the following personality disorders as defined by the
DSM-IV-TR, these scales included: Paranoid (PAR), Schizoid (SZD), Borderline (BDL),
Compulsive (CPS), Narcissistic (NAR), Antisocial (ANT), Histrionic (HST), Schizotypal (STY),
26
Dependent (DEP), and Avoidant (AVD). Reliability coefficients range from .70 (ANT) to .93
(BDL). A full description of the reliability coefficients are listed in Table 3.
Millon Clinical Multiaxial Inventory-Third Edition (MCMI-III)
The MCMI-III (Millon, Millon, Davis, & Grossman, 2006) is a self-report measure
consisting of 175 items also designed to measure patterns of personality and psychopathology.
Each of the 175 items is answered in a true-false format depending on whether the statement
applies to the respondent. Psychometric characteristics of the MCMI-III including reliability and
validity can be found in the technical manual (Millon et al., 2006).
All MCMI-III protocols were scored using NCS and Pearson Assessment's computerized
scoring program Microtest-Q which calculates scale scores reported as Base Rate (BR) scores.
Base Rate scores, as opposed to T-scores, take into account the base rate or prevalence rate of the
disorder being measured; thus, accounting for the non-normal distribution of psychopathology in
the population.
Procedure
Subjects were administered the MMPI-2 and MCMI-III during their inpatient hospital
stay as part of treatment or evaluation. Tests were administered by either a Licensed
Psychologist or Psychology Intern who provided both written and verbal instructions to each
subject prior to testing. All protocols were scored using NCS and Pearson Assessment's
computerized scoring program Microtest-Q by a trained psychometrist. Scores for the Morey
personality scales and the Ben-Porath personality scales were obtained using an SPSS scoring
system as per criteria established by the authors of the scales.

27
Analysis
Individual discriminant function models were created for each of the inventories in this
study and the predictive ability of the inventories was first evaluated independently of the other
inventories. Following an evaluation of each inventory’s statistical predictive ability, diagnostic
validity statistics were used as secondary analysis. This study evaluated the “positive predictive
power (PPP)” and the “incremental validity of positive test diagnoses (IPPP)” of the MCMI-III,
the Morey (MMPI) personality scales, and the Ben-Porath (MMPI) personality scales. These
three instruments were chosen for secondary analysis as each was specifically designed to
measure Axis II pathology.
28
CHAPTER FOUR
RESULTS
The clinical usefulness of the psychological inventories in this study was evaluated
through quantitative analysis. The first step in this evaluation utilized Discriminant Function
Analysis (DA) in order to examine the overall ability of each inventory in the classification of
personality clusters.
Discriminant Analyses. An analysis was performed with Axis II discharge diagnosis as
the grouping variable and the MMPI Clinical scales 1 (Hypochondriasis), 2 (Depression), 3
(Hysteria), 4 (Psychopathic Deviance), 6 (Paranoia), 7 (Psychasthenia), 8 (Schizophrenia), and 9
(Hypomania) of the MMPI-2 as the discriminating variables. The overall Chi-square test was
significant (Wilks λ = .794, Chi-square = 84.039, df = 16, Canonical correlation = .373, p <
.001); the two functions extracted accounted for approximately 21% of the variance in diagnosis.
Table 5 presents the standardized discriminant function coefficients and structure weights. Table
6 shows the two functions at the group centroids. Results displayed in these tables indicate that
function one, which includes scales 4, 6, 8, and 9, discriminate Cluster B from the other groups.
Function two, which includes scales 2, 7, 1, and 3 discriminate Cluster C from the other groups.
Overall the discriminant function successfully predicted outcome for 55.8% of cases.
Classification results are displayed in Table 7.
Figure 2 presents a graphic representation of the mean MMPI profiles for the three
groups. The Cluster B group displays peaks on scales 2 (Depression) and 8 (Schizophrenia), the
Cluster C group shows peaks on scales 2 (Depression) and 3 (Hysteria), and the group without an
Axis II diagnosis manifest peaks on scales 2 (Depression) and 3 (Hysteria). While the overall
29
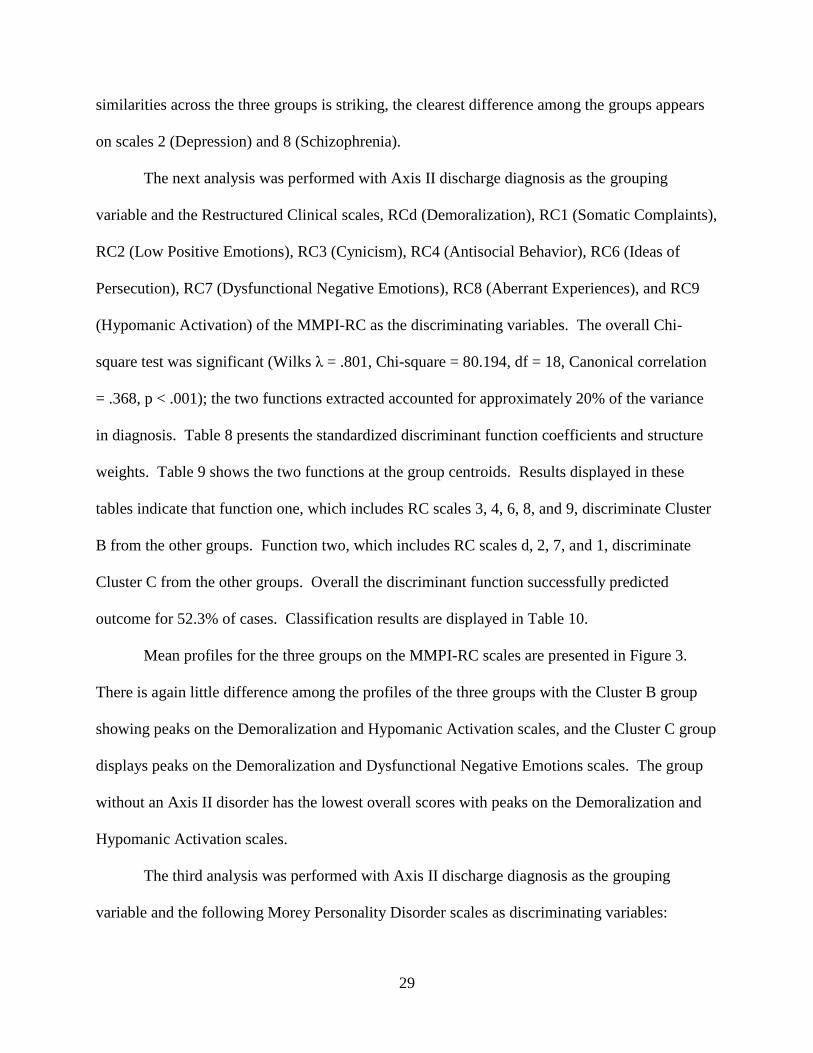
similarities across the three groups is striking, the clearest difference among the groups appears
on scales 2 (Depression) and 8 (Schizophrenia).
The next analysis was performed with Axis II discharge diagnosis as the grouping
variable and the Restructured Clinical scales, RCd (Demoralization), RC1 (Somatic Complaints),
RC2 (Low Positive Emotions), RC3 (Cynicism), RC4 (Antisocial Behavior), RC6 (Ideas of
Persecution), RC7 (Dysfunctional Negative Emotions), RC8 (Aberrant Experiences), and RC9
(Hypomanic Activation) of the MMPI-RC as the discriminating variables. The overall Chi-
square test was significant (Wilks λ = .801, Chi-square = 80.194, df = 18, Canonical correlation
= .368, p < .001); the two functions extracted accounted for approximately 20% of the variance
in diagnosis. Table 8 presents the standardized discriminant function coefficients and structure
weights. Table 9 shows the two functions at the group centroids. Results displayed in these
tables indicate that function one, which includes RC scales 3, 4, 6, 8, and 9, discriminate Cluster
B from the other groups. Function two, which includes RC scales d, 2, 7, and 1, discriminate
Cluster C from the other groups. Overall the discriminant function successfully predicted
outcome for 52.3% of cases. Classification results are displayed in Table 10.
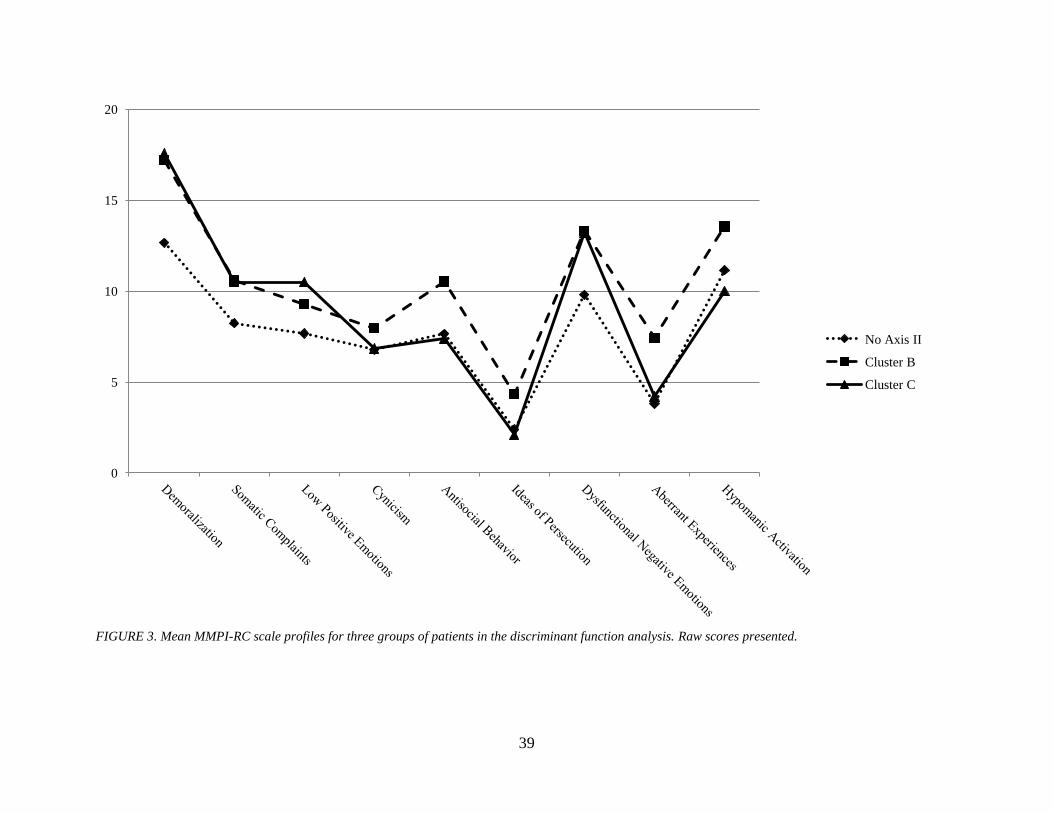
Mean profiles for the three groups on the MMPI-RC scales are presented in Figure 3.
There is again little difference among the profiles of the three groups with the Cluster B group
showing peaks on the Demoralization and Hypomanic Activation scales, and the Cluster C group
displays peaks on the Demoralization and Dysfunctional Negative Emotions scales. The group
without an Axis II disorder has the lowest overall scores with peaks on the Demoralization and
Hypomanic Activation scales.
The third analysis was performed with Axis II discharge diagnosis as the grouping
variable and the following Morey Personality Disorder scales as discriminating variables:

30
Antisocial (ANT), Histrionic (HST), Dependent (DEP), Avoidant (AVD), Borderline (BDL),
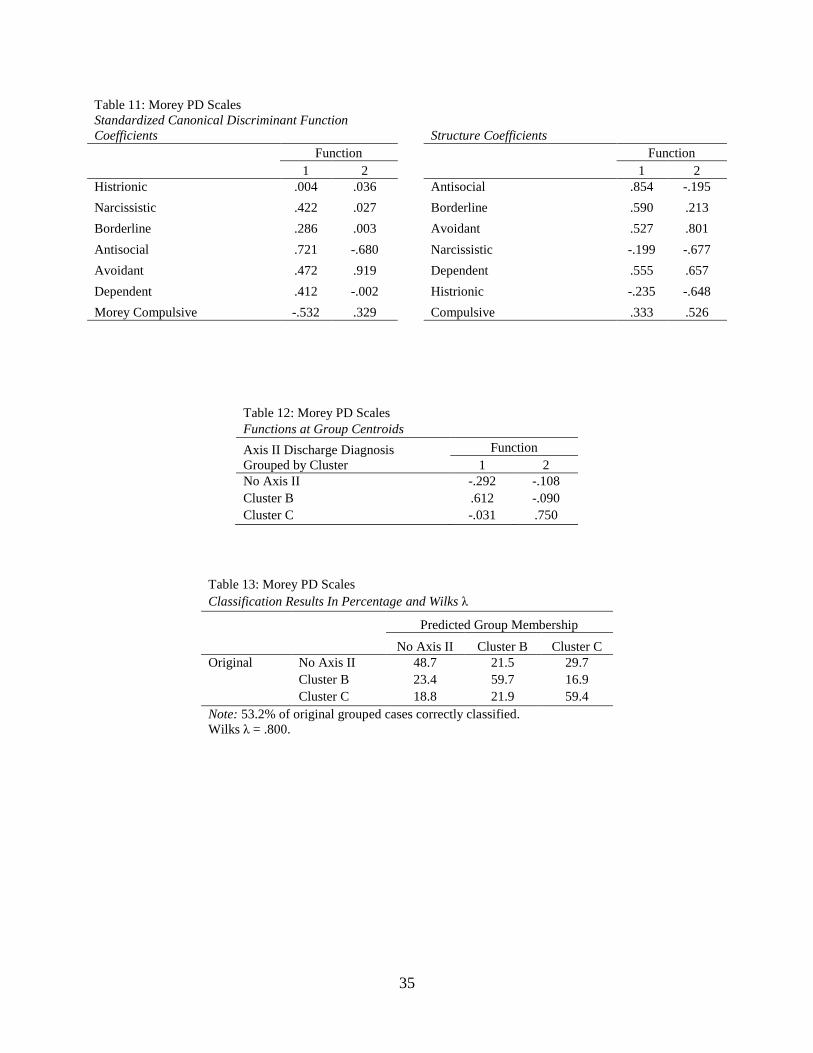
Compulsive (CPS), and Narcissistic (NAR). The overall Chi-square test was significant (Wilks
λ = .800, Chi-square = 58.333, df = 14, Canonical correlation = .372, p < .001); the two functions
extracted accounted for approximately 20% of the variance in diagnosis. Table 11 presents the
standardized discriminant function coefficients and structure weights. Table 12 shows the two
functions at the group centroids. Results displayed in these tables indicate that the Antisocial
and Borderline scales load on function one, which discriminates Cluster B from the other groups.
The Avoidant, Dependent, and Compulsive scales load positively on function two and the
Narcissistic and Histrionic scales load negatively on function two, which discriminates Cluster C
from the other groups. Overall the discriminant function successfully predicted outcome for
53.2% of cases. Classification results are displayed in Table 13.
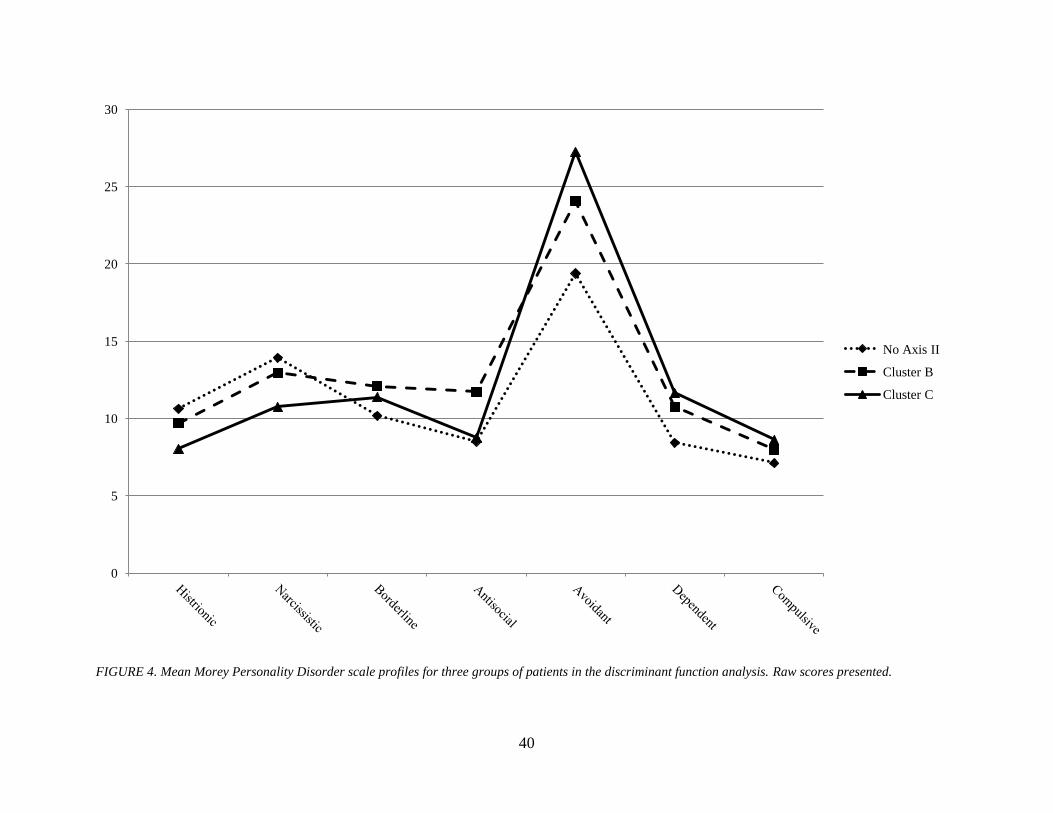
Figure 4 graphically depicts the mean profiles for the three groups on the Morey
Personality Disorder scales. All three groups manifest its highest peak on the Avoidant scale,
with the Cluster C group having the highest mean score, followed by the Cluster B group and the
group without a diagnosis. All other scales appear similar among the groups.
A fourth analysis was performed using the following Ben-Porath Personality Disorder
scales as discriminating variables: Antisocial (ANT), Histrionic (HST), Dependent (DEP),
Avoidant (AVD), Borderline (BDL), Compulsive (CPS), and Narcissistic (NAR). The overall
Chi-square test was significant (Wilks λ = .761, Chi-square = 71.388, df = 14, Canonical
correlation = .433, p < .001); the two functions extracted accounted for approximately 24% of
the variance in diagnosis. Table 14 presents the standardized discriminant function coefficients
and structure weights. Table 15 shows the two functions at the group centroids. Results
displayed in these tables indicate that the Antisocial and Borderline scales load on function one,
31
which discriminates Cluster B from the other groups. The Avoidant, Dependent, and
Compulsive scales load positively on function two and the Narcissistic and Histrionic scales load
negatively on function two, which discriminates Cluster C from the other groups. Overall the
discriminant function successfully predicted outcome for 55.4% of cases. Classification results
are displayed in Table 16.
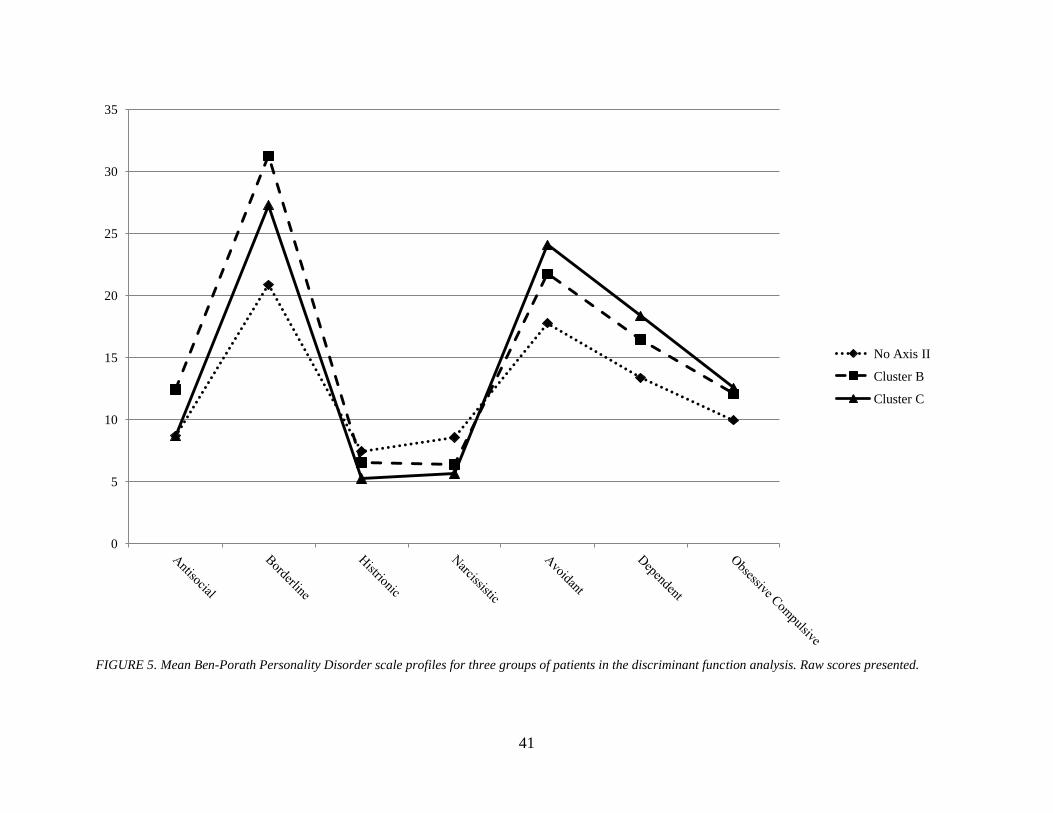
The mean profiles for the Ben-Porath Personality Disorder scales are displayed in Figure
5. The profiles of the three groups continue to appear similar with observed separation on the
Borderline and Avoidant scales. There also appears to be separation between the Cluster B
group and the other two groups on the Antisocial scale and between the group without a
diagnosis and the other two groups on the Dependent scale.
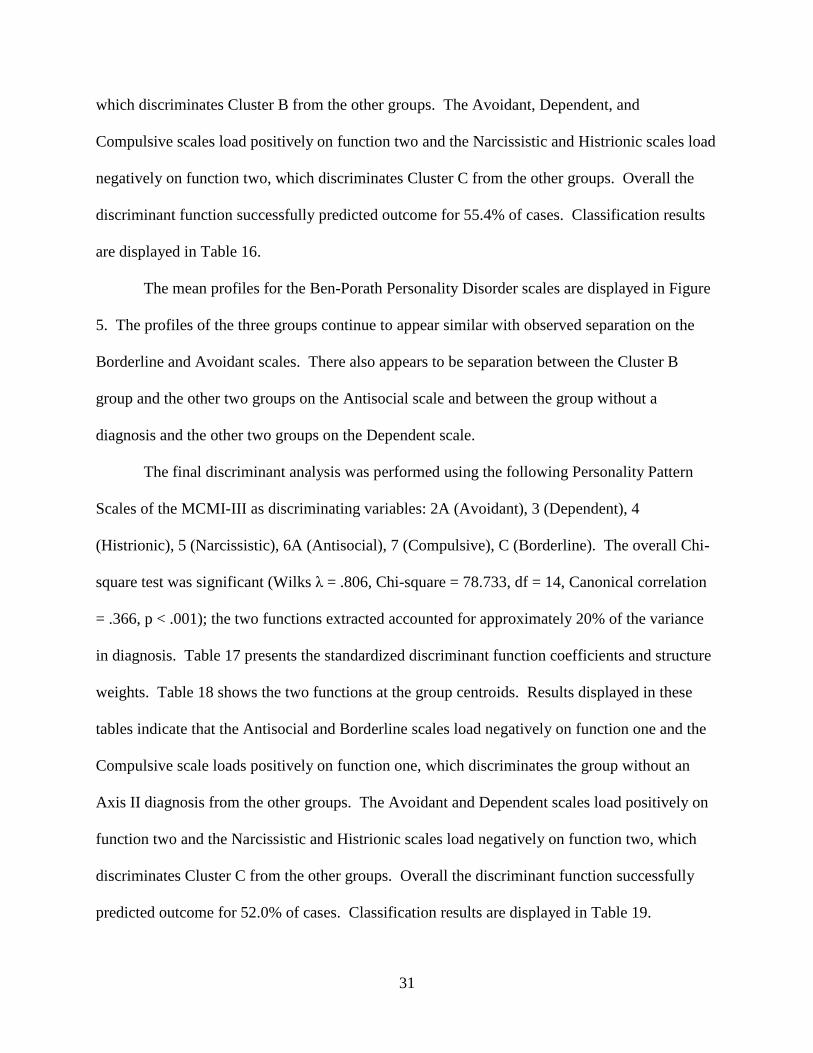
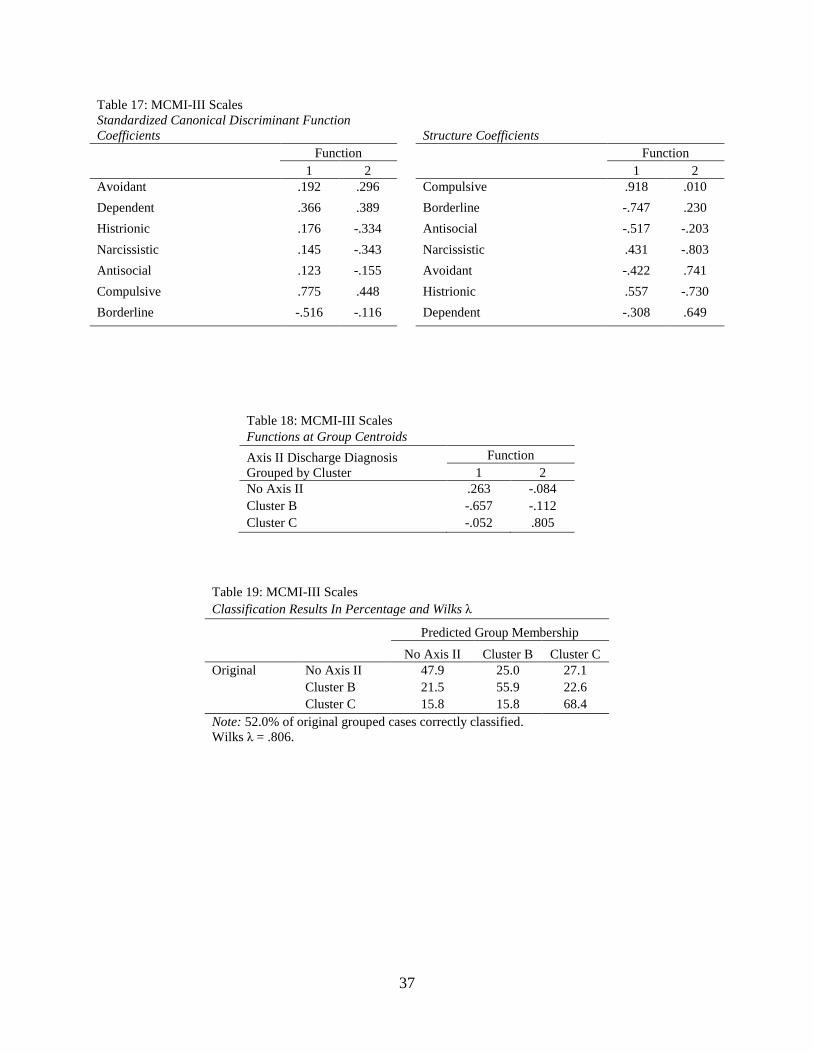
The final discriminant analysis was performed using the following Personality Pattern
Scales of the MCMI-III as discriminating variables: 2A (Avoidant), 3 (Dependent), 4
(Histrionic), 5 (Narcissistic), 6A (Antisocial), 7 (Compulsive), C (Borderline). The overall Chi-
square test was significant (Wilks λ = .806, Chi-square = 78.733, df = 14, Canonical correlation
= .366, p < .001); the two functions extracted accounted for approximately 20% of the variance
in diagnosis. Table 17 presents the standardized discriminant function coefficients and structure
weights. Table 18 shows the two functions at the group centroids. Results displayed in these
tables indicate that the Antisocial and Borderline scales load negatively on function one and the
Compulsive scale loads positively on function one, which discriminates the group without an
Axis II diagnosis from the other groups. The Avoidant and Dependent scales load positively on
function two and the Narcissistic and Histrionic scales load negatively on function two, which
discriminates Cluster C from the other groups. Overall the discriminant function successfully
predicted outcome for 52.0% of cases. Classification results are displayed in Table 19.

32
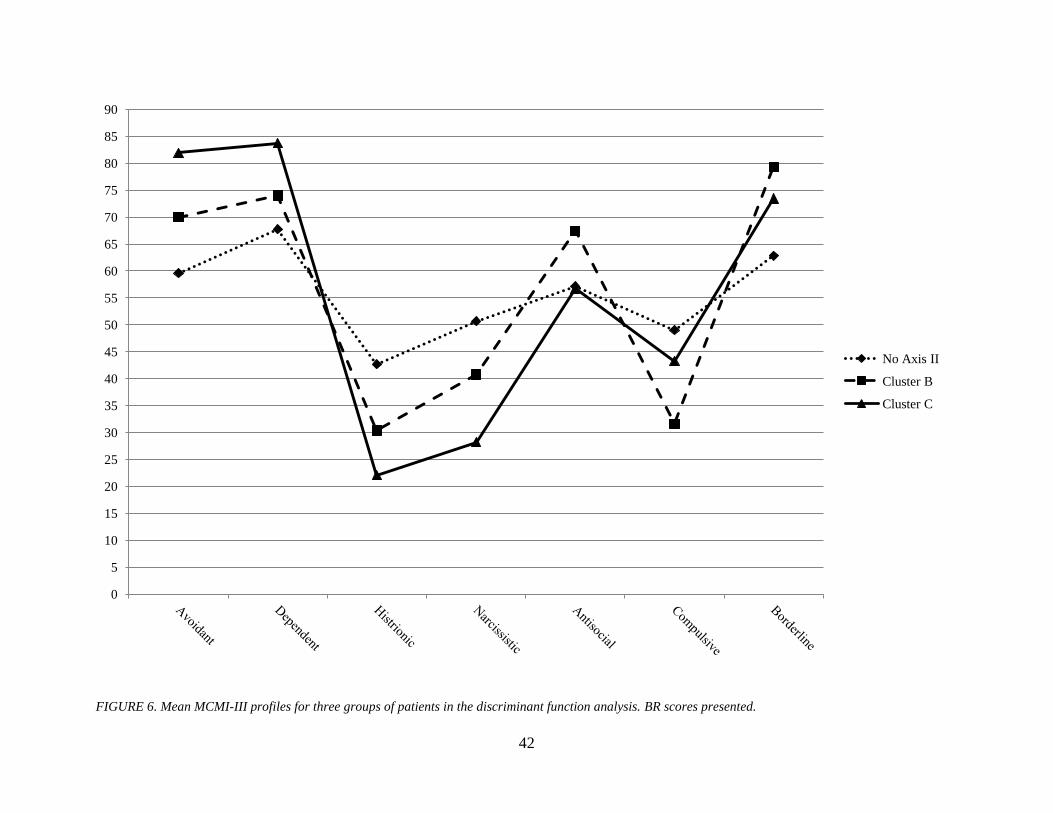
A graphical depiction of the mean profiles for the MCMI-III is shown in Figure 6. The
MCMI-III profiles reveal the clearest separation among all the groups. Peaks for the Cluster C
group appear on the Avoidant and Dependent scales with average scores for this group being
higher than the average scores of the other two groups. The average scores for the Cluster B
group fall above the average scores for the other two groups on the Antisocial and Borderline
scales. The group without an Axis II diagnosis has mean scores which exceed those of the other
two groups on the Histrionic, Narcissistic, and Compulsive scales; however, it should be noted
that these scores are subclinical, meaning the scores fall below a level in which a clinician would
suspect a psychiatric disorder.

33
Table 5: MMPI Clinical Scales
Standardized Canonical Discriminant
Function Coefficients
Structure Coefficients
Function
Function
1 2
1 2
Hypochondriasis .128 .495
Psychopathic Deviate .787 .527
Depression -.249 .522
Paranoia .722 .337
Hysteria -.153 -.358
Schizophrenia .638 .505
Psychopathic Deviate .626 .301
Hypomania .608 -.311
Paranoia .434 -.210
Depression .180 .866
Psychasthenia -.639 .709
Psychasthenia .410 .723
Schizophrenia .522 -.610
Hypochondriasis .341 .634
Hypomania .238 -.332
Hysteria .132 .452
Table 6: MMPI Clinical Scales
Functions at Group Centroids
Axis II Discharge Diagnosis Grouped by
Cluster
Function
1 2
No Axis II -.190 -.164
Cluster B .678 .100
Cluster C -.461 .787
Table 7: MMPI Clinical Scales
Classification Results In Percentage and Wilks λ
Predicted Group Membership
No Axis II Cluster B Cluster C
Original No Axis II 50.4 23.8 25.8
Cluster B 20.4 63.4 16.1
Cluster C 13.2 15.8 71.1
Note: 55.8% of original grouped cases correctly classified.
Wilks λ = .794.

34
Table 8: MMPI RC Scales
Standardized Canonical Discriminant
Function Coefficients
Structure Coefficients
Function
Function
1 2
1 2
Demoralization .647 .452
Antisocial Behavior .756 -.044
Somatic Complaints -.052 -.115
Ideas of Persecution .683 -.073
Low Positive Emotions -.244 .265
Hypomanic Activation .559 -.224
Cynicism -.126 -.170
Aberrant Experiences .504 .068
Antisocial Behavior .483 -.278
Cynicism .356 .029
Ideas of Persecution .490 -.407
Demoralization .593 .752
Dysfunctional Negative
Emotions
-.321 .690
Low Positive Emotions .307 .712
Aberrant Experiences .207 .015
Dysfunctional Negative
Emotions
.545 .609
Hypomanic Activation .224 -.257
Somatic Complaints .349 .386
Table 9: MMPI RC Scales
Functions at Group Centroids
Axis II Discharge Diagnosis Grouped
by Cluster
Function
1 2
No Axis II -.224 -.133
Cluster B .681 .009
Cluster C -.250 .814
Table 10: MMPI RC Scales
Classification Results In Percentage and Wilks λ
Predicted Group Membership
No Axis II Cluster B Cluster C
Original No Axis II 48.8 23.8 27.5
Cluster B 18.3 55.9 25.8
Cluster C 18.4 15.8 65.8
Note: 52.3% of original grouped cases correctly classified.
Wilks λ = .801.
35
Table 11: Morey PD Scales
Standardized Canonical Discriminant Function
Coefficients
Structure Coefficients
Function
Function
1 2
1 2
Histrionic .004 .036
Antisocial .854 -.195
Narcissistic .422 .027
Borderline .590 .213
Borderline .286 .003
Avoidant .527 .801
Antisocial .721 -.680
Narcissistic -.199 -.677
Avoidant .472 .919
Dependent .555 .657
Dependent .412 -.002
Histrionic -.235 -.648
Morey Compulsive -.532 .329
Compulsive .333 .526
Table 12: Morey PD Scales
Functions at Group Centroids
Axis II Discharge Diagnosis
Grouped by Cluster
Function
1 2
No Axis II -.292 -.108
Cluster B .612 -.090
Cluster C -.031 .750
Table 13: Morey PD Scales
Classification Results In Percentage and Wilks λ Predicted Group Membership
No Axis II Cluster B Cluster C
Original No Axis II 48.7 21.5 29.7
Cluster B 23.4 59.7 16.9
Cluster C 18.8 21.9 59.4
Note: 53.2% of original grouped cases correctly classified.
Wilks λ = .800.

36
Table 14: Ben-Porath PD Scales
Standardized Canonical Discriminant Function
Coefficients
Structure Coefficients
Function
Function
1 2
1 2
Antisocial .350 -.636
Borderline .849 .437
Borderline 1.102 -.028
Antisocial .756 -.252
Histrionic .332 .112
Avoidant .404 .783
Narcissistic -.201 -.156
Dependent .385 .768
Avoidant .254 .650
Narcissistic -.471 -.726
Dependent -.282 .157
Histrionic -.190 -.624
Obsessive Compulsive -.540 .307
Obsessive Compulsive .419 .582
Table 15: Ben-Porath PD Scales
Functions at Group Centroids
Axis II Discharge Diagnosis Grouped
by Cluster
Function
1 2
No Axis II -.344 -.108
Cluster B .739 -.071
Cluster C -.080 .702
Table 16: Ben-Porath PD Scales
Classification Results In Percentage and Wilks λ
Predicted Group Membership
No Axis II Cluster B Cluster C
Original No Axis II 54.4 20.3 25.3
Cluster B 19.5 58.4 22.1
Cluster C 21.9 25.0 53.1
Note: 55.4% of original grouped cases correctly classified.
Wilks λ = .761.
37
Table 17: MCMI-III Scales
Standardized Canonical Discriminant Function
Coefficients
Structure Coefficients
Function
Function
1 2
1 2
Avoidant .192 .296
Compulsive .918 .010
Dependent .366 .389
Borderline -.747 .230
Histrionic .176 -.334
Antisocial -.517 -.203
Narcissistic .145 -.343
Narcissistic .431 -.803
Antisocial .123 -.155
Avoidant -.422 .741
Compulsive .775 .448
Histrionic .557 -.730
Borderline -.516 -.116
Dependent -.308 .649
Table 18: MCMI-III Scales
Functions at Group Centroids
Axis II Discharge Diagnosis
Grouped by Cluster
Function
1 2
No Axis II .263 -.084
Cluster B -.657 -.112
Cluster C -.052 .805
Table 19: MCMI-III Scales
Classification Results In Percentage and Wilks λ Predicted Group Membership
No Axis II Cluster B Cluster C
Original No Axis II 47.9 25.0 27.1
Cluster B 21.5 55.9 22.6
Cluster C 15.8 15.8 68.4
Note: 52.0% of original grouped cases correctly classified.
Wilks λ = .806.

38
FIGURE 2. Mean MMPI-2 Clinical scale profiles for three groups of patients in the discriminant function analysis. Raw scores presented.
0
5
10
15
20
25
30
35
40
No Axis II
Cluster B
Cluster C
39
FIGURE 3. Mean MMPI-RC scale profiles for three groups of patients in the discriminant function analysis. Raw scores presented.
0
5
10
15
20
No Axis II
Cluster B
Cluster C
40
FIGURE 4. Mean Morey Personality Disorder scale profiles for three groups of patients in the discriminant function analysis. Raw scores presented.
0
5
10
15
20
25
30
No Axis II
Cluster B
Cluster C
41
FIGURE 5. Mean Ben-Porath Personality Disorder scale profiles for three groups of patients in the discriminant function analysis. Raw scores presented.
0
5
10
15
20
25
30
35
No Axis II
Cluster B
Cluster C
42
FIGURE 6. Mean MCMI-III profiles for three groups of patients in the discriminant function analysis. BR scores presented.
0
5
10
15
20
25
30
35
40
45
50
55
60
65
70
75
80
85
90
No Axis II
Cluster B
Cluster C
43
Diagnostic Validity Statistics. The second type of analysis utilized was diagnostic
validity statistics to gain a more granular picture of the clinical usefulness of the instruments
specifically designed to measure personality disorders; namely, the Morey Personality Disorder
scales, the Ben-Porath Personality Disorder scales, and the Personality Pattern scales from the
MCMI-III.
Diagnostic Validity Statistics. This paper used the definition and formula utilized by the Hsu
(2002) study.
PPP = P(CD+ │TD+)
Hsu (2002) defines PPP as the conditional probability, where CD+ = actual presence of the
disorder, TD+ = test or scale diagnosis of presence of the disorder, and the vertical line within
the parentheses means “given that”. In other words, PPP indicates the likelihood that an
individual truly has a disorder given a positive test.
While PPP is a useful statistic in the evaluation of the psychometric properties of an
instrument, it does have shortcomings. One of these shortcomings is the fact that PPP does not
account for the prevalence rate of disorders. Therefore, an instrument with a high PPP that does
not exceed the prevalence rate of the disorder is essentially meaningless (Hsu, 2002). Thusly, it
is important to utilize an additional diagnostic validity statistic that takes into account the
prevalence rate of the disorder, namely the incremental validity of positive test diagnoses (IPPP).
Hsu (2002) and Gibertini et al. (1986) refer to the difference between a scale’s PPP and the
prevalence rate of a disorder as the incremental validity of positive test diagnoses. The formula
that was used in this paper is the same as that used in the Hsu (2002) study:
IPPP = PPP – P(CD+)
44
In this equation, PPP = positive predictive power and P(CD+) = prevalence (base rate) of the
disorder. The IPPP statistic will be used to evaluate the meaningfulness of each instrument’s
PPP.
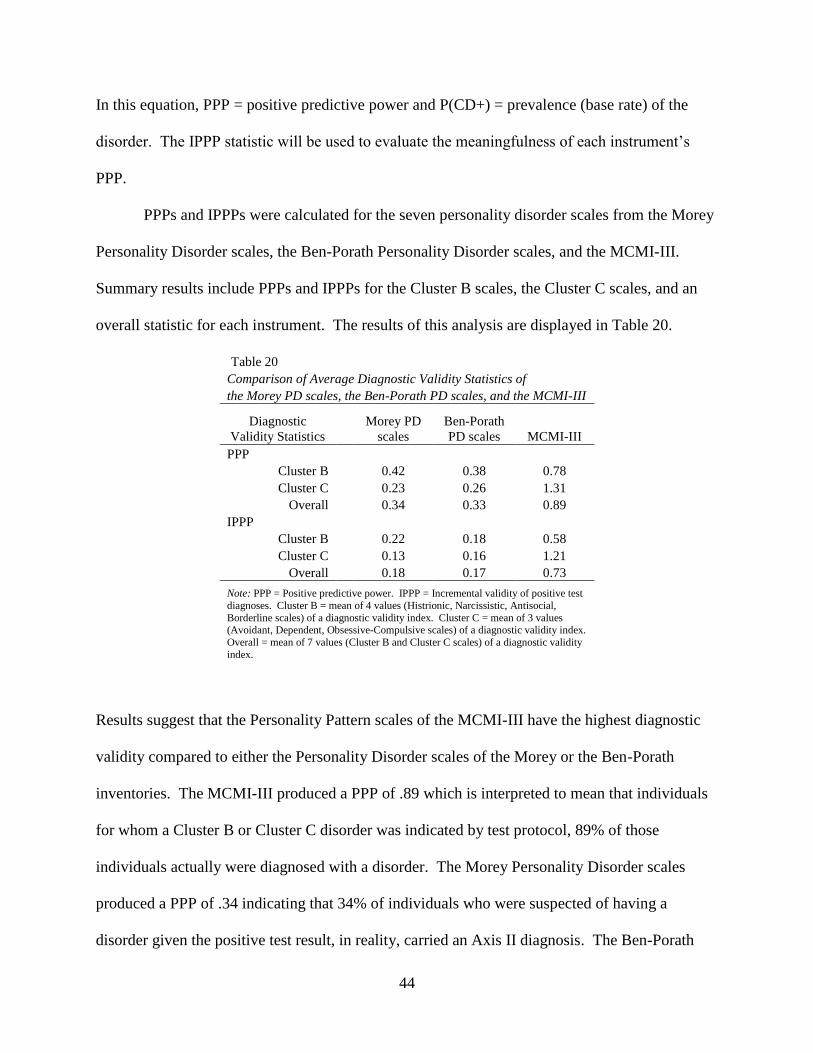
PPPs and IPPPs were calculated for the seven personality disorder scales from the Morey
Personality Disorder scales, the Ben-Porath Personality Disorder scales, and the MCMI-III.
Summary results include PPPs and IPPPs for the Cluster B scales, the Cluster C scales, and an
overall statistic for each instrument. The results of this analysis are displayed in Table 20.
Table 20
Comparison of Average Diagnostic Validity Statistics of
the Morey PD scales, the Ben-Porath PD scales, and the MCMI-III
Diagnostic
Validity Statistics
Morey PD
scales
Ben-Porath
PD scales MCMI-III
PPP
Cluster B
0.42 0.38 0.78
Cluster C
0.23 0.26 1.31
Overall
0.34 0.33 0.89
IPPP
Cluster B
0.22 0.18 0.58
Cluster C
0.13 0.16 1.21
Overall 0.18 0.17 0.73
Note: PPP = Positive predictive power. IPPP = Incremental validity of positive test
diagnoses. Cluster B = mean of 4 values (Histrionic, Narcissistic, Antisocial,
Borderline scales) of a diagnostic validity index. Cluster C = mean of 3 values (Avoidant, Dependent, Obsessive-Compulsive scales) of a diagnostic validity index.
Overall = mean of 7 values (Cluster B and Cluster C scales) of a diagnostic validity
index.
Results suggest that the Personality Pattern scales of the MCMI-III have the highest diagnostic
validity compared to either the Personality Disorder scales of the Morey or the Ben-Porath
inventories. The MCMI-III produced a PPP of .89 which is interpreted to mean that individuals
for whom a Cluster B or Cluster C disorder was indicated by test protocol, 89% of those
individuals actually were diagnosed with a disorder. The Morey Personality Disorder scales
produced a PPP of .34 indicating that 34% of individuals who were suspected of having a
disorder given the positive test result, in reality, carried an Axis II diagnosis. The Ben-Porath
45
Personality Disorder scales performed almost identical to the Morey instrument, producing a
PPP of .33, indicating that 33% of individuals who scored higher than the critical value of the
test instrument, were given a diagnosis by the clinician. When the base rates of the disorders
were taken into account, the MCMI-III still produced a conditional probability of valid diagnosis
in73% of the sample as compared to 17% and 18% for the Ben-Porath and Morey instruments,
respectively.
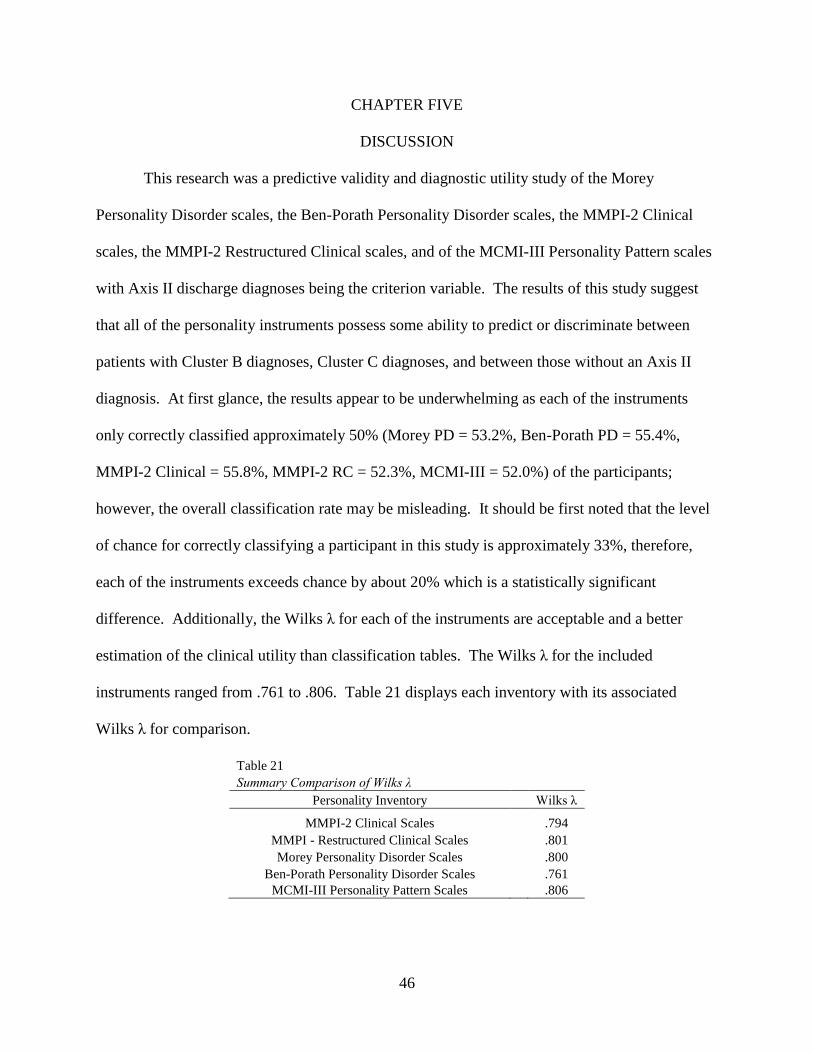
46
CHAPTER FIVE
DISCUSSION
This research was a predictive validity and diagnostic utility study of the Morey
Personality Disorder scales, the Ben-Porath Personality Disorder scales, the MMPI-2 Clinical
scales, the MMPI-2 Restructured Clinical scales, and of the MCMI-III Personality Pattern scales
with Axis II discharge diagnoses being the criterion variable. The results of this study suggest
that all of the personality instruments possess some ability to predict or discriminate between
patients with Cluster B diagnoses, Cluster C diagnoses, and between those without an Axis II
diagnosis. At first glance, the results appear to be underwhelming as each of the instruments
only correctly classified approximately 50% (Morey PD = 53.2%, Ben-Porath PD = 55.4%,
MMPI-2 Clinical = 55.8%, MMPI-2 RC = 52.3%, MCMI-III = 52.0%) of the participants;
however, the overall classification rate may be misleading. It should be first noted that the level
of chance for correctly classifying a participant in this study is approximately 33%, therefore,
each of the instruments exceeds chance by about 20% which is a statistically significant
difference. Additionally, the Wilks λ for each of the instruments are acceptable and a better
estimation of the clinical utility than classification tables. The Wilks λ for the included
instruments ranged from .761 to .806. Table 21 displays each inventory with its associated
Wilks λ for comparison.
Table 21
Summary Comparison of Wilks λ
Personality Inventory Wilks λ
MMPI-2 Clinical Scales
.794
MMPI - Restructured Clinical Scales
.801
Morey Personality Disorder Scales
.800
Ben-Porath Personality Disorder Scales
.761
MCMI-III Personality Pattern Scales .806

47
In comparison with previous literature, the results of this study are similar. Libb et al.
(1992) found that the MCMI-II correctly classified 79.03% and the MMPI correctly classified
68.55% of cases in the differentiation of Affective, Schizophrenic, and Substance Abuse
disorders. While the Libb et al. study produced higher classification rates than those of this
study, it is noteworthy that their study examined Axis I disorders as opposed to Axis II disorders
and that those authors included 15 additional predictor scales from the MCMI in analyses. It is
likely that the inclusion of additional predictor scales greatly contributed to the higher accuracy
rates. Additionally, Wilks λ was not reported in the Libb et al. study; therefore, no true direct
comparisons can be made.
Results from this study fared better when compared to the results of the Schulter, Snibbe,
and Buckwalter (1994) project, which is a more directly comparable study. Their study
evaluated the ability of the Morey Personality Disorder Scales and the MCMI in the
differentiation of specific Axis II diagnoses. In that study the Morey PD scales had an overall
accuracy rate of 43.7% and the MCMI correctly classified 39.1% of cases. Additionally, in the
Schulter et al. (1994) study the Morey PD scales correctly predicted 29.15% of diagnoses from
Cluster C and 46.9% of participants with a specific Cluster B diagnosis. This compares to a hit
rate of 59.4% and of 59.7% for Cluster C and Cluster B diagnoses respectively for the Morey PD
scales in the current study. Results from the current study for the MCMI-III indicate an accuracy
rate of 68.4% for Cluster C and of 55.9% for Cluster B disorders. This compares to rates of
42.1% for diagnoses from Cluster C and of 31.3% for a diagnosis from Cluster B produced in the
Schulter et al. (1994) study. Differences in the classification rates of the MCMI may be
attributed to the different versions of the instrument used in these studies. Again, a direct
comparison was not possible due to the failure of Schulter et al. to report Wilks λ.
48
Turning to the initial hypothesis of this study that the MCMI-III would perform better
than the other inventories, results of the discriminant function analyses do not support this
hypothesis. The MCMI-III actually produced the largest Wilks λ (.806) which is a measure of
achieved group separation; however, the Wilks λ produced by the other inventories were
comparable ranging from .761 (Ben-Porath inventory) to .801 (Restructured Clinical scales),
with no significant difference amongst any of the inventories. In fact, all of the instruments
performed comparably pertaining to overall classification rates and classification rates of specific
groupings. The only observable difference was in the classification of participants in the Cluster
C group in which the rate for the Ben-Porath Personality Disorder scales (53.1%) was much
lower than that of the other instruments (MMPI-2 Clinical = 71.1%, MMPI-2 RC = 65.8%,
Morey PD = 59.4%, MCMI-III = 68.4%).
Results of the diagnostic validity statistics are more supportive of the hypothesis that the
MCMI-III would be the most useful personality inventory. The MCMI-III had the highest
positive predictive power, as well as the highest incremental validity of a positive test diagnosis
ratings of any of the instruments. The reader is referred to Table 20 to review PPP ratings;
however, further discussion of IPPP ratings is warranted. IPPP ratings of .58 (Morey PD = .22,
Ben-Porath PD = .18) for Cluster B diagnoses, 1.21 (Morey PD = .13, Ben-Porath = .16) for
Cluster C diagnoses, and an overall IPPP of .73 (Morey PD = .18, Ben-Porath = .17) were found
for the Personality Pattern scales of the MCMI-III. Interpretation of the IPPP rating for Cluster
C diagnoses for the MCMI-III is difficult due to the limited sample size for that group. An IPPP
above 1 indicates a greater than 100% probability that an individual has a disorder given a
symptom. The author will return to this topic later in the paper.

49
The overall IPPP rating of .73 is excellent and indicates a 73% probability of a valid
diagnosis based on the test, in this case the MCMI-III. This rating is likely artificially inflated
due to the issues noted above regarding the Cluster C group; however, even with the influence of
that group removed, an overall IPPP rating of .58 is found. This is almost identical to the overall
IPPP rating of .608 found in the Millon et al. (1997) study. Unfortunately, no studies were found
that included PPP or IPPP ratings for the other instruments included in the current study,
therefore, no comparisons can be made.
It is not surprising that the MCMI-III has such good conditional probability values for
Axis II diagnoses. After all, the instrument is theoretically constructed from Millon’s personality
theory and based heavily on DSM-IV diagnostic criteria. What did come as a surprise were the
relatively low IPPP values of the Morey Personality Disorder scales (.18) and of the Ben-Porath
Personality Disorder scales (.17). It is plausible that these low values are influenced by the
design of the MMPI. While these two instruments were specifically designed to measure Axis II
pathology, the items included on both instruments were pulled directly from the MMPI pool.
Due to the fact the MMPI was designed to measure clinical (Axis I) syndromes, it is possible that
its item pool is not proficient at assessing Axis II pathology.
As noted previously, in its basic form this project was designed as a predictive validity
study; however, results also lend strong support for the concurrent validity of each of the
inventories. Using Axis II discharge diagnoses as the criterion variable, it would be expected
that the scales which purportedly measure Cluster B disorders and Cluster C disorders would not
only correlate with, but also differentiate between those respective diagnostic clusters. This
expected result was found for each of the instruments.
50
Looking first at the MCMI-III, the scales which contributed the most to the
differentiation of Cluster B and Cluster C disorders were the Narcissistic, Histrionic, Avoidant,
and Dependent scales, each of which loaded in the expected direction. The scales from the Ben-
Porath inventory and the Morey inventory which differentiated the clusters were the Borderline,
Antisocial, Avoidant, Dependent, and Obsessive-Compulsive scales, again loading in the
expected direction.
Even though the MMPI-2 Clinical and MMPI-2 RC scales do not have Axis II specific
scales, analysis lends support to their ability to differentiate Axis II diagnostic clusters. Results
indicated that the scales from the MMPI-2 RC which contributed to the differentiation of the
Cluster B disorders were the Antisocial Behavior, Ideas of Persecution, Hypomanic Activation,
and Aberrant Experiences scales. The Demoralization, Low Positive Emotions, and
Dysfunctional Negative Emotions scales differentiated the Cluster C disorders. Analysis of the
MMPI-2 Clinical scales showed that the Psychopathic Deviance, Paranoia, Schizophrenia, and
Hypomania scales aligned with Cluster B disorders, while the Depression, Psychasthenia, and
Hypochondriasis scales loaded highest on the function that differentiated Cluster C disorders.
Based upon the pathological characteristics that each of these scales measure, these results are
not surprising and support the use of these instruments in the assessment of Axis II disorders.
Limitations and Future Research
There were several limitations of the present study. The most noticeable limitation is in
the inequality of group sizes, and more specifically, the limited sample size for the Cluster C
group. As noted previously, this may have played a part in the inflation of the diagnostic validity
statistics as they pertain to this group. Additionally, the reader should take caution in the
generalizability of the statistical predictive models that resulted from this study due to the issues
51
of sample size and population characteristics. The participants in this study were all psychiatric
inpatients and would be expected to have higher average scores on personality inventories than
an outpatient population. Future research which included a more diverse population and a larger
sample size would add reliability to the findings of the current project.
Another limitation of the current study is the inherent fallibility of the diagnostic process
itself. As it stands now, diagnoses are made based on a set of categorical criteria outlined in the
DSM-IV-TR and unfortunately, there is a great deal of symptom overlap amongst the personality
disorders. This is not to say that the diagnostic process cannot be accurate or useful. As noted
previously in this paper, Kenrick and Funder (1988) point out that the evaluation of personality
can be highly accurate when based on multiple data points and multiple observations (p. 31).
This study attempted to address the issue of symptom overlap by grouping participants into
diagnostic clusters defined by shared characteristics; however, this creates other problems. The
fact that not all the symptoms are shared by the disorders within the clusters causes statistical
prediction of group membership to become more difficult. This is one possible explanation as to
why the overall accuracy rate of the discriminant function analyses were lower than expected.
Additional research which examines the prediction of specific personality disorders is needed
and would establish important psychometric properties of these inventories. Furthermore, with
the recent release of the fifth edition of the DSM, further research will be needed pertaining to
these inventories and the new diagnostic criteria for personality disorders.
Summary
The purpose of this study was to evaluate the predictive and diagnostic validity of the
MMPI-2 Clinical scales, the MMP-2 Restructured Clinical scales, the Morey Personality
Disorder scales, the Ben-Porath Personality Disorder scales, and the MCMI-III Personality

52
Pattern scales. Analyses indicated that each of the instruments effectively predicted group
membership at a rate better than chance and that no single instrument performed better or worse
in this task. However, the MCMI-III possessed the greatest diagnostic validity as defined by the
PPP and IPPP statistics. Thus, the initial hypothesis that the MCMI-III would have the most
clinical utility in the assessment of personality disorders is partially supported.
This is not to say that the other instruments included in this study are not proficient in the
assessment of personality. Each performed equally as well in the differentiation of diagnostic
clusters. Furthermore, while not achieving the level of the MCMI-III, the Morey Personality
Disorder scales and the Ben-Porath Personality Disorder scales displayed diagnostic validity
greater than the prevalence of the disorders. Results also lent support for the concurrent validity
of each of the instruments.
So what do these findings suggest regarding the clinical applications of these inventories?
In an ideal situation clinicians would administer the MMPI and the MCMI. One cannot ignore
the plethora of literature supporting the clinical usefulness of both instruments. Furthermore,
additional sources of information would provide a clearer clinical picture of clients. With that
said, there are economic considerations and with the limited reimbursement from insurance
companies, clinicians often must be selective with the assessment tools administered. It is
argued that in circumstances when only one personality assessment inventory can be
administered, the MCMI-III would be the best option. This argument is made for several
reasons. First, the MCMI-III contains far less items than the MMPI. Its completion requires less
time and effort than that of the MMPI. Even in its brevity, the MCMI-III provides valuable
clinical information for the assessment of personality disorders and clinical syndromes. It is the
author’s hope that with continued research, better statistical models can be developed to aid in

53
the diagnostic process. More accurate diagnosing will lead to more effective treatment and
ultimately to better outcomes with the individuals with whom we work.

54
REFERENCES

55
LIST OF REFERENCES
American Psychiatric Association. (1980). Diagnostic and statistical manual of mental disorders
(3rd
ed.). Washington, DC: Author.
American Psychiatric Association. (1994). Diagnostic and statistical manual of mental disorders
(4th
ed.). Washington, DC: Author.
American Psychiatric Association. (2012). Rationale for the Proposed Changes to the
Personality Disorders Classification in DSM-5. Retrieved October 27, 2012, from American
Psychiatric Association DSM-5 Development: http://www.dsm5.org
Ben-Porath, Y., Butcher, J. N., & Graham, J. R. (1991). Contribution of the MMPI-2 content
scales to the differential diagnosis of schizophrenia and major depression. Psychological
Assessment: A Journal of Consulting and Clinical Psychology, 3(4), 634-640.
doi:http://dx.doi.org/10.1037/1040-3590.3.4.634
Butcher, J. N., & Williams, C. L. (2000). Essentials of MMPI-2 and MMPI-A interpretation (2nd
ed.) University of Minnesota Press, Minneapolis, MN. Retrieved from
http://search.proquest.com/docview/619606471?accountid=15042
Butcher, J. N., Dahlstrom, W. G., Graham, J. R., Tellegen, A., & Kaemmer, B. (1989).
Minnesota Multiphasic Personality Inventory–2: Manual for administration and scoring.
Minneapolis: University of Minnesota Press.
Butcher, J. N., Graham, J. R., Ben-Porath, Y. S., Tellegen, A., Dahlstrom,W.G., & Kaemmer, B.
(2001). MMPI–2: Manual for administration and scoring (Rev. ed.). Minneapolis:
University of Minnesota Press.
Choca, J. P. (1999). Evolution of millon's personality prototypes. Journal of Personality
Assessment, 72(3), 353-364. Retrieved from
http://search.proquest.com/docview/619401938?accountid=15042
Colligan, R. C., Morey, L. C., & Offord, K. P. (1994). "The MMPI/MMPI-2 personality disorder
scales: Contemporary norms for adults and adolescents": Erratum. Journal of Clinical
Psychology, 50(6), 846-846. Retrieved from
http://search.proquest.com/docview/618637407?accountid=15042
Craig, R. J., & Weinberg, D. (1993). MCMI: Review of the literature. (pp. 23-70) Lawrence
Erlbaum Associates, Inc, Hillsdale, NJ. Retrieved from
http://search.proquest.com/docview/618231705?accountid=15042
Davis, R. D. (1999). Millon: Essentials of his science, theory, classification, assessment, and
theory. Journal of Personality Assessment, 72(3), 330-352. Retrieved from
http://search.proquest.com/docview/619399681?accountid=15042
Dawes, R. M., Faust, D., & Meehl, P. E. (1989). Clinical versus actuarial judgment. Science,
243(4899), 1668-1674. Retrieved from
http://search.proquest.com/docview/617608742?accountid=15042
56
Dubro, A. F., & Wetzler, S. (1989). An external validity study of the MMPI personality disorders
scales. Journal of Clinical Psychology, 45(4), 570-575. Retrieved from
http://search.proquest.com/docview/617694554?accountid=15042
Ægisdóttir, S., White, M. J., Spengler, P. M., Maugherman, A. S., Anderson, L. A., Cook, R. S., .
. . Rush, J. D. (2006). The meta-analysis of clinical judgment project: Fifty-six years of
accumulated research on clinical versus statistical prediction stefanía ægisdóttir. The
Counseling Psychologist, 34(3), 341-382. doi:http://dx.doi.org/10.1177/0011000005285875
Eichman, W. J. (1961). Replicated factors on the MMPI with female NP patients. Journal of
Consulting Psychology, 25(1), 55-60. doi:http://dx.doi.org/10.1037/h0043903
Garb, H. N. (1994). Judgment research: Implications for clinical practice and testimony in court.
Applied & Preventive Psychology, 3(3), 173-183. Retrieved from
http://search.proquest.com/docview/618614191?accountid=15042
Gibertini, M., Brandenburg, N. A., & Retzlaff, P. D. (1986). The operating characteristics of the
millon clinical multiaxial inventory. Journal of Personality Assessment, 50(4), 554-567.
Retrieved from http://search.proquest.com/docview/617263257?accountid=15042
Graham, J. R. (2006). MMPI-2: Assessing personality and psychopathology (4th ed.) Oxford
University Press, New York, NY. Retrieved from
http://search.proquest.com/docview/620909638?accountid=15042
Grove, W. M., & Meehl, P. E. (1996). Comparative efficiency of informal (subjective,
impressionistic) and formal (mechanical, algorithmic) prediction procedures: The clinical–
statistical controversy. Psychology, Public Policy, and Law, 2(2), 293-323.
doi:http://dx.doi.org/10.1037/1076-8971.2.2.293
Grove, W. M., Zald, D. H., Lebow, B. S., Snitz, B. E., & Nelson, C. (2000). Clinical versus
mechanical prediction: A meta-analysis. Psychological Assessment, 12(1), 19-30.
doi:http://dx.doi.org/10.1037/1040-3590.12.1.19
Handel, R. W., & Archer, R. P. (2008). An investigation of the psychometric properties of the
MMPI-2 restructured clinical (RC) scales with mental health inpatients. Journal of
Personality Assessment, 90(3), 239-249. doi:http://dx.doi.org/10.1080/00223890701884954
Hathaway, S. R. (1964). MMPI: Professional use by professional people. American Psychologist,
19(3), 204-210. doi:http://dx.doi.org/10.1037/h0044195
Hathaway, S. R., & McKinley, J. C. (1940). A multiphasic personality schedule (minnesota): I.
construction of the schedule. Journal of Psychology: Interdisciplinary and Applied, 10, 249-
254. doi:http://dx.doi.org/10.1080/00223980.1940.9917000
Hicklin, J., & Widiger, T. A. (2000). Convergent validity of alternative MMPI-2 personality
disorder scales. Journal of Personality Assessment, 75(3), 502-518. Retrieved from
http://search.proquest.com/docview/619540142?accountid=15042
57
Hills, H. A. (1995). Diagnosing personality disorders: An examination of the MMPI-2 and
MCMI-II. Journal of Personality Assessment, 65(1), 21-34. Retrieved from
http://search.proquest.com/docview/618974269?accountid=15042
Hoelzle, J. B., & Meyer, G. J. (2008). The factor structure of the MMPI-2 restructured clinical
(RC) scales. Journal of Personality Assessment, 90(5), 443-455.
doi:http://dx.doi.org/10.1080/00223890802248711
Holt, R. R. (1970). Yet another look at clinical and statistical prediction: Or, is clinical
psychology worthwhile? American Psychologist, 25(4), 337-349.
doi:http://dx.doi.org/10.1037/h0029481
Hsu, L. M. (2002). Diagnostic validity statistics and the MCMI-III. Psychological Assessment,
14(4), 410-422. doi:http://dx.doi.org/10.1037/1040-3590.14.4.410
Jones, A. (2005). An examination of three sets of MMPI-2 personality disorder scales. Journal of
Personality Disorders, 19(4), 370-385. doi:http://dx.doi.org/10.1521/pedi.2005.19.4.370
Kenrick, D. T., & Funder, D. C. (1988). Profiting from controversy: Lessons from the person-
situation debate. American Psychologist, 43(1), 23-34. doi:http://dx.doi.org/10.1037/0003-
066X.43.1.23
Libb, J. W., Murray, J., Thurstin, H., & Alarcon, R. D. (1992). Concordance of the MCMI-II, the
MMPI, and axis I discharge diagnosis in psychiatric inpatients. Journal of Personality
Assessment, 58(3), 580-590. Retrieved from
http://search.proquest.com/docview/618159976?accountid=15042
Marchese, M. C. (1992). Clinical versus actuarial prediction: A review of the literature.
Perceptual and Motor Skills, 75(2), 583-594. Retrieved from
http://search.proquest.com/docview/618260776?accountid=15042
McCann, J. T. (1989). MMPI personality disorder scales and the MCMI: Concurrent validity.
Journal of Clinical Psychology, 45(3), 365-369. Retrieved from
http://search.proquest.com/docview/617609233?accountid=15042
McCann, J. T. (1991). Convergent and discriminant validity of the MCMI-II and MMPI
personality disorder scales. Psychological Assessment: A Journal of Consulting and Clinical
Psychology, 3(1), 9-18. doi:http://dx.doi.org/10.1037/1040-3590.3.1.9
Meehl, P. E. (1954). Clinical vs. statistical prediction: A theoretical analysis and a review of the
evidence. Minneapolis: University of Minnesota Press.
Miller, H. R., Streiner, D. L., & Parkinson, A. (1992). Maximum likelihood estimates of the
ability of the MMPI and MCMI personality disorder scales and the SIDP to identify
personality disorders. Journal of Personality Assessment, 59(1), 1-13. Retrieved from
http://search.proquest.com/docview/618169473?accountid=15042
Millimet, C. R. (1970). Manifest anxiety-defensiveness scale: First factor of the MMPI revisited.
Psychological Reports, 27(2), 603-616. Retrieved from
http://search.proquest.com/docview/615707270?accountid=15042
58
Millon, T. (1969). Modern psychopathology. Philadelphia: Saunders.
Millon, T. (1990). Toward a new personology: An evolutionary model John Wiley & Sons,
Oxford. Retrieved from http://search.proquest.com/docview/618219794?accountid=15042
Millon, T. (1994). MCMI–III manual. Minneapolis, MN: National Computer Systems.
Millon, T., & Davis, R. D. (1996). An evolutionary theory of personality disorders. (pp. 221-
346) Guilford Press, New York, NY. Retrieved from
http://search.proquest.com/docview/619018914?accountid=15042
Millon, T., Davis, R., & Millon, C. (1997). MCMI–III manual (2nd ed.). Minneapolis, MN:
National Computer Systems.
Millon, T., Davis, R., Millon, C., & Grossman, S. (2006). MCMI-III, Millon Clinical Multiaxial
Inventory-III: Manual. National Computer Systems.
Millon, T., Davis, R., Millon, C., & Grossman, S. (2009). MCMI-III, Millon Clinical Multiaxial
Inventory-III: Manual. National Computer Systems.
Millon, T., Davis, R., Millon, C., Escovar, L., & Meagher, S. (2000). Personality disorders in
modern life John Wiley & Sons Inc, Hoboken, NJ. Retrieved from
http://search.proquest.com/docview/619438466?accountid=15042
Morey, L. C., & le Vine, D. J. (1988). A multitrait-multimethod examination of minnesota
multiphasic personality inventory (MMPI) and millon clinical multiaxial inventory (MCMI).
Journal of Psychopathology and Behavioral Assessment, 10(4), 333-344. Retrieved from
http://search.proquest.com/docview/617609301?accountid=15042
Morey, L. C., Waugh, M. H., & Blashfield, R. K. (1985). MMPI scales for DSM-III personality
disorders: Their derivation and correlates. Journal of Personality Assessment, 49(3), 245-
251. Retrieved from http://search.proquest.com/docview/617051051?accountid=15042
Nichols, D. S. (2006). The trials of separating bath water from baby: A review and critique of the
MMPI-2 restructured clinical scales. Journal of Personality Assessment, 87(2), 121-138.
doi:http://dx.doi.org/10.1207/s15327752jpa8702_02
O'Maille, P. S., & Fine, M. A. (1995). Personality disorder scales for the MMPI-2: An
assessment of psychometric properties in a correctional population. Journal of Personality
Disorders, 9(3), 235-246. Retrieved from
http://search.proquest.com/docview/618915875?accountid=15042
Sawyer, J. (1966). Measurement and prediction, clinical and statistical. Psychological Bulletin,
66(3), 178-200. doi:http://dx.doi.org/10.1037/h0023624
Schuler, C. E., Snibbe, J. R., & Buckwalter, J. G. (1994). Validity of the MMPI personality
disorder scales (MMPI-PD). Journal of Clinical Psychology, 50(2), 220-227. Retrieved from
http://search.proquest.com/docview/618478994?accountid=15042
59
Sellbom, M., & Ben-Porath, Y. (2005). Mapping the MMPI-2 restructured clinical scales onto
normal personality traits: Evidence of construct validity. Journal of Personality Assessment,
85(2), 179-187. doi:http://dx.doi.org/10.1207/s15327752jpa8502_10
Sellbom, M., Graham, J. R., & Schenk, P. W. (2006). Incremental validity of the MMPI-2
restructured clinical (RC) scales in a private practice sample. Journal of Personality
Assessment, 86(2), 196-205. doi:http://dx.doi.org/10.1207/s15327752jpa8602_09
Simms, L. J., Casillas, A., Clark, L. A., Watson, D., & Doebbeling, B. N. (2005). Psychometric
evaluation of the restructured clinical scales of the MMPI-2. Psychological Assessment,
17(3), 345-358. doi:http://dx.doi.org/10.1037/1040-3590.17.3.345
Sines, J. O. (1970). Actuarial versus clinical prediction in psychopathology. The British Journal
of Psychiatry, 116(531), 129-144. Retrieved from
http://search.proquest.com/docview/615681953?accountid=15042
Somwaru, D. P., & Ben-Porath, Y. S. (1995, March). Development and reliability of MMPI–2
based personality disorder scales. Paper presented at the 30th Annual Workshop and
symposium on Recent Developments in Use of the MMPI–2 and MMPI–A, St. Petersburg
Beach, FL.
Strack, S., & Millon, T. (2007). Contributions to the dimensional assessment of personality
disorders using millon's model and the millon clinical multiaxial inventory (MCMI-III).
Journal of Personality Assessment, 89(1), 56-69.
doi:http://dx.doi.org/10.1080/00223890701357217
Streiner, D. L., & Miller, H. R. (1988). Validity of MMPI scales for DSM-III personality
disorders: What are they measuring? Journal of Personality Disorders, 2(3), 238-242.
doi:http://dx.doi.org/10.1521/pedi.1988.2.3.238
Tellegen, A., Ben-Porath, Y. S., McNulty, J. L., Arbisi, P. A., Graham, J. R., & Kaemmer, B.
(2003). MMPI–2 Restructured Clinical (RC) scales: Development, validation, and
interpretation. Minneapolis: University of Minnesota Press.
Trull, T. J. (1993). Temporal stability and validity of two personality disorder inventories.
Psychological Assessment, 5(1), 11-18. doi:http://dx.doi.org/10.1037/1040-3590.5.1.11
Trull, T. J., & Larson, S. L. (1994). External validity of two personality disorder inventories.
Journal of Personality Disorders, 8(2), 96-103. Retrieved from
http://search.proquest.com/docview/618577545?accountid=15042
Wallace, A., & Liljequist, L. (2005). A comparison of the correlational structures and elevation
patterns of the MMPI-2 restructured clinical (RC) and clinical scales. Assessment, 12(3),
290-294. doi:http://dx.doi.org/10.1177/1073191105276250
Walters, G. D., & Greene, R. L. (1988). Differentiating between schizophrenic and manic
inpatients by means of the MMPI. Journal of Personality Assessment, 52(1), 91-95.
Retrieved from http://search.proquest.com/docview/617428984?accountid=15042
60
Watson, D., & Tellegen, A. (1985). Toward a consensual structure of mood. Psychological
Bulletin, 98(2), 219-235. doi:http://dx.doi.org/10.1037/0033-2909.98.2.219
Widiger, T. A. (1999). Millon's dimensional polarities. Journal of Personality Assessment, 72(3),
365-389. Retrieved from http://search.proquest.com/docview/619399917?accountid=15042
Wiggins, J. S. (1981). Clinical and statistical prediction: Where are we and where do we go from
here?. Clinical Psychology Review, 1(1), 3-18.
Wise, E. A. (1996). Comparative validity of MMPI-2 and MCMI-II personality disorder
classifications. Journal of Personality Assessment, 66(3), 569-582. Retrieved from
http://search.proquest.com/docview/618794896?accountid=15042
Zarrella, K. L., Schuerger, J. M., & Ritz, G. H. (1990). Estimation of MCMI DSM-III axis II
constructs from MMPI scales and subscales. Journal of Personality Assessment, 55(1-2),
195-201. Retrieved from http://search.proquest.com/docview/617882514?accountid=15042

61
APPENDICES
62
Appendix A: Descriptions of the Five Personality Inventories Used in the Current Study
Minnesota Multiphasic Personality Inventory – Second Edition
The Minnesota Multiphasic Personality Inventory – second edition, known as the MMPI-
2, is a revised edition of the original MMPI. This version of the MMPI was revised and
extensively renormed to better align with current trends and symptomatology of pathology. The
MMPI-2 is a psychological assessment instruments completed by the person being evaluated,
and scored and interpreted by the examiner. The clinician evaluates the test taker's personal
characteristics by comparing the test taker's answers to those given by various psychiatric and
nonpsychiatric comparison groups. By analyzing the test taker's patterns of response to the test
items, the examiner is able to draw some tentative conclusions about the client's level of
adaptation, behavioral characteristics, and personality traits. The inventory is often used as part
of inpatient psychiatric assessments, differential diagnosis, and outpatient evaluations.
Millon Clinical Multiaxial Inventory – Third Edition
The Millon Clinical Multiaxial Inventory – Third edition, known as the MCMI-III is a
psychological assessment tool intended to provide information on psychopathology, including
specific disorders outlined in the DSM-IV. The MCMI-III is the third revision of Millon’s
original personality inventory and underwent a renorming process in 2009 to match the current
base rates of psychiatric disorders. The MCMI was developed and standardized specifically on
clinical populations (i.e. patients in psychiatric hospitals or people with existing mental health
problems). The MCMI differs from other personality tests in that it is based on theory and is
organized according to a multiaxial format. Much like the MMPI, the MCMI-III is used to draw
some tentative conclusions about the client's level of adaptation, behavioral characteristics, and
63
personality traits and is also often used as part of inpatient psychiatric assessments, differential
diagnosis, and outpatient evaluations.
Minnesota Multiphasic Personality Inventory – Restructured Clinical Scales
The Minnesota Multiphasic Personality Inventory – Restructured Clinical Scales, known
as the MMPI-RC scales are psychometrically improved versions of the original clinical scales.
The original clinical scales were known to contain a high level of interscale correlation,
overlapping items, and were confounded by the presence of an overarching factor that has since
been extracted and placed in a separate scale (demoralization). The RC scales measure the core
constructs of the original clinical scales and were meant to replace those original scales.
Morey Personality Scales
Morey, Waugh, and Blashfield (1985) utilized 265 items of the original 567 MMPI items
to create 11 scales purported to measure the 11 personality disorders of the DSM-III. These
scales were created to be used in addition to the clinical scales of the MMPI in order to
specifically measure personality disorders.
Ben-Porath Personality Scales
Somwaru and Porath (1995) utilized 292 items of the original 567 MMPI items to create
10 scales that measured characteristics of personality disorders as defined by the DSM-IV.
These scales, similar to the Morey scales, were meant to be used as an addition to the clinical
scales of the MMPI. However, these scales were created to align with the personality disorders
found in the DSM-IV.
64
Appendix B: Scale Descriptions for the Five Personality Inventories Used in the Current Study
MCMI-III
Avoidant
(Scale 2A)
Elevated scores indicate vigilance and being always on guard and ready to
distance themselves from anxious anticipation of life’s painful or negatively
reinforcing experiences. Though they desire relationships, they deny these
feelings and feel the safest when interpersonally distant.
Dependent
(Scale 3)
Elevated scores indicate a tendency to turn to others for support and
nurturance, they wait passively for their leadership of other and lack initiation
and autonomy as a consequence of parental overprotection.
Histrionic
(Scale 4)
Elevated scores indicate maximizing the attention and favors they receive,
while avoiding the indifference and disapproval of others. They exhibit an
insatiable search for stimulation and affection, but while appearing confident
they instead fear autonomy and continually need reassurance through all
relationships in which they engage.
Narcissistic
(Scale 5)
Elevated scores indicate the experience of primary pleasure by passively being
or focusing on themselves. They are identified by their egotistic self-
involvement as they have been taught to overvalue their self-worth and expect
others to recognize their specialness. Praise from others is desired and
encouraged, and little confirmation regarding genuine accomplishments is
needed to maintain their superiority.
65
Antisocial
(Scale 6A)
Elevated scores indicate acting to counter the expectation of pain and
depredation at the hands of others by engaging in dishonest or illegal behaviors
designed to exploit the environment for self-gain. They are skeptical of others’
motives, they desire autonomy, and wish revenge for what they perceive as
past injustices. They are irresponsible and impulsive and feel these behaviors
are justified as others are seen as unreliable and disloyal. Insensitivity and
ruthlessness are their only means of avoiding abuse and victimization.
Compulsive
(Scale 7)
Elevated scores indicate an ambivalent orientation that coincides with the
DSM-IV obsessive compulsive personality disorder. Their prudent, controlled
and perfectionistic ways derive from a conflict between hostility towards
others and fear of social disapproval. They resolve this ambivalence by
suppressing their resentment and by overconforming and placing high demands
on themselves and others.
Borderline
(Scale C)
Elevated scores indicate experiencing of intense endogenous moods with
recurring periods of dejection and apathy often interspersed with spells of
anger, anxiety, or euphoria. They exhibit unstable and labile mood; recurring
thoughts of self-mutilation and suicide; difficulty maintaining a sense of
identity; are preoccupied with securing affection; and a cognitive-affective
ambivalence as seen in the conflicting feelings of rage, love, and guilt toward
others.

66
MMPI-2 Clinical Scales
Hypochondriasis
(Scale )
Elevated scores indicate excessive concern about general health. They
present with a variety of somatic complaints with little or no organic basis.
High scores are also indicative of an individual who is preoccupied with
general body issues and have a self-centered focus in their life.
Depression
(Scale 2)
Elevated scores indicate the possible presence of a depressive disorder. This
individual may experience feelings of discouragement, pessimism, and
hopelessness. They may exhibit hyper-responsibility, high personal
standards, intrapunitiveness, psychomotor retardation, physical
malfunctioning, mental dullness, and brooding.
Hysteria
(Scale 3)
Elevated scores indicate experiencing some form of sensory or motor disorder
for which no organic basis could be established. This individual may have
specific physical complaints or troubling disorder, while others may deny
personal problems, shortcomings, or social anxiety.
Psychopathic
Deviance
(Scale 4)
Elevated scores indicate a general disregard for most social and moral
standards. This individual also displays a general disregard for the rights and
feelings of others. They may exhibit familial discord, authority problems,
social imperturbability, social alienation, and self-alienation.

67
Paranoia
(Scale 6)
Elevated scores indicate experiencing some form of paranoid condition or
paranoid state. This individual is marked by interpersonal sensitivitie4ws and
a tendency to misinterpret the motives and intentions of others. They tend to
be self-centered and insecure. They may also exhibit persecutory ideas,
poignancy, and naïveté.
Psychasthenia
(Scale 7)
Elevated scores indicate experiencing obsessive worries, compulsive rituals,
exaggerated fears, or general anxiety and distress. This individual exhibits
high moral standards, self-blame for things that go wrong, and rigid efforts to
control impulses.
Schizophrenia
(Scale 8)
Elevated scores indicate experiencing strange beliefs and/or perceptual
disturbances. This individual may also exhibit social alienation, emotional
alienation, and bizarre sensory experiences. High scores maybe indicative of
some form of psychotic disorder.
Hypomania
(Scale 9)
Elevated scores indicate experiencing the beginning stages of a manic
episode. This individual maybe overambitious and/or extroverted. High
scores are also indicative of amorality, psychomotor acceleration,
imperturbability, and ego inflation.

68
MMPI-Restructured Clinical (RC)
Demoralization
(Scale RCd)
Elevated scores are indicative of overall emotional discomfort and turmoil.
This individual may experience poor self-esteem and pessimism. High scores
are also indicative of a negative outlook on one’s past and future. They may
exhibit poor coping strategies and may feel like a failure.
Somatic
Complaints
(Scale RC1)
Elevated scores are indicative of an individual presenting with physical
complaints and chronic pain. This individual is preoccupied with bodily
functions and tends to develop physical symptoms as a result of psychological
or interpersonal difficulties. They typically are resistant to considering
psychological factors that may be related to physical symptoms.
Low Positive
Emotions
(Scale RC2)
Elevated scores indicate a lack of positive emotional engagement in life. This
individual is likely to be unhappy and demoralized, and have a high risk for the
development of depression. High scores are indicative of decreased energy,
indecisiveness, hopelessness, helplessness, and pessimism.
Cynicism
(Scale RC3)
Elevated scores are indicative of an individual who exhibits a lack of trust in
others. They tend to few others as uncaring, selfish, and exploitive. This scale
differs from others in that low scores are also interpreted. Low scores are
indicative of an individual who is naïve, gullible, and overly trusting of others.
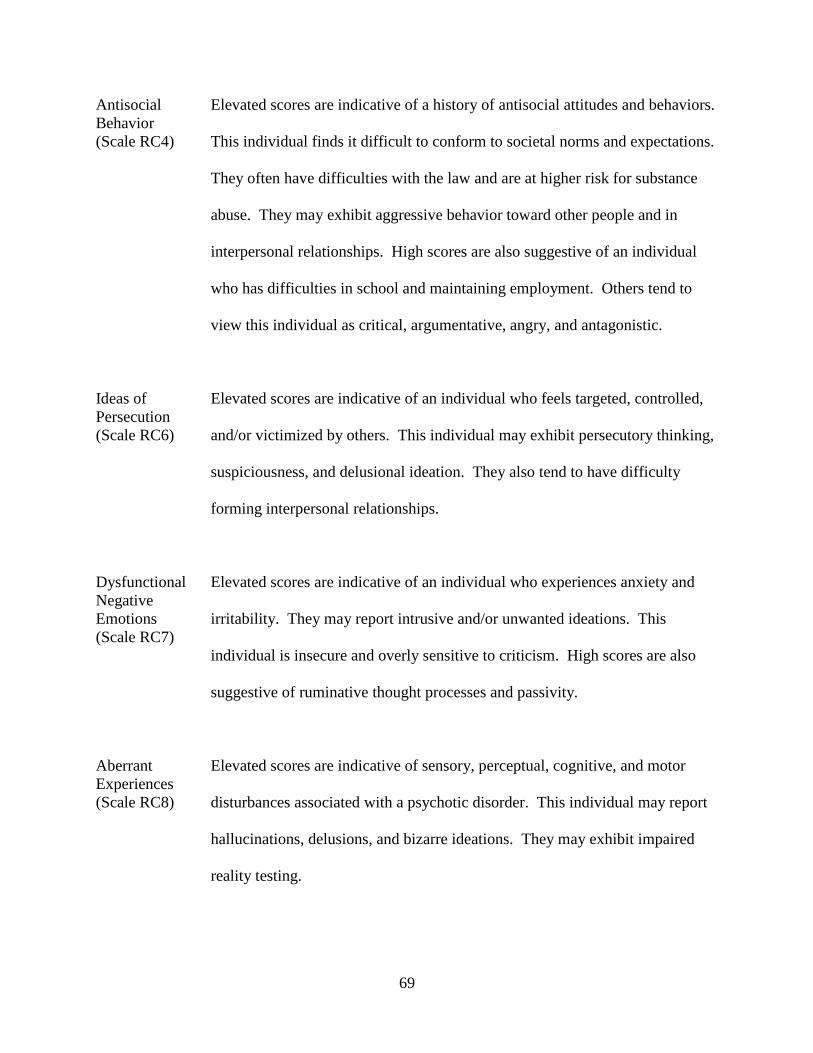
69
Antisocial
Behavior
(Scale RC4)
Elevated scores are indicative of a history of antisocial attitudes and behaviors.
This individual finds it difficult to conform to societal norms and expectations.
They often have difficulties with the law and are at higher risk for substance
abuse. They may exhibit aggressive behavior toward other people and in
interpersonal relationships. High scores are also suggestive of an individual
who has difficulties in school and maintaining employment. Others tend to
view this individual as critical, argumentative, angry, and antagonistic.
Ideas of
Persecution
(Scale RC6)
Elevated scores are indicative of an individual who feels targeted, controlled,
and/or victimized by others. This individual may exhibit persecutory thinking,
suspiciousness, and delusional ideation. They also tend to have difficulty
forming interpersonal relationships.
Dysfunctional
Negative
Emotions
(Scale RC7)
Elevated scores are indicative of an individual who experiences anxiety and
irritability. They may report intrusive and/or unwanted ideations. This
individual is insecure and overly sensitive to criticism. High scores are also
suggestive of ruminative thought processes and passivity.
Aberrant
Experiences
(Scale RC8)
Elevated scores are indicative of sensory, perceptual, cognitive, and motor
disturbances associated with a psychotic disorder. This individual may report
hallucinations, delusions, and bizarre ideations. They may exhibit impaired
reality testing.

70
Hypomanic
Activation
(Scale RC9)
Elevated scores are indicative of individual who experiences thought racing,
high energy levels, heightened mood, and irritability. They may exhibit
extraversion, aggressiveness, impulsivity, and substance abuse problems. High
scores are also suggestive of an individual who is a sensation seeker or a risk
taker.

71
Morey Personality Scales
Avoidant
(Scale AVD)
Elevated scores indicate vigilance and being always on guard and ready to
distance themselves from anxious anticipation of life’s painful or negatively
reinforcing experiences. Though they desire relationships, they deny these
feelings and feel the safest when interpersonally distant.
Dependent
(Scale DEP)
Elevated scores indicate a tendency to turn to others for support and nurturance,
they wait passively for their leadership of other and lack initiation and
autonomy as a consequence of parental overprotection.
Compulsive
(Scale CPS)
Elevated scores are indicative of an individual who is preoccupied with rules
and duties, unable to express warmth and caring, and is highly oriented toward
a lifestyle marked by productivity and efficiency. They tend to be
temperamentally and emotionally insensitive, and are generally distant from
other individuals. Others may describe this individual as self-centered and
perfectionistic.
Passive-
Aggressive
(Scale PAG)
Elevated scores are indicative of an essential behavior pattern which is
indirectly expressed resistance to social and occupational performance
expectations that results in chronic ineffectiveness. The core characteristic of
this individual is hostility; however, is not expressed directly which results in
double messages to others. They tend to have difficulty maintaining long-term
relationships as they are highly skilled at “pushing the buttons” of others.

72
Narcissistic
(Scale NAR)
Elevated scores indicate the experience of primary pleasure by passively being
or focusing on themselves. They are identified by their egotistic self-
involvement as they have been taught to overvalue their self-worth and expect
others to recognize their specialness. Praise from others is desired and
encouraged, and little confirmation regarding genuine accomplishments is
needed to maintain their superiority.
Antisocial
(Scale ANT)
Elevated scores indicate acting to counter the expectation of pain and
depredation at the hands of others by engaging in dishonest or illegal behaviors
designed to exploit the environment for self-gain. They are skeptical of others’
motives, they desire autonomy, and wish revenge for what they perceive as past
injustices. They are irresponsible and impulsive and feel these behaviors are
justified as others are seen as unreliable and disloyal. Insensitivity and
ruthlessness are their only means of avoiding abuse and victimization.
Histrionic
(Scale HST)
Elevated scores indicate maximizing the attention and favors they receive,
while avoiding the indifference and disapproval of others. They exhibit an
insatiable search for stimulation and affection, but while appearing confident
they instead fear autonomy and continually need reassurance through all
relationships in which they engage.
73
Borderline
(Scale (BDL)
Elevated scores indicate experiencing of intense endogenous moods with
recurring periods of dejection and apathy often interspersed with spells of
anger, anxiety, or euphoria. They exhibit unstable and labile mood; recurring
thoughts of self-mutilation and suicide; difficulty maintaining a sense of
identity; are preoccupied with securing affection; and a cognitive-affective
ambivalence as seen in the conflicting feelings of rage, love, and guilt toward
others.
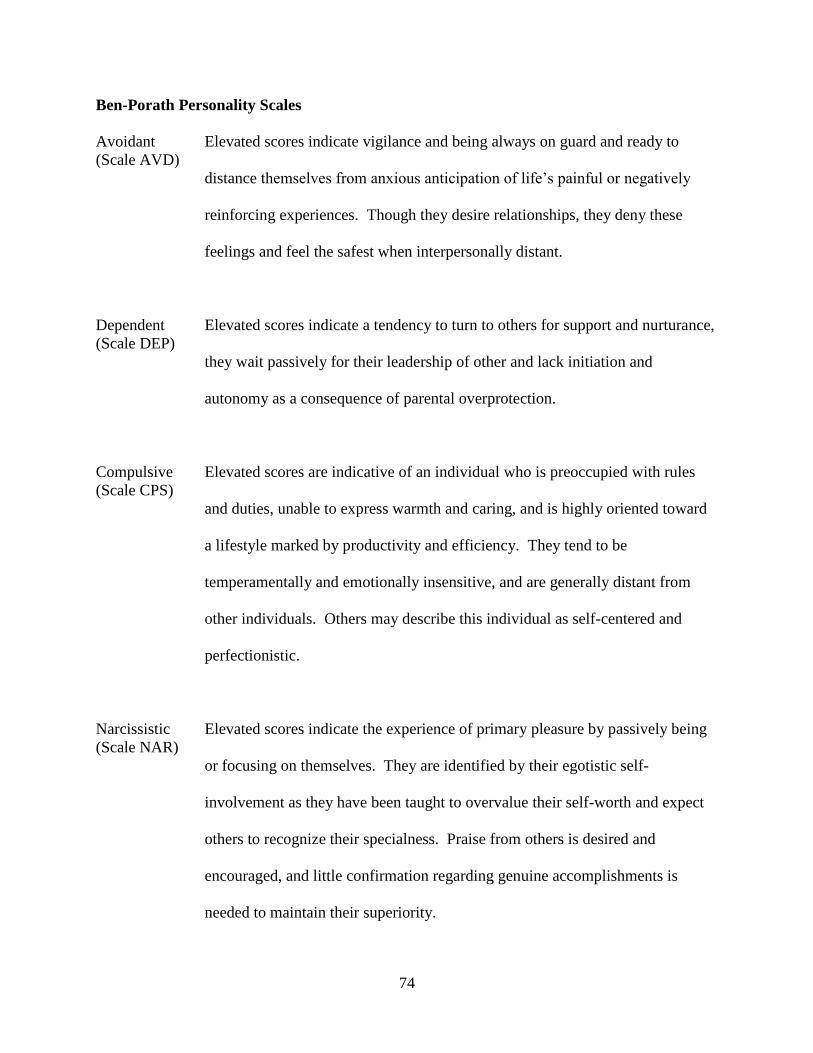
74
Ben-Porath Personality Scales
Avoidant
(Scale AVD)
Elevated scores indicate vigilance and being always on guard and ready to
distance themselves from anxious anticipation of life’s painful or negatively
reinforcing experiences. Though they desire relationships, they deny these
feelings and feel the safest when interpersonally distant.
Dependent
(Scale DEP)
Elevated scores indicate a tendency to turn to others for support and nurturance,
they wait passively for their leadership of other and lack initiation and
autonomy as a consequence of parental overprotection.
Compulsive
(Scale CPS)
Elevated scores are indicative of an individual who is preoccupied with rules
and duties, unable to express warmth and caring, and is highly oriented toward
a lifestyle marked by productivity and efficiency. They tend to be
temperamentally and emotionally insensitive, and are generally distant from
other individuals. Others may describe this individual as self-centered and
perfectionistic.
Narcissistic
(Scale NAR)
Elevated scores indicate the experience of primary pleasure by passively being
or focusing on themselves. They are identified by their egotistic self-
involvement as they have been taught to overvalue their self-worth and expect
others to recognize their specialness. Praise from others is desired and
encouraged, and little confirmation regarding genuine accomplishments is
needed to maintain their superiority.
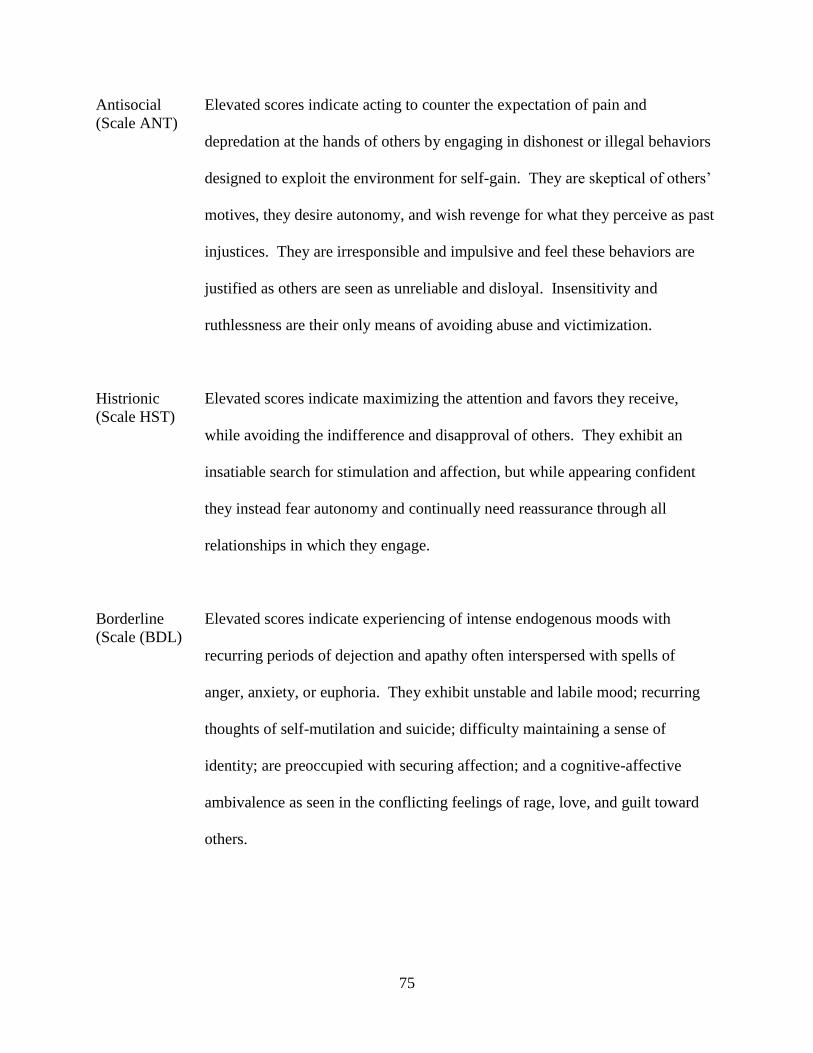
75
Antisocial
(Scale ANT)
Elevated scores indicate acting to counter the expectation of pain and
depredation at the hands of others by engaging in dishonest or illegal behaviors
designed to exploit the environment for self-gain. They are skeptical of others’
motives, they desire autonomy, and wish revenge for what they perceive as past
injustices. They are irresponsible and impulsive and feel these behaviors are
justified as others are seen as unreliable and disloyal. Insensitivity and
ruthlessness are their only means of avoiding abuse and victimization.
Histrionic
(Scale HST)
Elevated scores indicate maximizing the attention and favors they receive,
while avoiding the indifference and disapproval of others. They exhibit an
insatiable search for stimulation and affection, but while appearing confident
they instead fear autonomy and continually need reassurance through all
relationships in which they engage.
Borderline
(Scale (BDL)
Elevated scores indicate experiencing of intense endogenous moods with
recurring periods of dejection and apathy often interspersed with spells of
anger, anxiety, or euphoria. They exhibit unstable and labile mood; recurring
thoughts of self-mutilation and suicide; difficulty maintaining a sense of
identity; are preoccupied with securing affection; and a cognitive-affective
ambivalence as seen in the conflicting feelings of rage, love, and guilt toward
others.

76
Appendix C: Descriptions of DSM-IV-TR Personality Disorder Clusters
Cluster A: The Odd, Eccentric Cluster (This Cluster was excluded from the current study)
Cluster A includes Paranoid Personality Disorder, Schizoid Personality Disorder, and
Schizotypal Personality Disorders. The common features of the personality disorders in this
cluster are social awkwardness and social withdrawal.
Cluster B: The Dramatic, Emotional, Erratic Cluster
Cluster B includes Borderline Personality Disorder, Narcissistic Personality Disorder, Histrionic
Personality Disorder, and Antisocial Personality Disorder. Disorders in this cluster share
problems with impulse control and emotional regulation.
Cluster C: The Anxious, Fearful Cluster
Cluster C includes the Avoidant, Dependent, and Obsessive-Compulsive Personality Disorders.
These three personality disorders share a high level of anxiety.