a client–server framework for 3d remote visualization of ... · a client–server framework for...
TRANSCRIPT

“fonc-03-00018” — 2013/9/24 — 11:47 — page 1 — #1
ORIGINAL RESEARCH ARTICLEpublished: 22 February 2013
doi: 10.3389/fonc.2013.00018
A client–server framework for 3D remote visualization ofradiotherapy treatment spaceAnand P. Santhanam*,Yugang Min,Tai H. Dou, Patrick Kupelian and Daniel A. Low
Department of Radiation Oncology, University of California, Los Angeles, CA, USA
Edited by:
Edward Sternick, Rhode IslandHospital, USA
Reviewed by:
Deepak Khuntia, Western RadiationOncology, USAChristopher Schultz, Medical Collegeof Wisconsin, USA
*Correspondence:
Anand P. Santhanam, Department ofRadiation Oncology, University ofCalifornia, 200 Medical plaza drive,Suite B265, Los Angeles, CA 90095,USAe-mail: [email protected]
Radiotherapy is safely employed for treating wide variety of cancers. The radiotherapyworkflow includes a precise positioning of the patient in the intended treatment position.While trained radiation therapists conduct patient positioning, consultation is occasionallyrequired from other experts, including the radiation oncologist, dosimetrist, or medicalphysicist. In many circumstances, including rural clinics and developing countries, thisexpertise is not immediately available, so the patient positioning concerns of the treatingtherapists may not get addressed. In this paper, we present a framework to enable remotelylocated experts to virtually collaborate and be present inside the 3D treatment room whennecessary. A multi-3D camera framework was used for acquiring the 3D treatment space.A client–server framework enabled the acquired 3D treatment room to be visualized inreal-time. The computational tasks that would normally occur on the client side wereoffloaded to the server side to enable hardware flexibility on the client side. On the serverside, a client specific real-time stereo rendering of the 3D treatment room was employedusing a scalable multi graphics processing units (GPU) system. The rendered 3D imageswere then encoded using a GPU-based H.264 encoding for streaming. Results showedthat for a stereo image size of 1280 × 960 pixels, experts with high-speed gigabit Ethernetconnectivity were able to visualize the treatment space at approximately 81 frames persecond. For experts remotely located and using a 100 Mbps network, the treatmentspace visualization occurred at 8–40 frames per second depending upon the networkbandwidth.This work demonstrated the feasibility of remote real-time stereoscopic patientsetup visualization, enabling expansion of high quality radiation therapy into challengingenvironments.
Keywords: remote visualization, radiotherapy, 3D monitoring, patient positioning, client–server architecture
INTRODUCTIONRadiotherapy is safely employed for treating wide variety of can-cers. The radiotherapy workflow includes the positioning of thepatient in the intended treatment position. Trained radiation ther-apists conduct this, but occasionally consultation is required fromother experts, including the radiation oncologist, dosimetrist, ormedical physicist. In many circumstances, including rural clin-ics and developing countries, this expertise is not immediatelyavailable, so the concerns of the treating therapists may not getaddressed. By the year 2015, 15 million new cancer patients areexpected in the world each year, of which 10 million will be in thedeveloping countries. Ensuring that those patients receive appro-priate treatment is a major challenge (Bhadrasain, 2005; NationalCancer Institute, 2010; International Agency for Research on Can-cer, 2012). Between 2005 and 2025, 100 million cancer victims inthe developing countries will require radiotherapy, for cure or therelief of symptoms such as pain and bleeding. However, the lack ofradiotherapy treatment expertise in those countries leads to only20–25% of patients in developing countries being treated withradiotherapy (Bhadrasain, 2005). This situation will only worsenin the future unless steps are taken to address it.
Radiation therapy treatments continue to gain complexity andmodern linear accelerators are essentially robotically controlled,
creating the need for more advanced in-room monitoring. Currentmonitoring is restricted to one or more 2D video cameraspositioned in the room and monitored by the radiation thera-pists. There are neither computer-based analysis nor monitoringof the video, they are intended as straightforward monitoringdevices because the therapists cannot be in the room during treat-ment and the radiation shielding requirements preclude the use ofwindows.
One of the challenges of modern radiation therapy is the distri-bution of specific expertise required for each clinic to safely treattheir patients. Medical physicists, for example, are often called tothe treatment room to assist the radiation therapists in evaluat-ing a treatment set up. In many clinics, especially rural clinics,there are not enough medical physicists to allow full-time access,and the therapists will not have access to the expertise. This prob-lem also exists in treatment planning expertise. Recent advancesin the digital storage and efficient and reliable communicationshave enabled improved 2D remote visualization that facilitateda decentralized radiotherapy services by allowing remote qualityassurance of treatment delivery (Olsen et al., 2000). An early worktoward such a 3D collaborative radiotherapy workflow was devel-oped at the departments of radiotherapy at the University Hospitalof North Norway and the Norwegian Radium Hospital (Norum et
www.frontiersin.org February 2013 | Volume 3 | Article 18 | 1

“fonc-03-00018” — 2013/9/24 — 11:47 — page 2 — #2
Santhanam et al. 3D remote visualization of radiotherapy
al., 2005). The treatment planning systems at the two institutionswere connected through a 2 Mbps digital telecommunication lineand 2D videoconferencing units were installed. The feasibility ofperforming clinical operations such as treatment planning, super-vision, second opinions, and education using the collaborativesystem were investigated for two dummy cases and six patients.Remote treatment simulation procedures were carried out for fivepatients and a cost-minimization analysis was performed. It wasobserved that 2D remote supervision was possible with the thresh-old (break-even point) comparing the costs of such visualizationto be 12 patients/year.
Virtual reality-based visualizations greatly help in develop-ing 3D collaborative environments for radiotherapy applications.Efforts by peers have focused on developing visualization frame-works specifically for radiotherapy training (Phillips et al., 2008),planning (Geng, 2008), and treatment simulation (Santhanam etal., 2008). While 3D visualization has assisted in the planning andsimulation process, it has not been used in the treatment room.
Our context in this paper is focused on real-time acquisitionand visualization of the patient treatment setup for radiotherapy.While expertise that is required in the treatment room can begiven over the telephone, it will be much less effective than hav-ing the expert physically within the room. We hypothesize that3D visualization of the patient setup and intrafraction motionwill enable experts to provide important consultative services torural and developing country clinics. In this paper, we present anapproach for remote visualizing in 3D the patient setup, allow-ing the expert to interact with the local team as though theywere in the linear accelerator room with them. The key contri-bution of this paper is to present a real-time remote multi-3Dcamera-based imaging system that provides remote real-time 3Dimages of the patient positioning setup at greater than 30 framesper second (FPS) required for effective visualization (Hamza-lupet al., 2007).
MATERIALS AND METHODSMULTI-3D CAMERA SETUPFigure 1 presents the schematic representation of the proposed3D patient and treatment setup monitoring system. As in a typicalexternal beam radiotherapy setup, a patient is illustrated to lieon a treatment couch with the linear accelerator gantry targetingthe region of interest. A set of 3D cameras were used for illus-tration purposes to acquire the treatment environment. For oursetup, the cameras were distributed throughout the room to cap-ture the entire patient, couch, and gantry and to minimize gapsin the images caused by occlusions. The cameras were connectedto a controller program running on a computer through universalserial bus (USB) ports.
For this work, we selected the Kinect camera as the 3D cameraused for the proposed 3D monitoring system as it was cost effectiveand readily available across the world. From a technical perspec-tive, Kinect cameras provide both color and depth information,which enables to use the wide range of vision and 3D informationprocessing algorithms for monitoring and visualization purposes.These cameras were being sold as part of a computer gaming sys-tem, so they were not required to be quantitative. However, inthis application, the images from multiple cameras needed to bestitched together to form a seamless and visually accurate represen-tation of the room environment. If the cameras were not accuratelycalibrated, the surfaces from two cameras would not coincidewhere their image fields overlapped. This led to the developmentof a calibration procedure (Santhanam et al., in review).
The camera calibration was performed for each camera todetermine the relationship between the raw depth informationand the calibrated depth. Images from each camera were firstcorrected for camera-specific distortion. Image refining steps pre-pared the 3D information (2D color and depth information)from each of the cameras into a single 3D context. Image stitch-ing was performed by computing the transformation matrix that
FIGURE 1 | A schematic representation of the camera setup for head and neck radiotherapy.
Frontiers in Oncology | Radiation Oncology February 2013 | Volume 3 | Article 18 | 2

“fonc-03-00018” — 2013/9/24 — 11:47 — page 3 — #3
Santhanam et al. 3D remote visualization of radiotherapy
transforms the 3D information of each camera into a specific ref-erence camera. The 3D stitched images represented the patientsetup on the treatment couch along with the gantry and couchpositions.
CLIENT–SERVER ARCHITECTUREA client and server system was used to correct, stitch, and trans-port the images in real-time to the observer. The term client refersto the user interface associated with each remotely located expert.The term server relates to the software interface that controls themulti 3D Kinect camera system discussed in the“Multi-3D CameraSetup” section. Figure 2 schematically represents the client–serversetup used for the 3D visualization. Such a setup enables multi-ple remotely located experts to simultaneously visualize the 3Dcontent. The client and the server interface are now described.
Client interfaceFor our proposed visualization system, we offloaded the renderingtask to the server to allow the 3D content to be visualized at 30 FPSfor satisfying real-time requirements (Hamza-lup et al., 2007). Inorder to achieve this for every client, each client was associated witha session ID that uniquely identified the client and the associatedstereoscopic visualization parameters, which were the eye locationand orientation in the treatment room global coordinates, the gazedirection associated with each eye, the 3D clipping boundary, 3Dzoom factor and a user-provided value that selected the imagecompression quality. Each session ID was also associated with adesired visualization frame rate, which, coupled with the networktraffic rate, determined the 3D resolution of the visualized space.A TCP-based connection (Stevens, 2003) was used between the
client and the server. Once the connection was established, theclient interface sent a “heartbeat” message to the server providingthe visualization parameters. The server generated the stereoscopicimage and sends it back to the client.
Server interfaceThe server interface consisted of three pipelined proceduralthreads. The first procedural thread was used to creating a connec-tion between the client and the server. The thread also maintainedthe frame rate desired by the client. The second procedural threadacquired the 3D treatment room space as discussed in “Multi-3DCamera Setup” section and the third procedural thread communi-cated with the client for sending the 2D stereoscopic projections ofthe treatment room space. Figure 3 presents a schematic represen-tation of the client–server interface. For each client identified by itssession ID, the stereoscopic visualization properties were retrievedand, using a GPU-based render-to-texture feature, the 3D scenewas projected for each eye and its clipping properties to form a 2Dimage (Shreiner, 2009).
The steps involved in the render-to-texture feature are as fol-lows. First the 3D treatment room space, in the form of a vertexlist, was transferred to one of the GPU’s memory. We then assigneda texture memory space as the location where the final renderedimage would be placed. We then created an openGL pipeline thatprocessed the 3D vertex list for each eye and clipping boundaryspecifications provided by the client. Finally, using the GPU’s vec-tor functionality, we projected each 3D location in the vertex listthrough the OpenGL pipeline onto the pre-determined 2D tex-ture. The 2D texture was then copied from the GPU into theserver (Shreiner, 2009).
FIGURE 2 | A schematic representation of the proposed tracking system for head and neck radiotherapy.
www.frontiersin.org February 2013 | Volume 3 | Article 18 | 3

“fonc-03-00018” — 2013/9/24 — 11:47 — page 4 — #4
Santhanam et al. 3D remote visualization of radiotherapy
FIGURE 3 | A schematic representation of the client–server interfaces.
The steps that occur on the client is represented by red while the steps thatoccur on the server side is represented by blue. The brown arrowsrepresent the client–server network interface.
The 2D images were losslessly encoded in the H.264 stream for-mat, which reduced the network-transmitted 2D image data size.The encoded 2D images for each eye were then transmitted to theclient interface, which were subsequently decoded and visualizedusing Nvidia’s 3D vision interface.
GPU-based H.264 video encodingThe computational complexity of H.264 encoding would takea few seconds per frame if conducted using traditional com-pute processing units (CPU)-based architecture and so woulddegrade the real-time nature of the remote visualization (Wu etal., 2009). To alleviate this issue, we used a GPU-based H.264video encoding process (Nvidia, 2012). Figure 4 presents aschematic representation of the proposed encoding system. Thefirst step converted a given 2D image from its native red greenblue (RGB) format to the YUV image format. To achieve thiswith GPU acceleration, the given image was tiled at 8 × 8pixels and the subsequent 64 RGB pixel values were loadedinto shared memory in 64 parallel threads. The RGB valueswere stored in a 1D array in shared memory to allow simul-taneous computations on the same data structure. The colorconversion from RGB to YUV was implemented through threeequations: Y = 0.29900 * R + 0.58700 * G + 0.11400 * B − 128;U = −0.16874 * R − 0.33126 * G + 0.50000 * B;V = 0.50000 * R + 0.41869 * G − 0.08131 * B. The three equationswere sequentially computed by one thread for each pixel. The nextstep was to downsample the YUV image. The downsampling ofthe U and V components was done by 32 threads in parallel. 16threads computed the mean of a 2 × 2 pixel block for the U andthe other 16 threads on the same pixel block for the V values. Themean was computed by adding all four values and dividing theresult by 4. The division was replaced by a shifting operation tooptimize performance. The next step was to store the down sam-pled YUV values in global memory. The Y values were stored inconsecutive 8 × 8 pixel blocks, which were mapped to a 1D array.The same held for the U and the V components. However, the
FIGURE 4 | A schematic representation of the steps involved in the
GPU-based H.264 encoding.The red box represents the steps that happenin the GPU while the blue boxes represent the steps that occur in the GPU.
resulting down sampled 4 × 4 blocks were grouped to 8 × 8 blocksto prepare the data for a discrete cosine transformation (DCT).
For the DCT kernel, each component (Y, U, and V ) was pro-cessed separately by one call to kernel 2. It had eight threads perblock and did the following: loading the data was straightforwardsince it was already stored in the required 8 × 8 pixel blocks. Eachof the eight threads loaded one row of a block into shared mem-ory. To avoid the complex and sequential computation of a 2DDCT, the computation was split into several 1D separable DCTs.The computation of the DCT for each row was independent andwas conducted by eight parallel threads. By using this optimized1D DCT algorithm, the 2D DCT of an 8 × 8 pixel block wascomputed using 464 additions and 80 multiplications. Quantiza-tion was a simple division by the user-selected image compressionquality factor for every coefficient in the 8 × 8 block. Quanti-zation tables were similar for all blocks of a component. Beforethey were applied in the DCT kernel, the tables were multiplied bythe scaling values of the DCT step as described before. The scaledand adapted quantization tables were applied to the coefficientsby eight threads in parallel. Each thread computed one line ofeight DCT coefficients and multiplies them by the inverse of thecorresponding value in the quantization table.
The last step of the H.264 compression was Huffman encoding,which made use of the many zeros in lower frequencies result-ing from DCT and quantization (Cheng et al., 2004). It includedan entropy encoder that was used to encode the discrete wavelettransformation (DWT) coefficients plane-wise and an arithmeticencoding that was used for removing redundancy. Finally, a ratecontrol algorithm was employed to truncate the data while keepingthe image distortion low.
Jitter avoidanceVisualization using data streams is limited by frame-to-frame jit-ters that occur because of non-uniform network data transfer rates(Hamza-lup et al., 2007). Such jitters affect the real-time visual-ization perception for the client. Playout buffers are commonly
Frontiers in Oncology | Radiation Oncology February 2013 | Volume 3 | Article 18 | 4
“fonc-03-00018” — 2013/9/24 — 11:47 — page 5 — #5
Santhanam et al. 3D remote visualization of radiotherapy
used for alleviating jitter, where the video stream is buffered fora fixed amount of time before the client visualizes the frame (Liet al., 2008). The buffering time used for the playout buffer wasadaptively varied in order to suit the client–server network con-nection. At each frame received by the client, the network delayt for a set of N frames was calculated by the client. A clusteredtemporal averaging that eliminated random fluctuations in thenetwork delay was used to find the average network delay t ′. Theclient then buffered the frames for the t ′ time frame. The value ofN was adaptively varied using a Go-Back N algorithm (Stevens,2003) to account for temporal fluctuations in the networkdelay.
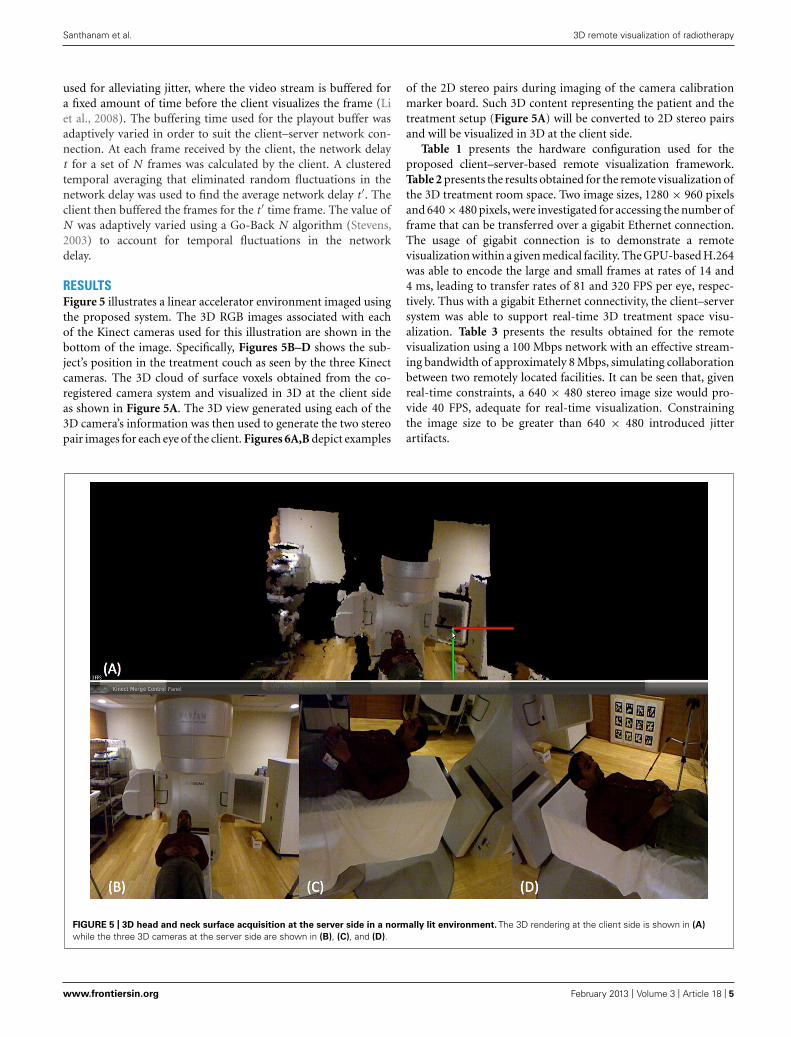
RESULTSFigure 5 illustrates a linear accelerator environment imaged usingthe proposed system. The 3D RGB images associated with eachof the Kinect cameras used for this illustration are shown in thebottom of the image. Specifically, Figures 5B–D shows the sub-ject’s position in the treatment couch as seen by the three Kinectcameras. The 3D cloud of surface voxels obtained from the co-registered camera system and visualized in 3D at the client sideas shown in Figure 5A. The 3D view generated using each of the3D camera’s information was then used to generate the two stereopair images for each eye of the client. Figures 6A,B depict examples
of the 2D stereo pairs during imaging of the camera calibrationmarker board. Such 3D content representing the patient and thetreatment setup (Figure 5A) will be converted to 2D stereo pairsand will be visualized in 3D at the client side.
Table 1 presents the hardware configuration used for theproposed client–server-based remote visualization framework.Table 2 presents the results obtained for the remote visualization ofthe 3D treatment room space. Two image sizes, 1280 × 960 pixelsand 640 × 480 pixels, were investigated for accessing the number offrame that can be transferred over a gigabit Ethernet connection.The usage of gigabit connection is to demonstrate a remotevisualization within a given medical facility. The GPU-based H.264was able to encode the large and small frames at rates of 14 and4 ms, leading to transfer rates of 81 and 320 FPS per eye, respec-tively. Thus with a gigabit Ethernet connectivity, the client–serversystem was able to support real-time 3D treatment space visu-alization. Table 3 presents the results obtained for the remotevisualization using a 100 Mbps network with an effective stream-ing bandwidth of approximately 8 Mbps, simulating collaborationbetween two remotely located facilities. It can be seen that, givenreal-time constraints, a 640 × 480 stereo image size would pro-vide 40 FPS, adequate for real-time visualization. Constrainingthe image size to be greater than 640 × 480 introduced jitterartifacts.
FIGURE 5 | 3D head and neck surface acquisition at the server side in a normally lit environment. The 3D rendering at the client side is shown in (A)
while the three 3D cameras at the server side are shown in (B), (C), and (D).
www.frontiersin.org February 2013 | Volume 3 | Article 18 | 5

“fonc-03-00018” — 2013/9/24 — 11:47 — page 6 — #6
Santhanam et al. 3D remote visualization of radiotherapy
FIGURE 6 | 3D stereo images generated for each of the eyes for a known view angle. The subtle changes between the left and right eye images are shownwith the coordinate system. Each of these images were encoded with H.264 standard at the server side and streamed to the client side for real-timevisualization.
Table 1 | System configuration.
3D Camera Microsoft Kinect (6 cameras)
Server Intel Core i7 3.6 Ghz, 8 GB RAM
Server GPU Nvidia GTX 680m (2)
Network interface Ethernet
Client Intel Core i7 3.6 GHz, 8 GB RAM
3D display Viewsonic 120 Hz LED display
3D wearable accessory Nvidia 3D vision
Table 2 | Remote visualization characteristics using a gigabit Ethernet
connection.
RGB image size 1280 × 960 pixels 640 × 480 pixels
Stereo H.264 frame size 110 KB 28.5 KB
Stereo H.264 encoding time 14 ms 4 ms
Stereo image generation time 30 ms 30 ms
Effective streaming bandwidth 72 Mbps 72 Mbps
Frames transferred over network ∼81 FPS ∼320 FPS
Table 3 | Remote visualization characteristics using a 100 Mbps
connection with a frame rate of 30 FPS.
RGB image size 1280 × 960 pixels 640 × 480 pixels
Stereo H.264 frame size 110 KB 28.5 KB
Stereo H.264 encoding time 14 ms 4 ms
Effective streaming bandwidth 8 Mbps 8 Mbps
Frames transferred over network ∼8 FPS ∼40 FPS
DISCUSSIONA framework for remote 3D visualization is presented in this paper.A multi-3D camera framework is used for acquiring the D treat-ment space. A client–server framework enables the 3D treatmentspace to be visualized by remotely located experts in real-time. Thevisualization tasks on the client side are offloaded into the serverside to enable flexibility on the client side. A scalable multi GPUsystem that enables rendering the 3D treatment space in stereoand in real-time is employed on the server side. The rendered 3Dimages are then encoded using a GPU-based H.264 encoding forstreaming purposes. Results showed that experts within a clinicalfacility and with high-speed gigabit Ethernet connectivity will beable to visualize the treatment space with 1280 × 960 pixel resolu-tion at approximately 81 frames per second. For experts remotelylocated, the treatment space visualization can be conducted at40 FPS with a resolution of 640 × 480 pixels.
Two technical limitations were observed in our client–serversetup. The network bandwidth did not form a bottleneck forexperts located in the same high-speed network and visualizingwith a frame size of up to 1920 × 1080 pixels. The 3D treatmentspace acquisition, which occurred at a rate of 30 FPS formed thebottleneck in this case. The other key tasks such as 3D stereorendering and H.264 encoding occurred at a rate faster than thetreatment space acquisition rate. However, it was observed that forframe sizes greater than 2550 × 1940 pixels, the H.264 encodingtook more time that the camera acquisition. Thus for greater framesizes, offloading client tasks to the server led to an overall reductionin the speedup. Future work will focus on improving the H.264encoding algorithm efficiency for stereoscopic video sequences.
The second limitation was that the number of server supportedclients depended on the number of GPUs available for providingthe required fast 3D rendering and encoding because each GPUwas dedicated to handle a set of client tasks based on the requestedframe size. Future work will focus on using a GPU cluster coupledusing load-balancing algorithms that enable efficient GPU usage.
Frontiers in Oncology | Radiation Oncology February 2013 | Volume 3 | Article 18 | 6

“fonc-03-00018” — 2013/9/24 — 11:47 — page 7 — #7
Santhanam et al. 3D remote visualization of radiotherapy
Jitter in the 3D visualization occurred for clients that usedavailable bit-rate network connections. The jitter avoidance mech-anism discussed in this paper removed such artifacts, but itseffectiveness was limited by the network behavior. Increases
in the network delays and packet loss rates led to randomdecrease in the N value and hampered the visualization system.Future work will focus on addressing such network connectivityissues.
REFERENCESBhadrasain, V. (2005). Radiation ther-
apy for the developing countries. J.Cancer Res. Ther. 1, 7–8.
Cheng, L., Bhushan, A., Pajarola, R.,and El Zarki, M., (2004). Real-time3D graphics streaming using mpeg-4. IEEE/ACM Workshop on broadbandwireless services and applications, 1.
Geng, J., (2008). Volumetric 3D displayfor radiation therapy planning. IEEEJ. Display Technol. 4, 437–450.
Hamza-lup, F. G., Santhanam, A. P.,Imielinska, C., Meeks, S. L., Rolland,J. P. (2007). Distributed augmentedreality with 3D lung dynamics – aplanning tool concept. IEEE Trans.Inf. Technol. Biomed. 11, 40–46.
International Agency for Research onCancer. (2012). World Cancer Fact-sheet. Available at: http://www.iarc.fr/en/media-centre/iarcnews/pdf/Global%20factsheet-2012.pdf
Li, Y., Markopoulou, A., Apostolopou-los, J., and Bambos, N. (2008).
Content aware playout and packetscheduling for video streaming overwireless links. IEEE Trans. Multimed.10, 885–895.
National Cancer Institute. (2010).Cancer Prevalence and Cost ofCare Projections. Available at:http://costprojections.cancer.gov
Norum, J., Bruland, Ø. S., Spanne, O.,Bergmo, T., Green, T., Olsen, D. R.,et al. (2005). Telemedicine in radio-therapy: a study exploring remotetreatment planning supervision andeconomics. J. Telemed. Telecare 11,245–250.
Nvidia (2012). Nvidia Cuda VideoEncoder. Nvidia API Specification.
Olsen, J. H., Bruland, O. S., and Davis,B. J., (2000). Telemedicine in radio-therapy treatment planning: require-ments and applications. Radiother.Oncol. 54, 255–259.
Phillips, R., Ward, J. W., Page, L.,Grau, C., Bojen, A., Hall, J., etal. (2008). Virtual reality training
for radiotherapy becomes a reality.Stud. Health Technol. Inform. 132,366–371.
Santhanam, A. P., Willoughby, T. R.,Kaya, I., Shah, A. P., Meeks, S. L.,Rolland, J. P., et al. (2008). A displayframework for visualizing real-time3D lung tumor radiotherapy. IEEE J.Display Technol. 4, 473–481.
Shreiner, D., (2009). OpenGL Program-ming Guide. Boston: Addison-WesleyProfessional.
Stevens, R., (2003). Unix Network Pro-gramming. Boston: Addison-WesleyProfessional.
Wu, N., Wen, M., Wu, W., Ren, J., Su,H., xun, C., et al. (2009). “StreamingHD H.264 encoder on programmableprocessors,” in ACM InternationalConference on Multimedia (New York:ACM).
Conflict of Interest Statement: Theauthors declare that the research wasconducted in the absence of any com-mercial or financial relationships that
could be construed as a potential con-flict of interest.
Received: 08 October 2012; accepted:23 January 2013; published online: 22February 2013.Citation: Santhanam AP, Min Y, DouTH, Kupelian P and Low DA (2013) Aclient–server framework for 3D remotevisualization of radiotherapy treatmentspace. Front. Oncol. 3:18. doi: 10.3389/fonc.2013.00018This article was submitted to Frontiersin Radiation Oncology, a specialty ofFrontiers in Oncology.Copyright © 2013 Santhanam, Min,Dou, Kupelian and Low. This is an open-access article distributed under the termsof the Creative Commons AttributionLicense, which permits use, distributionand reproduction in other forums, pro-vided the original authors and sourceare credited and subject to any copy-right notices concerning any third-partygraphics etc.
www.frontiersin.org February 2013 | Volume 3 | Article 18 | 7