a clean electric energy strategy for arizona
TRANSCRIPT
A Clean Electric Energy Strategy for Arizona
A Clean Electric Energy Strategy for Arizona
Western resource AdvocAtes2
A Clean Electric Energy Strategy for Arizona
This report is one of a series prepared by Western Resource Advocates on clean energy resources to meet the electric energy service needs of Arizona. It was funded by a grant
from the Energy Foundation.
The report was prepared by David Berry with assistance from John Nielsen and Nicole Theerasatiankul (Western Resource Advocates), Amanda Ormond (the Ormond
Group), Jeff Schlegel and Howard Geller (Southwest Energy Efficiency Project), Roger Clark (Grand Canyon Trust), and
Diane Brown (Arizona Public Interest Research Group).
The report is dedicated to Shimon Awerbuch (1946–2007), who worked in Europe and the United States to educate
decision makers on the risks of fossil fuels and the benefits of renewable energy. He visited Arizona on several occasions to
present his ideas to utility regulators and others.
Layout/Design: Jeremy Carlson Design Cover solar panel photo courtesy of American Solar Electric
Western Resource Advocates
2260 Baseline Road, Suite 200 Boulder, CO 80302
Tel: (303) 444-1188 Fax: (303) 786-8054
www.westernresourceadvocates.org
© 2007

3
A Clean Electric Energy Strategy for Arizona
Western resource AdvocAtes
Executive Summary . . . . . . . . . . . . . . . . . . . . . . . . . . . . . . 4
Introduction . . . . . . . . . . . . . . . . . . . . . . . . . . . . . . . . . . . . 6
Goals . . . . . . . . . . . . . . . . . . . . . . . . . . . . . . . . . . . . . . . . . 7Reliability Goals . . . . . . . . . . . . . . . . . . . . . . . . . . . . . . 7Environmental Performance Goals . . . . . . . . . . . . . . . . 7Cost Goals . . . . . . . . . . . . . . . . . . . . . . . . . . . . . . . . . . 8
Resource Options . . . . . . . . . . . . . . . . . . . . . . . . . . . . . . . . 9Energy Efficiency . . . . . . . . . . . . . . . . . . . . . . . . . . . . . 9Conventional Generation . . . . . . . . . . . . . . . . . . . . . . . 9Renewable Energy . . . . . . . . . . . . . . . . . . . . . . . . . . . 12Advanced Fossil Fuel Technologies . . . . . . . . . . . . . . . 13
Managing Risks . . . . . . . . . . . . . . . . . . . . . . . . . . . . . . . . 14Load Forecast Error Risk . . . . . . . . . . . . . . . . . . . . . . 14Environmental Compliance Cost Risk . . . . . . . . . . . . 16Performance Risk . . . . . . . . . . . . . . . . . . . . . . . . . . . . 17Fuel Price Risk . . . . . . . . . . . . . . . . . . . . . . . . . . . . . . 18Resource Acquisition Risk . . . . . . . . . . . . . . . . . . . . . 19
Arizona Clean Energy Strategy . . . . . . . . . . . . . . . . . . . . . 20Components of the Clean Energy Strategy . . . . . . . . . 20Cost of the Clean Energy Strategy . . . . . . . . . . . . . . . 24
State Policies to Encourage Cleaner Resources . . . . . . . . . 25Encourage Technological Innovation . . . . . . . . . . . . . 25Develop Transmission Capacity . . . . . . . . . . . . . . . . . 27Increase the Renewable Energy Standard . . . . . . . . . . 28Increase Energy Efficiency Programs. . . . . . . . . . . . . . 28
Conclusions . . . . . . . . . . . . . . . . . . . . . . . . . . . . . . . . . . . 29
Contents

A Clean Electric Energy Strategy for Arizona
Western resource AdvocAtes4
Conventional fossil fuel power generation exposes utilities and their customers to unpredictable, volatile, and potentially increasing costs and imposes enormous environmental impacts, including greenhouse gas emissions that contribute to global climate change. This report provides a practical strategy to move Arizona away from reliance on conventional generation of electricity with fossil fuels.
Load growth is a driving force. If recent trends continue, the demand for electricity in Arizona will increase about 3.6% per year. At this rate, electricity consumption will double in about 20 years.
The clean energy strategy described in this report can meet the growth in demand for electricity in Arizona reliably, with very limited emissions of greenhouse gases, and at reasonable cost. The strategy applies to the period from 2007 through 2025 and sets up a transition from conventional generation resources to resources that are cleaner and have more stable costs.
Under the clean energy strategy, load growth will be met with energy efficiency savings, renewable energy, advanced coal generation with greatly reduced carbon dioxide emissions, and natural gas–fired generation. No new pulverized coal power plants will be needed.
The resources needed to provide Arizona with clean, reliable, reasonably priced electricity consist of both commercially available technologies and emerging technologies:
Commercially available technologies, such as:•Energy efficiency measures (e.g., efficient lighting, »efficient windows, shade trees, efficient motors, efficient air conditioning, efficient refrigerators)Wind energy »Geothermal energy »Biomass energy (e.g., generation of electricity »from landfill gas or agricultural waste)Solar energy (e.g., photovoltaics) »Natural gas–fired generation »
Emerging technologies, such as:•Integrated gasification combined cycle (IGCC) »generation with carbon dioxide capture and storageConcentrating solar power with thermal storage »
The greenhouse gas impact of the clean energy portfolio is far smaller than the impact of power plants serving Arizona’s electricity demand in 2006. In 2006, Arizona residents and businesses consumed about 73 million megawatt-hours (MWh) of electricity, whose generation emitted about 45 million metric tons of carbon dioxide. In 2025, Arizonans will consume an additional 72 million MWh of electric energy services, but, under the clean energy strategy, the resources needed to provide those new services would emit only 7.2 million metric tons of carbon dioxide.
Executive Summary
5
A Clean Electric Energy Strategy for Arizona
Western resource AdvocAtes
Arizona’s governor has set a goal of reducing greenhouse gas emissions in Arizona to the 2000 level by 2020 and to 50% below the 2000 level by 2040. To help reach this goal, it will be necessary to implement the clean energy strategy for serving load growth, and to reduce emissions from existing power plants such as by replacing old fossil fuel power plants with emerging zero- or low-emission technologies, using carbon offsets, or retrofitting existing power plants with carbon capture and sequestration equipment.
Renewable energy and energy efficiency do not expose Arizona utilities or their customers to the potential for high fossil fuel prices. Based on past experience, fossil fuel prices cannot be reliably projected over the long term and natural gas prices have exhibited long-term increases. In contrast, once a solar, geothermal, or wind project is in place, it does not incur fuel costs and its annualized costs are stable. Additionally, energy efficiency is the lowest cost resource available to Arizona, and efficiency measures are generally not subject to price increases after having been installed. A portfolio of renewable energy resources and energy efficiency measures thus serves as a hedge against increasing fossil fuel prices. Moreover, the lower carbon dioxide emissions under the clean energy strategy reduce utilities’ exposure to the costs of complying with future greenhouse gas emission regulations. A portfolio of clean energy resources costs about the same as a portfolio of pulverized coal power plants and natural gas power plants and may cost less,
depending on the price of fossil fuels and the cost of complying with greenhouse gas emission regulations.
Policies to make greater use of commercially available technologies are part of the clean energy strategy. Arizona regulators and utilities should increase the magnitude of renewable energy and energy efficiency programs from their current levels. To remove disincentives to engaging in large scale efficiency programs, Arizona utilities and regulators should consider decoupling from kilowatt-hour (kWh) sales the revenues needed to cover fixed costs. In addition, the Arizona legislature should consider authorizing a renewable energy transmission authority or similar program to accelerate the development of in-state renewable energy projects and to import renewable energy from other states.
Commercialization of emerging technologies, such as advanced fossil fuel technology with carbon capture and large-scale concentrating solar power with thermal storage, is also essential to advancing a clean energy strategy. Arizona regulators should encourage commercialization by allowing utilities to recover the costs of reasonable investments in emerging technologies. Furthermore, the Arizona legislature should consider authorizing a clean energy research and development authority to fund and help commercialize renewable energy, energy efficiency, and advanced fossil fuel technologies that capture and store greenhouse gases.

A Clean Electric Energy Strategy for Arizona
Western resource AdvocAtes6
Much of Arizona’s electricity is generated at power plants burning coal or natural gas. The existing portfolio is subject to unpredictable, volatile, and potentially increasing costs. It also imposes enormous environmental impacts, including greenhouse gas emissions that contribute to global climate change. This report sets out a strategy for transitioning Arizona from conventional generation resources to resources that are cleaner and have more stable costs.
The clean energy strategy described in this report relies on commercially available technologies and seeks to encourage commercialization of new technologies. These technologies allow for greatly reduced carbon dioxide emissions that contribute to global climate change, are less susceptible to fuel price increases than conventional technologies, and are cost-competitive with conventional technologies.
Resource planning for electric energy services is largely the responsibility of electric utilities. In some states, that responsibility has been transferred, in part, to independent power producers who plan, construct, and operate power plants that sell at wholesale to electricity retailers. And in some states, there is public oversight through integrated resource planning and through regulatory review of proposed power plants and transmission lines.1 Our aim in this report is to encourage decision makers to move away from technologies that pollute and that are vulnerable to unpredictable fuel costs.
To shift paradigms, it is necessary to invent new ways to think about power supply and demand and to implement those innovations. In their book, Innovation — The Missing Dimension, Richard Lester and Michael Piore2 identify two types of innovation processes — analysis and interpretation. Analysis is best
1 At present, Arizona is the only state in the Interior West that does not have a resource planning process.
2 Richard Lester and Michael Piore, Innovation — The Missing Dimension (Cambridge, Mass: Harvard University Press, 2004).
used in cases where alternatives are well understood and are clearly defined. Analytical innovation is a task in rational problem solving with clear objectives and constraints.
In contrast, interpretation is necessary in situations where problems are murky and outcomes are not known but must instead be created. Interpretation is fostered by bringing in new ideas from outside the analytical framework employed for problem solving.
In utility resource planning, new ideas can be created through market processes, through interaction of participating parties in a collaborative effort, and by mitigating or avoiding environmental incompatibilities created by power generation and delivery.3 This report is intended to inject practical new ideas into resource planning and change the way electricity is consumed and supplied.
The report is organized as follows. Goals that pertain to reliability, environmental performance, and cost are presented in the next section. The third section reviews various resource options — energy efficiency, renewable energy, conventional generation, and advanced fossil fuel generation that captures and stores carbon dioxide emissions. Any strategy entails risk, and so risks and risk management are described in the fourth section. Next, we present our proposed clean energy strategy, including a projection of its costs and its implications for carbon dioxide emissions. Part of the clean energy strategy is government policy, and so the sixth section addresses state-level policies to foster the development and implementation of the clean energy strategy. Conclusions are presented in the final section.
3 David Berry, “The Structure of Electric Utility Least Cost Planning,” Journal of Economic Issues, 26 (September 1992): 769–789.
Introduction

7
A Clean Electric Energy Strategy for Arizona
Western resource AdvocAtes
The strategy presented in this report seeks to achieve several goals for the period from 2007 through 2025:
Reliably meeting the demand for electric energy •servicesMinimizing emissions of greenhouse gases •(principally carbon dioxide)Keeping the costs of electric energy services •reasonable, given the uncertainties about future costs
Reliability Goals
Reliability of a power supply system refers to the ability of the system to deliver all the electricity demanded at any hour.4 Reliability is affected by the performance of each supply- and demand-side resource, a utility’s ability to bring new resources into operation, and the adequacy of resources to meet demand, taking into account uncertainties about future demand and uncertainties about resource performance.
Reliability is also affected by transmission and distribution system characteristics. In Arizona, there have been several major delivery system outages in recent years — for example, the Westwing substation fire in 2004 led Arizona Public Service Company to
4 Reliability is a system concept. Utilities reliably serve their customers with a portfolio of generation resources, no one of which is individually perfectly reliable or always available. Common measures of generating system reliability are: Loss of load probability. This concept refers to the probability that system demand will exceed capacity during a given period, expressed as the number of days over a long period during which demand cannot be met. A loss of load probability reliability target might be one day in ten years. This type of target is typically based on utility experience with supply shortages and should not be interpreted as an immutable rule. Energy not served. This is the expected kWh of energy demanded by consumers that cannot be served over a specified time period, such as one year, because of insufficient generating capability. Again, a target value of energy not served is typically based on utility experience with supply shortages.
request that customers reduce power usage during peak hours of the day for several days. As a second example, the multi-state transmission failure of July 1996, resulting from a flashover between a transmission line and a tree, caused many customers throughout the West, including Arizona, to lose power for a brief period.
One way that utilities manage uncertainties about supply and demand is to build in a reserve margin or capacity cushion to deal with unexpected increases in demand or unexpected outages of supply-side resources. To maintain a reliable generation system, we plan for a 15% reserve margin applied to peak demand, including losses, but excluding demand served by distributed generation and energy efficiency.
Environmental Performance Goals
A principal goal of the proposed clean energy strategy is to minimize emissions of greenhouse gases, which contribute to global climate change.5 The clean energy strategy is focused on meeting load growth with low-emission resources. We also provide an assessment of the impact of retiring about 1,190 MW of old coal-fired generating capacity by 2025 and replacing that generation with zero- or low-emission resources.
If worldwide greenhouse gas emissions continue at high levels, Arizona’s climate is likely to become hotter and drier. Expected impacts are highlighted below:
An increase in surface temperature in the Southwest •so that by 2080 temperatures average about five to
5 The clean energy strategy would also reduce other air emissions and reduce water consumption while meeting load growth because it substitutes energy efficiency and renewable energy for the burning of fossil fuels to generate electricity.
Goals

A Clean Electric Energy Strategy for Arizona
Western resource AdvocAtes8
six degrees Celsius warmer than during the period 1961–19906
An increase in annual temperature in the Southwest •so that by 2035 to 2060 temperatures are over four degrees F warmer7
Lower stream flows and greater drought in the •Southwest during the 21st century8
Reduced stream runoff in the western U.S. in the •21st century9
Decreased snowpack, more winter flooding, and •reduced summer stream flows in western North America10
Recent polls indicate that climate change policy is important to the public.11 Two-thirds of Arizona voters indicate that global warming is occurring and that action should take place, and a majority of Arizona voters believe that state and federal governments should do more to address global warming.12
6 Hadley Centre for Climate Prediction and Research, Climate Change and the Greenhouse Effect, Met Office, Exeter, U.K. (December 2005): slide 40 (page 41).
7 Martin Hoerling and Jon Eischeid, “Emerging Issues for Water in the West: 21st Century Drought,” NOAA Earth System Research Laboratory Climate Action Panel, presentation November 20, 2006.
8 Ibid.
9 P. Milly, K. Dunne, and A. Vecchia, “Global Pattern of Trends in Streamflow and Water Availability in a Changing Climate,” Nature, 438 (November 17, 2005): 347–350.
10 Intergovernmental Panel on Climate Change, Climate Change 2007: Impacts, Adaptation and Vulnerability, Working Group II Contribution to the Intergovernmental Panel on Climate Change Fourth Assessment Report, Summary for Policymakers, p. 10.
11 See “Global Warming: The Buck Stops Here,” NewScientist (June 23, 2007): 16–19.
12 Public Opinion Strategies, “Arizona Global Warming and Public Opinion.” Poll taken of 600 registered voters in February 2007. Margin of error is + or – 4%.
Cost Goals
Natural gas prices are volatile and increasing, and utilities that rely on natural gas for power generation have experienced a strong upward pressure on costs in recent years. Future coal prices are uncertain. A goal of the clean energy strategy is to put bounds on utility cost exposure by limiting the use of fossil fuels and substituting other resources with fixed or stable prices. A second cost goal is to seek new resources that, in the aggregate, cost about the same as conventional coal- and gas-fired resources, recognizing the uncertainties of future prices.
Energy efficient building has a lasting impact on energy use. Photo: iStock.
9
A Clean Electric Energy Strategy for Arizona
Western resource AdvocAtes
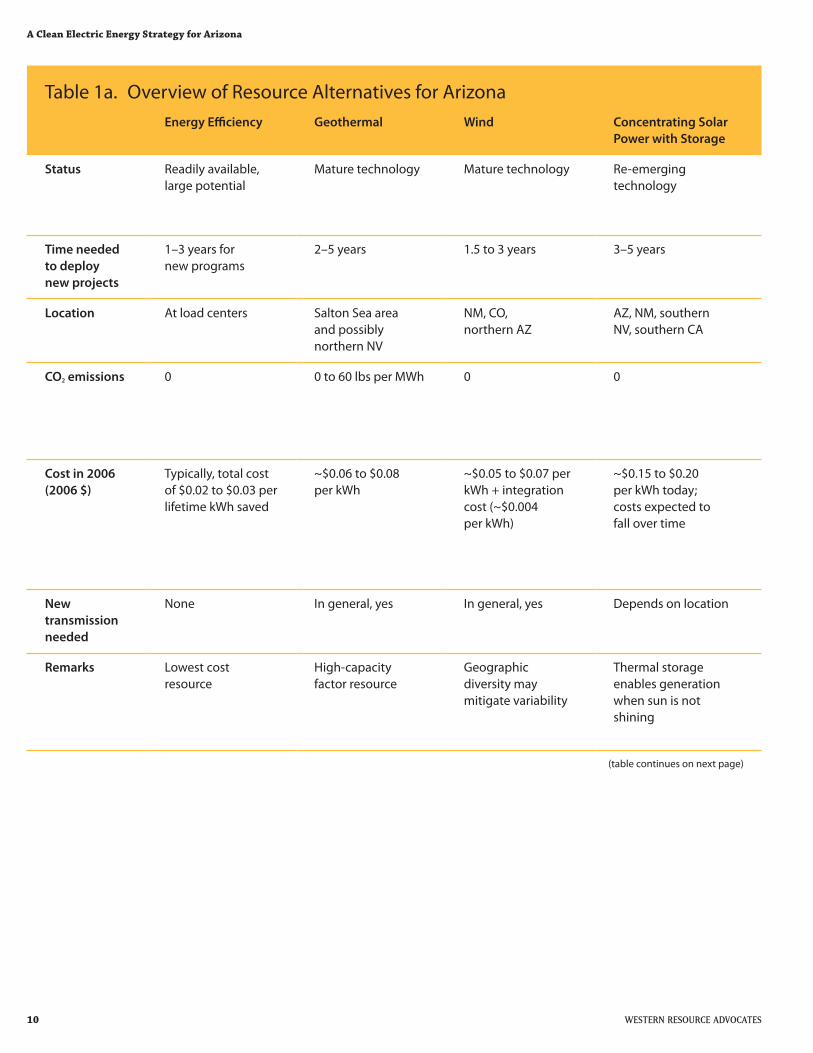
This section describes the resources that could be used to meet Arizona’s growing demand for electric energy services. The first, energy efficiency, is a demand-side resource, while the others are supply-side resources. An overview of resource options is presented in Table 1.
Energy Efficiency
The Western Governors’ Association Energy Efficiency Task Force13 concluded that it is feasible to reduce electricity consumption by 20% in the western states by 2020 relative to “business as usual” forecasts. Leading electric utility energy efficiency programs reduce electricity use by 0.8% to 1.0% each year (i.e., 8% to 10% after 10 years) and spend 2% to 3% of their revenues on energy efficiency programs.
Energy efficiency programs are very cost-effective, saving electricity at an average cost of $0.02 to $0.03 per lifetime kWh saved.14 This is the lowest cost of any resource.
Common types of utility energy efficiency programs include:
Rebates for households that purchase efficient •appliances, air conditioners, lighting devices, or building shell measuresPrograms to reduce the urban heat island effect •through shading, cool roofs, and cool pavementsGrants for low-income home weatherization•Audits and rebates for businesses that upgrade •energy efficiencyTraining and certification of builders, contractors, •and other energy service providersTraining and technical assistance for commercial and •industrial facility managers
13 Western Governors’ Association, Energy Efficiency Task Force Report (Denver, January 2006), v, vii.
14 Ibid.
Design assistance and incentives for builders who •construct efficient new homes or commercial buildings
In addition to utility programs, energy efficiency may be advanced through:
Up-to-date commercial and residential building •energy codes and associated code enforcementTraining of builders and contractors•Appliance efficiency standards•Income or other tax credits or exemptions for •households or businesses that purchase highly efficient products
Another source of energy efficiency is combined heat and power (CHP), in which a fuel, such as natural gas, is used to produce both useful thermal energy and electricity. The thermal energy may be used to heat or boil water, or may be used for industrial processes, for example. Waste heat from the thermal process could be recovered to generate electricity, or waste heat from the generation of electricity could be recovered to heat water or use in some other thermal application. By doing two jobs with one energy source, energy efficiency is greatly increased. The Intermountain CHP Center estimates that there are currently about 18 CHP sites with 174 MW of power generation capacity in Arizona, although not all facilities are operating at the present time.15
Conventional Generation
At present, Arizona’s utilities rely primarily on pulverized coal, nuclear, and gas power plants, with moderate amounts of hydropower. Coal and nuclear plants generally serve baseload demand while gas-fired units tend to serve intermediate and peak loads. Some
15 Intermountain CHP Center Web site, www.intermountainchp.org/casestudies/default.htm.
Resource Options
A Clean Electric Energy Strategy for Arizona
Western resource AdvocAtes10
Table 1a. Overview of Resource Alternatives for ArizonaEnergy Efficiency Geothermal Wind Concentrating Solar
Power with Storage
Status Readily available, large potential
Mature technology Mature technology Re-emerging technology
Time needed to deploy new projects
1–3 years for new programs
2–5 years 1.5 to 3 years 3–5 years
Location At load centers Salton Sea area and possibly northern NV
NM, CO, northern AZ
AZ, NM, southern NV, southern CA
CO2 emissions
0 0 to 60 lbs per MWh 0 0
Cost in 2006 (2006 $)
Typically, total cost of $0.02 to $0.03 per lifetime kWh saved
~$0.06 to $0.08 per kWh
~$0.05 to $0.07 per kWh + integration cost (~$0.004 per kWh)
~$0.15 to $0.20 per kWh today; costs expected to fall over time
New transmission needed
None In general, yes In general, yes Depends on location
Remarks Lowest cost resource
High-capacity factor resource
Geographic diversity may mitigate variability
Thermal storage enables generation when sun is not shining
(table continues on next page)

11
A Clean Electric Energy Strategy for Arizona
Western resource AdvocAtes
Table 1b. Overview of Resource Alternatives for Arizona, cont.Distributed Resources
Advanced Coal Pulverized Coal
Nuclear Gas
Status Mix of mature and emerging technologies
Emerging technology, not commercially available today
Conventional technology
No recent projects
Conventional technology
Time needed to deploy new projects
1–3 years 5–10 years 5–10 years 10 years + 3–8 years
Location
At load centers Southwest Southwest AZ, NM AZ, NM
CO2 emissions 0 or low IGCC: about 875 lbs per MWh for first plant to about 214 lbs per MWh for third plant
About 2,000 lbs per MWh
0 830 to 1,000 lbs per MWh for new units
Cost in 2006 (2006 $)
Varies — often above conventional energy cost
IGCC: roughly $0.10 to $0.11 per kWh, no commercial experience with CO2 capture at power plants
~$0.054 to $0.059 per kWh plus CO2 allowance costs
?? ~$0.075 to $0.23 per kWh (depending on capacity factor) if gas = $7/MMBtu + CO2 allowance costs
New transmission needed
None Yes Yes Yes Depends on location
Remarks Technologies include photovoltaics, biomass
Fuel price risk Fuel price risk; CO2 emission compliance cost risk
Waste storage not set
Fuel price risk; CO2 emission compliance cost risk
A Clean Electric Energy Strategy for Arizona
Western resource AdvocAtes12
intermediate load is also served by coal-fired power plants. To meet load growth, especially in the next few years, Arizona utilities are likely to draw upon additional gas-fired power plants because of the plants’ relatively low capital cost, moderate lead time, and ability to serve intermediate and peak loads. They may also seek to deploy additional pulverized coal plants, as has already been done at Springerville with Unit 3 (completed in 2006) and Unit 4 (scheduled for completion in 2009).
Renewable Energy
The Arizona Corporation Commission adopted a Renewable Energy Standard that requires utilities subject to the jurisdiction of the Commission to obtain 15% of retail energy sales by 2025 from new renewable resources, such as wind, geothermal, biomass, and solar resources.16 Of the renewable energy, 30% must eventually be from distributed resources, located at customers’ premises, such as rooftop photovoltaic facilities or farm biomass projects using agricultural waste. Salt River Project, which is not subject to Commission jurisdiction, has voluntarily adopted a similar numerical goal, but its standard allows existing hydropower projects and energy efficiency programs to be used to meet the goal.
Arizona has access to several renewable energy technologies:
Wind energy• . Wind energy is cost-competitive with gas-fired generation and displaces gas-fired and coal-fired generation when it is available. Because wind energy is intermittent, utilities incur integration costs to deal with the short-term and medium-term variations in power output from wind turbines. Integration costs are roughly about $0.004 per kWh, depending on generation site characteristics and the utility’s mix of conventional resources.17 Eastern
16 Decision No. 69127, dated November 14, 2006. A.A.C. R14-2-1801 et seq.
17 For a review of wind integration costs, see Brian Parsons, Michael Milligan, J. Charles Smith, et al., “Grid Impacts of Wind Power Variability: Recent Assessments from a Variety of Utilities in the United States,” paper presented at the European Wind Energy Conference, Athens, Greece, February 27–March 2, 2006, (Golden, Colo.: National Renewable Energy Laboratory, 2006), NREL/CP-500-39955.
New Mexico18 and southeastern Colorado are good sources of wind energy, but additional transmission capacity would be needed to deliver large quantities to Arizona. Northern Arizona has some good wind resources as well.
Geothermal energy• . Geothermal electric energy is derived from the heat in the earth’s crust and is supplied at a steady rate. Arizona utilities already have several geothermal contracts with developers in the Salton Sea area of California, and additional Salton Sea geothermal generating capacity may also supply Arizona load.19 With the addition of transmission from northern Nevada to southern Nevada, it may be possible to obtain geothermal energy from northern Nevada to serve Arizona load in the future.
Solar energy• . Arizona has abundant and ubiquitous sunshine. For large-scale projects, concentrating solar power (CSP) has great potential. One such technology uses parabolic mirrors to focus sunlight on a transfer fluid, which is then used to vaporize a liquid for spinning a turbine and generating electricity.20 These projects could store heat so that the facility generates electricity when the sun is not shining. Another solar thermal technology is dish Stirling, which focuses sunlight on a heat engine that generates electricity. Photovoltaics convert sunlight to electricity and can be used as distributed generation, such as projects located at a customer’s premises, or as small central station projects. As of 2007, there is one small (1 MW) CSP project
18 As of 2007, Arizona Public Service Company and Salt River Project obtain wind energy from projects located in New Mexico.
19 On geothermal potential, see Elaine Sison-Lebrilla and Valentino Tiangco, “California Geothermal Resources” (Sacramento: California Energy Commission, 2005) p 8, CEC-500-2005-070. This study reports that there are about 1,900 MW of additional geothermal generating capacity that could be developed in the Salton Sea and nearby areas.
20 See L. Stoddard, J. Abiecunas, and R. O’Connell, Economic, Energy, and Environmental Benefits of Concentrating Solar Power in California (Golden, Colo.: National Renewable Energy Laboratory, 2006), NREL/SR-550-39291. See also N. Blair, M. Mehos, W. Short, and D. Heimiller, “Concentrating Solar Deployment System (CSDS) — A New Model for Estimating U.S. Concentrating Solar Power (CSP) Market Potential” (Golden, Colo.: National Renewable Energy Laboratory, 2006), NREL/CP-620-39682. See also B. Scott Canada and Jeff Lee, “Saguaro Solar Power Plant, Red Rock, Arizona,” Power 150 (August 2006): 82–88.

13
A Clean Electric Energy Strategy for Arizona
Western resource AdvocAtes
in Arizona and roughly 15 MW of photovoltaic installations.
Biomass• . Because of the dry climate, the Southwest has limited biomass resources. Landfill gas projects, projects that burn dead wood, and projects that use agricultural waste, wood products waste, or sewage are deployed in the Southwest. Typically, these projects are a few MW each or smaller and are distributed generation projects, located at consumers’ premises.
Advanced Fossil Fuel Technologies
A long-term resource option is generation of electricity with advanced coal or natural gas technology that captures carbon dioxide emissions (and other emissions) and stores the carbon dioxide permanently or offsets other uses of fossil fuels, such as vehicle fuels. Several such technologies are being developed, but at this stage it is not possible to predict with high confidence which technologies will be commercially available. Technologies include:
Pre-combustion capture of carbon dioxide. An •example is integrated gasification combined cycle (IGCC) technology, which is described below.
Post-combustion capture of carbon dioxide.• 21 For example, algae can be grown in the carbon dioxide emissions from power plants; the algae can then be converted to a biofuel as a substitute for petroleum, thereby offsetting the carbon dioxide emissions of the power plant.22
Integrated gasification combined cycle is a technology for producing electricity from coal or other carbon-
21 John Douglas, “The Challenge of Carbon Capture,” EPRI Journal (Spring 2007): 14–21.
22 Greenfuel Technologies Corporation’s “Emissions-to-Biomass” process is an example. More information can be found at www.greenfuelonline.com.
based fuel.23 An IGCC plant gasifies the coal by converting it into synthesis gas consisting of carbon monoxide and hydrogen. The synthesis gas is cleaned of particulate matter, sulfur, and other contaminants, and burned in a combustion turbine power plant. Heat from the combustion turbine exhaust gas is used to produce steam for a steam turbine and generator.
One of the advantages of IGCC technology is that the power plant can be configured to capture carbon dioxide emissions: a shift reactor would convert carbon monoxide and water to hydrogen and carbon dioxide. The carbon dioxide can be captured using an absorption process or other processes using physical or chemical solvents. Because the carbon dioxide in the IGCC technology is at a higher concentration than carbon dioxide in the flue gas of a conventional coal-fired power plant, it can be captured more economically with IGCC than is possible at a conventional power plant.
IGCC plants with carbon capture are expected to cost more per kWh of electricity generated than conventional coal-fired power plants without carbon capture. Because there has been extensive research on IGCC,24 we assume that the advanced coal technology will be IGCC. We recognize that other technologies may become commercially viable, but there is very little publicly available cost or performance information on these technologies to date.
23 This explanation of IGCC is taken from: 1) U.S. Department of Energy, Office of Fossil Energy, “Integrated Gasification Combined Cycle,” 1999; 2) Ola Maurstad, An Overview of Coal based Integrated Gasification Combined Cycle (IGCC) Technology (Cambridge: Massachusetts Institute of Technology, Laboratory for Energy and the Environment, 2005), MIT-LFEE 2005-002 WP; 3) Western Resource Advocates, A Balanced Energy Plan for the Interior West (Boulder, Colo., 2004).
24 For example: 1) National Energy Technology Laboratory, 2006 Cost and Performance Baseline for Fossil Energy Plants, February 5, 2007; 2) Ola Maurstad, op. cit.; 3) Robert Williams, “IGCC: Next Step on the Path to Gasification-Based Energy from Coal” (Princeton, NJ: Princeton Environmental Institute, Princeton University, 2004); 4) Edward Rubin, Anand Rao, and Chao Chen,
“Comparative Assessments of Fossil Fuel Power plants with CO2 Capture and Storage,” in E. Rubin, D. Keith, and C. Gilboy, editors, Proceedings of 7th International Conference on Greenhouse Gas Control Technologies (Elsevier Science, 2005); 5)Western Resource Advocates, Western Coal at the Crossroads (Boulder, Colo., 2006); 6) The Future of Coal (Cambridge: Massachusetts Institute of Technology, 2007); 7) National Energy Technology Laboratory, Fossil Energy Power Plant Desk Reference, 2007, DOE/NETL-2007/1282.

A Clean Electric Energy Strategy for Arizona
Western resource AdvocAtes14
Storage of carbon dioxide captured from power plants may be in deep saline formations, depleted gas fields, depleted oil fields with the potential for enhanced oil recovery, or deep coal seams.25 Siting of advanced coal plants will have to trade off transmission costs, coal transport costs, and carbon dioxide transportation costs to sequestration locations.
25 Jay Braitsch, “DOE/Fossil Energy Carbon Sequestration Program,” Briefing to President’s Council of Advisors on Science and Technology, September 20, 2005.
Managing Risks
Load Forecast Error Risk
The expected growth in demand for electricity forms the basis of plans for new generation, transmission, and distribution infrastructure. Arizona’s population has grown rapidly since World War II, and this population growth, coupled with the extremely high summer temperatures in much of the state, are the primary causes of the growth in demand for electricity. Arizona’s utilities experience a very pronounced peak demand in late afternoons in the summer, reflecting a huge air conditioning load. Figure 1 shows recent historical growth in electricity sales and continuation of that trend in both linear and exponential trajectories. However, future load is somewhat uncertain. Forecast errors may occur because:
Net in-migration to the state may be different in the •future than in the recent past. One possible cause of declining growth is a hotter and drier climate resulting from worldwide emission of greenhouse gases. With much hotter summers and severe water constraints, Arizona may be a less desirable location.
The mix of industrial and commercial consumers •may be different in the future than in the past; for example, the role of copper mining, which is a heavy industrial consumer of power, may be different in the future.
Resource planning must address several important risks. This report addresses:
Load forecast error risk •Environmental compliance cost risk•Performance risk•Fuel price risk•Resource acquisition risk •
Another risk is the possibility that a utility may not recover all the costs of a new resource because the regulator disallows full recovery. This issue is discussed below in the section on state policies to encourage cleaner resources.
Risks may be managed using several techniques, including:
Getting more information•Limiting risk exposure•Using incentives to motivate good performance •Creating new options•Incorporating flexibility•
The following discussion describes these risks and risk management techniques and Table 2 provides an overview.
Power Plant near Page, AZ. Photo: iStock.

15
A Clean Electric Energy Strategy for Arizona
Western resource AdvocAtes
Table 2. Overview of Risks and Risk Management Techniques for Energy Resource OptionsRisk Risk ManageMent techniques
Get more information
Limit risk exposure
Use incentives
Create options Incorporate flexibility
Load forecast error risk
Refine forecasting model Select some resources with short lead times and modular size
Greenhouse gas regulation compliance cost risk
Analyze effect of carbon dioxide allowance prices on resource cost and incorporate potential costs into planning and procurement process
Reduce use of technologies that emit greenhouse gases
Participate in projects to commercialize carbon capture from fossil fuel power plants (e.g., IGCC)
Performance risk
Analyze outage rates, output patterns, or savings levels for commercially available technologies
Analyze effects of resource performance on system reliability
Gradually introduce new technologies and monitor performance
Select diverse set of resources with different performance patterns (e.g., a geographically dispersed mix of wind resources)
Spread risk over several parties by sharing project output and costs
Pay for performance (e.g., for kWh delivered, kWh saved)
Participate in projects to commercialize new technologies (e.g., CSP)
Establish state R&D authority to investigate and help commercialize new technologies
Fuel price risk Recognize that long-term price forecasts are not reliable
Reduce reliance on fossil fuel resources
Acquire resources, such as energy efficiency and renewable energy, with fixed or stable prices as a hedge against high fossil fuel prices
For short term, use financial hedges
Acquire resources with fuel diversity
Resource acquisition risk
Conduct due diligence reviews regarding creditworthiness, permitting, etc.
Research transmission access
Obtain performance and cost information on similar projects
Obtain assurances of equipment availability
Seek performance guarantees
Establish and enforce pre-operation milestones
Provide incentives for superior performance and penalties for poor performance
Acquire some resources with short lead times

A Clean Electric Energy Strategy for Arizona
Western resource AdvocAtes16
Electricity consumption per person or per dollar of •Arizona gross domestic product may drift higher or lower in the future, reflecting changes in energy intensity as might be caused by larger houses, greater use of electronic equipment, and greater energy efficiency, for example.
The effects of changing electricity prices on •electricity demand may not be accurately incorporated into the forecast.26
Errors in long-term load forecasts can lead to excess generating capacity or inadequate generating capacity. In the former case, regulators may disallow full recovery of costs and, in the latter case, the utility may not be able to serve all customers all the time or may be forced to acquire energy at high prices in the spot market.
One way to deal with uncertainties about future loads is to integrate flexibility into resource selection to better match supply and demand under changing medium term demand forecasts. Some resources should be relatively small and require short lead times for siting and construction. Conventional or advanced coal-fired power plants and nuclear power
26 Historically, failure to understand the effect of higher electricity prices on demand contributed to erroneous demand forecasts. See Charles Nelson, Stephen Peck, and Robert Uhler, “The NERC Fan in Retrospect and Lessons for the Future,” The Energy Journal 10 (1989): 91–106.
plants generally do not provide such flexibility, as they furnish hundreds of megawatts of generating capacity each and require very long lead times between initial plans and the date of commercial operation. Technologies with the shortest lead times are likely to be wind energy, distributed generation such as photovoltaics or biomass facilities, and energy efficiency. The remaining technologies fall in the middle — gas generation, concentrating solar power after installation of this technology has become more routine, and new geothermal facilities. Flexibility can also be achieved by selecting some resources that can be installed in a large range of sizes (capacities). Distributed resources, energy efficiency, and geothermal projects can be aggregated into a wide range of capacities, from a few megawatts to several dozen megawatts, that can be brought into operation in a limited time period.
Environmental Compliance Cost Risk
A large risk faced by owners of fossil fuel power plants is the cost of complying with environmental regulations. These costs may increase over the life of a power plant as environmental regulations evolve. There is no comprehensive, up-to-date estimate of current or projected expenditures on environmental investments in the electric power sector.27 However, the Edison Electric Institute (EEI) surveyed 10-K reports and estimated that electric utilities spent at least $3.2 billion in 2005 on environmentally related capital investments.28 The EEI survey also projected more than $40 billion in planned capital investments and other environmental expenditures by electric utilities over the next 10 to 12 years. Additional expenditures may also be needed to comply with future air quality regulations.
One of the largest environmental risks is the cost of complying with greenhouse gas emission regulations. Fischer and Morgenstern29 reviewed 11 models of the costs of complying with various carbon emission
27 The most recent edition of the U.S. Census Bureau’s Pollution Abatement Costs and Expenditures report pertains to 1999.
28 The Brattle Group, Why Are Electricity Prices Increasing? (Washington, DC, 2006), prepared for the Edison Foundation.
29 Carolyn Fischer and Richard Morgenstern, “Carbon Abatement Costs: Why the Wide Range of Estimates?” The Energy Journal 27 (2006): 73–86.
Figure 1. Arizona Load Growth
160,000
140,000
120,000
100,000
80,000
60,000
40,000
20,000
01990 1995 2000 2005 2010 2015 2020 ’25
GW
h Sa
les
in A
rizon
a
Historical GWh Sales
Exponential Trend
Linear Trend

17
A Clean Electric Energy Strategy for Arizona
Western resource AdvocAtes
reduction policies. For the United States, a 20% reduction in carbon emissions relative to reference cases has a projected marginal abatement cost of between about $40 per metric ton of carbon and $250 per metric ton of carbon in 1990 dollars (about $15 to $97 per metric ton of carbon dioxide in 2006 dollars).
Figure 2 shows the cost impact of compliance for a 500-MW coal-fired power plant for a range of carbon dioxide emission allowance prices, from $0 per metric ton to $50 per metric ton of carbon dioxide. If, for example, allowance costs are $20 per metric ton of carbon dioxide equivalent, power generation costs would increase by about $70 million per year, or about $19 per MWh.30 This is a significant cost impact.
The risk of incurring high costs to comply with greenhouse gas emission reduction regulations can be managed in several ways as indicated in Table 2. One of the most important risk management strategies is to substitute zero- or low-emission renewable energy and energy efficiency resources for fossil fuel generation.
Renewable resources may also face environmental risks. For example, a wind generation project may injure
30 Other assumptions used for preparing the graph are a capacity factor of 85% and 2,059 pounds of carbon dioxide emissions per MWh generated.
birds or bats31 or a biomass project may not receive an air quality permit.32 Thus, specific projects might not receive permits if they are not carefully located or properly designed.
Performance Risk
Performance risk refers to the likelihood that a resource will not deliver the energy or capacity or savings expected of it. For technologies that have long track records in utility operation, utilities can account for performance risk in probabilistic models of system reliability. For example, in 2004, the equivalent forced outage rates for U.S. coal plants was 6.12%, for U.S. gas plants (excluding gas turbines) it was 9.69%, and for U.S. nuclear plants it was 3.87%.33 This kind of information is used in production cost models to calculate loss of load probability or kWh of load not served.
Performance risk management is more complex where technologies are new. We consider two cases. The first case involves technologies that are commercially available but a utility has no experience with those technologies. For example, utilities may have little information on how much energy efficiency programs will actually save. However, there is considerable experience with efficiency programs throughout the country, and that experience can be used to determine, initially, what levels of performance to expect.
As a second example, intermittent renewable energy resources, such as wind energy, present utilities with uncertainty about kW and kWh deliveries. Utilities undertake studies to describe energy and capacity attributable to wind power projects and to investigate the effects of intermittency on their system costs and performance. In addition, they can gradually
31 Wind Power: Impacts on Wildlife and Government Responsibilities for Regulating Development and Protecting Wildlife (Washington, DC: U.S. Government Accountability Office, 2005), GAO-05-906.
32 For example, in March 2007, the New Mexico Environment Department denied an air quality permit for a proposed 35-MW biomass plant near Estancia. Additional information was required by the department before it could consider issuing a permit.
33 North American Electric Reliability Council, “Generating Unit Statistical Brochure, 2004 Only” (Princeton, NJ, September 2005). The equivalent forced outage rate is forced outage hours divided by the sum of forced outage hours plus service hours, all adjusted for forced deratings.
Figure 2. Cost of CO2 Emission Allowances for a 500 MW Coal-Fired Plant
$200
$180
$160
$140
$120
$100
$80
$60
$40
$20
$0$0 $5 $10 $15 $20 $25 $30 $35 $40 $45 $50
$50
$45
$40
$35
$30
$25
$20
$15
$10
$5
$0
Annual Cost (Million $): Left Axis
Cost per MWh: Right Axis
Mill
ion
$ pe
r Yea
r
$ / M
Wh
CO2 Allowance Price $/Metric Ton

A Clean Electric Energy Strategy for Arizona
Western resource AdvocAtes18
introduce intermittent resources to learn how those resources work in their systems.
Thus, performance risk with commercially available technologies can be evaluated by studying the experiences of other utilities and by adopting the technologies gradually to gain experience. Performance risk in this case can be further managed by creating incentives for suppliers to do their best, namely by paying for good performance and penalizing suppliers for inferior performance. A common example is paying for renewable energy on the basis of kWh delivered (as opposed to kW of generating capacity constructed).
The second case involves technologies that are not commercially available or that have not been widely used in the U.S. Concentrating solar power with storage and IGCC power plants are examples. At present, there are only three operating CSP plants in the West. Thus, utilities face performance risk based on relatively little experience with the technology. (The largest CSP project was built in California in the 1980s and early 1990s). Consortia of Southwestern utilities are actively engaged in planning CSP projects, so they may gain practical experience in the next few years.
Performance risk associated with new technologies is often managed by spreading the risk over several partners, thereby limiting any one party’s risk exposure. For example, initial IGCC and CSP projects are likely to involve several utilities and perhaps other
parties, each with a share of the output or costs. In the section on state policies to encourage cleaner resources, we discuss additional aspects of performance risk management for new technologies.
Fuel Price Risk
A basic choice for utilities involves selecting resources with fixed or stable costs that can be reliably projected versus resources having a large portion of costs that are uncertain and difficult to forecast accurately. Resources whose costs are primarily capital costs will tend to have stable annualized costs because most of the costs are incurred at the time of construction or installation. Renewable resources and energy efficiency measures usually fall into this category. Moreover, many utility contracts for renewable energy supplied by a developer have a schedule of costs that are fixed or stable over time.
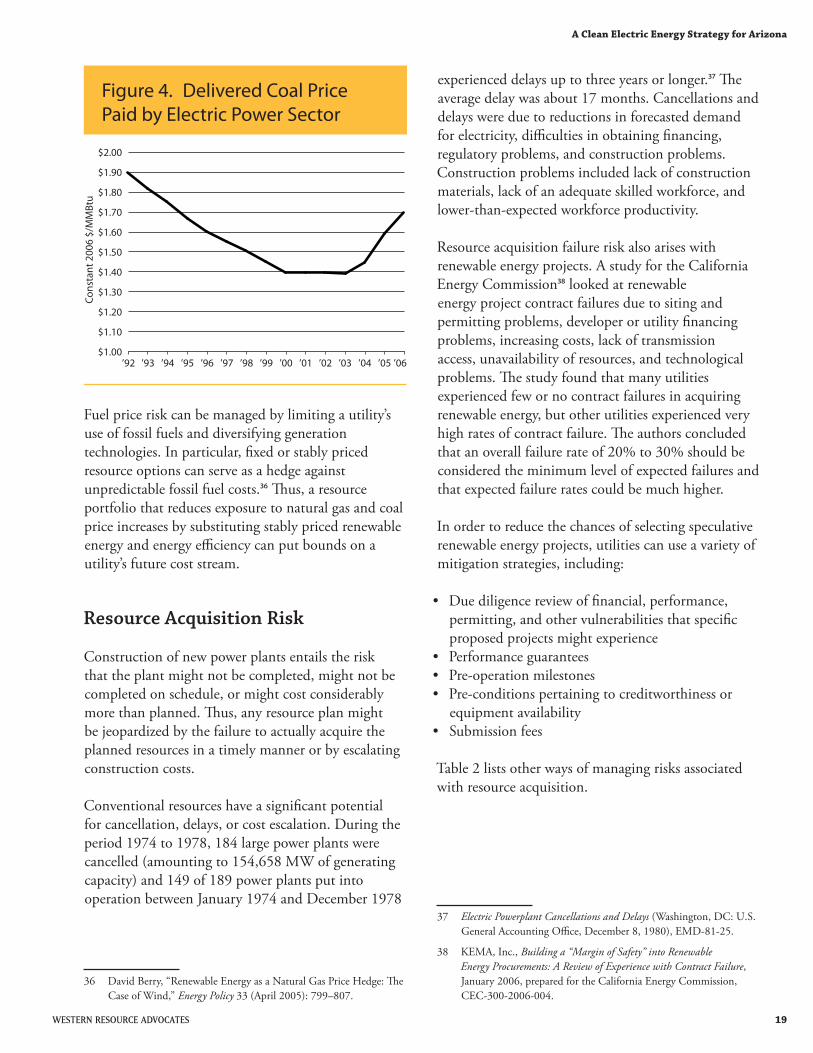
In contrast, much of the cost of fossil fuel power plants is attributable to fuel. Natural gas prices have exhibited enormous volatility and a general upward trend (see Figure 3); coal prices have gone up and down and are currently on an upward trajectory of unknown duration (see Figure 4).34
Inherent in the risk associated with fuel price changes is the inability to reliably project future fossil fuel prices. The Energy Information Administration conducted a review of its forecasts35 and found that, for long-term forecasts made from 1982 through 2006, the average absolute percent error (comparing forecasted prices and actual prices) for coal prices paid by electric generating plants was about 47% and that for natural gas wellhead prices was about 64% — both enormous forecasting errors. This inability to forecast prices indicates that future fuel prices are highly uncertain. Commitments to new fossil fuel power plants automatically bring along a high degree of cost risk over the life of the plant (50 years or more).
34 Natural gas price data are from the Energy Information Administration, Annual Energy Review 2005, and Short Term Energy Outlook, various issues. Coal prices are from the Short Term Energy Outlook, various issues. Costs are expressed in constant dollars using the Gross Domestic Product Implicit Price Deflator.
35 Energy Information Administration, Annual Energy Outlook Retrospective Review: Evaluation of Projections in Past Editions (1982–2006), DOE/EIA-0640(2006), 2007, Table 2.
Figure 3. Price Paid for Natural Gas by Electric Power Sector
$9
$8
$7
$6
$5
$4
$3
$2
$1
$0
Cons
tant
200
6 $/
MM
Btu
Actual
Trend
1971 1976 1981 1986 1991 1996 2001 ’06
19
A Clean Electric Energy Strategy for Arizona
Western resource AdvocAtes
Fuel price risk can be managed by limiting a utility’s use of fossil fuels and diversifying generation technologies. In particular, fixed or stably priced resource options can serve as a hedge against unpredictable fossil fuel costs.36 Thus, a resource portfolio that reduces exposure to natural gas and coal price increases by substituting stably priced renewable energy and energy efficiency can put bounds on a utility’s future cost stream.
Resource Acquisition Risk
Construction of new power plants entails the risk that the plant might not be completed, might not be completed on schedule, or might cost considerably more than planned. Thus, any resource plan might be jeopardized by the failure to actually acquire the planned resources in a timely manner or by escalating construction costs.
Conventional resources have a significant potential for cancellation, delays, or cost escalation. During the period 1974 to 1978, 184 large power plants were cancelled (amounting to 154,658 MW of generating capacity) and 149 of 189 power plants put into operation between January 1974 and December 1978
36 David Berry, “Renewable Energy as a Natural Gas Price Hedge: The Case of Wind,” Energy Policy 33 (April 2005): 799–807.
experienced delays up to three years or longer.37 The average delay was about 17 months. Cancellations and delays were due to reductions in forecasted demand for electricity, difficulties in obtaining financing, regulatory problems, and construction problems. Construction problems included lack of construction materials, lack of an adequate skilled workforce, and lower-than-expected workforce productivity.
Resource acquisition failure risk also arises with renewable energy projects. A study for the California Energy Commission38 looked at renewable energy project contract failures due to siting and permitting problems, developer or utility financing problems, increasing costs, lack of transmission access, unavailability of resources, and technological problems. The study found that many utilities experienced few or no contract failures in acquiring renewable energy, but other utilities experienced very high rates of contract failure. The authors concluded that an overall failure rate of 20% to 30% should be considered the minimum level of expected failures and that expected failure rates could be much higher.
In order to reduce the chances of selecting speculative renewable energy projects, utilities can use a variety of mitigation strategies, including:
Due diligence review of financial, performance, •permitting, and other vulnerabilities that specific proposed projects might experiencePerformance guarantees•Pre-operation milestones•Pre-conditions pertaining to creditworthiness or •equipment availability Submission fees•
Table 2 lists other ways of managing risks associated with resource acquisition.
37 Electric Powerplant Cancellations and Delays (Washington, DC: U.S. General Accounting Office, December 8, 1980), EMD-81-25.
38 KEMA, Inc., Building a “Margin of Safety” into Renewable Energy Procurements: A Review of Experience with Contract Failure, January 2006, prepared for the California Energy Commission, CEC-300-2006-004.
Figure 4. Delivered Coal Price Paid by Electric Power Sector
’92 ’93 ’94 ’95 ’96 ’97 ’98 ’99 ’00 ’01 ’02 ’03 ’04 ’05 ’06
Cons
tant
200
6 $/
MM
Btu
$2.00
$1.90
$1.80
$1.70
$1.60
$1.50
$1.40
$1.30
$1.20
$1.10
$1.00

A Clean Electric Energy Strategy for Arizona
Western resource AdvocAtes20
Figure 6. Clean Energy Strategy to Serve Load Growth: Cumulative Capacity Additions
25,000
20,000
15,000
10,000
5,000
0’06 2010 2015 2020 ’25
MW
(cap
acity
cre
dit)
gas including reserves
advanced coal
renewable resources
energy e�ciency savings
Growth in the demand for electric energy services •in the state is met with, roughly, one-third energy efficiency savings, one-third renewable energy, and one-third advanced coal generation and conventional gas generation. Figure 5 shows how load growth (including transmission and distribution losses) is met.39 No load growth is served with new pulverized coal power plants or new nuclear power plants.
Slightly over half the new capacity additions are •from renewable energy and energy efficiency and slightly less than half are from gas-fired generation and advanced coal generation. Figure 6 shows the capacity credit of resource additions through
39 By 2025, energy efficiency savings are about 19% of projected total kWh sales (not load growth) that would have otherwise occurred in the absence of any additional efficiency programs or distributed generation programs.
Arizona Clean Energy Strategy
This section presents the clean energy strategy for Arizona. The strategy meets rapid load growth with a portfolio of clean energy resources that produces very low carbon dioxide emissions, costs about the same as a portfolio of conventional resources, and includes a 15% reserve margin for reliability.
It is assumed that over the period 2006 to 2025, the demand for electricity in Arizona will continue growing at historical rates (the exponential trend shown in Figure 1). Thus, load could double in about 20 years.
Components of the Clean Energy Strategy
Under the clean energy strategy, load growth in Arizona is served by a portfolio of energy efficiency savings, renewable energy, advanced coal generation, and conventional gas-fired combustion turbines and combined cycle power plants. This portfolio is described in more detail below.
Figure 5. Clean Energy Strategy to Serve Arizona Load Growth
80,000
70,000
60,000
50,000
40,000
30,000
20,000
10,000
0’06 2010 2015 2020 ’25
GW
h (in
clud
es e
�ect
of l
osse
s)
gas generation
advanced coal generation
renewable energy
energy e�ciency savings

21
A Clean Electric Energy Strategy for Arizona
Western resource AdvocAtes
2025.40 The large amount of gas generation capacity is needed to provide the reserve margin for load growth and to provide the capability to quickly ramp generation up and down to meet peak and intermediate loads. However, the capacity factor of the gas facilities is moderate after the first few years — usually between 20% and 30%, excluding capacity assigned to reserves.
Energy efficiency and wind generation make up •most of the capacity of non-fossil fuel resources. Figure 7 shows the mix of megawatts of generating capacity or savings for energy efficiency and renewable energy to help meet load growth. In this figure, the amount of wind generation capacity and distributed resource capacity is generator nameplate capacity, not the (lower) capacity credit. CSP with storage makes a moderate contribution for serving load growth through 2025. If this technology performs well and if costs fall, it could play a much more important role.
40 To make the various resources comparable, Figure 6 shows the capacity credit attributable to wind and distributed resources, not the generator nameplate capacity of these resources. The capacity value of wind and some distributed resources (such as photovoltaics) is less than the nameplate capacity because of the intermittency of wind and solar generation. It is assumed that the capacity value of CSP with storage is the generator nameplate capacity of CSP because of the dispatchability of stored energy.
It is possible to meet load growth with very little •increase in carbon dioxide emissions. Figure 8 shows the large amount of carbon dioxide emissions from existing resources to serve Arizona’s load as of 2006,41 and the small increase in carbon dioxide emissions attributable to power generation to serve load growth.
To reduce total carbon dioxide emissions from •power generation below historical levels, it will also be necessary to retire existing coal-fired power plants, offset their emissions, or retrofit them with carbon capture and storage equipment. Arizona’s governor has set a goal of reducing greenhouse gas emissions to the 2000 level by 2020 and to 50% below the 2000 level by 2040 (Executive Order 2006-13). The plan presented in this report for meeting load
41 The amount of carbon dioxide emissions from serving Arizona’s 2006 load (i.e., from existing resources) is approximate because the precise mix of existing resources serving 2006 load is not known — there is considerable import and export of electricity. The emissions from existing resources were calculated by applying Arizona Public Service Company’s 2006 emissions rate (for APS ownership) of 1,287 pounds of CO2 per MWh to total generation to serve all of Arizona’s load in 2006. APS reports its emissions in Pinnacle West Capital Corporation’s 2006 Corporate Responsibility Report. The report done by the Center for Climate Strategies, Arizona Greenhouse Gas Inventory and Reference Case Projections 1990–2020, prepared for the Arizona Department of Environmental Quality, March 2006, estimated carbon dioxide emissions attributable to Arizona power consumption at about 40 to 41 million metric tons for 2006 (p. 21).
Figure 7. Mix of Non-Fossil Fueled Resources: Clean Energy Strategy
16,000
14,000
12,000
10,000
8,000
6,000
4,000
2,000
02010 2015 2020 2025
MW
Distributed Resources (nameplate capacity)
CSP
Wind ( nameplate capacity)
Geothermal
E�ciency Savings
Figure 8. CO2 Emissions from Power Generation to Serve Arizona Load
60
50
40
30
20
10
0’06 2010 2015 2020 ’25
Mill
ion
Met
ric To
ns C
O2
Emissions from clean energy strategy to serve load growth
Emissions from resources used in 2006
A Clean Electric Energy Strategy for Arizona
Western resource AdvocAtes22
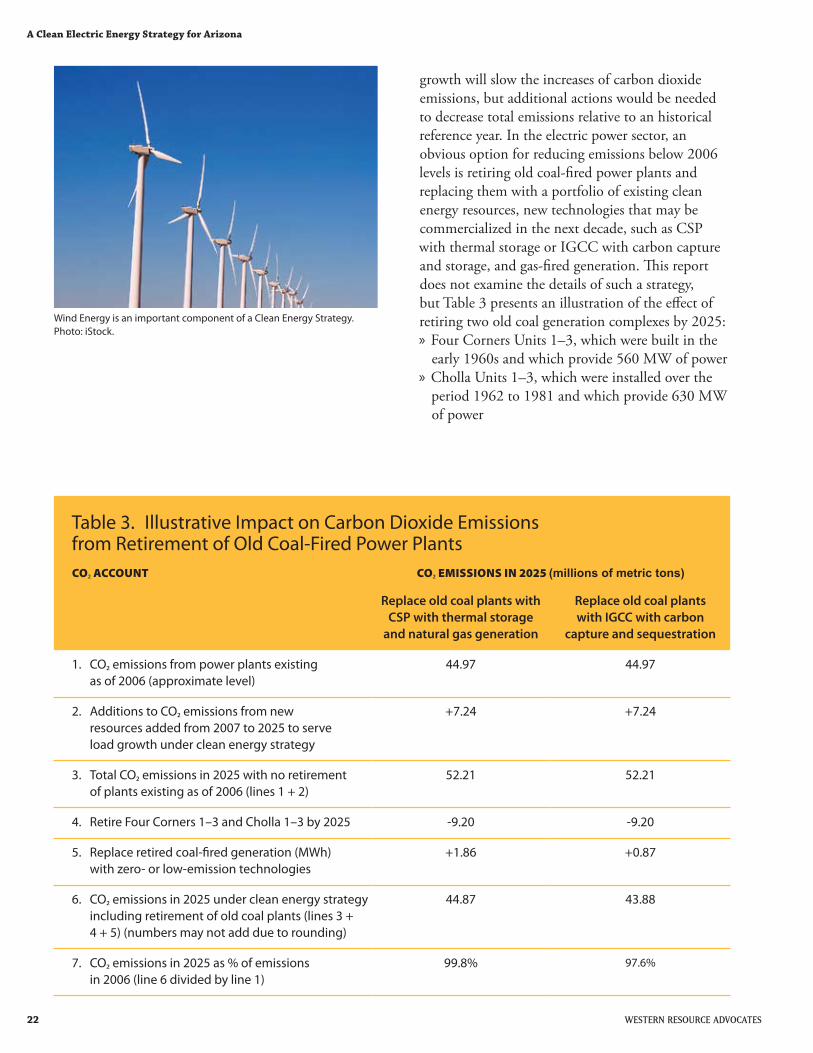
growth will slow the increases of carbon dioxide emissions, but additional actions would be needed to decrease total emissions relative to an historical reference year. In the electric power sector, an obvious option for reducing emissions below 2006 levels is retiring old coal-fired power plants and replacing them with a portfolio of existing clean energy resources, new technologies that may be commercialized in the next decade, such as CSP with thermal storage or IGCC with carbon capture and storage, and gas-fired generation. This report does not examine the details of such a strategy, but Table 3 presents an illustration of the effect of retiring two old coal generation complexes by 2025:
Four Corners Units 1–3, which were built in the »early 1960s and which provide 560 MW of power Cholla Units 1–3, which were installed over the »period 1962 to 1981 and which provide 630 MW of power
Table 3. Illustrative Impact on Carbon Dioxide Emissions from Retirement of Old Coal-Fired Power PlantscO2 accOunt cO2 eMissiOns in 2025 (millions of metric tons)
Replace old coal plants with CSP with thermal storage
and natural gas generation
Replace old coal plants with IGCC with carbon
capture and sequestration
CO1. 2 emissions from power plants existing as of 2006 (approximate level)
44.97 44.97
Additions to CO2. 2 emissions from new resources added from 2007 to 2025 to serve load growth under clean energy strategy
+7.24 +7.24
Total CO3. 2 emissions in 2025 with no retirement of plants existing as of 2006 (lines 1 + 2)
52.21 52.21
Retire Four Corners 1–3 and Cholla 1–3 by 20254. -9.20 -9.20
Replace retired coal-fired generation (MWh) 5. with zero- or low-emission technologies
+1.86 +0.87
CO6. 2 emissions in 2025 under clean energy strategy including retirement of old coal plants (lines 3 + 4 + 5) (numbers may not add due to rounding)
44.87 43.88
CO7. 2 emissions in 2025 as % of emissions in 2006 (line 6 divided by line 1)
99.8% 97.6%
Wind Energy is an important component of a Clean Energy Strategy. Photo: iStock.

23
A Clean Electric Energy Strategy for Arizona
Western resource AdvocAtes
The effect of replacing these old baseload units with zero- or low-emission technologies, coupled with the plan to serve load growth, is to reduce the total carbon dioxide emissions from power production serving Arizona consumers below the level that existed in 2006. To reach the governor’s goals, other old fossil fuel power plants would also have to be retired and replaced with low-emission technologies or retrofitted with carbon capture and storage equipment and processes.
Lastly, to put the clean energy strategy in perspective, a “business as usual” (BAU) projection was also prepared. This BAU projection assumes, perhaps optimistically, that the Renewable Energy Standard will be met by all utilities in Arizona, including those not subject to the Corporation Commission’s standard;42 it assumes significantly less energy efficiency than the clean energy strategy; and it assumes that baseload generation will be provided by pulverized coal plants instead of advanced coal plants and renewable energy.
This BAU projection is not an aggregation of utility plans because Arizona utilities have not made public their long-range plans. Thus, the BAU projection is simply intended to be a realistic point of reference. Figure 9 shows the resource mix under the business as usual scenario (including the effect of losses), and Figure 10 compares the carbon dioxide emissions for serving load growth under the BAU scenario and the clean energy strategy. With the much greater reliance on pulverized coal generation with business as usual, carbon dioxide emissions are far larger under the BAU projection.
42 We assumed that the amount of distributed resources would be less than required by the standard and that non-distributed resources would be more than required by the standard. Under the business as usual scenario, renewable energy accounts for only 11% of total retail sales in Arizona in 2025, but excess renewable energy production in previous years is “carried forward” to make up for the deficiency.
Figure 9. Business as Usual Resource Mix to Serve Arizona Load Growth
80,000
70,000
60,000
50,000
40,000
30,000
20,000
10,000
0’06 2010 2015 2020 ’25
GW
h (in
clud
es e
�ect
of l
osse
s)
gas
pulverized coal
renewable energy
energy e�ciency savings
Figure 10. CO2 Emissions Due to Load Growth After 2006
45
40
35
30
25
20
15
10
5
0’06 2010 2015 2020 ’25
Mill
ion
Met
ric To
ns C
O2
business as usual
clean energy strategy
A Clean Electric Energy Strategy for Arizona
Western resource AdvocAtes24
Cost of the Clean Energy Strategy
In this section, we forecast the costs of the clean energy strategy to serve Arizona’s load growth relative to business as usual. As noted above, future costs are highly uncertain, especially fossil fuel costs, costs of carbon dioxide emission allowances, and even construction costs. Thus, any cost projections should be considered only very rough approximations. The costs included in the computations are annualized fixed costs and variable costs of generation, including fuel costs and carbon dioxide emission allowance costs, and costs of energy efficiency programs.43 The 15% reserve margin is assumed to be provided by generic gas units. Costs do not include transmission and distribution costs. Transmission costs will be specific to the sites of resources actually selected.
43 Cost assumptions are as follows. Costs are in constant 2006 dollars. Energy efficiency program cost plus customer cost is $25 per lifetime MWh saved with 0% real cost escalation. Geothermal energy cost is $71.40 per MWh with 0% real cost escalation. Wind energy cost is $59.81 per MWh with 0% real escalation rate; wind energy costs include integration costs. CSP cost starts at $175 per MWh for the first installation and gradually falls to $140 per MWh for the third generation installation. Distributed resource cost is $250 per MWh with 0% real cost escalation. Pulverized coal has an annualized fixed cost of $311.60 per kW, a variable operating and maintenance (O&M) cost of $2.40 per MWh, a fuel cost of $1.315 per MMBtu escalating at a real rate of 0%, and a heat rate of 9,465 Btu/kWh. Gas generation has an annualized fixed cost of $75.24 per kW, a variable O&M cost of $2.00 per MWh, a fuel cost of $7.00 per MMBtu in 2006, escalating at a real rate of 1% per year, and a heat rate of 7,906 Btu/kWh. IGCC has annualized fixed costs that start at $530 per kW for the first installation, gradually declining to $482 per kW for the third installation, a variable O&M cost of $1.10 per MWh (adjusted upward to account for the cost of transporting and storing carbon dioxide and adjusted downward to account for revenues from storing carbon dioxide for enhanced oil recovery), a fuel cost that is the same as that for pulverized coal, and a heat rate for the first installation that is 10,645 Btu/kWh, decreasing gradually to 10,113 for the third installation. CO2 emission rates in pounds per MWh are 875 for gas generation; 875 for the first IGCC plant, gradually falling to 214 for the third IGCC plant; 30 for geothermal generation; and 2,059 for pulverized coal. CO2 allowance costs are assumed to be $15 per metric ton with 0% real escalation, and they are assumed to be applicable in 2012 and later years only.
Figure 11 compares the cost streams for the clean energy strategy and the business as usual scenario. We conclude that the clean energy strategy has costs comparable to those of serving load growth under business as usual, given the large uncertainty about future fossil fuel prices, carbon dioxide regulation compliance costs, and construction costs of new projects. Moreover, the clean energy strategy makes greater use of resources with fixed or stable costs and results in low carbon dioxide emissions. It is therefore less exposed to high fossil fuel costs and high carbon dioxide emission regulation compliance costs than business as usual.
$7
$6
$5
$4
$3
$2
$1
$0’06 2010 2015 2020 ’25
Billi
ons
of 2
006
$
business as usual
clean energy strategy
Figure 11. Annualized Generation & Energy E�ciency Costs to Serve Load Growth
25
A Clean Electric Energy Strategy for Arizona
Western resource AdvocAtes
State Policies to Encourage Cleaner Resources
possibly by spreading the risk over several partners, no one of which would bear a large fraction of the cost or performance risk.46
At the state level, a major public policy issue is cost recovery for utilities that engage in demonstration or pilot projects with new technologies. New technologies are unlikely to be the cheapest resource available at the time, and traditional utility regulation could disallow recovery of costs in excess of “market costs,” thereby making participation in demonstration projects highly risky for utilities. Further, if a new technology performs poorly, full cost recovery could be jeopardized. Regulators must balance the need to encourage new technologies with their more traditional regulatory role of protecting ratepayers from managerial misjudgments. One way this balance might be accomplished is by having the regulator 1) approve utility plans to deploy new technologies prior to the utility acquiring the technology, and 2) review project progress and operation on an ongoing basis.
The Arizona Corporation Commission has begun moving toward a policy of encouraging environmental improvements. In a 2007 order pertaining to an Arizona Public Service Company (APS) rate case, the Commission stated that “… APS should be proactive rather than reactive on issues of environmental improvement.”47 In that order, the Commission authorized APS to establish an account funded by a surcharge (the Environmental Improvement Surcharge) for funding mandatory or voluntary environmental improvements, such as pollution reduction equipment on power plants.
The Arizona Corporation Commission also has the opportunity to encourage investments in new
46 The project could be a trough system, concentrating photovoltaic system, or a tower system. See Arizona Public Service Company,
“Southwestern Utility Consortium CSP Initiative,” October 6, 2006, presentation to the Arizona Corporation Commission.
47 Decision No. 69663, p. 86, lines 1–2.
Arizona has already adopted some significant policies and programs to promote clean energy (see Table 4). The Renewable Energy Standard and the climate initiatives are especially important policies, and Arizona Public Service Company’s incipient energy efficiency program may prove to be crucial for clean energy as well. This section identifies additional policies to accelerate the clean energy strategy in Arizona.44
Encourage Technological Innovation
In the plan presented in this report, we assume that some of the resources serving load growth and some of the replacements for old fossil fuel power plants are large-scale concentrating solar power projects and fossil fuel power plants that capture and store carbon dioxide, such as IGCC technology. These technologies are not yet commercially available. Early adopters of any of these technologies face the risk of high costs, poor performance, and the inability to fully recover costs.45 Of course, if there are no early adopters, failure is assured.
Several utilities are exploring consortia to develop CSP. One effort, led by Arizona Public Service Company, is seeking to manage the cost and performance risks of a large CSP project (roughly 250 MW or larger),
44 In addition to state-level policies, one important national policy would be to give federal production tax credits and investment tax credits a longer period during which projects would be eligible. It may take several years to plan, site, and construct a renewable energy project. By that time, eligibility for the tax incentive may have expired. Utilities and project developers now have to live with a boom and bust cycle driven by short-term Congressional re-authorization of tax credits. Utilities have also expressed a desire to have investment tax credits for solar power projects available to utilities.
45 See, for example, Global-Change Associates, An Analysis of the Institutional Challenges to Commercialization and Deployment of IGCC Technology in the U.S. Electric Industry, 2004, prepared for the U.S. Department of Energy National Energy Technology Laboratory and the National Association of Regulatory Utility Commissioners.

A Clean Electric Energy Strategy for Arizona
Western resource AdvocAtes26
Table 4. Summary of Major Arizona Clean Energy Policies for the Electric Power SectorPOlicy OR PROgRaM MajOR FeatuRes
Renewable Energy Standard
Adopted by the Corporation Commission, effective in 2007 (Decision No. 69127): A.A.C. R-14-2-1801 et seq.
By 2025, at least 15% of retail electric sales must be derived from eligible renewable •energy technologies; at least 30% of the 15% must come from distributed resources
Does not apply to Salt River Project, but SRP has a similar voluntary standard •
Financial incentives Income tax credit, property tax reduction, or sales tax exemption for renewable energy technologies and applications
Rebate or buy-down for efficiency measures and distributed resources covered by utility programs (see also “Utility energy efficiency programs” row below)
Green pricing Offers utility consumers the option to obtain a portion of their electricity from renewable energy resources
In 2007 APS started a new green pricing program•
Facilitation of distributed resources
Corporation Commission has prepared an interconnection document to standardize and streamline interconnections between distributed resources and the utility grid (Decision No. 69674)
Interconnection rulemaking anticipated •
Net metering will be taken up by Corporation Commission
State building standards Executive Order 2005-05
New state-funded buildings to be designed and constructed to derive at least 10% of •energy from renewable resources (including purchase of renewable energy credits)
New state buildings must meet LEED silver standard•
Utility energy efficiency programs
Utility programs adopted via rate cases
APS program initiated in Corporation Commission Decision No. 67744•
Integrated resource planning
Existing Corporation Commission rule suspended
Workshops being held to develop a new resource planning rule
Climate change Executive Order 2006-13
Establishes AZ goal to reduce greenhouse gas emissions to 2000 •level by 2020 and to 50% below 2000 level by 2040
Governor signed Western Regional Climate Action Initiative in February 2007
Established by governors of AZ, CA, OR, WA, NM (later •expanded to include other states and provinces)
To set an overall regional goal to reduce greenhouse gas emissions•
To develop a design for a regional market-based, multi-sector mechanism to •achieve the greenhouse gas reduction goal (e.g., cap and trade program)
To participate in multi-state greenhouse gas registry•
Western Climate Initiative Statement of Regional Goal (Aug. 22, 2007)
Maintains goals in Executive Order 2006-13.•

27
A Clean Electric Energy Strategy for Arizona
Western resource AdvocAtes
renewable energy technologies when it reviews utilities’ annual implementation plans and compliance reports filed under its Renewable Energy Standard.48 Under this standard, the Commission could encourage development of new technologies, such as CSP, by approving projects in a utility’s renewable energy portfolio. In addition, the Commission could forego penalizing a utility if the new technology did not perform as expected during its early months. For instance, the Commission might waive the provision in the Renewable Energy Standard rule that enables it to disallow recovery of the costs of making up a shortfall in meeting the kWh requirements. Again, the Commission must balance several potentially conflicting goals — meeting the Renewable Energy Standard requirements, protecting ratepayers from managerial misjudgments, and expanding the portfolio of renewable energy technologies.
An additional instrument for commercializing promising technologies is the establishment of a quasi-public corporation to stimulate research and development. Other states have taken the lead:
The New York State Energy Research and •Development Authority is a public benefit corporation created by the state legislature. According to its website, NYSERDA developed and brought into use over 170 clean energy products, processes, and services.49 Funding is obtained through an assessment on utility sales and from contributions from the New York Power Authority and the Long Island Power Authority.
The Connecticut Clean Energy Fund• 50 was created by the legislature and is administered by a quasi-public organization. It promotes the development and commercialization of clean energy technologies. Funding is from a surcharge on utility bills. Among other things, the Connecticut Clean Energy Fund coordinates a process to select innovative clean energy projects to be recommended to electric distribution companies.
48 A.A.C. R14-2-1812, 1813, and 1815.
49 New York State Energy Research and Development Authority website, http://www.nyserda.org.
50 Connecticut Clean Energy Fund website, http://www.ctinnovations.com.
The Wyoming Infrastructure Authority, among other •things, can enter into partnerships with public or private entities to develop advanced coal plants. In 2007, it agreed to a memorandum of understanding with PacifiCorp to explore the potential for developing an IGCC demonstration project. The Authority will seek to obtain federal funding to support the project.51
Arizona would benefit from legislative authorization of a clean energy development fund or corporation to further promote commercialization of new clean energy technologies. Development of such a program could draw upon the experience in other states.
Develop Transmission Capacity
To meet Arizona’s load growth, additional transmission capacity will be needed. The capacity and location of new transmission lines will be determined by the type of generation at the end of the line and by the amount of energy efficiency undertaken by utilities and their customers. Renewable resources located in Arizona or nearby states will require far less mileage of transmission lines than resources located more remotely.
Going forward, the Arizona Corporation Commission will consider, through the Biennial Transmission Assessment, planning of transmission for bringing available in-state renewable resources to load.52 This planning requirement applies only to Commission-regulated utilities. Additional actions in other states are being taken:
New Mexico has established a Renewable Energy •Transmission Authority, which may finance, plan, acquire, maintain, and operate transmission and interconnected storage facilities.53 At least 30% of the electric energy must originate from renewable energy sources. The authority is governed by a seven-member board and is to obtain its revenues from the projects it initiates. It may issue bonds, exercise eminent domain, and collect charges for
51 Wyoming Infrastructure Authority website, http://www.wyia.org/announce.htm.
52 Decision No. 69389, dated March 22, 2007.
53 HB 188 (2007), Renewable Energy Transmission Authority Act.

A Clean Electric Energy Strategy for Arizona
Western resource AdvocAtes28
use of its facilities. As a result of the Authority, transmission facilities to move New Mexico renewable energy to Arizona may be constructed.
The Wyoming legislature created the Wyoming •Infrastructure Authority to issue revenue bonds to finance new transmission lines and advanced coal plants and to charge for use of its facilities.54
It may be desirable for the Arizona legislature to establish a similar transmission authority or other mechanism for the purpose of delivering renewable energy from Arizona and out-of-state projects to load centers in the state.
Increase the Renewable Energy Standard
The Renewable Energy Standard adopted by the Corporation Commission is a central component of a clean energy future for Arizona. However, in light of the clean energy strategy, the standard should be increased to 20% of retail sales from renewable resources by 2022 (see Figure 12) as opposed to the current 15% by 2025.55 Salt River Project should adopt a parallel policy.
Other states that have adopted renewable portfolio standards have increased their standards a few years into the program. In 2007, New Mexico increased its standard from 10% by 2011 to 20% by 2020 (with a separate standard for cooperatives), and Colorado increased its standard from 10% by 2015 to 20% by 2020 (with separate standards for municipalities and cooperatives).
54 W.S. 37-5-301, et seq.
55 The figure assumes that Salt River Project and other non-jurisdictional utilities would adopt renewable energy standards similar to those adopted by the Corporation Commission.
Increase Energy Efficiency Programs
Utilities in Arizona are beginning to accelerate their energy efficiency programs. Arizona Public Service Company plans to spend at least $16 million per year on these programs. However, this level of expenditure would produce smaller savings than would be achieved under the Western Governors’ Association Energy Efficiency Task Force goal of reducing energy consumption by 20% by 2020.56 Utilities and their regulators should further accelerate energy efficiency programs to reduce Arizona’s load growth by about one-third by 2025. Regulators may need to revise cost recovery mechanisms for efficiency programs to accelerate recovery of utility program costs and to decouple utility revenues from kWh sales so that utilities recover their fixed costs in a timely manner while reducing energy consumption.
56 Western Governors’ Association, Energy Efficiency Task Force Report (Denver, January 2006), v.
Figure 12. Renewable Energy Delivered to Consumers: RES and Clean Energy Strategy
25%
20%
15%
10%
5%
0%’07 2010 2015 2020 ’25
% o
f AZ
Reta
il Sa
les
RES applied to entire state
Clean Energy Strategy for entire state

29
A Clean Electric Energy Strategy for Arizona
Western resource AdvocAtes
Conclusions
Achieving absolute decreases in carbon dioxide emissions from power generation serving Arizona consumers, relative to a base year such as 2000 or 2006, requires, in addition to the implementation of the clean energy strategy to serve load growth, one or more of the following:
Retirement of existing older fossil fuel power »plants and replacement of those plants with zero- or low-emission technologies, such as concentrating solar power or integrated gasification combined cycle with carbon captureOffsets »Retrofits of older power plants with carbon »capture and storage equipment
A portfolio of renewable energy and energy efficiency is cost-competitive, exhibits stable prices, and does not expose utilities or their customers to potentially high fossil fuel prices and potentially costly compliance with greenhouse gas emission regulations.
Based on past experience, fossil fuel prices cannot •be reliably projected over the long term; natural gas prices show evidence of long-term increases.Solar, geothermal, and wind projects do not incur •fuel costs and their annual costs are generally stable. Energy efficiency is the lowest-cost resource available •to Arizona, and efficiency measures are generally not subject to price increases after having been installed.A portfolio of renewable energy and energy •efficiency resources serves as a hedge against high fossil fuel prices.Renewable energy and energy efficiency emit little •or no carbon dioxide and therefore would not incur significant costs to comply with future greenhouse gas emission regulations.Given the uncertainties about future costs, a •portfolio of clean energy resources costs about the same as a portfolio of pulverized coal power plants and natural gas power plants and may cost less, depending on the price of fossil fuels and the cost of complying with greenhouse gas emission regulations.
This report is intended to inject practical new ideas into resource planning and change the way electricity is consumed and supplied. To advance the dialogue on resource choices, we have presented a clean energy strategy to meet the growth in demand for electricity in Arizona reliably, with very limited emission of greenhouse gases, and at reasonable cost.
A clean energy future for Arizona depends on meeting load growth with commercially available and emerging clean energy resources, including energy efficiency, renewable energy, and advanced fossil fuel technologies. Policies to encourage adoption of these technologies are a critical part of the strategy proposed in this report. In addition, Arizona will also have to begin addressing carbon dioxide emissions from existing power plants. Figure 13 summarizes the clean energy strategy for Arizona. Specific conclusions are listed below.
Load growth is a driving force.If recent trends continue, the demand for electricity •in Arizona will increase at a rate of about 3.6% per year; at this rate, electricity consumption will double in about 20 years.Arizona’s rapid load growth provides an opportunity •to transition away from conventional fossil fuel power generation toward cleaner resources.
Growing demand can be met without adding any pulverized coal power plants.
Load growth can be met with energy efficiency, •renewable energy, advanced coal generation with greatly reduced carbon dioxide emissions, and natural gas-fired generation.
Meeting load growth with clean energy resources adds very little carbon dioxide to the atmosphere as compared to the existing fleet of power plants serving Arizona’s 2006 load.

A Clean Electric Energy Strategy for Arizona
Western resource AdvocAtes30
Both commercially available technologies and emerging technologies are needed to provide Arizona with clean, reliable, reasonably priced electricity.
Policies to make greater use of commercially available technologies should be actively pursued.
Arizona regulators and utilities should increase •the magnitude of renewable energy and energy efficiency programs from their currently planned levels.To advance energy efficiency, Arizona regulators •should consider decoupling from kWh sales the revenues needed to cover fixed costs.The Arizona legislature should consider authorizing •a renewable energy transmission authority to accelerate the development of in-state renewable energy projects and to import renewable energy from other states.
Policies to commercialize promising technologies should also be actively pursued.
Commercialization of advanced fossil fuel •technology with carbon capture, such as IGCC, and commercialization of large-scale CSP with storage are essential to advancing a clean energy strategy. Arizona regulators should act to encourage •commercialization of advanced coal and CSP by allowing utilities to recover the costs of reasonable investments in emerging technologies and by waiving Renewable Energy Standard penalties potentially arising from temporary performance problems with new technologies.The Arizona legislature should consider authorizing •a clean energy research and development authority to fund and help commercialize renewable energy, energy efficiency, and advanced fossil fuel technologies that capture and store greenhouse gases.
Photo: iStock.

31
A Clean Electric Energy Strategy for Arizona
Western resource AdvocAtes
POlicies FOR
cOMMeRcial technOlOgies
Increase the Renewable Energy Standard
Decouple revenues from kWh sales (to encourage energy
efficiency programs)
Authorize investment in renewable energy transmission facilities
POlicies FOR
eMeRging technOlOgies
Allow cost recovery for reasonable investments
in new technologies
Develop R&D program
cOMMeRcially available
clean eneRgy technOlOgies
Energy efficiency
Renewable energy (e.g., wind, photovoltaics and other solar,
geothermal, biomass)
eMeRging
clean eneRgy technOlOgies
Integrated gasification combined cycle with carbon capture and storage
Concentrating solar power with thermal storage
Other
Old POweR Plants
Retire old plants and replace with emerging
clean technologies
Offset emissions
Capture and store CO2 emissions
clean eneRgy FutuRe
Low CO2 emissions
Stable costs
Reasonable costs as compared with conventional alternatives
Reliable service
lOad gROwth
Figure 13. Components of a Clean Energy Strategy for Arizona

Western Resource Advocates’ mission is to protect the West’s land, air, and water. Our lawyers, scientists, and economists: 1) advance clean energy to reduce pollution and global warming; 2) promote urban water conservation and river restoration; and 3) defend special public lands from energy development and unauthorized off-road vehicle travel. We collaborate with other conservation groups, hunters and fishermen, ranchers, American Indians, and others to ensure a sustainable future for the West.