a cellular lipidomic study on the aβ-induced neurotoxicity and neuroprotective effects of egcg by...
TRANSCRIPT

3208 Mol. BioSyst., 2012, 8, 3208–3215 This journal is c The Royal Society of Chemistry 2012
Cite this: Mol. BioSyst., 2012, 8, 3208–3215
A cellular lipidomic study on the Ab-induced neurotoxicity and
neuroprotective effects of EGCG by using UPLC/MS-based glycerolipids
profiling and multivariate analysisw
Hongyang Zhang,zab Jing-Rong Wang,zac Lee Fong Yau,c Hing Man Ho,c
Chi Leung Chan,cPing Hu,
bLiang Liu*
acand Zhi-Hong Jiang*
ac
Received 1st April 2012, Accepted 12th September 2012
DOI: 10.1039/c2mb25126d
The aim of this study was to investigate the cellular lipid metabolism associated with b-amyloid
peptide (Ab)-induced neurotoxicity as well as the neuroprotective effect of (�)-epigallocatechingallate (EGCG), a major polyphenol in green tea. An ultra-performance liquid chromatography-
quadrupole-time-of-flight mass spectrometry (UPLC-Q-TOF-MS)-based lipidomic approach was
developed to screen and identify changes of the glycerolipids (GL) upon Ab treatment with or
without the presence of EGCG in PC12 cells. Principle component analysis (PCA) showed that
the Ab-treated group was well separated from the control group, whereas the EGCG group was
closer to the control group. The GL levels were significantly elevated in Ab-treated cells
compared with the control group, but were restored near to normal levels after EGCG treatment.
The elevated phosphatidylcholines (PCs) levels observed in the Ab-treated PC12 cells were quite
probably the integrated results of the reduced phospholipase A2 (PLA2) activity and the enhanced
activity of lysophospholipid acyltransferases. Moreover, an increased liberation of arachidonic
acid (AA) from PCs was observed as another important response of PC12 cells to the Abaggregates, implying an active inflammatory process occurring in Ab induced neurotoxicity.
EGCG treatment can reverse the deregulated metabolism of PCs, which might be one of the
biochemical mechanisms contributing to its neuroprotective effect. Collectively, results obtained
from the current lipidomic analyses of PC12 cells provided important insight into the biochemical
mechanisms underlying Ab-induced neurotoxicity and neuro protective effects of EGCG. This is
the first report of the lipidomic study on the neuroprotective effect of EGCG.
Introduction
Alzheimer’s disease (AD) is the most common neurodegenerative
disorder that affects a large number of the elderly population
worldwide.1 It is estimated that about 20 million people suffer from
AD-attributable dementia, with 20% of the individuals above
75 years old at risk of developing the disease. Evidence drawn
primarily from neuropathology, genetics and biophysics has
shaped the well-known ‘‘amyloid hypothesis’’, which implicates
the causative role of b-amyloid (Ab) peptide aggregation in AD.1
Numerous studies have aimed at interfering with amyloid
aggregation as an approach for the prevention or treatment
of AD.2
Recently, substantial evidence from epidemiological, animal,
and cellular studies has suggested a close association between lipid
metabolism and neurodegeneration.3–5 Biochemical studies have
revealed decreased levels of one or more classes of brain phospho-
lipids and increased levels of phospholipid breakdown products in
cerebral cortical areas of postmortem AD brain, suggesting an
important role of damage to brain membrane phospholipids in the
pathogenesis of AD.6 Further studies have suggested alterations in
membrane lipid composition associated with Ab.7 On the other
hand, amyloid peptide has a physiological function in regulating
lipid homeostasis in return.8 These studies provided evidence for a
complex and dual lipid-AD link, suggesting a potential lipid-based
causal approach for treating AD.
Human epidemiological and in vivo data suggested that
drinking green tea may decrease the incidence of AD.9
(�)-Epigallocatechin gallate (EGCG, Scheme 1), the polyphenol
found in large amounts in green tea, has been shown to possess
a State Key Laboratory of Quality Research in Chinese Medicine,Macau Institute for Applied Research in Medicine and Health,Macau University of Science and Technology, Macau, China.E-mail: [email protected], [email protected];Fax: +86 853 28825886; Tel: +86 853 88972777
b School of Chemistry & Molecular Engineering, East-ChinaUniversity of Science & Technology, Shanghai, China
c School of Chinese Medicine, Hong Kong Baptist University,Kowloon Tong, Hong Kong, Chinaw Electronic supplementary information (ESI) available. See DOI:10.1039/c2mb25126dz These authors contributed equally to the work.
MolecularBioSystems
Dynamic Article Links
www.rsc.org/molecularbiosystems PAPER
Dow
nloa
ded
by L
aure
ntia
n U
nive
rsity
on
12 M
arch
201
3Pu
blis
hed
on 0
3 O
ctob
er 2
012
on h
ttp://
pubs
.rsc
.org
| do
i:10.
1039
/C2M
B25
126D
View Article Online / Journal Homepage / Table of Contents for this issue

This journal is c The Royal Society of Chemistry 2012 Mol. BioSyst., 2012, 8, 3208–3215 3209
neuroprotective activities in a wide array of cellular and animal
models of neurological disorders.10 It has become clear that the
mechanism underlying the neuroprotective effect of EGCG goes
beyond its antioxidant activity, and might be at least partially
associated with their protection against Ab-induced toxicity.11–13
However, although several studies on the mechanisms of the
protective effect of EGCG against Ab-induced toxicity were
carried out,14 no attempt has been made to reveal the association
of such neuroprotective effect with the modulating effect of
EGCG on lipid metabolism, which has been recognized and
demonstrated by recent experimental studies.15,16
Lipidomics, a newly and rapidly expanding research field
that studies lipidomes and the organizational hierarchy of
lipids, has been proven to be a global approach for lipid
analysis in biological systems.17 It has been driven by rapid
advances in technologies including liquid chromatography
coupled with mass spectrometry (LC-MS), nuclear magnetic
resonance (NMR), and computational methods, as well as
increasingly appreciated role of lipids in many diseases such as
obesity,18 atherosclerosis,19 hypertension,20 and diabetes.21
Several lipidomic studies on AD have been carried out and
some potential lipid markers have been discovered.22,23 However,
since most of these studies used the brain of an AD patient for
lipid analysis, several blemishes still existed. First, due to multiple
cell types in the brain, varying degree of the cross presence of gray
and white matter during sampling may lead to an unpredictable
variable, which may overshadow real differences between the
samples from diseased and normal states.22 Second, metabolomics
of whole organism reflected holistic biology of human, thus
understanding of functions of specific cell types cannot be
obtained. Cellular lipidomics, which provide a metabolic profile of
individual cell types, are much easier to control, with less individual
variations, thus can provide more constant backgrounds against
which more subtle metabolic changes become apparent.24 Further-
more, cellular lipidomics provide relevant information about cell
functions of specific cell types, and therefore can be complementary
to the brain lipid studies on AD.
With an aim at addressing the global alteration of GL levels
in the Ab-treated neuron-like cells, and understanding the
mechanisms underlying Ab-induced neurotoxicity and neuro-
protective effect of natural products, a cellular lipidomics
investigation was carried in the current study. GL profiles
in the Ab-treated PC12 cells with or without the presence
of EGCG were characterized by employing the newly devel-
oped ultra-performance liquid chromatography-quadrupole-
time-of-flight mass spectrometry (UPLC-Q-TOF-MS) based
lipidomic approach. Multivariate statistical methods, including
principle component analysis (PCA) and partial least squares-
discriminant analysis (PLS-DA) were further employed for
differentiating the different groups and screening of potential
lipid markers.
Materials and methods
Chemicals and materials
The b-amyloid peptide (25–35, Ab25–35) trifluoroacetate salt
was obtained from Bachem (Bubendorf, Switzerland). 1,2-
Ditetradecanoyl-sn-glycero-3-phosphocholine (DMPC, PC
14 : 0/14 : 0) was purchased from Avanti Polar Lipids
(Alabaster, AL, USA). HPLC-grade acetonitrile, methanol,
chloroform, and isopropanol were purchased from Merck
(Darmstadt, Germany). Ultrapure water (18.2 MO) was
purified with a Milli-Q system (Millipore, MA, USA). EGCG
was obtained from Shanghai Ronghe Science Technology Ltd
(Shanghai, China). 3-[4,5-Dimethylthiazol-2-yl]-2,5-diphenyl-
tetrazolium bromide (MTT) was obtained from Sigma-Aldrich
(St. Louis, MO, USA). Rat pheochromocytoma PC12 cells
were obtained from the American Type Tissue Collection
(ATCC, Manassas, VA, USA). All other chemicals were of
analytical grade.
Cell culture and treatment
Rat pheochromocytoma PC12 cells were cultured in F-12K
medium (ATCC, Manassas, VA, USA) containing 15% horse
serum (Gibcos, New Zealand) and 2.5% FBS (Gibcos, New
Zealand) at 37 1C in a 5% CO2/95% air atmosphere. For
assessment of cell viability, PC12 cells were seeded in a 96-well
plate coated with collagen I (Gibcos, New Zealand) at a
density of 6 � 104 cells per well and allowed to adhere for 16 h
before treatment. Different concentrations of EGCG (1, 5, 10,
25, 50, 100 mM) were added to the cells of EGCG group 2 h
prior to the addition of Ab25–35 which was freshly dissolved in
distilled water on the day of the experiment.9 After subsequent
incubation for 24 h, MTT solution (10 mL per well, 5 mg ml�1
solution) was added to each well and then incubated for 4 h at
37 1C, after that 100 mL lysing sodium dodecyl sulfate (SDS)
was added and kept at room temperature overnight. The
optical densities were determined at 570 nm using a microplate
reader. Each experiment was carried out for three times.
For lipidomic analysis, PC12 cells were seeded in a 12-well
plate under the same conditions and divided into the following
three groups (each n = 7): the control, Ab-treated, and
EGCG-treated groups. Lipids were extracted from cells at
24 h after Ab25–35 addition. Plating controls seeded and
cultured at the same time were counted immediately prior to
lipid extraction to establish final cell numbers.
GL extraction
GLs were extracted according to the methods reported by
Figeys et al.25 with minor modifications. Briefly, medium was
removed from each plate and the cells were washed extensively
with 10 mM phosphate buffered saline. Cultures of PC12 cells
were placed on ice, and 1 mL of ice-cold methanol acidified
with 2% acetic acid was added to each well. Cells were then
Scheme 1 Chemical structure of (-)-epigallocatechin gallate (EGCG).
Dow
nloa
ded
by L
aure
ntia
n U
nive
rsity
on
12 M
arch
201
3Pu
blis
hed
on 0
3 O
ctob
er 2
012
on h
ttp://
pubs
.rsc
.org
| do
i:10.
1039
/C2M
B25
126D
View Article Online

3210 Mol. BioSyst., 2012, 8, 3208–3215 This journal is c The Royal Society of Chemistry 2012
scraped and collected in acidified methanol. Before extraction,
10 mL of 25 mg mL�1 internal standard solution (DMPC, non-
naturally occurring in mammalian cells) was added. Seven
wells per condition were harvested for lipid extraction. Lipids
were extracted using 0.95 mL of chloroform and 0.8 mL of
0.1 M sodium acetate in acid-washed glass tubes with PTFE
coated tops. After layer separation by centrifugation, 0.85 mL of
the lower organic fractions were collected, evaporated under a
gentle stream of nitrogen gas, and the residue was reconstituted
in 200 mL of methanol. The solutions were filtered through a
0.22 mm syringe filter (Millipore) into autosampler vials (Waters)
and stored at �80 1C before analysis.
UPLC-MS analysis
Chromatographic separation was performed using a Waters
ACQUITY UPLCt system (Waters Corp., Milford, USA)
equipped with a binary solvent delivery system and an auto-
sampler. A Waters ACQUITY HSS C18 column (100 �2.1 mm, 1.7 mm) was used to separate the endogenous lipids.
The mobile phase consisted of (A) acetonitrile–water (40 : 60,
v/v) and (B) acetonitrile–isopropanol (10 : 90, v/v), both
containing 10 mM ammonium acetate. A linear gradient was
optimized as follows (flow rate, 0.3 mL min�1): 0–4 min, 50%
B to 70% B; 4–15 min, 70% B to 80% B; 15–18 min, 80% B to
100% B; 18–19 min, 100% B to 100% B; 19–20 min, 100% B
to 50% B; 20–25 min, equilibration with 50% B. 2 mL of
sample solution was injected in each run. The column and
auto-sampler were maintained at 50 1C and 4 1C, respectively.
Mass spectrometry was performed using a MicroTOF-Q
mass spectrometer (Bruker Daltonics Inc., MA, USA)
equipped with an electrospray ion source. The system was
operated in positive ion mode and the optimized MS condi-
tions were as follows: capillary voltage 4500 V, end plate offset
voltage �500 V, capillary temperature 200 1C, drying gas flow
4.0 L min�1, drying gas temperature 200 1C, nebulizing gas
pressure 0.4 bar. For targeted MS/MS scan, collision energy
was set as 20 eV. Data were collected in centroid mode from
100–1200 m/z. For accurate mass measurement, the TOF mass
spectrometer was calibrated routinely using sodium formate
solution infused at a flow rate of 2.5 mL h�1. Sodium formate
solution was prepared by mixing 0.05 mM NaOH solution
with 0.05% formic acid in 90 : 10 proportion of 2-propanol/
distilled water.
Samples were analyzed in a random sequence in order to
reduce systemic error. Each sample was analyzed twice and the
average data were used for subsequent processing. Aliquots of all
samples were mixed together to serve as a pooled quality control
(QC) sample. Seven QC samples were evenly inserted into the
analytical sequence to monitor the analytical performance.
Data processing
The obtained CDF format data were firstly converted to
a MarkerLynx RAW format file through Waters Dbridge
software, and then exported intoMarkerlynx software (Version 4.1,
Waters, USA), where the data were applied to external scaling with
cell numbers, normalization with the peak intensity of internal
standard, peak alignment and data filtering. The resultant
three-dimensional matrix comprising compounds indices
(retention time and m/z) and ion intensities (multiplied by
10 000) were then imported into software SIMCA-P + 12.0
(Umetrics, Umea, Sweden). The data were preprocessed using
mean-centering and Pareto-scaling prior to multivariate statistical
analysis. Principal component analysis (PCA) was used to visualize
general clustering among groups. Partial least-squares-discriminant
analysis (PLS-DA) was carried out to identify the differentially
expressed GLs responsible for the separation. Statistical analyses of
the differentially expressed metabolites were performed by using
Microsoft Office Excel 2003.
Results and discussion
Ab-induced toxicity and neuroprotective effect of EGCG
It has been demonstrated that Ab25–35 contributes significantlyto the expression of aggregation and neurotoxicity in the full
length Ab protein due to its putative b-turn site and a
hydrophobic domain.26 As the proposed active fragment of
Ab, this peptide has been extensively applied in assessing the
neurotoxicity associated with Ab aggregation. As shown in
Fig. 2, Ab25–35 dissolved in H2O (10 mM) induced significant
toxicity to PC12 cells (about 60–70% decrease in MTT values
vs. control). The toxic effect of Ab25–35 was reduced in a dose-
dependent manner by a co-treatment with EGCG. The effects
were significant at 5–100 mM and maximal at 25 mM (Fig. 1a).
The decrease in the protective effect at higher dosage resulted
from the cytotoxic of EGCG to PC12 cells, which has been
indicated in previous report and demonstrated in our
Fig. 1 Ab25–35-induced toxicity and protective effect of EGCG in
PC12 cells. Results obtained from MTT assay with (a) or without Abtreatment (b); results obtained from counting of the cells for lipid
extraction (c).
Dow
nloa
ded
by L
aure
ntia
n U
nive
rsity
on
12 M
arch
201
3Pu
blis
hed
on 0
3 O
ctob
er 2
012
on h
ttp://
pubs
.rsc
.org
| do
i:10.
1039
/C2M
B25
126D
View Article Online

This journal is c The Royal Society of Chemistry 2012 Mol. BioSyst., 2012, 8, 3208–3215 3211
experiment (Fig. 1b). To observe the maximal effect of EGCG
on the lipid metabolism, 25 mM was selected for subsequent
lipidomic analysis. In the experiment for lipid extraction, the
cells seeding in a 12-well plate showed similar proliferation
properties with that in a 96-well plate, as confirmed by the cell
counting of the control plate (Fig. 1c).
Cellular GL profiling
High efficient extraction is crucial for the cellular GL analysis.
A classic Bligh/Dyer method modified with acidified methanol
was employed to optimally extract GLs without causing cleavage.
Compared with the Figeys method, we performed single extrac-
tion so as to minimize the variations generated during extraction.
A test of 4 sequential extractions was carried out to evaluate the
maximum recovery. The extracts of each cycle were analyzed and
eight GLs belonging to different lipid classes were selected to
evaluate the extraction efficiencies. For each class of lipids,
representative lipids with different abundance levels (low-, middle-
, and high-abundance) were selected so as to roundly examine the
recovery (Fig. S1 and S2, ESIw). Over 90% of each class were
recovered in the first extraction, with less than 10% being lost in
the subsequent extractions. This result suggests an acceptable
recovery of the initial extract described in our manuscript.
The UPLC system, beneficial from the sub-2 mm hybrid
columns, can produce sharper and more concentrated peaks,
thus providing a rapid, sensitive, and convenient method for
the analysis of a wide range of lipids in cells. To achieve a
better separation and peak shape of these hydrophobic com-
pounds, isopropanol and ammonium acetate in the mobile
phase with gradient elution were used. The optimized base
peak intensity (BPI) chromatogram of GLs extracted from the
PC12 cell was shown in Fig. 2.
For the analysis of GLs, positive mode was selected based
on the general higher abundant ions of lysophosphatidylcho-
lines (LPCs), platelet activating factors (PAFs), phosphatidyl-
cholines (PCs), and triacylglycerols (TGs) than that obtained
in negative mode. More than 1500 peaks were detected
consistently in most cell samples using our UPLC/MS analy-
tical approach. High resolution mass obtained from the TOF-
MS analysis (with resolution >15 000) facilitated tentative
identification of the GLs based on the accurate mass with less
than 5 ppm error. By matching the accurate mass of the GLs in
PC12 with that of GLs recorded in LIPIDMAPS (containing
3036 GLs as of Apr. 21, 2010)27 and published literature,28,29 a
total of 83 GLs were tentatively identified (see Table S1 in the
ESIw). These included LPCs or PAFs, PCs, and TGs.
Multivariate analysis
In this study, a two-component PCA score plot of UPLC/MS
data was used to visualize the general variation of GLs among
three groups. As illustrated in Fig. 3a, the first two-component
PCA model cumulatively accounted for 63.5% of the total
variance. The PCA scores plot showed a clear separation
between the control and the Ab group in the PC1 dimension,
indicating a prominent toxicity induced by Ab25–25. Upon the
treatment of EGCG, the cellular lipidomic profiles were found
to shift back near to the control group, reflecting a potential
protective effect of EGCG against Ab-induced neurotoxicity.
The tight location of QC samples in the scores plot of PCA
Fig. 2 Typical UPLC/MS base peak ion chromatogram (BPI) of the
glycerolipids extract from PC12 cell using electrospray ionization in
positive ion mode.
Fig. 3 Multivariate statistical results of lipidomic data: (a) PCA and
(b) PLS-DA scores plot of the control (blue dot, n = 7), Ab (red
triangle, n = 7), EGCG intervention group (dark diamond, n = 7),
and QC samples (green star, n = 7); (c) loadings plot of PLS-DA
model using Pareto scaling with mean centering (labeled ions were
potential GL markers responsible for group clustering).
Dow
nloa
ded
by L
aure
ntia
n U
nive
rsity
on
12 M
arch
201
3Pu
blis
hed
on 0
3 O
ctob
er 2
012
on h
ttp://
pubs
.rsc
.org
| do
i:10.
1039
/C2M
B25
126D
View Article Online

3212 Mol. BioSyst., 2012, 8, 3208–3215 This journal is c The Royal Society of Chemistry 2012
(also seen in PLS-DA) demonstrated that the reproducibility
of analytical platforms was guaranteed.
To maximize the variation and characterize the differentially
expressed GLs responsible for the separation of control, Aband EGCG groups, the preprocessed data matrices were
further analyzed using a PLS-DA model, a sophisticated
supervised method capable of establishing the optimal position
to place a discriminant surface that separates classes best and
generate the matrices of scores and loadings. A well-fitted two-
component PLS-DA model (R2X = 0.388, R2
Y = 0.965, Q2 =
0.846) was constructed (Fig. 3b) and clear separation of each
group was obtained. In the corresponding loading plot (Fig. 3c),
the distance of individual variables from the main cluster is
positively related to their influence on the group separation, that
means compounds far away from the main cluster would have
greater impact on the classification. To evaluate the contribution
of respective compounds (variable) to the separation, variable
importance in the projection (VIP) value of each compound was
calculated. Variables with larger VIP values were considered as
the candidate markers contributing potentially to the separation.
The 10 potential GL markers identified based on the VIP value
were presented in Table 1.
MS/MS identification of potential GL biomarkers
The targeted MS/MS analysis obtained by QTOF-MS provided
the accurate mass of both molecular and fragment ions, which
are informative for identification of GL markers. Taking m/z
760.6 (PC), 524.4 (LPC), and 874.8 (TG) as examples, the
identification procedures were illustrated step by step as follows.
As shown in Fig. 4a, the molecular ion of the target GL is
m/z 760.5856, suggesting a molecular formula of C42H83NO8P
(error 0.1 ppm). The most abundant daughter ion at m/z
184.0730 (calculate for C5H15NO4P, error 4.9 ppm) was
assigned to be the diagnostic fragment corresponding to the
polar head group of PCs, indicating that the target GLs was a
PC.30 Detailed analysis of the less abundant ions revealed
fragment ions generated from cleavage of sn-2 (m/z 496.3381,
calculated for C24H51NO7P, error 4.4 ppm) and sn-1 (m/z
522.3547, calculated for C26H53NO7P, error 2.5 ppm), as well
as ions of respective dehydration products at m/z 478.3273
(calculated for C24H49NO6P, error 5.2 ppm, dehydrated ion of
sn-2 cleavage) and m/z 504.3444 (calculated for C26H51NO6P,
error 2.0 ppm, dehydrated ion of sn-1 cleavage), suggesting the
Table 1 Identification of GLs contributing to the differentiation of control, Ab and EGCG group on the basis of accurate mass and MS/MS
No. tR (min)
MS fragments
Identified GL VIP value
Peak intensity (�e4)a
MS1 Characteristic MS2 Control Ab Ab + EGCG
1 7.73 760.5856 184.0730, 496.3381,504.3444, 478.3273,522.3547
PC 16 : 0/18 : 1 11.32 13.91 � 2.42 26.02 � 3.81b 12.50 � 1.64c
2 6.81 758.5695 184.0733, 496.3386,502.3282, 520.3373, 478.3276
PC 16 : 0/18 : 2 10.30 12.68 � 1.98 22.38 � 2.66b 11.27 � 1.14c
3 7.68 734.5686 184.0732, 496.3377, 478.3294 PC 16 : 0/16 : 0 8.77 7.84 � 1.32 14.14 � 2.26b 6.35 � 0.79c
4 7.77 786.5990 184.0732, 524.3710, 520.3379,506.3576, 502.3289
PC 18 : 0/18 : 2 8.27 7.23 � 1.21 13.62 � 2.00b 6.39 � 0.83c
5 18.02 874.7842 577.5176, 575.5023, 601.5181 TG 16 : 0/18 : 1/18 : 2 6.59 4.32 � 0.84 8.40 � 1.16b 3.77 � 0.84c
6 17.75 872.7685 599.5024, 573.4862, 577.5171 TG 16 : 0/18 : 1/18 : 3 6.20 3.55 � 0.77 7.31 � 1.34b 3.27 � 0.85c
7 6.85 784.5822 184.0732, 522.3534, 520.3386,502.3307, 504.3399
PC 18 : 1/18 : 2 6.09 4.55 � 0.82 8.17 � 1.42b 4.11 � 0.58c
8 18.26 876.7998 577.5182, 603.5331 TG 16 : 0/18 : 1/18 : 1 5.71 3.73 � 0.60 6.83 � 0.90b 3.41 � 0.65c
9 18.27 850.7872 577.5183, 551.5020 TG 16 : 0/16 : 0/18 : 1 5.38 4.55 � 0.87 7.22 � 0.79b 4.04 � 0.76c
10 2.95 524.3686 184.0726, 258.1088, 240.0991 LPC 18 : 0 5.29 0.30 � 0.04 0.57 � 0.17b 0.24 � 0.06c
a Peak intensities were external scaled and normalized with cell numbers and the intensity of internal standard. b Student’s T-test, P o 0.01, vs.
control group. c Student’s T-test, P o 0.01, vs. Ab-treated group.
Fig. 4 Structures and MS/MS spectra of representative biomarkers:
(a) PC 16 : 0/18 : 1, (b) LPC 18 : 0, and (c) TG 16 : 0/18 : 1/18 : 2.
Dow
nloa
ded
by L
aure
ntia
n U
nive
rsity
on
12 M
arch
201
3Pu
blis
hed
on 0
3 O
ctob
er 2
012
on h
ttp://
pubs
.rsc
.org
| do
i:10.
1039
/C2M
B25
126D
View Article Online
This journal is c The Royal Society of Chemistry 2012 Mol. BioSyst., 2012, 8, 3208–3215 3213
loss of 16 : 0 and 18 : 1 FA. Based on above information,
the target GL was identified as PC 16 : 0/18 : 1. Likewise, the
target GL at m/z 524.3686 (calculated for C26H55NO7P, error
5.7 ppm) was characterized to be a LPC which belongs to the
subclass of monoacylglycero-PCs, as suggested by the diagnostic
fragment ion at m/z 184.0726 and the sole fragment formed by
cleavage of the sn-1 ester bond (Fig. 4b). On the basis of the
fragment ions at m/z 258.1088 (calculated for C8H21NO6P, error
7.4 ppm) and the subsequent ion loss of H2O m/z 240.0991
(calculated for C8H19NO5P, error 4.2 ppm), this GL was identified
to be LPC 18 : 0.
The fragment ions of TGs have been well studied and
may be used to determine the length and composition of the
FA chains.31 As seen in Fig. 4c, the mass spectrum of the target
GL showed quasimolecule ions at m/z 874.7842 (calculated for
C55H104NO6, error 2.5 ppm), corresponding to the ([M+NH4]+
of TG 52 : 3. The fragment ions generated from the loss of 16 : 0
FA, 18 : 2 FA, and 18 : 1 FA can be observed at m/z 601.5181
(calculate for C39H69O4, error 2.5 ppm), 577.5176 (calculate for
C37H69O4, error 3.5 ppm), and 575.5023 (calculate for C37H67O4,
error 2.8 ppm), respectively. It should be noted that the
dissociation of the [M + NH4]+ ion of TG is different from
other lipids in that all their molecular species displayed the
characteristic loss of an acyl side-chain as a neutral free acid and
ammonia.29 For example, the loss of the 16 : 0 FA chain
corresponds to C16H35O2N [CH3(CH2)14CO2H+NH3]. Based
on the above evidence, the target GL was characterized to be
TG 16 : 0/18 : 1/18 : 2. By using this approach, 10 potential
GL biomarkers, including different classes of PCs, TGs, and
LPC, were identified as presented in Table 1.
Lipid alterations in Ab-induced neurotoxicity and
neuroprotection of EGCG
The multivariate analysis based on the lipidomics data showed
significant GL metabolic alterations in PC12 cells after the Abtreatment. In Table 1, 10 GL biomarkers were significantly
elevated in Ab-treated cells as compared to the control cells. It
can be seen that the most significant alterations resulted from Abinsult are the increased levels of PCs. Although some studies have
reported increased levels of glycerophosphocholine, phospho-
choline and choline, which are water-soluble metabolites of PCs, as
a consequence of activation of calcium-dependent phospholipase
A2 (cPLA2),32 evidence from other studies suggested decreased
PLA2 activity in postmortem parietal and frontal cortices of AD
patients, and this reduction was correlated with the severity of
dementia.33,34 Collective data showed that decreased membrane
phospholipid metabolism mediated by reduced activity of PLA2 in
the cerebral cortex and hippocampus is an early event in AD and
may contribute to cognitive dysfunction and neuropathology at
early stages of the disease.35 Ross et al. further demonstrated
the increased activity of lysophospholipid acyltransferases,
which catalyze the re-synthesis of PCs from LPCs, in AD
patients’ brain.6 The decreased activity of PLA2 and increased
activity of lysophospholipid acyltransferases would both result
in the accumulation of PCs (Fig. 5). The elevated PCs level
observed in the Ab-treated PC12 cells was quite possibly be the
integrated consequence of the reduced PLA2 activity and
enhanced activity of lysophospholipid acyltransferases.
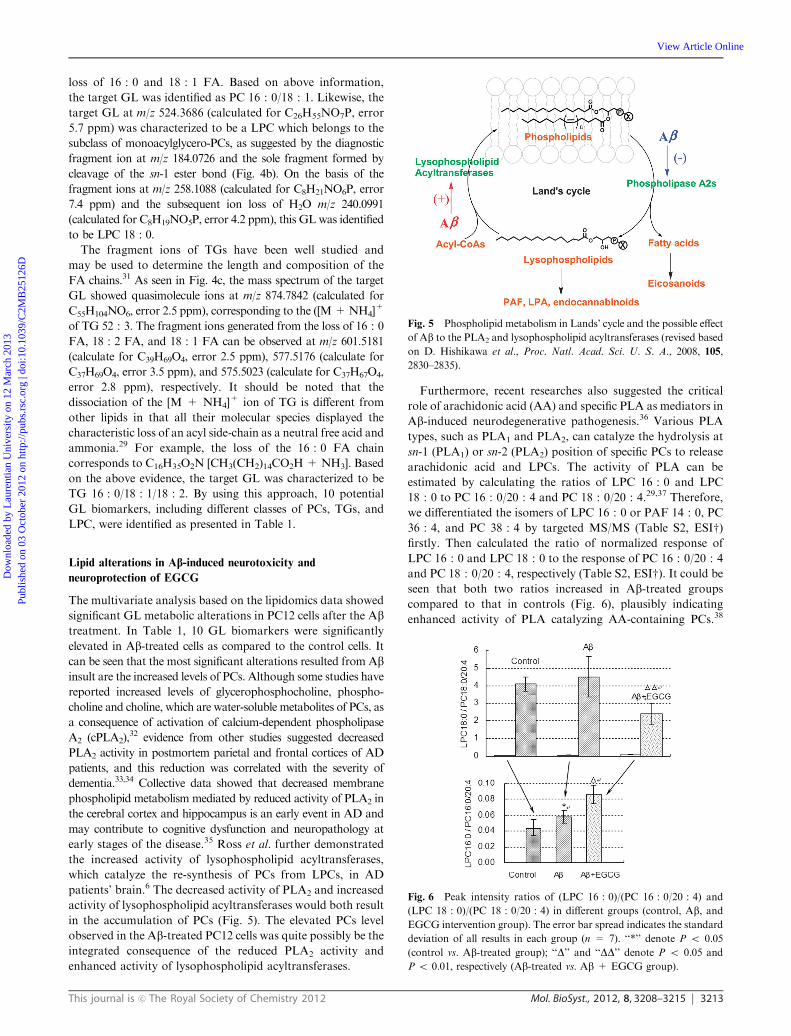
Furthermore, recent researches also suggested the critical
role of arachidonic acid (AA) and specific PLA as mediators in
Ab-induced neurodegenerative pathogenesis.36 Various PLA
types, such as PLA1 and PLA2, can catalyze the hydrolysis at
sn-1 (PLA1) or sn-2 (PLA2) position of specific PCs to release
arachidonic acid and LPCs. The activity of PLA can be
estimated by calculating the ratios of LPC 16 : 0 and LPC
18 : 0 to PC 16 : 0/20 : 4 and PC 18 : 0/20 : 4.29,37 Therefore,
we differentiated the isomers of LPC 16 : 0 or PAF 14 : 0, PC
36 : 4, and PC 38 : 4 by targeted MS/MS (Table S2, ESIw)firstly. Then calculated the ratio of normalized response of
LPC 16 : 0 and LPC 18 : 0 to the response of PC 16 : 0/20 : 4
and PC 18 : 0/20 : 4, respectively (Table S2, ESIw). It could be
seen that both two ratios increased in Ab-treated groups
compared to that in controls (Fig. 6), plausibly indicating
enhanced activity of PLA catalyzing AA-containing PCs.38
Fig. 5 Phospholipid metabolism in Lands’ cycle and the possible effect
of Ab to the PLA2 and lysophospholipid acyltransferases (revised based
on D. Hishikawa et al., Proc. Natl. Acad. Sci. U. S. A., 2008, 105,
2830–2835).
Fig. 6 Peak intensity ratios of (LPC 16 : 0)/(PC 16 : 0/20 : 4) and
(LPC 18 : 0)/(PC 18 : 0/20 : 4) in different groups (control, Ab, andEGCG intervention group). The error bar spread indicates the standard
deviation of all results in each group (n = 7). ‘‘*’’ denote P o 0.05
(control vs. Ab-treated group); ‘‘D’’ and ‘‘DD’’ denote P o 0.05 and
P o 0.01, respectively (Ab-treated vs. Ab + EGCG group).
Dow
nloa
ded
by L
aure
ntia
n U
nive
rsity
on
12 M
arch
201
3Pu
blis
hed
on 0
3 O
ctob
er 2
012
on h
ttp://
pubs
.rsc
.org
| do
i:10.
1039
/C2M
B25
126D
View Article Online

3214 Mol. BioSyst., 2012, 8, 3208–3215 This journal is c The Royal Society of Chemistry 2012
This observation is partially consistent with previous results
and suggests that an enhanced PLA activity might be asso-
ciated with the AD process.39 Upon EGCG treatment, the
ratio of (LPC 18 : 0)/(PC 18 : 0/20 : 4) was reversed while the
ratio of (LPC 16 : 0)/(PC 16 : 0/20 : 4) was just opposite.
However, the ratio of (LPC 16 : 0)/(PC 16 : 0/20 : 4) is very
small (o0.10), implying a low-level hydrolysis of PC 16 : 0/
20 : 4, which in turn resulted in the release of only a small
amount of corresponding LPC and AA. In comparison, the
ratio of (LPC 18 : 0)/(PC 18 : 0/20 : 4) was quite high (almost
100 folds of the ratio of (LPC 16 : 0)/(PC 16 : 0/20 : 4)),
which might consequently yield a large amount of LPC
18 : 0 (almost 10 folds of LPC 16 : 0) and AA (Table S2,
ESIw). This phenomenon indicates that different PLA isomers
may be involved in the hydrolysis of PC 16 : /20 : 4 and
PC 18 : 0/20 : 4, and their activity was individually modu-
lated, or certain PLA enzymes involved possess specificity in
the hydrolysis of these two PCs. It can be speculated that the
hydrolysis of PC 18 : 0/20 : 4 is the primary factor of AA
release.
Because of the dominant effect of PC18 : 0/20 : 4 hydrolysis
in the release of AA, the reduced ratio (LPC 18 : 0)/(PC
18 : 0/20 : 4) in the EGCG group might suggest a protective
effect of EGCG attributable to the reduced activity of specific
PLAs.40 However, since more than ten groups of PLAs with
varied substrate specificity are involved in the lipid meta-
bolism,41 and also because the upstream and downstream
enzymes catalyze the synthesis of PC and further metabolism
of LPC, the level of LPC is not always linearly associated with
the activity of certain PLAs and the level of AA. Therefore, the
activity of PLAs and the level of AAs upon Ab treatment and
EGCG intervention need to be further elucidated. Even
though, our result provided further insight into the underlying
mechanism of EGCG’s protective effect and potential thera-
peutic approach for AD.
Conclusion
In the current work, a UPLC-MS-based cellular lipidomic
approach has been developed. Cellular GL profiles in the
Ab-treated PC12 cells with or without the presence of EGCG
were compared. The results showed that GL alterations were
extensively involved in the neurotoxicity induced by Abaggregates as well as protection of EGCG against such
neurotoxicity. We found that the level of PCs significantly
elevated in PC12 cells upon addition of Ab aggregates, this
might be resulted from the decreased activity of PLA2 and
enhanced activity of lysophospholipid acyltransferases
(Fig. 6). This result provided cellular evidence for the previous
studies in AD patients.36,37 In addition, increased liberation of
arachidonic acid from PCs was indicated to be an important
response of PC12 cells to the Ab aggregates in our study. This
is consistent with the hypothesis that there is an active
inflammatory process occurring in AD. EGCG treatment
can reverse the deregulated metabolism of PC, which might
be one of the biochemical mechanisms contributing to its
neuroprotective effect. Collectively, the results obtained from the
lipidomic analyses of PC12 cells provided important insight into
the biochemical mechanisms underlying Ab-induced neurotoxicity
and protective effects of EGCG. This is the first report of the
lipidomic study on the neuroprotective effect of EGCG.
Acknowledgements
This study was financially supported by Macao Science and
Technology Development Fund,MSAR (039/2011/A2 to ZHJ).
Notes and references
1 T. Hartmann, J. Kuchenbecker and M. O. W. Grimm, J. Neurochem.,2007, 103, 159–170.
2 F. G. De Felice, J. C. Houze, J. Garcia-Abreu, P. R. Jr Louzada,R. C. Afonso, M. N. Meirelles, R. Lent, V. M. Neto andS. T. Ferreira, FASEB J., 2001, 15, 1297–1299.
3 O. Ghribi, J. Alzheimer’s Dis., 2008, 15, 673–684.4 M. S. Lin, L. Y. Chen, S. S. Wang, Y. Chang and W. Y. Chen,Colloids Surf., B Biointerfaces, 2008, 65, 172–177.
5 M. Wakabayashi, T. Okada, Y. Kozutsumi and K. Matsuzaki,Biochem. Biophys. Res. Commun., 2005, 328, 1019–1023.
6 R. M. Ross, A. Moszczynska, J. Erlich and S. J. Kish,J. Neurochem., 1998, 70, 786–793.
7 X. L. Qi, J. Xiu, K. R. Shan, Y. Xiao and R. Gu, Neurochem. Int.,2005, 46, 613–621.
8 M. O. Grimm, H. S. Grimm, A. J. Patzold, E. G. Zinser,R. Halonen, M. Duering, J. A. Tschape, B. De Strooper,U. Muller, J. Shen and T. Hartmann, Nat. Cell Biol., 2005, 7,1118–1123.
9 S. Bastianetto, Z. X. Yao, V. Papadopoulos and R. Quirion, Eur.J. Neurosci., 2006, 23, 55–64.
10 S. Mandel, T. Amit, O. Weinreb, L. Reznichenko andM. B. Youdim, CNS Neurosci. Ther., 2008, 14, 352–365.
11 Y. Levites, T. Amit, S. Mandel and M. B. Youdim, FASEB J.,2003, 17, 952–954.
12 S. Bastianetto, Z. X. Yao, V. Papadopoulos and R. Quirion, Eur J.Neurosci., 2006, 23, 55–64.
13 Y. T. Choi, C. H. Jung, S. R. Lee, J. H. Bae, W. K. Baek,M. H. Suh, J. Park, C. W. Park and S. I. Suh, Life Sci., 2001,70, 603–614.
14 C. L. Lin, T. F. Chen, M. J. Chiu, T. D. Way and J. K. Lin,Neurobiol. Aging, 2009, 30, 81–92.
15 S. K. Patra, F. Rizzi, A. Silva, D. O. Rugina and S. Bettuzzi,J. Physiol. Pharmacol., 2008, 59, 217–235.
16 Y. Sun, W. C. Hung, F. Y. Chen, C. C. Lee and H. W. Huang,Biophys. J., 2009, 96, 1026–1035.
17 X. L. Han and R. W. Gross, Mass Spectrom. Rev., 2005, 24,367–412.
18 A. Gonzalez-Periz, R. Horrillo, N. Ferre, K. Gronert,B. Dong, E. Moran-Salvador, E. Titos, M. Martinez-Clemente,M. Lopez-Parra, V. Arroyo and J. Claria, FASEB J., 2009, 23,1946–1957.
19 K. Ekroos, M. Janis, K. Tarasov, R. Hurme and R. Laaksonen,Curr. Atheroscler. Rep., 2010, 12, 273–281.
20 J. Graessler, D. Schwudke, P. E. Schwarz, R. Herzog,A. Shevchenko and S. R. Bornstein, PLoS One, 2009, 4, e6261.
21 G. Schmitz and M. Hanefeld, Diabetes, 2008, 57, A26.22 X. L. Han, S. Rozen, S. H. Boyle, C. Hellegers, H. Cheng,
J. R. Burke, K. A. Welsh-Bohmer, P. M. Doraiswamy andR. Kaddurah-Daouk, PLoS One, 2009, 4, e21643.
23 X. L. Han, Biochim. Biophys. Acta, 2010, 1801, 774–783.24 M. Cuperlovic-Culf, D. A. Barnett, A. S. Culf and I. Chute, Drug
Discovery Today, 2010, 15, 610–621.25 S. N. Whitehead, W. M. Hou, M. Ethier, J. C. Smith,
A. Bourgeois, R. Denis, S. A. L. Bennett and D. Figeys, Anal.Chem., 2007, 79, 8539–8548.
26 C. J. Pike, A. J. Walencewicz-Wasserman, J. Kosmoski,D. H. Cribbs, C. G. Glabe and C. W. Cotman, J. Neurochem.,1995, 64, 253–265.
27 http://www.lipidmaps.org/; accessed Apr 21, 2010.28 C. X. Hu, J. van Dommelen, R. van der Heijden, G. Spijksma,
T. H. Reijmers, M. Wang, E. Slee, X. Lu, G. W. Xu, J. van derGreef and T. Hankemeier, J. Proteome Res., 2008, 7, 4982–4911.
Dow
nloa
ded
by L
aure
ntia
n U
nive
rsity
on
12 M
arch
201
3Pu
blis
hed
on 0
3 O
ctob
er 2
012
on h
ttp://
pubs
.rsc
.org
| do
i:10.
1039
/C2M
B25
126D
View Article Online

This journal is c The Royal Society of Chemistry 2012 Mol. BioSyst., 2012, 8, 3208–3215 3215
29 J. M. Castro-Perez, J. Kamphorst, J. DeGroot, F. Lafeber,J. Goshawk, K. Yu, J. P. Shockcor, R. J. Vreeken andT. Hankemeier, J. Proteome Res., 2010, 9, 2377–2389.
30 B. Brugger, G. Erben, R. Sandhoff, F. T. Wieland and W. D.Lehmann, Proc. Natl. Acad. Sci. U. S. A., 1997, 94, 2339–2344.
31 A. M. McAnoy, C. C. Wu and R. C. Murphy, J. Am. Soc. MassSpectrom., 2005, 16, 1498–1509.
32 A. Walter, U. Korth, M. Hilgert, J. Hartmann, O. Weichel,M. Hilgert, K. Fassbender, A. Schmitt and J. Klein, Neurobiol.Aging, 2004, 12, 1299–1303.
33 W. F. Gattaz, A. Maras, N. J. Cairns, R. Levy and H. Forstl, Biol.Psychiatry, 1995, 37, 13–17.
34 W. F. Gattaz, N. J. Cairns, R. Levy, H. Forstl, D. F. Braus andA. Maras, Neuroscience (Oxford), 1996, 246, 129–131.
35 R. O. Sanchez-Mejia, J. W. Newman, S. Toh, G. Q. Yu,Y. G. Zhou, B. Halabisky, M. Cisse, K. Scearce-Levie,
I. H. Cheng, L. Gan, J. J. Palop, J. V. Bonventre and L. Mucke,Nat. Neurosci., 2008, 11, 1311–1317.
36 R. O. Sanchez-Mejia and L. Mucke, Biochim. Biophys. Acta, 2010,1801, 784–790.
37 C. X. Hu, H. W. Kong, F. X. Qu, Y. Li, Z. Q. Yu,P. Gao, S. Q. Peng and G. W. Xu, Mol. Biosyst., 2011, 7,3271–3279.
38 M. Chalimoniuk, A. Stolecka, M. Caka"a, S. Hauptmann,K. Schulz, U. Lipka, K. Leuner, A. Eckert, W. E. Muller andJ. B. Strosznajder, Acta Biochim. Pol., 2007, 54, 611–623.
39 V. Frisardi, F. Panza, D. Seripa, T. Farooqui and A. A. Farooqui,Prog. Lipid Res., 2011, 50, 313–330.
40 A. A. Farooqui, M. L. Litsky, T. Farooqui and L. A. Horrocks,Brain Res. Bull., 1999, 49, 139–153.
41 J. E. Burke and E. A. Dennis, J. Lipid Res., 2009, 50,S237–S242.
Dow
nloa
ded
by L
aure
ntia
n U
nive
rsity
on
12 M
arch
201
3Pu
blis
hed
on 0
3 O
ctob
er 2
012
on h
ttp://
pubs
.rsc
.org
| do
i:10.
1039
/C2M
B25
126D
View Article Online