a cell topography-based mechanism for ligand
TRANSCRIPT
A cell topography-based mechanism for liganddiscrimination by the T cell receptorRicardo A. Fernandesa,b,1,2, Kristina A. Ganzingerc,1,3, Justin C. Tzoud, Peter Jönssonc,4, Steven F. Leec,Matthieu Palayretc, Ana Mafalda Santosa,b, Alexander R. Carrc, Aleks Ponjavicc, Veronica T. Changa,b,5,Charlotte Macleodc, B. Christoffer Lagerholma, Alan E. Lindsaye, Omer Dushekf,g, Andreas Tilevikh,6, Simon J. Davisa,b,6,and David Klenermanc,6
aRadcliffe Department of Medicine, John Radcliffe Hospital, University of Oxford, OX3 9DS Oxford, United Kingdom; bMedical Research Council HumanImmunology Unit, John Radcliffe Hospital, University of Oxford, OX3 9DS Oxford, United Kingdom; cDepartment of Chemistry, University of Cambridge, CB21EW Cambridge, United Kingdom; dDepartment of Applied & Computational Mathematics & Statistics, University of Notre Dame, Notre Dame, IN 46556;eMathematics Department, University of British Columbia, Vancouver, BC V6T 1Z2, Canada; fSir William Dunn School of Pathology, University of Oxford,OX1 3RE Oxford, United Kingdom; gWolfson Centre for Mathematical Biology, University of Oxford, OX1 3RE Oxford, United Kingdom; and hSchool ofBioscience, University of Skövde, 541 28 Skövde, Sweden
Edited by David Baker, University of Washington, Seattle, WA, and approved May 22, 2019 (received for review October 7, 2018)
The T cell receptor (TCR) initiates the elimination of pathogens andtumors by T cells. To avoid damage to the host, the receptor mustbe capable of discriminating between wild-type and mutated selfand nonself peptide ligands presented by host cells. Exactly howthe TCR does this is unknown. In resting T cells, the TCR is largelyunphosphorylated due to the dominance of phosphatases over thekinases expressed at the cell surface. However, when agonistpeptides are presented to the TCR by major histocompatibilitycomplex proteins expressed by antigen-presenting cells (APCs),very fast receptor triggering, i.e., TCR phosphorylation, occurs.Recent work suggests that this depends on the local exclusion of thephosphatases from regions of contact of the T cells with the APCs.Here, we developed and tested a quantitative treatment of receptortriggering reliant only on TCR dwell time in phosphatase-depletedcell contacts constrained in area by cell topography. Using themodel and experimentally derived parameters, we found that li-gand discrimination likely depends crucially on individual contactsbeing ∼200 nm in radius, matching the dimensions of the surfaceprotrusions used by T cells to interrogate their targets. The modelnot only correctly predicted the relative signaling potencies ofknown agonists and nonagonists but also achieved this in the ab-sence of kinetic proofreading. Our work provides a simple, quanti-tative, and predictive molecular framework for understanding whyTCR triggering is so selective and fast and reveals that, for somereceptors, cell topography likely influences signaling outcomes.
T cell receptor | receptor triggering | single-molecule imaging | microvilli |dwell time
T cells play a central role in immunity. The triggering of T cellreceptors (TCRs) expressed on the surfaces of all T cells,
following their interaction with peptides complexed with majorhistocompatibility complex (pMHC) proteins on antigen-presentingcells (APCs), sets T cells on course to respond to pathogens andtumors (1). The TCR’s capacity to distinguish between differ-ent pMHC is referred to as ligand discrimination, a process thatcrucially underpins immunological “self/nonself” recognitionand T cell development (2). Ineffective ligand discriminationoften leads to immune deficiency or autoimmunity (3). Despite itscentral role in immunity, the biophysical basis of ligand discrimi-nation by the TCR is unclear, and understanding it is increasinglybecoming a matter of considerable urgency. Engineered immunecells expressing repurposed or artificial antigen receptors com-prise a powerful new class of cancer therapeutics (4, 5). The severeoff-target activity and extreme toxicity observed in some instances(6–8), however, is at least partly reflective of our poor grasp of theinterplay between TCR binding kinetics, ligand density, anddiscriminatory signaling.In addition to being highly selective, TCR signaling is ex-
tremely sensitive and fast: binding to a single agonist pMHC is
sufficient to induce TCR signaling within seconds (9, 10). How-ever, agonist peptides often comprise a very small fraction of all ofthe peptides presented as pMHC, raising the issue of how highsensitivity and discrimination are achieved simultaneously (11, 12).Several attempts have been made to explain ligand discriminationbased on the TCR acting autonomously in ways analogous to Gprotein-coupled and growth factor receptors, with limited success.In such cases, TCR-induced signaling is assumed to rely exclu-sively on pMHC binding, and, in general, little consideration isgiven to extrinsic factors that might also influence signaling out-comes. Kinetic proofreading (KP)-based theories, which introducemultiple signaling steps to create delays that enhance signalingfidelity, succeed in explaining TCR discrimination in principle(13–15), but this comes at a cost, i.e., reduced sensitivity.
Significance
One approach to testing biological theories is to determine ifthey are predictive. We have developed a simple, theoreticaltreatment of T cell receptor (TCR) triggering that relies on justtwo physical principles: (i) the time TCRs spend in cell–cellcontacts depleted of large tyrosine phosphatases and (ii) con-straints on the size of these contacts imposed by cell topography.The theory not only distinguishes between agonistic and non-agonistic TCR ligands but predicts the relative signaling potenciesof agonists with remarkable accuracy. These findings suggest thatthe theory captures the essential features of receptor triggering.
Author contributions: R.A.F. and K.A.G. designed research; R.A.F., K.A.G., P.J., S.F.L., M.P.,A.M.S., A.R.C., A.P., and C.M. performed research; J.C.T., V.T.C., B.C.L., A.E.L., O.D., andA.T. contributed new reagents/analytic tools; R.A.F. and K.A.G. analyzed data; R.A.F.,K.A.G., S.J.D., and D.K. wrote the paper; J.C.T. designed mathematical modeling; B.C.L.designed various imaging setups; A.E.L. and A.T. designed mathematical modeling andwrote simulation code; and S.J.D. and D.K. conceived and supervised the project.
The authors declare no conflict of interest.
This article is a PNAS Direct Submission.
This open access article is distributed under Creative Commons Attribution License 4.0(CC BY).1R.A.F. and K.A.G. contributed equally to the work.2Present addresses: Department of Molecular and Cellular Physiology and Department ofStructural Biology, Stanford University, Stanford, CA 94305.
3Present address: Living Matter Department, Physics of Cellular Interactions Group,AMOLF, 1098 XG Amsterdam, The Netherlands.
4Present address: Department of Chemistry, Lund University, SE-22100 Lund, Sweden.5Present address: Neurobiology Division, Medical Research Council Laboratory of Molec-ular Biology, CB2 0QH Cambridge, United Kingdom.
6To whom correspondence may be addressed. Email: [email protected], [email protected], or [email protected].
This article contains supporting information online at www.pnas.org/lookup/suppl/doi:10.1073/pnas.1817255116/-/DCSupplemental.
Published online June 20, 2019.
14002–14010 | PNAS | July 9, 2019 | vol. 116 | no. 28 www.pnas.org/cgi/doi/10.1073/pnas.1817255116
Dow
nloa
ded
by g
uest
on
Nov
embe
r 25
, 202
1

TCR triggering results in the tyrosine phosphorylation of itscytoplasmic immunoreceptor tyrosine-based activation motifs(ITAMs) by the kinase Lck, which unleashes a cascade ofchemical reactions in the T cell, leading to transcriptionalchanges and T cell activation. In addition to ligand discrimina-tion and sensitivity, a complete theory of T cell activation wouldhave to account for a large number of related observations, suchas peptide antagonism (16, 17), the synergistic signaling effects ofself and nonself ligands (18), serial receptor engagement (19–21), and force-induced changes in TCR/pMHC stability (11, 22,23), to name but a few. In addition, we have recently shown thatTCR triggering is not strictly ligand dependent since it occurswhen T cells form large contacts with non–ligand-presentingsurfaces from which cluster of differentiation 45 (CD45) is atleast partially excluded (24). Attempts have been made to gen-erate models of T cell activation that incorporate the cell-biological underpinnings of many of these phenomena (25–27),but such models often have to rely on numerous assumptions,making it difficult to be certain of their accuracy (28). An al-ternative approach is to start with a simple model whose pre-dictive ability can be tested, so that the extent to which itcaptures the essential features of receptor signaling canbe determined.Here, we developed and tested a quantitative treatment of
TCR triggering relying on just two physical principles: (i)TCR “dwell time” in cell–cell contacts depleted of large ty-rosine phosphatases and (ii) spatial constraints on contact sizeimposed by cell topography. The model suggested thatrestricting TCR engagement to small areas of contact wouldbe essential for effective ligand discrimination, which could beachieved without KP. The model also predicted the relativepotencies of well-characterized pMHC ligands with greataccuracy, suggesting it captures the essential features ofTCR triggering.
ResultsA Signaling Theory Relying on TCR Dwell Time at Close Contacts. Thenotion that TCR triggering might depend only on TCR dwelltime at phosphatase-depleted regions of close contact betweenT cells and APCs is embodied in the kinetic-segregation (KS)model of TCR triggering (29). The KS model proposes that, atsuch contacts, the TCR remains accessible to active kinases but isprotected from phosphatases that would otherwise reverse itsphosphorylation, resulting in the phosphorylated state beingsufficiently long-lived for downstream signaling to be initiated. Inthis context, cognate pMHC binding, which can slow or even haltTCR diffusion (30, 31), is expected to promote signaling simplyby increasing the TCR’s dwell time inside the close contact, in-creasing the probability of receptor triggering. Depletion of thephosphatases is considered to be a passive process, driven bydifferences in the size of CD45 versus that of signaling and ad-hesive molecular complexes that form at the T cell/APC contact(24, 32–34).Based on these ideas, we built a quantitative treatment of
TCR triggering (Fig. 1; full details of the model are given in SIAppendix, Appendix I). We assumed (i) that when a T cell and anAPC interact, “close contacts” are formed that each partiallyexclude CD45 (Fig. 1A), (ii) that TCRs diffuse in and out of theclose contacts (Fig. 1B), (iii) that while the TCR is bound to apMHC ligand it is unable to leave a close contact (Fig. 1C), and(iv) that any TCR that remains in a close contact for longer thana minimum time tmin, irrespective of ligand binding, is “trig-gered,” i.e., a receptor ITAM is stably phosphorylated (Fig. 1 Band C). We took tmin to be 2 s, in line with observation (10, 26,35–39) and in agreement with estimates of the catalytic activityof Lck [∼3 pTyr/s (40)] at the CD45/Lck ratio measured incontacts formed by T cells interacting with model surfaces (24).In this way, tmin creates an abrupt lower threshold for productive
residence times. In addition to tmin, the model incorporated thefollowing parameters: (i) the rate of TCR entry into the closecontact, (ii) the diffusion coefficients for unbound or ligand-bound receptors, and (iii) close-contact growth rate, therebyexplicitly allowing for T cell topography and dynamics.
Fig. 1. A quantitative treatment of TCR triggering relying on receptor dwelltime at phosphatase-depleted close contacts. (A) Top and side views of theclose contact depicting contact topography (with contact radius “r”) andCD45 exclusion. The first box (solid line) shows the region of the cell magnifiedbelow it. The second box (dotted line) shows the region depicted in the top viewon the right. (B) According to the model, a TCR (TCR1) is triggered, i.e., phos-phorylated because its residence time in the contact is ≥2 s. TCR2 is not triggeredbecause it diffuses out of the contact in less than 2 s. (C) Also according to themodel, a receptor (TCR3) that engages ligand is likely to be held in thecontact ≥2 s and become triggered. In B and C, the margins of the contact aremarked by the average positions of excluded CD45 molecules (green). (D) Snapshots from the simulation of the TCR density probability evolution in closecontacts as they grow over time (SI Appendix, Appendix I).
Fernandes et al. PNAS | July 9, 2019 | vol. 116 | no. 28 | 14003
BIOPH
YSICSAND
COMPU
TATIONALBIOLO
GY
Dow
nloa
ded
by g
uest
on
Nov
embe
r 25
, 202
1

The model used a system of coupled partial differential equa-tions (PDEs) to determine the distribution of TCR residence times,from which we could calculate the TCR-triggering probability, p,i.e., the likelihood that a receptor would have a dwell time >2 s,and therefore be phosphorylated. For freely diffusing TCRs in acircular close contact, the mean dwell time ðτTCRÞ is dependent oncontact radius, r, and the diffusion coefficient, D, of the receptor:
τTCR = r2�8D.
However, because close contacts are not static and insteadincrease in area over time (24, 41), we had to formulate andnumerically solve PDEs with a moving-boundary condition tocalculate the likelihood that the TCRs would remain in a closecontact growing to radius r, assuming a circumference-dependentrate of TCR entry into the contact (the evolution of this proba-bility distribution is shown in Fig. 1D and Movie S1; for furtherdetails, see SI Appendix, Appendix I). While multiple close con-tacts likely form between T cells and APCs, we modeled a singleclose contact only (triggering probabilities for multiple contactscan be obtained by multiplication, assuming the contacts arefunctionally independent). We used the model to ask the follow-ing questions: How can the TCR be triggered without ligandsand how is this affected by close-contact area? Furthermore,what conditions would lead to robust discriminatory TCR trig-gering? Most importantly, using the known binding and signalingproperties of well-characterized class I and II pMHC ligands, wetested whether the model was predictive.
Parameterization of the Model. To parameterize the model, it wasnecessary to determine the diffusional behavior of the TCR, Lck,and CD45 at close contacts. This was undertaken by studying theinteractions of T cells with supported lipid bilayers (SLBs) withthe defined membrane separation expected to be created in vivoby small adhesion molecules. For this, we used a signaling-disabled form of the rat adhesion protein CD48 (24). JurkatT cells expressing CD48 (42) were allowed to settle onto SLBspresenting the extracellular domain of rat CD2 (rCD2), resultingin rCD2 accumulation and CD45 exclusion from the close contactsformed.Two-color total internal reflection fluorescence microscopy
(TIRFM) and single-molecule tracking were used to followsubstoichiometrically labeled TCR, Lck, or CD45 moleculesrelative to the boundaries of close contacts identified by CD45bulk-labeled at high density in a second color (Fig. 2A). CD45exhibited the most exclusion from rCD2-mediated T cell/SLBcontacts. The density of CD45 molecules inside the close con-tacts was only 13 ± 3% of that outside (Fig. 2B and SI Appendix,Table S1), versus 56 ± 7% and 40 ± 6% for Lck and the TCR,respectively (Fig. 2 C and D and SI Appendix, Table S1). Theinitial CD45/Lck ratio of 5 to 1 before contact (24) was in thisway reduced by ∼50% (SI Appendix, Figs. S1 and S2). Since itwas not possible to measure the Lck/CD45 ratio at small, initialcontacts, we obtained experimental values for larger, more stablecontacts. However, bulk fluorescence measurements indicatedthat the CD45/Lck ratio did not vary significantly with contactgrowth: a CD45/Lck ratio of ∼2.7 was observed for all contacts of1- to 2-μm radius (SI Appendix, Fig. S2). TCR diffusion rateswere within the range reported by others (∼0.05 μm2/s; SI Ap-pendix, Table S1 and Fig. S3; refs. 43–45). The effective catalyticactivity of Lck at this CD45/Lck ratio has been shown to beapproximately half-maximal (close to 2.2 pTyr/s; ref. 40). Meandiffusion coefficients for CD45, Lck, and the TCR were similarfor molecules inside and outside the close contacts, and, overall,the TCR diffused ∼twofold more slowly than CD45 and Lck (SIAppendix, Table S1 and Fig. S3). Measurements used for themodeling that were made here or by others are summarized in
Table 1 (a more detailed list of parameters is given in SI Ap-pendix, Table S2).Two assumptions of the model that needed to be confirmed
were (i) that CD45 is evenly distributed at the T cell surfacebefore contact formation and (ii) that it is excluded as soonas close contacts begin to form. Three-dimensional super-resolution imaging (46) showed that CD45 is indeed evenlydistributed over the surface of the T cell, including the ends ofmicrovilli (SI Appendix, Fig. S4A), consistent with previousfindings (47). The early stages of close-contact formation aredifficult to study on SLBs because the contacts grow quickly.
Fig. 2. Parameterization of the model. (A) Experimental approach. High-density labeling of CD45 (Gap 8.3 Fab, Alexa Fluor 488) was used to indicatesites of close-contact formation between T cells and a rat CD2-presenting SLB(Left), and this was combined with simultaneous low-density labeling ofCD45 (Gap 8.3 Fab, Alexa Fluor 568), Lck (Halo tag, tetramethylrhodamine[TMR]), or TCR (Halo tag, TMR) (Right) to enable TIRFM-based single-molecule tracking. (B–D, Left) TIRFM-based single-molecule tracking ofCD45 (B), Lck (C), and TCR (D). Well-separated individual trajectories wererecorded for >280 ms and colored according to position in the contact (or-ange in CD45-rich regions and blue in CD45-depleted regions). (Right)Close-up views of trajectories in regions marked by white rectangles;CD45-rich regions are shown in gray. (Scale bar, 2 μm.) Data are repre-sentative of three independent experiments with n > 10 cells.
14004 | www.pnas.org/cgi/doi/10.1073/pnas.1817255116 Fernandes et al.
Dow
nloa
ded
by g
uest
on
Nov
embe
r 25
, 202
1

T cells form close contacts with protein-coated glass much moreslowly, however, and 2D superresolution imaging revealed that onthis surface CD45 was excluded from contacts of ∼80 nm, smallerthan the diffraction limit (SI Appendix, Fig. S4 B and C; see also ref.41). Furthermore, when Jurkat T cells expressing CD48 interactedwith SLBs loaded with fluorescently labeled forms of the extra-cellular domains of CD45RABC and rCD2, the SLB-boundCD45 was spontaneously excluded from contacts that formed(SI Appendix, Fig. S5 and Movie S2). These observations suggestthat CD45 segregation occurs passively, that is, immediatelyupon contact formation, in line with previous findings (24).
Validation of the Model. Our observation that the TCR can betriggered in the absence of ligands (24) supports our premise,i.e., that TCR triggering depends only on TCR dwell time inclose contacts depleted of CD45. However, a number oftestable predictions for signaling under these conditions allowexperimental validation of the model. First, since TCR dwelltime depends on close-contact size, which in turn is affectedby close-contact growth rate (for contacts growing on similartime scales to TCR diffusion), triggering times ought to beshorter for cells with larger close-contact growth rates (pre-diction 1; Fig. 3 A and B; for further details see SI Appendix,Appendix I). Second, since the phosphorylation rate, i.e., theeffective kcat of Lck, is inversely proportional to the CD45/Lck ratio in the close contact, an increase in this ratio shouldlead to longer triggering times (prediction 2; Fig. 3B; forquantification of the effective Lck kcat at different CD45/Lckratios, see ref. 40). Finally, receptor triggering should occursooner for single large contacts compared with two separatecontacts of the same combined size (prediction 3). For ex-ample, the model predicts that the triggering probability wouldincrease >sevenfold when two single contacts coalesce into alarger one (Fig. 3C).We tested these predictions for CD48-expressing Jurkat
T cells forming contacts with rCD2-presenting SLBs, using cal-cium release as a proxy for receptor triggering. To test prediction1, we exploited the natural variation in close-contact growthrates. We simultaneously measured contact growth and signalingtimes by coupling TIRFM-based detection of close contacts,identified as regions of CD45 exclusion (24), with changes incalcium reporter fluorescence (Fluo-4; Fig. 3 D and E and MovieS3). In agreement with the model’s prediction, receptor trig-gering occurred faster for cells with larger close-contact growthrates (Fig. 3F). For testing prediction 2, we compared the trig-gering times for Jurkat T cells with those for cells expressing aform of CD45 lacking its extracellular domain (HA-CD45) (24).HA-CD45 is less efficiently excluded from contacts and thereforereduces Lck kcat by increasing the CD45/Lck ratio in the close
contacts (SI Appendix, Fig. S1; ref. 24). As predicted once again bythe model, expression of HA-CD45 at ∼10,000 copies/cell (i.e., at5% of total CD45 expression; SI Appendix, Fig. S6) delayed trig-gering by almost 20 s (∼15%, P < 0.05, two-tailed t test, unequalvariance assumed; Fig. 3G). We previously showed, in the reverseexperiment, that the forced exclusion of Lck from close contacts,i.e., by expressing the kinase as a chimera with the extracellulardomain of CD45, also reduced the level of TCR triggering underthese conditions (24). Finally, treatment of Jurkat T cells withcytochalasin D, an inhibitor of actin polymerization and micro-villus formation (48), which produced larger and more stablecontacts, reduced triggering times by up to 30 s (∼23%, P < 0.05)in a drug exposure-dependent manner, consistent with the thirdprediction of the model (Fig. 3H).
Why TCRs Are Triggered in the Absence of Ligands. Having vali-dated the model, we first used it to explore the quantitativebasis of TCR triggering in the absence of ligands. Our calcu-lations showed that the probability of ligand-independent re-ceptor triggering is highly sensitive to close-contact radius(Fig. 4 A and B). The probability, p, that the dwell time rea-ches tmin >2 s, is 0 for contacts of the size observed duringT cell interrogation of APCs (220 nm; Fig. 4A; refs. 49 and 50),implying that no TCR is likely to be triggered in contacts ofthis size that lack ligands. On SLBs, however, T cells formcontacts much larger than those observed during cell–cell in-teractions (Fig. 2 B–D), and for these types of contacts, weestimate that ∼16 TCRs will be triggered per contact in theabsence of ligands (Fig. 4C). This calculation is based on (i) p,(ii) the total contact size observed at the time of calcium sig-naling (median contact area of 6 μm2; Fig. 4D), (iii) the measuredoverall TCR density (SI Appendix, Fig. S7), and (iv) the fractionof TCRs inside the contacts (40%; Fig. 2D). When similarnumbers of TCRs engage conventional ligands [∼30 TCRs (10)],signaling is initiated in CD4+ T cells, accounting for why TCRtriggering is observable for T cells interacting with SLBs (24).
Self/Nonself Discrimination. The hallmark of the TCR is its abilityto recognize low-density agonist pMHC and to discriminate be-tween weak/self and strong/agonist pMHC. We determinedwhether, under the simple constraints imposed by our model, theTCR would be capable of discriminatory signaling.First, we computed the probability distribution of TCR resi-
dence times for contacts of r = 220 nm, the size observed whenT cells encounter APCs (49, 50). We found that in the absence ofligands, the probability of a TCR remaining inside a close con-tact for longer than 2 s becomes vanishingly small (Fig. 5A): aclose contact of this size would need to persist for ∼18 h in orderfor there to be a 50% probability that a single TCR was triggered(Fig. 5B). Strikingly, residence times are much longer for TCRsin the presence of agonist pMHC even at low density (30 pMHC/μm2, 2D Kd given by kon = 0.1 μm2s−1 and koff = 1 s−1; Fig. 5A),which increases the triggering probability ∼12,000-fold, i.e., from18 h to 5 s (Fig. 5B). Residence times were much less affected forpMHC/TCR interactions with self pMHC at relatively highdensity [300 pMHC/μm2 and koff = 50 s−1, i.e., at the observedlow-affinity threshold for nonagonistic TCR/pMHC interactionsat high ligand-density (2, 11, 18, 51); Fig. 5A], with a 50% TCR-triggering probability requiring contacts of 2.5-h duration (Fig.5B). In other words, a 50-fold increase in koff, reflecting a veryconservative estimate of the lower limit of the koff for self pMHC,led to a 1,800-fold reduction in the likelihood of TCR triggering,despite there being 10-fold more self-presenting molecules thanagonist pMHCs. This indicates that TCR triggering, based ondwell time at close contacts, would be highly discriminatory.Changes in close-contact size profoundly altered the scope fordiscriminatory signaling, however. A twofold increase in close-contact radius yielded a ∼1,000-fold increase in the probability of
Table 1. Experimental parameters used in this study
Parameters Value
Total cell area 415 μm2*TCR diffusion coefficient 0.05 μm2 s−1†
Number of TCRs per cell 41,500‡
Fraction of TCR segregation 0.62†
CD45 to Lck ratio 2.5:1†
Close contact radius 220 nm§
Half-life of T cell–APC contacts 120 s§
TCR triggering (minimum dwell time for triggering) 2 s§,¶
References are given for measurements taken from the literature.*Weaver (65).†Experimentally determined in this study for Jurkat T cells.‡Experimentally determined in this study for CD4 T cells.§Cai et al. (49).¶Hui and Vale (40).
Fernandes et al. PNAS | July 9, 2019 | vol. 116 | no. 28 | 14005
BIOPH
YSICSAND
COMPU
TATIONALBIOLO
GY
Dow
nloa
ded
by g
uest
on
Nov
embe
r 25
, 202
1

TCR triggering when ligands were absent (P = 50% is reachedin <70 s versus 18 h; Fig. 5C).Importantly, the model was found to robustly discriminate be-
tween ligands of different potency even at low density, a hallmarkof TCR triggering. pMHC sensitivity and discrimination werefound to be preserved for pMHC densities varying >106 fold, for
TCR/pMHC off rates of 1 to 50 s−1, and for contact durationstf = 30 and 120 s (Fig. 5D and SI Appendix, Fig. S8A). Dis-crimination between self and agonist pMHC was optimal forboth short- and long-lived contacts between 50 and 300 nm, andlost for contacts larger than 350 nm radius (Fig. 5E and SI Ap-pendix, Fig. S8B). Accordingly, although sensitivity was higher
Fig. 3. Experimental validation of the model. (A) Fraction of triggered TCRs as a function of time and contact growth rate (tmin = 2 s, D = 0.05 μm2/s, g =0.01 to 10 μm2/s). (B) Time taken to TCR triggering as a function of close-contact growth rate. (C) Comparison of triggering probability for one versus twocontacts or a single contact of double the contact area. (D) Dynamics of close-contact formation [CD45 fluorescence (Gap 8.3 Fab, Alexa Fluor 568), TIRFM](Top) and Ca2+ release (detected as Fluo-4 fluorescence) (Bottom) for cells contacting rCD2-presenting SLBs. (Scale bar, 2 μm.) (Top Right) Color-codedrepresentation of the temporal evolution of contact area over time. (Bottom Right) Temporal evolution of Fluo-4 intensity averaged over entire contact;n > 10 cells from five independent experiments. (E) Trace of a representative contact over time for growth-rate determination. (F) Relationship betweenclose-contact growth rate and the time taken to triggering. (G) Time delay between initial contact of cells with rCD2-presenting SLBs and Ca2+ release forJurkat T cells and cells expressing HA-CD45. (H) Time delay between initial contact of cells with IgG-coated glass and Ca2+ release in the presence of the actindepolymerizing drug cytochalasin D (data shown as mean time of calcium release for three independent experiments with >200 cells per condition; **P =0.01 and ***P <0.001, two-tailed t test, unequal variance assumed; errors are SEM).
14006 | www.pnas.org/cgi/doi/10.1073/pnas.1817255116 Fernandes et al.
Dow
nloa
ded
by g
uest
on
Nov
embe
r 25
, 202
1

for larger contacts, for smaller koff values, and for slower TCRdiffusion (SI Appendix, Figs. S9 and S10), contacts larger than350 nm generated significant levels of ligand-independent receptor
triggering regardless of ligand levels and TCR behavior, producingthe near-complete loss of discrimination (Fig. 5E and SI Appendix,Fig. S8B). The model also predicted that for contacts of 220-nm
Fig. 4. Why the TCR can be triggered in the absence of ligands. (A) Probability that a TCR remains inside a close contact for time, τ, for close contacts ofvarying fixed radius, r0. (B) Probability that a single TCR stays inside a close contact >2 s as a function of final close-contact radius for growing contacts. (C)Total number of TCRs that remain inside the close contact for >2 s, incorporating the estimates shown in A, the density of TCRs in Jurkat T cells, and thedegree of exclusion of the TCR from close contacts for cells interacting with rCD2-presenting SLBs. (D) Total contact area (region of CD45 exclusion) at the timeof calcium release for T cells interacting with rCD2-presenting SLBs (13 cells, 5 independent experiments). Central lines indicate the median; small squaresindicate the mean; boxes show interquartile range; whiskers indicate SD.
Fig. 5. Self/nonself discrimination. (A) Probability distribution of close-contact residence times for TCRs in the presence and absence of agonist and self pMHC, for aclose contact of radius r0 = 220 nm, showing that discrimination of ligands is not dependent on a threshold value for tmin. (B) Probability that at least one TCR will betriggered, i.e., stay in the contact for tmin ≥ 2 s, as a function of contact duration tf in the presence and absence of agonist pMHCwith a low koff (koff = 1 s−1, 30 pMHC/μm2),or a self pMHC with a larger koff present at higher pMHC densities (koff = 50 s−1, 300 pMHC/μm2); r0 = 220 nm. (C) Comparison of the triggering probability in theabsence of pMHC for close contacts of 220 and 440 nm. (D) Triggering probability as a function of pMHC densities and pMHC off rates for a single contact of 220 nmradius with a duration of tf = 120 s. (E) Triggering probability as a function of close contact radius for pMHC with varying off rates for a contact duration of tf = 120 s.(F) Contribution to the overall signal of TCRs that are triggered without binding to pMHC, in the presence of agonist pMHC with varying koff (30 pMHC/μm2).
Fernandes et al. PNAS | July 9, 2019 | vol. 116 | no. 28 | 14007
BIOPH
YSICSAND
COMPU
TATIONALBIOLO
GY
Dow
nloa
ded
by g
uest
on
Nov
embe
r 25
, 202
1
radius, ligand-independent receptor triggering does not contributetoward overall triggering probability for strong agonist pMHC(koff values between 1 and 10 s−1; Fig. 5F). With increasinglyweaker TCR/pMHC interactions (koff = 20 and above), thecontribution of ligand-independent receptor triggering to the overalltriggering probability increased but remained below 50% (Fig. 5F).For contacts with ∼220-nm radius, therefore, binding to pMHCis the main determinant of TCR dwell time > tmin inside closecontacts.KP, defined by its dependence on energy-consuming in-
termediate steps, is often used to explain ligand discriminationby the TCR (13). In some calculations, six intermediate steps areneeded to generate >7,500-fold differences in the levels of TCRtriggering induced by pMHC ligands differing 10-fold in affinity(13). Such large amplification mechanisms are usually only pos-sible, however, at the expense of sensitivity (13, 15). Our calcu-lations, which simulate a single chemical modification (TCRphosphorylation) and do not rely on a threshold for tmin (Fig. 5A),suggest that KP is not required for effective TCR discrimination.A 10-fold difference in affinity produced a ∼1,000-fold differencein TCR triggering for pMHC at densities of 1,000 pMHC/cell(SI Appendix, Fig. S8C), when close-contact size was restricted(SI Appendix, Fig. S8D). Even at very low pMHC densities(100 pMHC/cell), there was a ∼100-fold difference in TCR-triggering probability for ligands differing 10-fold in affinity(SI Appendix, Fig. S8C).Finally, we tested whether the potency of TCR ligands could
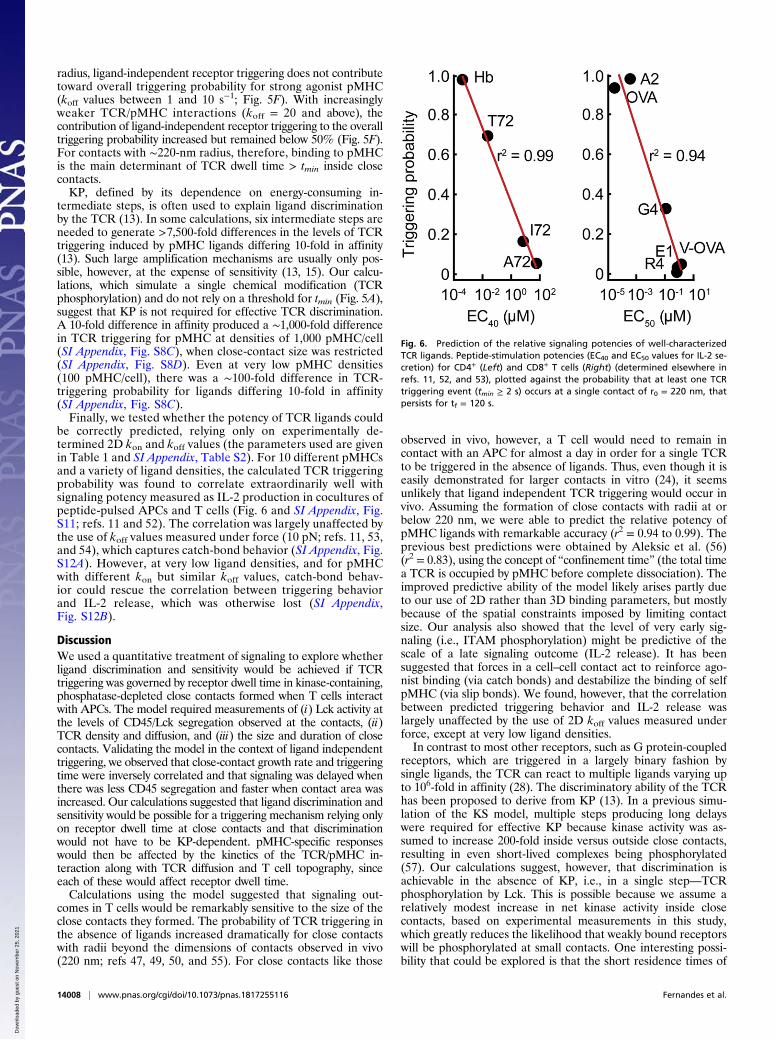
be correctly predicted, relying only on experimentally de-termined 2D kon and koff values (the parameters used are givenin Table 1 and SI Appendix, Table S2). For 10 different pMHCsand a variety of ligand densities, the calculated TCR triggeringprobability was found to correlate extraordinarily well withsignaling potency measured as IL-2 production in cocultures ofpeptide-pulsed APCs and T cells (Fig. 6 and SI Appendix, Fig.S11; refs. 11 and 52). The correlation was largely unaffected bythe use of koff values measured under force (10 pN; refs. 11, 53,and 54), which captures catch-bond behavior (SI Appendix, Fig.S12A). However, at very low ligand densities, and for pMHCwith different kon but similar koff values, catch-bond behav-ior could rescue the correlation between triggering behaviorand IL-2 release, which was otherwise lost (SI Appendix,Fig. S12B).
DiscussionWe used a quantitative treatment of signaling to explore whetherligand discrimination and sensitivity would be achieved if TCRtriggering was governed by receptor dwell time in kinase-containing,phosphatase-depleted close contacts formed when T cells interactwith APCs. The model required measurements of (i) Lck activity atthe levels of CD45/Lck segregation observed at the contacts, (ii)TCR density and diffusion, and (iii) the size and duration of closecontacts. Validating the model in the context of ligand independenttriggering, we observed that close-contact growth rate and triggeringtime were inversely correlated and that signaling was delayed whenthere was less CD45 segregation and faster when contact area wasincreased. Our calculations suggested that ligand discrimination andsensitivity would be possible for a triggering mechanism relying onlyon receptor dwell time at close contacts and that discriminationwould not have to be KP-dependent. pMHC-specific responseswould then be affected by the kinetics of the TCR/pMHC in-teraction along with TCR diffusion and T cell topography, sinceeach of these would affect receptor dwell time.Calculations using the model suggested that signaling out-
comes in T cells would be remarkably sensitive to the size of theclose contacts they formed. The probability of TCR triggering inthe absence of ligands increased dramatically for close contactswith radii beyond the dimensions of contacts observed in vivo(220 nm; refs 47, 49, 50, and 55). For close contacts like those
observed in vivo, however, a T cell would need to remain incontact with an APC for almost a day in order for a single TCRto be triggered in the absence of ligands. Thus, even though it iseasily demonstrated for larger contacts in vitro (24), it seemsunlikely that ligand independent TCR triggering would occur invivo. Assuming the formation of close contacts with radii at orbelow 220 nm, we were able to predict the relative potency ofpMHC ligands with remarkable accuracy (r2 = 0.94 to 0.99). Theprevious best predictions were obtained by Aleksic et al. (56)(r2 = 0.83), using the concept of “confinement time” (the total timea TCR is occupied by pMHC before complete dissociation). Theimproved predictive ability of the model likely arises partly dueto our use of 2D rather than 3D binding parameters, but mostlybecause of the spatial constraints imposed by limiting contactsize. Our analysis also showed that the level of very early sig-naling (i.e., ITAM phosphorylation) might be predictive of thescale of a late signaling outcome (IL-2 release). It has beensuggested that forces in a cell–cell contact act to reinforce ago-nist binding (via catch bonds) and destabilize the binding of selfpMHC (via slip bonds). We found, however, that the correlationbetween predicted triggering behavior and IL-2 release waslargely unaffected by the use of 2D koff values measured underforce, except at very low ligand densities.In contrast to most other receptors, such as G protein-coupled
receptors, which are triggered in a largely binary fashion bysingle ligands, the TCR can react to multiple ligands varying upto 106-fold in affinity (28). The discriminatory ability of the TCRhas been proposed to derive from KP (13). In a previous simu-lation of the KS model, multiple steps producing long delayswere required for effective KP because kinase activity was as-sumed to increase 200-fold inside versus outside close contacts,resulting in even short-lived complexes being phosphorylated(57). Our calculations suggest, however, that discrimination isachievable in the absence of KP, i.e., in a single step—TCRphosphorylation by Lck. This is possible because we assume arelatively modest increase in net kinase activity inside closecontacts, based on experimental measurements in this study,which greatly reduces the likelihood that weakly bound receptorswill be phosphorylated at small contacts. One interesting possi-bility that could be explored is that the short residence times of
Fig. 6. Prediction of the relative signaling potencies of well-characterizedTCR ligands. Peptide-stimulation potencies (EC40 and EC50 values for IL-2 se-cretion) for CD4+ (Left) and CD8+ T cells (Right) (determined elsewhere inrefs. 11, 52, and 53), plotted against the probability that at least one TCRtriggering event (tmin ≥ 2 s) occurs at a single contact of r0 = 220 nm, thatpersists for tf = 120 s.
14008 | www.pnas.org/cgi/doi/10.1073/pnas.1817255116 Fernandes et al.
Dow
nloa
ded
by g
uest
on
Nov
embe
r 25
, 202
1

self pMHC/TCR complexes and free TCRs at small contacts alsomake cells more sensitive to changes in dwell time resulting fromagonist pMHC/TCR complex formation. The absence of anyrequirement for KP explains, at least in part, T cell sensitivity,with our calculations suggesting that ∼200 agonist pMHC/cellwould give half-maximal responses.Our findings have several important implications. First, the
size of close contacts committing T cells to synapse formationmay have to be tightly controlled to avoid nonspecific activation.Defects in processes that constrain close-contact size couldpredispose to autoimmunity by increasing ligand-independentreceptor signaling. Second, we can explain the extent to whichTCR triggering is enhanced by pMHC binding, without thetriggering mechanism having to be strictly ligand-dependent. ForTCRs interacting with typical ligands at small contacts, we cal-culated that agonist-dependent signaling is favored as much as12,000-fold over ligand-independent signaling. Third, some de-gree of signaling in the absence of ligand might neverthelessexplain both TCR polarization and partial TCR phosphorylation(58, 59). We estimated that ∼50% of TCRs remain >0.5 s insideclose contacts of ∼220-nm radius, yielding >1 pTyr/contact. Thismight not initiate downstream signaling but could generate thepMHC-independent, low-level “tonic” TCR triggering observedin vivo (58). Fourth, for close contacts increasing in radius beyond220 nm, perhaps following an initial round of ligand-dependentsignaling, ligand-independent receptor triggering might reinforceor amplify the initial response, enhancing sensitivity. Lastly, theprinciples established here could be extended to other ITAM-based receptors that are also sensitive to size-based changes inthe kinase/CD45 ratio, such as Fc receptors (60–62), or used tocalculate the binding “sweet spot” for engineered TCRs (4) orreceptor mimics (61).
In conclusion, our work suggests that, rather than KP, topo-graphically constrained T cell contact formation allows, and mayeven be essential for, ligand discrimination by T cells. The model’sability to predict the relative signaling potencies of known agonistsand nonagonists suggests that it captures the essential features ofthe TCR triggering mechanism. However, how do T cells ensurethat contact size is constrained? So-called T cell “microvilli” arethe obvious candidates for achieving this, although further ex-periments will be required to confirm whether this is true or not.Microvillus-based contacts have radii of 220 ± 20 nm (50) andpersist for 1 to 5 min (55, 63, 64). Individual microvillar contactslast >6 s in the absence of cognate antigen, enough time for ef-ficient discriminatory signaling according to our calculations.T cells may thus interrogate their targets using microvilli to exploittheir unique topographic properties. Most importantly, ourtreatment of TCR triggering provides a predictive framework forunderstanding why it is selective, fast, and sensitive.
Materials and MethodsA detailed description of the mathematical model of TCR triggering and theexperimental procedures for single-particle tracking, superresolution imag-ing of CD45, quantification of calcium release and close-contact growth, andadditional control experiments are provided in SI Appendix.
ACKNOWLEDGMENTS. This work was funded by The Wellcome Trust, the UKMedical Research Council, the UK Biotechnology and Biological SciencesResearch Council, and Cancer Research UK. We thank the Wolfson ImagingCentre, University of Oxford, for access to their microscope facility. We thankThe Wellcome Trust for the Sir Henry Wellcome Fellowship of R.A.F.(WT101609MA), the Royal Society for the University Research Fellowship ofS.F.L. (UF120277), an award from the Division of Mathematical Sciences at theNational Science Foundation to A.E.L. (NSF DMS 1815216), and acknowledge aGlaxoSmithKline Professorship (D.K.). We are also grateful to Doug Tischer,University of California, San Francisco, and Muaz Rushdi, Georgia Institute ofTechnology, for their critical comments on the manuscript.
1. J. E. Smith-Garvin, G. A. Koretzky, M. S. Jordan, T cell activation. Annu. Rev. Immunol.27, 591–619 (2009).
2. G. P. Morris, P. M. Allen, How the TCR balances sensitivity and specificity for therecognition of self and pathogens. Nat. Immunol. 13, 121–128 (2012).
3. H. S. Wong, R. N. Germain, Robust control of the adaptive immune system. Semin.Immunol. 36, 17–27 (2018).
4. W. A. Lim, C. H. June, The principles of engineering immune cells to treat cancer. Cell168, 724–740 (2017).
5. M. H. Kershaw, J. A. Westwood, P. K. Darcy, Gene-engineered T cells for cancertherapy. Nat. Rev. Cancer 13, 525–541 (2013).
6. B. J. Cameron et al., Identification of a Titin-derived HLA-A1-presented peptide as across-reactive target for engineered MAGE A3-directed T cells. Sci. Transl. Med. 5,197ra103 (2013).
7. G. P. Linette et al., Cardiovascular toxicity and titin cross-reactivity of affinity-enhanced T cells in myeloma and melanoma. Blood 122, 863–871 (2013).
8. R. A. Morgan et al., Cancer regression and neurological toxicity following anti-MAGE-A3 TCR gene therapy. J. Immunother. 36, 133–151 (2013).
9. J. Huang et al., A single peptide-major histocompatibility complex ligand triggersdigital cytokine secretion in CD4(+) T cells. Immunity 39, 846–857 (2013).
10. D. J. Irvine, M. A. Purbhoo, M. Krogsgaard, M. M. Davis, Direct observation of ligandrecognition by T cells. Nature 419, 845–849 (2002).
11. J. Huang et al., The kinetics of two-dimensional TCR and pMHC interactions de-termine T-cell responsiveness. Nature 464, 932–936 (2010).
12. M. A. Purbhoo, D. J. Irvine, J. B. Huppa, M. M. Davis, T cell killing does not require theformation of a stable mature immunological synapse. Nat. Immunol. 5, 524–530 (2004).
13. T. W. McKeithan, Kinetic proofreading in T-cell receptor signal transduction. Proc.Natl. Acad. Sci. U.S.A. 92, 5042–5046 (1995).
14. J. J. Hopfield, Kinetic proofreading: A new mechanism for reducing errors in bio-synthetic processes requiring high specificity. Proc. Natl. Acad. Sci. U.S.A. 71, 4135–4139 (1974).
15. M. Lever, P. K. Maini, P. A. van der Merwe, O. Dushek, Phenotypic models of T cellactivation. Nat. Rev. Immunol. 14, 619–629 (2014).
16. A. W. Goldrath, M. J. Bevan, Selecting and maintaining a diverse T-cell repertoire.Nature 402, 255–262 (1999).
17. J. Sloan-Lancaster, P. M. Allen, Altered peptide ligand-induced partial T cell activa-tion: Molecular mechanisms and role in T cell biology. Annu. Rev. Immunol. 14, 1–27(1996).
18. M. A. Purbhoo et al., Agonist/endogenous peptide–MHC heterodimers drive T cellactivation and sensitivity. Nat. Immunol. 11, 90–96 (2013).
19. S. Valitutti, S. Müller, M. Cella, E. Padovan, A. Lanzavecchia, Serial triggering of manyT-cell receptors by a few peptide-MHC complexes. Nature 375, 148–151 (1995).
20. C. Wofsy, D. Coombs, B. Goldstein, Calculations show substantial serial engagementof T cell receptors. Biophys. J. 80, 606–612 (2001).
21. C. C. Govern, M. K. Paczosa, A. K. Chakraborty, E. S. Huseby, Fast on-rates allow shortdwell time ligands to activate T cells. Proc. Natl. Acad. Sci. U.S.A. 107, 8724–8729(2010).
22. L. V. Sibener et al., Isolation of a structural mechanism for uncoupling T cell receptorsignaling from peptide-MHC binding. Cell 174, 672–687.e27 (2018).
23. Y. Feng et al., Mechanosensing drives acuity of αβ T-cell recognition. Proc. Natl. Acad.Sci. U.S.A. 114, E8204–E8213 (2017).
24. V. T. Chang et al., Initiation of T cell signaling by CD45 segregation at ‘close contacts’.Nat. Immunol. 17, 574–582 (2016).
25. O. Feinerman, R. N. Germain, G. Altan-Bonnet, Quantitative challenges in un-derstanding ligand discrimination by alphabeta T cells. Mol. Immunol. 45, 619–631(2008).
26. G. Altan-Bonnet, R. N. Germain, Modeling T cell antigen discrimination based onfeedback control of digital ERK responses. PLoS Biol. 3, e356 (2005).
27. P. François, G. Voisinne, E. D. Siggia, G. Altan-Bonnet, M. Vergassola, Phenotypicmodel for early T-cell activation displaying sensitivity, specificity, and antagonism.Proc. Natl. Acad. Sci. U.S.A. 110, E888–E897 (2013).
28. M. Lever et al., Architecture of a minimal signaling pathway explains the T-cell re-sponse to a 1 million-fold variation in antigen affinity and dose. Proc. Natl. Acad. Sci.U.S.A. 113, E6630–E6638 (2016).
29. S. J. Davis, P. A. van der Merwe, The kinetic-segregation model: TCR triggering andbeyond. Nat. Immunol. 7, 803–809 (2006).
30. G. P. O’Donoghue, R. M. Pielak, A. A. Smoligovets, J. J. Lin, J. T. Groves, Direct singlemolecule measurement of TCR triggering by agonist pMHC in living primary T cells.eLife 2, e00778 (2013).
31. R. M. Pielak et al., Early T cell receptor signals globally modulate ligand:receptoraffinities during antigen discrimination. Proc. Natl. Acad. Sci. U.S.A. 114, 12190–12195(2017).
32. V. Junghans, A. M. Santos, Y. Lui, S. J. Davis, P. Jönsson, Dimensions and interactionsof large T-cell surface proteins. Front. Immunol. 9, 2215 (2018).
33. J. M. Alakoskela et al., Mechanisms for size-dependent protein segregation at im-mune synapses assessed with molecular rulers. Biophys. J. 100, 2865–2874 (2011).
34. E. M. Schmid et al., Size-dependent protein segregation at membrane interfaces. Nat.Phys. 12, 704–711 (2016).
35. O. Feinerman, J. Veiga, J. R. Dorfman, R. N. Germain, G. Altan-Bonnet, Variability androbustness in T cell activation from regulated heterogeneity in protein levels. Science321, 1081–1084 (2008).
36. M. Huse et al., Spatial and temporal dynamics of T cell receptor signaling with aphotoactivatable agonist. Immunity 27, 76–88 (2007).
Fernandes et al. PNAS | July 9, 2019 | vol. 116 | no. 28 | 14009
BIOPH
YSICSAND
COMPU
TATIONALBIOLO
GY
Dow
nloa
ded
by g
uest
on
Nov
embe
r 25
, 202
1

37. E. Palmer, D. Naeher, Affinity threshold for thymic selection through a T-cell receptor-co-receptor zipper. Nat. Rev. Immunol. 9, 207–213 (2009).
38. C. B. Williams, D. L. Engle, G. J. Kersh, J. Michael White, P. M. Allen, A kineticthreshold between negative and positive selection based on the longevity of theT cell receptor-ligand complex. J. Exp. Med. 189, 1531–1544 (1999).
39. S. Qi, M. Krogsgaard, M. M. Davis, A. K. Chakraborty, Molecular flexibility can influ-ence the stimulatory ability of receptor-ligand interactions at cell-cell junctions. Proc.Natl. Acad. Sci. U.S.A. 103, 4416–4421 (2006).
40. E. Hui, R. D. Vale, In vitro membrane reconstitution of the T-cell receptor proximalsignaling network. Nat. Struct. Mol. Biol. 21, 133–142 (2014).
41. Y. Razvag, Y. Neve-Oz, J. Sajman, M. Reches, E. Sherman, Nanoscale kinetic segre-gation of TCR and CD45 in engaged microvilli facilitates early T cell activation. Nat.Commun. 9, 732 (2018).
42. P. A. van der Merwe et al., The NH2-terminal domain of rat CD2 binds rat CD48 with alow affinity and binding does not require glycosylation of CD2. Eur. J. Immunol. 23,1373–1377 (1993).
43. A. Ponjavic et al., Single-molecule light-sheet imaging of suspended T cells. Biophys. J.114, 2200–2211 (2018).
44. J. R. James et al., Single-molecule level analysis of the subunit composition of theT cell receptor on live T cells. Proc. Natl. Acad. Sci. U.S.A. 104, 17662–17667 (2007).
45. J. Sloan-Lancaster et al., ZAP-70 association with T cell receptor ζ (TCRzeta): Fluo-rescence imaging of dynamic changes upon cellular stimulation. J. Cell Biol. 143, 613–624 (1998).
46. A. R. Carr et al., Three-Dimensional super-resolution in eukaryotic cells using thedouble-helix point spread function. Biophys. J. 112, 1444–1454 (2017).
47. Y. Jung et al., Three-dimensional localization of T-cell receptors in relation to mi-crovilli using a combination of superresolution microscopies. Proc. Natl. Acad. Sci.U.S.A. 113, E5916–E5924 (2016).
48. U. H. von Andrian, S. R. Hasslen, R. D. Nelson, S. L. Erlandsen, E. C. Butcher, A centralrole for microvillous receptor presentation in leukocyte adhesion under flow. Cell 82,989–999 (1995).
49. E. Cai et al., Visualizing dynamic microvillar search and stabilization during liganddetection by T cells. Science 356, eaal3118 (2017).
50. P. T. Sage et al., Antigen recognition is facilitated by invadosome-like protrusionsformed by memory/effector T cells. J. Immunol. 188, 3686–3699 (2012).
51. J. B. Huppa et al., TCR-peptide-MHC interactions in situ show accelerated kinetics andincreased affinity. Nature 463, 963–967 (2010).
52. G. J. Kersh, P. M. Allen, Structural basis for T cell recognition of altered peptide li-gands: A single T cell receptor can productively recognize a large continuum of re-lated ligands. J. Exp. Med. 184, 1259–1268 (1996).
53. J. Hong et al., Force-regulated in situ TCR-peptide-bound MHC class II kinetics de-termine functions of CD4+ T cells. J. Immunol. 195, 3557–3564 (2015).
54. B. Liu, W. Chen, B. D. Evavold, C. Zhu, Accumulation of dynamic catch bonds betweenTCR and agonist peptide-MHC triggers T cell signaling. Cell 157, 357–368 (2014).
55. S. Stoll, J. Delon, T. M. Brotz, R. N. Germain, Dynamic imaging of T cell-dendritic cellinteractions in lymph nodes. Science 296, 1873–1876 (2002).
56. M. Aleksic et al., Dependence of T cell antigen recognition on T cell receptor-peptideMHC confinement time. Immunity 32, 163–174 (2010).
57. N. J. Burroughs, Z. Lazic, P. A. van der Merwe, Ligand detection and discrimination byspatial relocalization: A kinase-phosphatase segregation model of TCR activation.Biophys. J. 91, 1619–1629 (2006).
58. I. Stefanová et al., TCR ligand discrimination is enforced by competing ERK positiveand SHP-1 negative feedback pathways. Nat. Immunol. 4, 248–254 (2003).
59. N. S. van Oers, N. Killeen, A. Weiss, Lck regulates the tyrosine phosphorylation of theT cell receptor subunits and ZAP-70 in murine thymocytes. J. Exp. Med. 183, 1053–1062 (1996).
60. M. H. Bakalar et al., Size-dependent segregation controls macrophage phagocytosisof antibody-opsonized targets. Cell 174, 131–142.e13 (2018).
61. R. Kojima, L. Scheller, M. Fussenegger, Nonimmune cells equipped with T-cell-receptor-like signaling for cancer cell ablation. Nat. Chem. Biol. 14, 42–49 (2018).
62. J. H. Felce et al., CD45 exclusion– and cross-linking–based receptor signaling togetherbroaden FceRI reactivity. Sci. Signal. 11, eaat0756 (2018).
63. A. T. T. Ritter et al., Actin depletion initiates events leading to granule secretion at theimmunological synapse. Immunity 42, 864–876 (2015).
64. J. Deguine, B. Breart, F. Lemaître, J. P. Di Santo, P. Bousso, Intravital imaging revealsdistinct dynamics for natural killer and CD8(+) T cells during tumor regression. Im-munity 33, 632–644 (2010).
65. D. L. Weaver, Diffusion-mediated localization on membrane surfaces. Biophys. J. 41,81–86 (1983).
14010 | www.pnas.org/cgi/doi/10.1073/pnas.1817255116 Fernandes et al.
Dow
nloa
ded
by g
uest
on
Nov
embe
r 25
, 202
1