a cathode-ray oscillograph for periodic …€¦ · · 2014-01-14alia, upon the. d.c. adjustment...
TRANSCRIPT
R 140, Philips Res. Rep. 5, 205-240, 1950
A CATHODE-RAY OSCILLOGRAPH FOR PERIODICPHENOMENA OF HIGH FREQUENCIES
by J. M. L. JANSSEN*)621.317.755: 621.3.029.5/.6
SummaryAn oscillograph is described for periodic signals of high frequency,working according to a scanning principle. By mixing the high-frequency signalwith phase-modulated pulses a faithfullow-frequencyimage is obtained, The band width and the maximum scanning speedof the oscillograph are investigated as functions of the pulse frequencyand pulse width. Further, the synchronization circuit, the mixercircuit and the pulse generator are described.
RésuméDescription d'un oscillographe pour signaux périodiques de hautefrëquence fonctionnant suivant un principe d'exploration. Le mélangedu signal haute frêquence et d'impulsions modulées en phase assureune image basse frëquence très fidèle. L'auteur ëtudie la largeur debande et la vitesse d'exploration maximum de I'oscillographe enfonction de la frëquence des impulsions et de la largeur des impul-sions; il dëcrit en outre le circuit de synchrçnisation, le circuitchangeur de fréquence et Ie générateur d'impulsions ..
ZusammenfassungDer Artikel beschreibt einen Oszillographen für periodische Signalehoher Frequenz, der nach einem Abtastprinzip arbeitet. Durch Mi-schung des HF-Signales mit phasenmodulierten Impulsen erhältman ein getreues NF-Bild, Die Bandbreite und die maximale Abtast-geschwindigkeit des Oszillographen werden als Funktionen derImpulsfrequenz und der Impulsbreite untersucht. Weiter erfolgteine Beschreibung des Synchrouisierkreises, des Mischkreises unddes Impulsgenerators.
CONTENTSSummaryIntroduction
1. Principle of the method
1.1 Stroboscopic scanning1.2 Stroboscopic scanning considered as conversion1.3 Stroboscopic scanning with periodic phase modulation; microscopie
scanning1.4 Elementary block diagram
2. Limits and error~ of. the method2.1 Finite pulse width and shape of the pulse2.2 Scanning speed. and hiatuses
*) At present with KoninklijkejShell Laboratorium, Delïr.

206 J, M, L, JANSSEN
2.3 Adapting the scanning speed to the pulse width2.4 Scanning modulated signals2.5 Non-linear distortion
3. Synchronization3.1 The synchronization circuit
,3.2 Stability of the synchronization considered qualitatively3.3 Calculation of stability
4. 'The mixer circuit4.1 General considerations4.2 The pentode mixer circuit
5. The pulse generator5.1 Qualitative considerations5.2 Calculating the shape of the pulse5.3 Generating the curre~t surge
6. Construction of ari experimental apparatus6.1 The block diagram6.2 Some details of the system6.3 Practical data6.4 Conclusion
Introduction
It is known that various difficulties are encountered when observingsmall signals of high frequency on the screen of a cathode-ray tube.In the first place there are the difficulties of amplification. The oscillo-
graphs so far. available on the market have amplifiers that can be usedfor frequencies up to at most 10 Mc/s. It is possible to amplify muchwider bands (distributed amplification 1)), but only hy employing verymany more valves.In the second place trouble is experienced with the timebase voltage.
The practical realisation of sawtooth voltages with a frequency greaterthan 1 Mc/s is hardly possible.
During the war Philips Laboratories developed a scanning method bymeans of which it is possible to extend the frequency range to about 100Mc/s, though only for periodic and thus not for non-recurring phenomena.This method will he further explained below and an experimental oscil-Iograph ....vill be described, with which the limit of 100 Mc/s has not, it istrue, been reached, but not for reasons inherent in the method. The objectof the experimental apparatus was' only to demonstrate the practicabilityof the method and to verify the correctness of its theoretical foundation.This object has been attained, and the exploitation of all the possibilitiesis further a question of the application of known technical means.

CATHODE·RAY OSCILLOGRAPH
1. Principle' of the method
1.1 Stroboscopic scanning
It is kno~n that the movement of rapidly rotating or vibrating partsof machinery can be observed visually with the aid of a stroboscope. Eachflash of light gives a snapshot of the movement, and when the flashes aresynchronized with that movement the snapshot is always the same, andone sees the particular part of the machine as if it were stationary in acertain phase of the motion.When the phase of the flashes changes with respect to the movement
then a different instantaneous picture is seen every time. ff that phase ischanging uniformly with tfme; or in other words if there is a small differencein frequency between the motion and the flashes, a faithfully delayedmotion is seen.
In analogy with this, an electric signal can be stroboscopically scannedin a mixer circuit with the aid of electric pulses. In fig. 1 a periodic signal isapplied to the first grid gl of a mixer valve. This signal is assumed to besmall. A periodic pulse is applied to the third grid ga' When there is nosignalon gl an anode current flows which contains a pulse-shaped part.The direct-current component of the total current, la, depends, interalia, upon the. d.c. adjustment Egl of the grid gl' Thus
Ia = la(Egl) • (1)
62519
Fig. 1 Heptode mixer valve for mixing with periodic pulses.
A small variation eg1 of the grid voltage gives rise to a proportional anode-current variation ia:
sï;So=--'
ÖEgl
Sois therefore the slope ofthe static (la. Eg1) curve when pulses are appliedto the third grid.
where
207
(2)
(3)

208 J. M. L. Ji\NSSEN
Let us suppose that g3 has such a large negative bias that only anodecurrent is flowing when there are pulses on that grid. Equations (2) and(3) will then also apply when gl is fed with an alternating voltage syn-chronized with the pulses; egl is then the instantaneous value of the alternat-ing voltage at the moment that the pulse is on g3' and thus ia is an instan-taneous picture of the signalon gl' The moment selected is determinedby the phase of the pulses with respect to this signal, which phase can bevaried. If this phase is varied uniformly, thus with a constant frequencydifference between pulses and signal, then the variation of the anode directcurrent is a: faithfullow-frequency image of the signal. If the pulses havea somewhat lower frequency than', the sïgnal, then successive pulses comethrough at a somewhat later phase of the signal, and the direction oftime is correct. If the pulses have a somewhat higher frequency than thesignal then the direction of time is reversed. .
1.2 Stroboscopic scanning considered as conversion
To' get a good idea of the various frequencies occurring in the anode cur-rent it is well to consider the phenomena not only as functions of time,as in section 1.1, but also as functions of frequency.
For the present the pulses on g3 will be assumed as being ideal, i.e. ofnegligible duration of time, but with a non-zero surface area (delta function).
The mutual conductance S of the first grid will be a similar pulse func-tion of time as the voltage on g3 and can be represented by the followingseries:
0)
S(t) = So+ 2 So ~ cos k p, t ,k=l
(4)
where p, is the frequency of the pulses.So is the mean value of the mutual-conductance pulses. It determines
the amplification for d.c. voltage variations on gl and is thus the sameSo as occurs in eq. (2). All harmonics have the same amplitude, equal totwice this mean value.
Fig. 2 shows the frequency spectrum of the mutual-conductance pulses.By way of an example, the two lowest harmonics of a signal are indicatedby dashed lines. From the illustration it appears that when mixing isapplied two low differential frequencies are obtained which are againmutually harmonic. Since the harmonics of the mutual conductance areall of the same size, also the conversion conductance for the signal harmonicsis the same. This is confirmed by a simple, calculation, which showsat the same time that the mutual phase relations remain the same. .
Let the signal be represented byee
v(t) = ~ "i cos (l'Yjt + f{JZ) •1=1
, (5)

CATHODE-RAY OSCILLOGRAPH'
For the anode-current variations we have
ia = s(t) v(t) .
In the case of our example th~s yields, inter alia, the following curr~ntcomponents:
SO V1 cos ~('I]-2 ",)t + qJ1f, derived from VI cos ('I]t+ qJ1)'
So v2 cos ~2('I]-2",)t + qJ2~' derived from V2 cos (2'1]t+ qJ2)' and so on. (7)
From this and fig. 2 it is seen that it is indeed possible to obtain faithfulreproduetion 'if one is also in a position to separate the low differentialfrequencies in the left-hand column from the other sum and differentialfrequencies.
I .!IJ_.I II
I 11 1I II IIII. II
0 f' 21' 'I. '3f' ~ 2~ anp mz (2n+t)p (I)
62520
Fig. 2 Frequency spectrum pertaining to fig. 1; fl- is the frequency of the periodic pulse,1] the frequency of the signalon gl'
Suppose that n is the order of .the highest harmonic occurring in thesignal. This is flanked by the pulse harmonics 2nf-t and (2n + 1) '" (seefig. 2). The differential frequency f1 with the former is the highest desiredfrequency, and the differential frequency f2 with the latter is the lowestundesired frequency. Separation of the desired and undesired frequencieswith the aid of a low-pass filter in the anode circuit is possible only if ftis smaller thah f2; so fi must be smaller than ~p, i.e. half the pulsefrequency. Consequently the cut-off frequency of the low-pass filtermust not be higher than ~p.What, it may be asked, does this imply in connection with the strobo-
scopic method? The answer is that the requirement that the highest dif-ferential frequency must be lower than half the .pulse frequency sets alimit to the rateof scanning, since the highest desired differential frequencyarises from the ~canning of the highest signal harmonic. This will be goneinto farther in section 2.2.
1.3 Stroboscopic scanning with periodic phase modulation;' microscopiescanning
In principle it is quite possible to build up an oscillograph in the mannerindicated in the foregoing, but in practice there is the difficulty of thesynchronization. The pulse frequency has to be so adjusted that the rate
209
(6)

210 J". M. L. J"ANSSEN
-of scanning is not too high: the desired low-frequency signals have to bewithin the pass-band range of the low-pass filter. This adjustment shouldbe possible without knowing what the frequency of the signal is, and,moreover, it has to answer certain requirements of stability. We have notyet succeeded in finding a simple but fool-proof solution of this problem.
The scanning at a .uniform rate, however, need not be continuous.The .phase difference between the scanning pulses and the signal mayalso be a sawtooth function of time. From the beginning of the cyclethis phase difference then increases at a uniform rate, jumping back tothe' initial value again at the end of the cycle.
Sinusoidal phase modulation of the pulses is still simpler than this. It istrue that as a function of time there is then no faithful reproduetion ofthe signal, but that is not necessary. What is required is that the pictureon the screen should he a faithful .representation of the signal. If thehorizontal deflection voltage is proportional to the instantaneous phasedeviation of the pulse then the image is always correct. With sawtoothphase modulation the horizontal 'deflectio~ voltage must also be sawtoothin shape; with sinusoidal modulation it has to be sinusoidal and in phasewith the modulation.
The amplitude of the phase modulation may be chosen at "will. A largeamplitude means that a large part of the signal is scanned, for instancea certain number of cycles, whilst a small amplitude means that a smallpart of the signal is scanned, for instance a small part of a cycle. Thus itis possible for the signal to be observed microscopically. The small partof the cycle to be examined can likewise he chosen at will by adjusting therest phase of the pulse with respect to the signal.. A further advantage of sinusoidal phase modulation lies in the factthat the oscillograph can quite easily be used in combination with anelectronic relay. During one half of the cycle of the sine 3: signal A canbe scanned, and during the other half a signal B. ·TJle electronic relayworks synchronously with the time-base voltage. The most suitableswitching moments are the sine peaks. In the first place these lie at theedges of the picture, so that there is the minimum disturbance of thelatter, whilst in the' second place the writing speed in the horizontaldirection is there the lowest, so that no high demands have to be madeupon the switching speed. . ';,
1.4 Elementary block diagram
Fig. 3 is the block diagram of this oscillograph in its most elementaryform. It only remains to explain how the phase-modulated pulses can beobtained.A sinusoidal-voltagé ,oscillator is synchronized by the signalor a voltage

CATHODE-RAY OSCILLOGRAP.H
that is synchronous with 'the signal. How this is done will he explainedin. section 3. This sinusoidal voltage is phase modulated' and the pulsegenerator is synchronized "with that phase-modulated signal.
Fig. 3 Elementary block diagram of a scanning oscillograph,
2. Limits and errors of the method
2.1 Finite pulse width and shape. l!f the pulse
If the pulse is not ideal then the harmonics will not all have the sameamplitude and the calculation in section 1.2 does not hold. Considering 'thephenomena as functions of time, it is clear that a pulse of finite width.does not produce an instantaneous picture hut one that is an average fOJ:the duration of the pulse.If the mutual-conductance pulse is rectangular in shape then in some I
simple cases the consequences are easy to foresee. In the case of fig. 4ac'
v(t) will not contrihute anything to the output signalof the mixer stage.This is generally the case when a whole number of waves .v(t) "fit"exactly into the pulse width.
In the case of fig. 4h a rectangular v(t) is represented as a trapezium,as indicated hy the dashed lines. The widening at the hase is equal to thewidth of the pulse. Also when the signal is pulse-shaped (fig. 4c) hut nar-rower than the mutual-conductance pulse a trapezium is formed, hutsmaller in amplitude than that in the case of fig..4h.
From these special cases the general conclusion may he drawn thatowing to the finite width of the pulse fine details are lost, heing spreadout and smaller in amplitude.
211

212 J. M. L. JANSSEN
Thinking in terms of frequency instead of functions of time, one findsthat the frequency characteristic falls off as soon as the period of vibrationbecomes of the order of the pulse width.
n~.,("-tf-rMP-. a
Fig. 4 The scanning of somesimple forms of voltage with arectangular pulse. The dashed v-l, blines indicate the results. ___ij L
--L-I:~'\-t c
62522'
The effect of the shape and width of the pulse can also be quantitativelyinvestigated in a very simple way. If a(t) represents a single mutual-conductance pulse then the accompanying anode-current variation is
i(t) = a(t) v(t) . (8)
The charge corresponding to this is., ee
q = J i(t) dt = J a(t) v(t) dt . (9)-<0
The integral has to be taken for the time of the pulse, but as we areconsidering here only a single pulse the integration can be extended from-00 to 00. Formula (9) can he interpreted in such a way that q is propor-tional to a mean value of v(t) over the pulse width, each value of v(t) being.given a weight proportional to the value of the mutual conductance atthat moment. Substituting .
v(t) = Veiwt, (10)
(11) .we getee
s= VJa(t)eiwtdt . VT(-w),
'whereco
T(w) = J O'(t) e-iwt dt. (12)
Equation (12) is a Fourier integral in complex form. T(w) is the fre-quency spectrum of the pulse; T(O) is the surface area of the pulse.

CATHODE-RAY OSCILLOGRAPH
In eq. (11), T(-(J)) can he interpreted as a transmission.factor. For an idealpulse T(-w) is a constant equal to the surface area of the pulse: intro-ducing for a(t) in eq. (12) a pincette function ~(t) (ideal pulse at the timet = 0 with a surface area equal to unity), we get
+= +<0T(w) = J ~(t) ejW! dt = f ~(t) dt = 1 .
Mixing with pulses ofthe shape a(t) would therefore yield the same resultas mixing with ideal pulses of the same surface area T(O) if in the lattercase the signal were applied to the mixing stage via a filter with transmis-sion factor T(-w)fT(O). Consequently with this oscillograph. the frequencyspectrum of the pulse has to answer the same requirements as the frequencycharacteristic of the amplifier in a normal oscillograph, as regards both am-plitude and phase.
The frequency characteristics of some forms of pulses are given in fig. 5.
fI Bel(w) fil- ~~~" Ó
7l'b,~ ~ m 1
08 1\ rs~ ........ "5E F\E 'K - --- Po D
OS i\. }. )('1\. w.g-M~ /\B. .\. ~rj s: h. 2b -~-
I I': 'FV ~ ~ JO"
0-1
,ay .... - .- -i-- - -,..
""1' _- ......... 1
J I....... ~ ..... 10-2 I I
tT
10 _!!wh 12 41t62523
Fig. 5 Frequency spectrum of some pulses. The area of all pulses is b, the height 1; b istherefore also the average pulse width. For the symmetrical pulses the phase angle for allfrequencies is zero, or, with some other choice of the zero point of the time, directly propor-tional to the frequency. Since the frequency spectrum of the pulse form D is almost identicalwith that of the pulse form C, for the former only a few points have been plotted.
5 8 92 621t 7o 3 4
To understand the relation between these considerations and those insection 1.2 it is tohe borne in mind that the value of the pulse differs fromzero in only a sho~t period of time. Therefore in eq. (12) there is no nèedto integrate from - 00 to 00, and one can also write
:./2
T(w) = I a(t) e-jW! dt,-,,/2
213
-(13)
(14)

214 'J, M. L. JANSSEN
where T is the period of the pulses. Thus it is assumed that here scanningtakes place at a uniform speed. With e.q. (14.),except for a constant factorthe Fourier coefficients are calculated of the Fourier series for the periodic-ally repeated pulse s(t), by introducing for t» the discrete values k(2nfT)(k is a whole number). A single pulse gives 'a continuous spectrum, periodicalrepetition gives a, line spectrum. From (14) it follows that both thesehave the same: shape. The continuous spectrum.' is the "envelope" ofthe line spectrum.'; The lines are harmonics of the pulse frequency. In the transmissionfactor T(-w), however, w is a signal frequency. This disagreement isdue to the fact that in this section it is tacitly assumed that the picture inthe output circuit of the mixer valve depends only on the charge flowing tothe anode per scanning pulse and not on the shape of the anode-currentpulse. Because the harmonics of the pulse and of the signal are very closeto each other, the disagreement mentioned is of no practical consequence.
2.2 Scanning speed and hiatuses
In section 1.2 it has already been shown that when scanning is done ata uniform speed the difference between the highest signal harmonic andthe. corresponding pulse harmonic must be less than half the pulse fre-quency.If n is the order of the respective signal harmonic, p the frequency of
the low-frequency signal, fL the pulse frequency, then' we must have np
< tfL, orfL->2n.p
(15)
This equationis to be interpreted in the following way. fLip is the numberof pulses per cycle of the low-frequency signal. This must be greaterthan 2n, the number of constants of th~ Fourier series for a periodic signalwith n harmonics without constant term.
According to these considerations of frequency, therefore, during eachcycle the pulses have to yield sufficient data to be able to reconstruct, the signal. There is a simple case where this result can also be derived byconsidering the phenomena as functions of time, namely, when the fre-quency p is included exactly a whole number of times in fL. In such acase the anode-current pulses are not shifted with respect to the low-frequency envelope. Each cycle is identical with the, one preceding it.One mayalso formulate it as follows: when scanning, use is made onlyof the signal amplitude at always the same points of the cycle, the partsin between being passed over. Thus the signal values during these hiatusesdo not contribute anything to the picture. For this there are no more than

CATHOj:)E-RAY O!)qLLpGRAPH
flip data available, so that a picture with more than t flip harmonicscannot be reconstructed.
Similar considerations apply in the case of sinusoidal phase modulation;Suppose that the phase modulation with respect to the pulse frequency canbe represented by zl cp cos qt, and let us further assume that exactly onecycle of a signal is scanned. With respect to this signal the amplitude ofthe phase modulation equals n radians- If'this signal has n harmonics thenthe phase modulation related to the nth harmonic is equal to n(/J cos qt.If it is allowed to regard the scanning as a quasi-stationary phenomenonthen the instantaneous value of the differential frequency resulting there-from can be represented by q n im sin qt. Hence q n n < fl/2 would have toapply, or
fl->2n ..nq
This equation is of the same shape as eq. (15) and can immediately berelated thereto when it is noted that nq is the maximum value of themomentary frequency. arising from the scanning of the first signal har-monic. Thus in essence eqs (15) and (16) are identical, and the argumentsalready put forward in regard to the number of pulses required per cyclehold here for the maximum in the scanning speed.
In order to show that the quasi-stationary method of argument is' per-missible we have to consider the side bands of. the pulse harmonics. Thegreater the value of the phase modulation, the greater is the range over whichthe side bands extend. The phase modulation of the pulse harmoniccoinciding with the nth signal harmonic equals tun: If nn~ 1 (large modu-lation index) then the components displaced more than the amount qnnfrom the central frequency contain only a very small part of the total energy.With the quasi-stationary method of approach this part is entirely ignored.
2.3 Adapting the scanning speed to the pulse width.As already discussed, the frequency characteristic of the oscillograph is
determined by the shape of the pulse. The frequency curve falls off whenthe oscillation time of the signal is of the order' of the pulse width b.A frequency limit Wg can be indicated above which the scanning methodno longer yields any useful resuÎts. Where this Wg value is to .be fixed for a
I certain form of pulse, depends upon the application. Roughly the rule is
b wg/2n Ri 1 . (17)
With a rectangular pulse the value 1 itself is certainly not suitable, sincethe Wg value would then lie at the first zero point in the frequency charac-teristic (see fig. 5). If the value 0·5 is accepted then the pulse width is equalto half a cycle of the limit frequency.' For scanning a sinusoidal signal
215
(16)

216 J. M. L. JANSSEN
of the limit frequency, according to what has been put forward in section2.2, more than two pulses are required per cycle (n= 1). Thus the distancebetween two successive pulses has to be less than half a cycle. Consequently,when projected on one signal cycle the distance between the succes~ive'pulsesis less than the pulse width, or in other words, there is some overlapping.
These considerations lead to a relation between the modulation fre-quency q, the pulse frequency fh and the limit frequency Wgo On the onehand, where the frequency of a signal equals that of the pulses it shouldbe possible to scan exactly one whole cycle of the signal. Thus the maximumamplitude of the phase modulation is fixed. On the other hand, with thismaximum amplitude, it must be just possible to observe a component ofthelimit frequency in a signalof the pulse frequency. Then the order is n =wgl fh and thus equation (16) becomes
...!!... > 2 wgl fh, or ",2> 2:n:q Wg •:n:q
Here it is assumed that the cathode-ray tube does not itselflimit the resolv-ing.power.
The aim will be to set Wg as high as possible by making the pulses asnarrow as is technically practicable; q will be determined by practicalconsiderations. Too small a value for q causes troublesome flickering ofthe picture, since q is also the time-base frequency. The simplest way isto' choose the mains frequency for q. The pulse frequency is then deter-mined by means of eq. (18). For q12:n: = 50 cIs and wg/2:n: = 50 Mc/s itfollows that the pulse frequency must he higher than 125 kc/s, in whichcase the frequency range of the oscillograph extends from 125 kc/s to50 Mc/s. Here it is to be noted that the mixer valve of fig. 1 for low-fre-quency signals operates as a normal amplifying valve when the phasemodulation of the pulses is made zero. According to section 1.2 the am-plification is then equal to the conversion amplification for high frequen-cies (see eqs (4) and (7)). In principle, therefore, also the frequency rangefrom 0 to 62·5 kc/s is covered, but this is of little practical importance. ,If it is desired to extend the range to lower frequencies then a simpler wayis to have the mixing valve function as amplifier without pulses. Whatthe extra band from 0 to 62·5 kc/s does offer, however, is the possibility,
._in principle, of èalibrating or stabilizing the conversion amplifioation withthe aid of a low-frequency signal.
(18)
2A Scanning modulated signals
Here a distinction has to he made between amplitude-modulated signals'and phase-modulated signals. With the former olie usually wants to. seethe shape' of the modulation, while with the latter it is often the shape of
CATHODE-RAY OSCILLOGRAPH
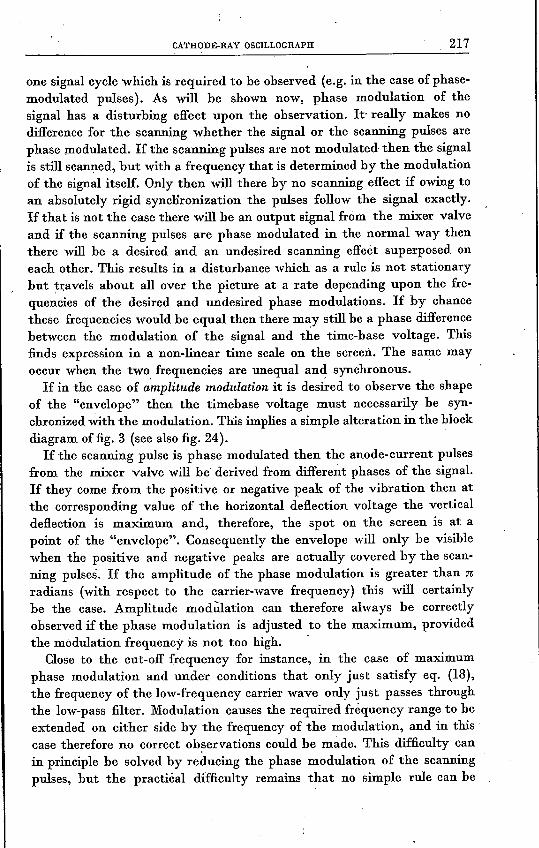
one signal cycle which is required to be observed (e.g. in the case ofphase-modulated pulses). As will be shown now, phase modulation of thesignal has a disturbing effect upon the observation. 'It-really makes nodifference for the scanning whether the signalor the scanning pulses arephase modulated. If the scanning pulses are not modulated then the signalis still scanned, but with a frequency that is determined by the modulationof the signal itself. Only then will there by no scanning effect if owing toan absolutely rigid synclironization the pulses follow the signal exactly.If that is not the case there will be an output signal from the mixer valveand if the scanning pulses are phase modulated in the normal way thenthere will be a desired and an undesired scanning effect superposed oneach other. This results in a disturbance which as a rule is not stationarybut travels about all over the picture at a rate depending upon the fre-quencies of the desired and undesired phase modulations. If by chancethese frequencies would be equal then there may still be a phase differencebetween the modulation of the signal and the time-base voltage. Thisfinds expression in a non-linear time scale on the screen. The same mayoccur when the two frequencies are unequal and synchronous.If in the case of amplitude modulation it is desi~ed to observe the shape
of the "envelope" then the timebase voltage must necessarily be syn-chronized with the modulation. This implies a simple alteration in the blockdiagram of fig. 3 (see also fig. 24).If the scanning pulse is phase modulated then the anode-current pulses
from the mixer valve will be derived from different phases of the signal.If they come from the positive or negative peak of the vibration then atthe corresponding value of the horizontal deflection voltage the verticaldeflection is maximum and, therefore, the spot on the screen is at apoint of the "envelope". Consequently the envelope will only be visiblewhen the positive and negative peaks are actually covered by the scan-ning pulses. If the amplitude of the phase modulation is greater than nradians (with respect to the carrier-wave frequency) this will certainlybe the case. Amplitude modulation can therefore always be correctlyobserved if the phase modulation is adjusted to the maximum, providedthe modulation frequency is not too high. .
Close to the cut-off frequency for instance, in the case of maximumphase modulation and under conditions that only just satisfy eq. (18),the frequency of the low-frequency carrier wave only just passes throughthe low-pass filter. Modulation causes the required frequency range to beextended on either side by the frequency of the modulation, and in thiscase therefore no correct ob~ervations could be made. This difficulty canin principle be solved by reducing the phase modulation of the scanningpulses, but the practical difficulty remains that no simple rule can be
217
218 J. M. L. JANSSEN
given that holds in all cases. A remarkable point is the fact that in thepicture the envelope may have a higher frequency than the "carrier wave".Usually this does not constitute any objection; only in the exceptionalcase of synchronism between the envelope and the carrier wave maythe number of contact points be too small.
2.5 Non-linear distortion
In section 1.1 the signalon the first grid ofthe'mixer valve was assumedto be small, and in formula (2) terms of higher order were therefore tacitlyignored. As is known, however, these give rise to distortion.
From the arguments put forward in section 1.1 it follows, not onlythat the amplification for signals of l~w frequency ("direct voltage varia-tions") is the same as the conversion amplification in the scanning process,but that also the non-linear distortion is the same in both cases. Bothamplification and distortion are in fact determined by the static (Ia, Egl)
characteristic measured while pulses are on the third grid. The result isthat the non-linear properties of the mixer circuit can be fully studied atlow frequencies.
3. Synchronization
3.1 The synchronization circuit
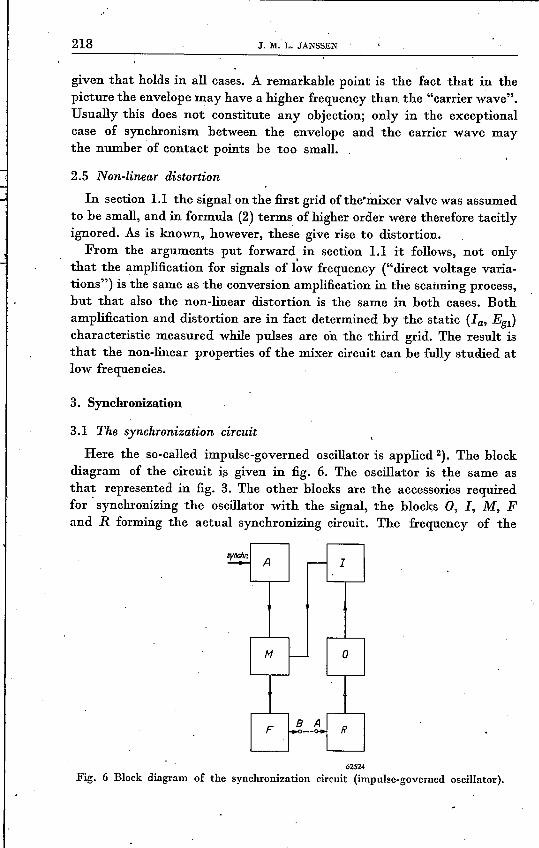
Here the so-called impulse-governed oscillator is applied 2). The blockdiagram of the circuit is given in fig. 6. The oscillator is the same asthat represented in fig. 3. The other blocks are the accessories requiredfor· synohronizing the oscillator with the signal, the blocks 0, I, M, Fand R forming the actual synchronizing circuit. The frequency of the
62524Fig. 6 Block diagram of the synchronization circuit (impulse-governed oscillator).

CATHODE-RAY OSCILLOGRAPH 219
oscillator 0 is kept at the correct value by the reactance valve R,'for which purpose this valve has to be fed with an appropriate directvoltage. This voltage is supplied by the mixer valve M, which is ofthe type described in section 1.1, to which the synchronization signal isapplied via the amplifier A, whilst the pulse generator I supplies the pulses.I is synchronized by the oscillator 0; F is a low-pass filter.
It is readily understood that a state of equilibrium is possible: if theoscillator 0 is in synchronism with the synchronization signal then themixer valve M supplies a direct voltage depending upon the phase ofthe pulse generator I with respect to the synchronization signal. Thus à
situation is possible where this direct voltage has just the value suitablefor giving the oscillator 0 the desired frequency via the reactance valveR. The question is whether this possible state of equilibrium is al~o stable.
3.2 Stability of the synchronization considered qualitativI,zy
For investigating the stability of the synchronization circuit Nyquist'scriterium can be applied here *).A suitable point where the circuit can be interrupted is the connection
between the filter F and the reactance valve R (fig. 6), at least for a mentalexperiment; in actual practice what synchronization there might have beenwould be lost, but in our mental experiment a direct voltage is appliedto A which is so chosen that the oscillator remains synchronous and doesnot change in phase with respect to the synohronization signal.
When, in addition to this direct voltage, A is also fed with an alternatingvoltage of low frequency and of such a small amplitude that all phenomenamay be regarded as linear, then the oscillator 0 will be frequency modulated,or one mayalso say phase modulated.
This phase modulation is communicated to the pulse generator I.Phase-modulated pulses, however, scan the signal in the mixer valve MIn the known way. If the phase modulation is very small then only asmall part of the synchronization voltage is scanned, which part can beregarded as a short -straiglrt line (fig. 7). Thus the mixer valve agaiD.yields a pure alternating voltage via B. .
In order to arrive in a simple manner at a vector diagram for the opencircuit we shall first consider once more the closed circuit. When an external
*) Labin 3) has stated that it is not permissible to apply Nyquist's criterium since the diffe-rential equation of the circuit is non-linear. For small disturbances, however, the non-linearity is immaterial and the Nyquist criterium may be applied. As stability in generalimplies stability for small disturbances in our way of approach a: necessary conditionfor stability is found. Possibly the system is unstable for large disturbances. The wayof approach of Labin gives necessary and sufficient conditions. However, in his theorythe dynamic properties of the low-pass filter F are neglected. Therefore his conditionsfor stability are rather trivial.

220 J. lIf. L. JANSSEN
signal, e.g. a direct voltage, is applied to the connection between F andR this will be compensated by the automatic frequency control, for the~ltimate frequency of 0 must not be allowed to change. The mechanismof this compensation is as follows. In 'the first place the interfering directvoltage causes a change in the frequency of 0, so that the phase of 0 withrespect to the synchronization voltage 'will change at a uniform rate,and the same then applies for the anode direct current of the mixervalve. A new state of equilibrium can only be reached when the changeshave the proper sign. 'I'his means that in fig. 7 only one of the points Pcan give a stable situation.
62525
Fig. 7 Scanning a signal with a phase-modulated pulse. The phase of the pulse varies sinus-oidally as a function of the time between the vertical dashed lines.
When a direct voltage is applied at A while the circuit is open also Mwill give a voltage, via B, which increases in the opposite direction. Therate at which this voltage increases will be proportional to the directvoltage applied at A, or in other words: the derivative of the voltage at Bis proportional to the voltage at A and has the opposite sign.
When a sinusoidal voltage is applied at A the same holds: the derative ofthe voltage at B, thus [o: VB' will be in counter-phase with the voltage at A.
Thus we arrive at the vector diagram of fig. 8, which according to theforegoing applies for very low frequencies. Now the filter F is a simpleRC element consisting of the parallel connection of a resistor and a capacitorin the anode circuit of the mixer valve. So VB will rotate clockwise withincreasing frequency. As the frequency approaches infinity this phaseshift approaches 90° and the amplitude of VB approaches zero.Tills might-lead one to conclude that where there is one RC element the
circuit is always stable, but the vector diagram still needs a correction.The coupling between the oscillator 0 and the pulse generator I is notabsolutely rigid, and as a consequence the phase modulation of I will lagbehind in phase with respect to that of O. This means an additional clock-wise rotation of VB' so that for a certain frequency VA and VBwill be inphase. The circuit can then oscillate when the amplification around the

CATHODE-RAY OSCILLOGRAPH 221
loop is greater than unity. The amplification depends upon various factors,among which the size of the synchronization voltage. From fig. 7 it is seenthat the output voltage of the mixer valve is directly proportional tothe slope at P, thus increasing with the synchronization voltage. If thesynchronization voltage is sinusoidal then it follows that for every fre-quency of that voltage a critical amplitude can be indicated above whichthe circuit becomes unstable;' the higher the frequency the lower thiscritical amplitude; since at a certain amplitude the derivative of a sinusoidalquantity is directly proportional to the frequency. In fig. 9 the upperdashed line represents the critical amplitude as a function of the sychroniza-tion frequency.
W,"'--"',I \I
VsFig. 8 Elementary vector diagram ofthe input voltage VA and the outputvoltage VB in the diagram of fig. 6.
62526
Let us now consider the region of synchronization. The maximum directvoltage that the mixer valve M is able to yield depends only upon theamplitude of the synchronization voltage and not upon the frequency.This direct voltage determines the range over which the oscillator 0 can bedetuned, and therefore the same applies for this range. If the synchronizingfrequency is the n-fold of the oscillator frequency then the synchronizingrange is n times wider than the detuning range ofthe oscillator O. Some syn-chronization ranges have been drawn in fig. 9. At higher frequencies neigh-bouring synchronization ranges overlap each other at a lower synchroniza-tion voltage. Another dashed line has been drawn through the lowermostpoints of intersection of the limits of these ranges.
The two dashed lines together form the boundaries of a band withinwhich the synchronization will always be overlapping and stable, at leastifthe first dashed line lies above the second one, as is assumed in fig.,9.Preferably one works within this band. Synchronization is still possiblewith lower synchronization voltages but then i~ is not overlapping, so thata signal with unstable frequency may easily come out of synchronization.If the amplification of the amplifier A is inversely proportional to the fre-
quency then, viewed from the input terminals, the useful band is horizontal.

222 J. M. L. JANSSEN
Fig. 9 is intended to give a rough idea of the position of .the stabilityand synchronization ranges. The stability limit, however, has, as it were,a fine structure, and to explain this we must consider more closely one ofthe synchronization ranges separately.
62527
Fig. 9 Synchronization diagram. The synchronization ranges are shaded. The figures alongthe horizontal axis indicate the frequency-dividing ratio for each range.
The lowest synchronization voltage at which instability arises occurswhen in the mixer valve M (fig. 6) the scanning pulse comes through at~:the steepest point of the ,shape of that, voltage, (see fig. 7). In the caseof a sinusoidal synchronization voltage this means that the scanning pulsejust comes through at the moment that the sine passes through zero.In this situation the output voltage of the mixer valve has the rest valueand thus the frequency of the oscillator 0 is not influenced by the synchroni-zation voltage. Apparently, therefore, the lowest point Q of the stability.limit lies at that frequency at which synchronism is still maintained whenthe amplitude ofthe synchronization voltage passesthrough zero (see fig. 10).
The points corresponding to other synchronization frequencies have asmaller slope and instability then arises only with higher values of thesynchronization voltage. In fig. 10the limit of the instability range has beenindicated schematically. A horizontal cross-sectionRS gives two stable rangesseparated by an unstable one. Such has also been observed experimentally.
synchronizationfrequency
62528
Fig. 10 Limit of the area of instability within a synchronization range.

CATHODE-RAY OSCILLOGRAPH
. The stability limit in fig. 9 is now the envelope of the stability limitsaccording to fig. 10. Below the limit of fig. 9 stability is certain, whilst aboveit instability is possible but not certain. For each value of the synchronisa-tion frequency this possibility can be realized by shifting the synchroniza-tion ranges, thus by detuning the oscillator O.
3.3 Calculation of stability
We shall now proceed to calculate the one-loop amplification ofthe opensynchronization circuit. Let the input voltage at A (fig. 6) be equal toVA ei'!. This gives rise to a frequency modulation LIft = kl VA ei'" where klis a proportionality factor. This can also be expressed as a phase modula-tion LIep = (ljjr) k1VAei'!. Assuming for the moment an absolutely rigidcoupling between the oscillator 0 and the pulse generator I, then the out-FlIt voltage of the mixer valve M is proportional to this phase modulationand thus equal to VB eir! = VA (~k2/jr) ei'" where k2 is a second propor-tionality factor.
The product ~k2 can be related to the size of the synchronizationrange in the case of synchronization with a sinusoidal voltage. One cycleof this has been drawn in fig. H, The pulse may lie between the peaksD and E. If the synchronization frequency is the N-fold of the pulse fre-quency then corresponding to the distance from D to E there is a phasevariation nj N of the pulse. If the same value of the constant k2 were toapply along the whole sine curve then there would be a correspondingvariation in the output voltage of the mixer' valve equal to k2nfN.As already shown, k2 has the greatest value where the synchronizationvoltage passes through zero. From now on k2 will be used to denote thismaximum value. The said variation will then be smaller, namely by a factor2/n (see fig. 11), and thus has the value 2k2jN. This variation is trans-mitted to the reactance valve R, so that the oscillator 0 will show a fre-quency variation 2k1k2jN. This is the amount by which the oscillator 0
!EF=.éiKL '1l'IIIIII
62529
Fig. 11 Synchronization with a sinusoidal voltage. Upon the synchronization range beingtraversed the pulse moves from D to E. The average slope of the sine between D and E is2/n times smaller than the maximum slope.
223

224 J. M. L. JANSSEN
is detuned when the pulse moves from D to E. Denoting the size of thissynchronization range by Lt S, then
2k1k2 = ± LISN
(19)
(since LtSis naturally a positive quantity we must introduce here the ± sign).For the amplification of the open circuit we therefore have
VB NLiSVA =- 2jr·
This formula with the negative sign corresponds to the vector diagramin fig. 8. Since the anode circuit of the mixer valve consists of the parallelconnection of a. resistor and a capacitor with the time constant T, afactor 1/(1 + jrT) has to be allowed for this (the half circle in fig. 8).
Finally there is the "elastic coupling" between the oscillator 0 and thepulse generator 1. Fig. 12 shows the relation between the frequency ft ofthe pulse generator I and the phase difference tp' between p~se generatorand oscillator.As the synchronizing frequency is ' raised so the pulse generator will
lag behind in phase. The relation shown in fig. 12 applies for the stationaryposition and thus also for very gradual (quasi-stationary) chimges. Letus assume that here a quasi-stationary argument is permitted. Then thefrequency modulation will yield a total phase modulation of
(20)
(21)
where k3 is a positive proportionality factor. Introducing these changes,formula (20) becomes
VB = _ NLiS .1 - k3jr = + k3NLlS 1+j (1/k3r).VA 2jr 1+ jrt 2 1+ jrT
(22)
Fig. 12 Relation between the syn- ~---+_+~chronized oscillator frequency ftand the phase difference tp' betweenoscillator and pulse generator.
62530

CATHODE-RAY OSCILLOGRAPH 225
The right-hand member is real for I/k3r = rt , Then
VB k3NAS-=VA 2
If successive synchronization ranges just overlap then for a not toosmall value of N·
(23)
. P,.18=-·
N(24)
With this, and with the requirement for stability. VB/VA <.1, equa-tion (23) becomes
(25)
(p, is an angular frequency). Taking j'for the number of cycles, the conditionbecomes
·1k3 <- .. nf
(26)
This is a very severe demand. If, for instance, the oscillator 0 is detunedover 10% of its frequency then the phase shift of the pulse generator I isequal to k3(1/IO) f radians. According to eq. (26) this should be lessthan 1/(10 n) radians, thus in any case less than 2°. If a multivibrator orblocking oscillator is immediately synchronized by the sinusoidal voltageof 0 then it is practically impossible to meet this requirement. It has infact been found experimentally that no satisfactory synchronization of. signal and pulse is possible in this way.
The rigidity of the coupling between oscillator and pulse generator can beincreased.very considerably by synchronizing with the peaks ofthe sinusoid-al oscillator voltage via a diode circuit. Cood results have in fact beenreached in this way. A reasonable overlapping of the synchronizationranges within the stable area is then possible.
//,,
I
III
Fig. 13 Nyquist diagram of : +1the synchronization circuit +------7.<H---+, --+--
. (see figs 6 and 8). \ /\ I\ !w\ ", I, I
','..... !.......... :I~O
62531
226 J. M. L. JANSSEN
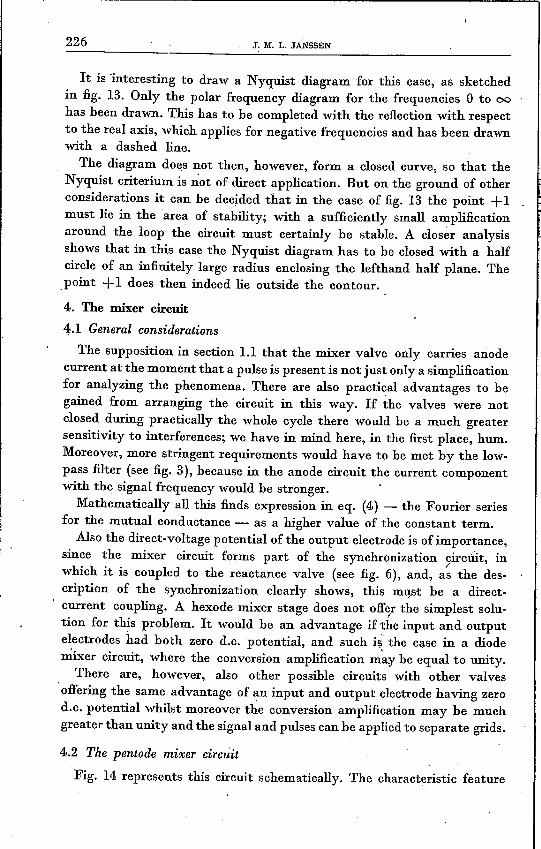
It is ïnteresting to draw a Nyquist diagram for this case, as sketchedin fig. 13. Only the polar frequency diagram for the frequencies 0 to 00
has been drawn. This has to be completed with the reflection with respectto the real axis, which applies for negative frequencies and has been drawnwith a dashed line.
The diagram does not then, however, form a closed curve, so that theNyquist criterium is not of direct application. But on the ground of otherconsiderations it can be decided that in the case of fig. 13 the point +1must lie in the area of stability; with a sufficiently small amplificationaround the loop the circuit must certainly be stable. A closèr analysisshows that in this case the Nyquist diagram has to be closed with a halfcircle of an infinitely large radius enclosing the lefthand half plane. The.point +1 does then indeed lie outside the contour.
4. The mixer circuit
4.1 General considerations
The supposition in section 1.1 that the mixer valve only carries anodecurrent at the moment that a pulse is present is not just only a simplificationfor analyzing the phenomena. There are also practical advantages to begained from arranging the circuit in this way. If the valves were notclosed during practically the whole cycle there would be a much greatersensitivity to interferences; we have in mind here, in the first place, hum.Moreover, more stringent requirements would have to be met by the low-pass filter (see fig. 3), because in the anode circuit the current componentwith the signal frequency would be stronger.
Mathematically all this finds expression in eq. (4) - the Fourier seriesfor the mutual conductance - as a higher value of the constant term.Also the direct-voltage potentialof the output electrode is of importance,
since the mixer circuit forms part of the synchronization 9Ïrcûit, inwhich it is coupled to the reactance valve (see fig. 6), and, as the des-cription of the synchronization clearly shows, this must be a direct-current coupling. A hexode mixer stage does not offe,rthe simplest solu-tion for this problem. It would be an advantage if the input and outputelectredes had both zero d.c, potential, and such i$ the Case in a diodemixer circuit, where the conversion amplification may be equal to unity.There are, however, also other possible circuits with other valves
,offering the same advantage of ~n input and output electrode having zerod.c. potential whilst moreover the conversion amplification may be muchgreater than unity and the signal and pulses can be applied to separate grids.
4.2 The pentode mixer circuit
Fig. 14 represents this circuit schematically. The characteristic feature

CATHODE-RAY OSCILLOGRAPH
of the circuit is that there is no power supply to the anode. Only the pulses,which have a peak value of 15 volts, are applied to th~ anode.The arguments of section 1.1 are fully applicable to this case, on the
understanding that here the anode also fulfils the function of the hexodegrid ga' So far as the outgoing signal is concerned the circuit can he regardedas a current source -Se Vg with internal resistance R; (see fig. 15), whereSe is the conversion conductance. The current. source is loaded with anexternal impedance Z consisting of the parallel connection of Rand C(fig. 14.). As the value of Z increases, the conversion amplification ap-
~z
62532
Fig. 14 Pentode mixer circuit. The anodehas at least sufficient bias to prevent thevalve from carrying currentjn the absenceof the. pulses.
625:l3
Fig. 15 Equivalent circuit of the pentodemixer valve loaded with an -externalimpedance Z.
proaches the final value SeRi. For a diode mixer valve this product is justequal to unity, but here it may assume a much higher value. This can beverified by static measurements while the pulses are present. Se can bedetermined by giving the control grid a small direct-voltage variationand measuring the corresponding variation in the anode direct current(see section 1.1). R; can be determined in the same way by means of adirect-voltage variation of the anode. If the influence of the control-gridvoltage is greater than that of the anode voltage then the product SeRiwill he \ greater than unity. The ratio of the two effects can also beestimated from a family of characteristics according to fig. 16; theseare "real" static characteristics measured in the absence of the pulses.With a valve of the type EF 50 it appears that a conversion amplificationof about 5 can he reached.From these considerations it is also clear why in the case of' a diode
mixer circuit the product SoRi. is equal to unity. The pentode circuit can.'he changed into a diode circuit by interconnecting the anode and thecontrol grid, but then the anode voltage and the control-grid voltagehave the same effect.
Several variations of the principle of fig. 14 are possible. The value ofR; of the valve can he raised by giving the suppressor grid a high potential
227

228 J. lil. L. JANSSEN
instead of connecting it to the cathode, such as is shown in fig. 17. Alsoa triode circuit ,rith grounded grid has its advantages. With the system offig. 14, under ~ertain conditions, the frequency spectrum of the conversion
Ia10mA
EF5Q ~=12V
Vgf6253'
Fig. 16 Static (la, Vg) characteristics of the EF 50 pentode for Iow values of the anodevoltage Va. . .
has an irregular trend, as the example in fig. 18, curve a, shows. Thisirregular trend is probably to he ascribed to the induction effect of thespace charge before the anode. Compensation is possible in the normalway by introducing a small capacitance between control grid and anode 5),but this compensation is dependent upon the valve adjustments. In atriode circuit there is no inductive space charge. As fig. 18, curve b, shows,also the spectrum is then regular. Byearthing the grid and applying the
EF50Vg,=-1.7VVg2=185V
62535
Fig. 17 Static (la, Va) characteristics of the EF 50 pentode for Iow values of V~.

CATHODE-RAY OSCILLOGRAPH
signal in series with the cathode the input circuit can still be kept separatefrom the pulse circuit. Curve b of fig. 18 likewise shows that with the systemapplied here the conversion amplification at 100 Mcfs ha') not yet droppedto one half.
150 f1rIs62536
Fig. 18 Frequency characteristics ofthe conversion conductance: (a) for the pentode mixer·circuit of fig. 14, (b) for a triode mixer circuit with grounded grid.
50o 100
5. The pulse generator
5.1 Qualitative considerationsAs is generally known, pulses can he generated either directly or in-.
directly. In the former case, for instance, an asymmetrical multivibratorcircuit can be applied, or a blocking oscillator can he used. In the secondcase a pulse is derived from a current or voltage surge,' use often beingmade of delay-time circuits or differentiating networks. The- surge itselfcan easily he generated with a multivihrator. Of the various possibilitiesthe last has been chosen: a multivihrator with differentiating network,because this fitted in best with the experience already acquired.
Fig. 19 is a diagrammatic representation of the system employed.The question arising is what are the optimum dimensions that can begiven to the differentiating network, consisting of the resistors RI and R2
and the capacitor Cm.If the discontinuity in the anode current is 10 then the voltage of the
pulses across _the output terminals is
Fig. 19 Elementary differ-entiating network for gener-ating a voltage pulse froma current surge.
229
(27)

230 J. lIf. L. JANSSEN
.The shape of the pulse is determined by the product Cm(RI +R2). The
shape of the frequency spectrum is thereby also determined. If, therefore,a certain frequency spectrum is desired and a value is chosen for Cm thenalso the value of (RI +R2) is determined. The height of the pulse is thenproportional to the product RIR2 and thus maximum when RI = R2.
Ifthe product Cm(RI + R2) is kept constant while reducing Cm then thevalue of that maximum becomes greater. Thus with the system of fig. 19pulses of any height can be obtained. They can also he narrowed at willby choosing a low enough value of Cm(RI + R2). However, no account hasyet been taken of the parasitic capacitances Cl and C2 parallel to the resis-tances RI and R2• Discontinuous voltage variations cannot the~efore arise,and the foregoing considerations no longer hold as soon as the productCm(RI + R2) becomes of the same order as the time constants, whichdetermine the rate of change in the charge of the capacitors Cl and C2•
Immediately after a discontinuity of the current the behaviour of thefour-pole is determined exclusively by the capacitances and we then have:
(28)
However, as soon as the voltages across the capacitances Cl and C2
differ from zero also the currents flowing through the resistors RI and R2assume a finite value, as a result of which the charging current for thecapacitors decreases. The same applies if the resistances are replaced byother impedances, e.g., self-inductances or two-poles of a compositecharacter. Parallel capacitances, if any, in these two-poles, then have tohe added to Cl and C2•
Let us now consider the case of fig. 20, ·where v can be approximatedup to the maximum M by a quarter of a sine wave. The tangent for t = 0is then represented by, eq. (28). The peak value of the sine lies a factor2/n lower than the point of intersection of the tangent with the ver-tical through the peak. Thus the peak value is
(29)
wliere ;: is the pulse width defined according to fig. 20. If co is the angular. frequency of the sine imagined as being extended then eq. (29) can alsobe written in the form:
(30)

CATHODE-RAY OSCIL~OGRAPH 231
As Cm approaches infinity-so the second factor of the right-hand memberapproaches unity. Thus the first factor gives the peak voltage for thecase of a two-pole. As an example of this may be mentioned the excitationof a parallel circuit by a current surge. Incidentally it may be noted thatuse can be made of this for generating a pulse by dissipating the energyof the system after the first half cycle with a diode. For very narrow pulses(high resonance frequency) this meets with the practicalobjection thatthe resistance of a normal diode is no longer sufficiently small with respectto the circuit impedance.
62538
Fig. 20 Form of a pulse which can be approximated from the beginning up to the peak Mby a .quarter cycle of a sine.
The pulse height according to eq. (30) is not reached with the systemof fig. 19. This circuit can certainly be improved, it being known that inresistance amplifiers the influence of parasitic capacitances can be partlycompensated by connecting self-inductances in series with the resistances.Such a measure can obviously be applied here too, but the difficulty liesin the dimensioning. The comparison with the resistance amplifier does nothelp us further. However, another line of reasoning proves fruitful inthis connection.
When self-inductances are connected in series with Rl and R2 we gettwo capacititively coupled circuits, and the c~rent surge excites the twonatural frequencies of the system. Thus the output voltage consists ofthe superposition of two damped sines. The elements of the system now •have to be chosen such that the two natural vibrations amplify each otherat the first positive peak of the output voltage and counteract each otherat the second positive peak. Then the second peak is smaller than thefirst one. Such a system can be considered successful if the peak valueof the pulse reaches approximately the values given by eq. (30).This principle of the superposition of damped oscillations is capable
of extension. By superimposing more than two of such oscillations a desired.shape of pulse can he better approximated. The network then becomesmore complicated.

232 'J. M.L.JANSSEN
Finally it is to be pointed out that in the foregoing the current surgehas been assumed to be ideal, i.e. of a negligible duration' of time. Inpractice account has to be taken of the finite time of the -surge, whichresults in an additional widening and shortening of the pulse. '
5:2. Calculating the shape of the pulse
~ For the system of fig. 21 we have
V ZlZ2-= ,I z,+ Z2 + l/pCm
where p is the differential operator, the meaning of the other)ymbolsfollowing from fig. 21.
(3J.)
I
C,
L,
v
=s;':62539
Fig. 21 "Differentiating" network for generating a voltage pulse from a current surge.
Introducing
we get
VI
(Rl +pLl) (R2 +pL2) . (32pCm(Ri+pLl) (1+pR2C2+p2L2C2)+pCm(R2+pL2) (1+pR1Cl+p2LlC1)+
+ (1+pR1Cl+p2L1Çl) (1+pR2C2+p2L2C2)
The denominator of eq. (32) is of the fourth degree in p and it generallycannot therefore be easily resolved into factors. Only a numerical calcula-rion is practicable. Resolution into factors is easily possible in the specialcasewhere
. (33)
These relations can be summarized as
(34)
CATHODE-RAY OSCILLOGRAPH 233
Now Cl and C2 are to be taken as given quantities determined by thevalve capacitances and the wiring. According to eq. (34) Zl and Z2 areproportional to the impedances of thes~ capacitancesv-.
It may be asked whether any purpose is served by calculating for thespecial cases where eq. (34) holds. In the first place the answer is that it isdifficult to indicate any other possibliliries for a general solutio~ of eq.(32). In the second place, however, the S) mmetrical system also comesunder eq. (34). Anyhow this is the optimum in the simple case whereCl = C2 = 0 ~nd L1 = L2 = 0, as shown in section 5.1. In less simplecases it is difficult to define what is to be understood by an optimumsystem. Whatever the definition may be, however, in any case the sym-metrical circuits occupy a special place, considering the symmetry in Zland Z2 of eq. (31). It may even be said that ifthere is one single optimumsystem it must he a symmetrical one. If eq. (34) is complied with theneq. (32) can be written in the following form:
V Cm p(p + 2(3)21= C
m(C1+C2) + C1C2 (p2+2{3p+~12+ (3-2-)(-p-'-2+_;__2{J-p-+-W-22-+-{3-2)'(35)
where(36)
Here it is assumed that W12 > 0 and W22 > O.
The behaviour of V for very small periods of time follows from eq.(35) when p is allowed to become very large. Then VII approaches to'
V Cm 11- Cm(Cl + C2) + C1C2 p' (39)
Taking for I a step function 10U(t), where U(t) = 1 for t < 0 and U(t) = 0for t > 0, from eq. (39) we get
(40)
in agreement with eq. (28).For greater lengths of time eq. (35) has to be solved generally. After
applying the inversion integral of the Laplace transformation it followsthat, as a function of time, 'V can be represented by

234 J. M. L. JANSSEN
where 2{lwlCPl= arctan , (0 < CPl< n)
W12 - {l2
-2{lw2CP2= arctan , (0 < CP2< n)W22 - {l2
A = wl {l2+ w22 •W2 (l2 + W1
2
The first factor of the right-hand member of eq. (41) corresponds to thefirst factor of the right-hand. member of eq. (30). The ]?eak value of theproduct of the second and third factors corresponds to the second factorof the right-hand member of eq. "(30). The course of this product is easiestto foresee when regarded as a function of wIt. For this function one can write:
(42)
(43)
(44)
f(wlt) = exp ~- ({l/Wl)Wlt~ ~sin (Wl~-CPl) + A sin (WIt :: + CP2)~' (45)
whilst CPl' CP2and A can be expressed in {l/Wl and w2/wl" The same holdsfor Cm. From eqs (37) and (38) it follows that
(46)
A choice of {l/wl and W2/Wl can easily be found by trial and error.The pulse proves to be of a suitable shape when {l/wl = W2/Wl = INn
is chosen. Equation (46) then becomes:
C = 5 ClC2 (47)m Cl + C2
For f (WIt) we find:
(48)
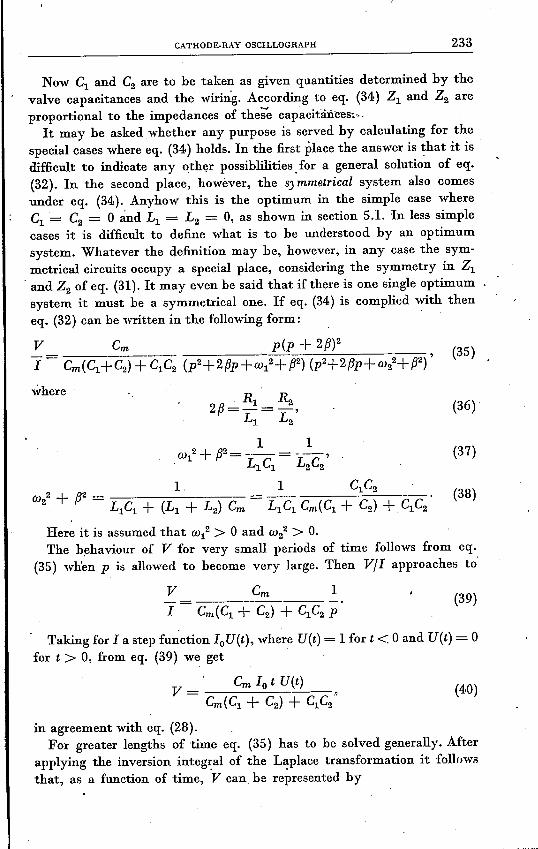
Fig. 22 shows how this function is built up from the two damped sines.The peak value proves to be 0'83. Equation (30) yields the same result, asappears when substituting therein Cm according to eq. (47).
From eqs (37) and (38) it follows that for this case
(49)
CATHODE·RAY OSCILLOGRAPH 235
n,= V L1.3C1
Given Cl and C2, and choosing a value for CV1' the other circuit elementsfollow from eqs (47) and (49), (50) and (34).
Here the self-inductance is about six times greater than what wouldbe required in a wide-band amplifier with Zl (fig. 21) as anode impedance,for then L1 ~ 0'5 R/C1, whereas here L1 = 3R12Cl"
and(50)
"f(W1f)
t f(w,tJ=.-f'i2 (sin(cu,t-336")+CJ.553 sin(fS +90'))
-os62540
Fig. 22 Shape of the output voltage of the network of fig. 21.
5.3 Generating the current surge
The question now is: how great must the current surge be in order togive a voltage pulse with a peak value of 15 volts and a duration of about10-8 sec?To estimate this we must know the value of the capacitances Cl and C2•
If the input of the four-pole is connected to the anode of an output valvethen Cl can be taken as equal to 15 pF. The output of the four-pole canbe coupled to the anode of the mixer valve via a small capacitance;a practical value is C2 = 7'5 pF. According to the fóregoing we shouldthen have
(51)
with Vpeak = ,15 V, CV1 = 2n X 50.106 sec'", Cl + C2 = 22'5 pF. Fromeq. (51) it then follows that 10 must be approximately 150 mA. It has tobe taken into account, however, that an ideal current surge cannot berealized. If the same peak value is required with a current surge that isnot ideal this must have a greater value, and the pulse is then wider.
236 J. M. L. JANSSEN
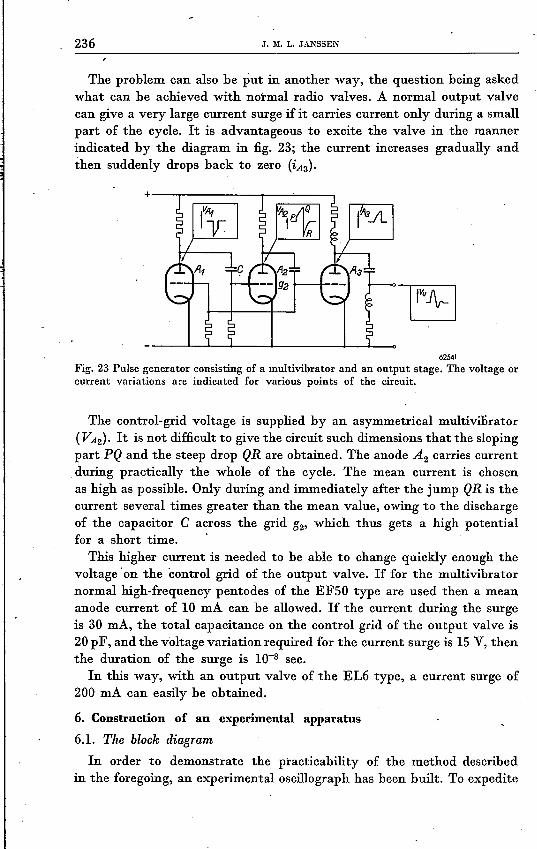
The problem can also be put in another way, the question being askedwhat can be achieved with normal radio valves. A normaloutput valvecan give a very large current surge if it carries current only during a smallpart of the cycle. It is advantageous to excite the valve in the mannerindicated by the diagram in fig. 23; the current increases gradually andthen suddenly drops back to zero (iAa).
62541
Fig. 23 Pulse generator consisting of a multivibrator and an output stage. The voltage orcurrent variations are indicated for various points of the circuit.
The control-grid voltage is supplied by an asymmetrical multivilirator(VA2). It is not difficult to give the circuit such dimensions that the slopingpart PQ and the steep drop QR are obtained. The anode A2 carries currentduring practically the whole of the cycle. The mean current is chosenas high as possible. Only during and immediately after the jump QR is thecurrent several times greater than the mean value, owing to the dischargeof the capacitor C across the grid g2' which thus gets a high potentialfor a short time. .This higher current is needed to be able to change quickly enough the
voltage' on the control grid of the output valve. If for the multivibratornormal high-frequency pentodes of the EFSO type are used then a meananode current of 10 mA can be allowed. If the current during the surgeis 30 mA, the total capacitance on the control grid of the output valve is20 pF, and the voltage variation required for the current surge is 15 V, thenthe duration of the surge is 10-8 sec.
In this way, with an output valve of the EL6 type, a current surge of200 mA can easily he obtained.
6. Construction of an experimental apparatus
6.1. The block diagramIn order to demonstrate the practicability of the method described
in the foregoing, an experimental oscillograph has been built. To expedite

CATHODE·RAY OSCILLOGRAPH 237
its development an optimum design was not aimed at in all cases, butsimple solutions were often' chosen as promising quick results; this appliesespecially for the input circuit and the phase modulation of the' pulses., The block diagram is given in fig. 24. As remarked in section 1.3, the.oscillograph can quite easily be combined with an electronic relay, andfor that reason the" apparatus has three input terminals, one for. each ofthe two signals and a third one for the synchronization voltage. Thesethree voltages are each applied to the apparatus via a cable with a probecontaining a capacitive step attenuator (blocks a, b and c). The twopicture signals are applied to the electronic relay d. Continual controlof the two picture quantities is possible by adjusting the grid biases ofthe relay valves. The relay voltages are derived from the distributor k,the four outputs of which are indicated in the block diagram. Since theswitching speed need not be high (see section 1.3), no square waves areneeded for the switching..
62542
Fig. 24 Block diagram of the experimental oscillograph.
In the block diagram, g is the mixer stage, where the signals are scannedby the pulses. These pulses are derived from the pulse generator h, whichis synchronized in the manner described in section 3, denoted here by thefrequency-dividing circuit e. Phase modulation takes place directly inthe pulse generator.
The output signal from the mixer stage g passes via a pre-amplifier J,a low-pass filter j and a push-pull amplifier 1 to the cathode-ray tube m.The other pair of deflecting plates is normally fed with a voltage of 50 cIsderived from the distributer k. For observing amplitude-modulated signalsprovision has been made for introducing an external voltage for the hori-zontal deflection (swit?h S).

238 J. M. L. JANSSEN
6.2. Some details of the system
Fig. 25 is a photograph of the capacItIve input attenuator. This is aladder network with constant output capacitance. The whole of the net-work has been mounted, by local silver-soldering, on a small plate of aeerarme material having a high dielectric constant.
Fig. 2S Photograph of the capacitive input attenuator.
The input cable has a very small capacitance and is not matched eitherat the input or at the output end. The system attenuator-cable-amplifierinput has a natural resonance at about 50 Mc/s. By damping the systemwith a series resistance the gain can be utilized up to about 30 Mc/s forcompensating the falling frequency characteristic of the mixer stage g.Above that frequency errors arise in phase and amplitude. Fig. 26 givesa picture of this. The phase characteristic has been measured by comparingthe two channels with each other on the screen of the oscillograph, onewith and the other without attenuator and cable.
This execution of the input circuit sets a limit to the frequency range,which could bi) avoided by employing a probe with cathode-follower
Amplitude
%~100r-~----~--~ _
Phase
1490
1200
100'
80'
60'
40'
20'
0'20 30 40 50110/s 60o
62543
Fig. 26 Amplitude characteristic of the oscillograph and phase characteristic of the inputcable with attenuator.

CATHODE,RAY OSCILLOGRAPH 239
and matched cable. At the time this apparatus was being developed nosuitable valves of small dimensions were available for this purpose.
Further, it has to be explained how the phase modulation of the scanningpulses is brought about. For this a very simple solution has been chosen,the only drawback to which is that the amplitude of the modulation cannotbe more than about 25°, so that only a part of the cycle of signals havingthe pulse frequency can be observed at once. Here use has been made ofthe elastic coupling between oscillator and pulse generator already dis-cussed in section 3.3. When the natural frequency of the pulse generatoris varied _ i.e. the frequency which the pulse generator would have if itwere not synchronizede= then the phase difference between oscillator andpulse generator varies with it. This variation of the natural frequency ispossible in many ways, for instance by changing one of the grid leakresistances of the multibivrator, or by changing the bias on one of themultivibrator grids. The latter method lends itself best for the desiredperiodic variation. A voltage of the mains frequency, derived from thedistributor k, is therefore simply applied to the pulse generator in serieswith the synchronization voltage. The other method is more suitable formanual control, and this is used for adjusting the average phase of thepulse with respect to the signal.
Finally it may be mentioned that the pulse generator has a frequencyof about 100 kc/so The circuit capacitance of the oscillator belonging tothe frequency divider e has a variable part, thus allowing for detuningover a small frequency range. It can be used if the synchronization voltageis not high enough for overlapping synchronization ranges.
6.3. Practical data
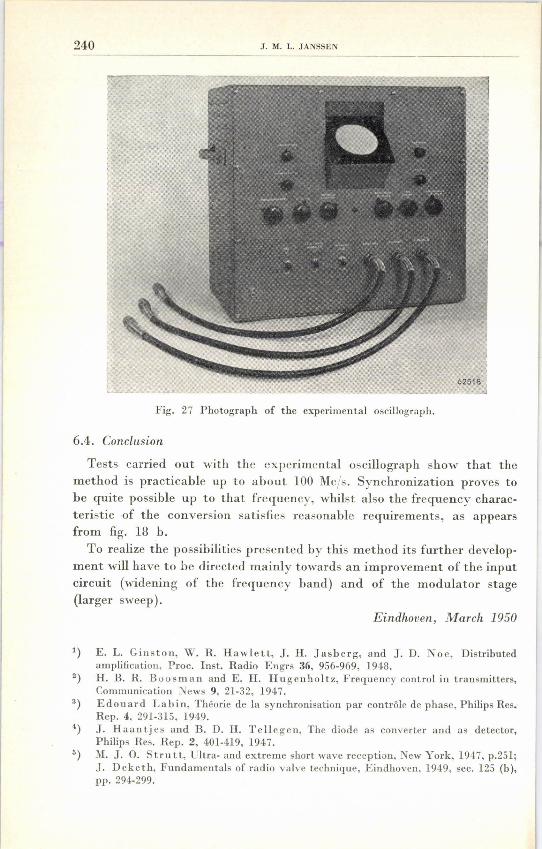
Fig. 27 is a photograph of the oscillograph.Frequency range: For all applications 1 to 30 Mc/s (see fig. 26). At 1 Mc/sthe pulse can amply scan one cycle. Synchronization is always possibleabove 1 Mc/s. From 0'1 to 1 Mc/s there are isolated synchronizationranges. The oscillograph is still quite useful for vario~s applications above30 Mc/s (see below).Sensitivity: 20 mV per cm picture height.Synchronization voltage: Overlapping synchronization at 20 mV up toabout 30 Mc/s; above which more voltage is needed. Synchronization isquite possible up to 100 Mc/s.Applications: Observation of distorted signals with harmonics up to about30 Mc/s. Observation of details of distorted signals by spreading themout over the entire width of the screen. Measuring phase and .amplitudecharacteristics up to about 70Mc/s. Observation ofmodulated signals; carrierfrequency up to about 70 Mc/s, modulation frequency up to about 20 kc/so
Eindhoven, March 1950
240 J. M. L JANSSEN
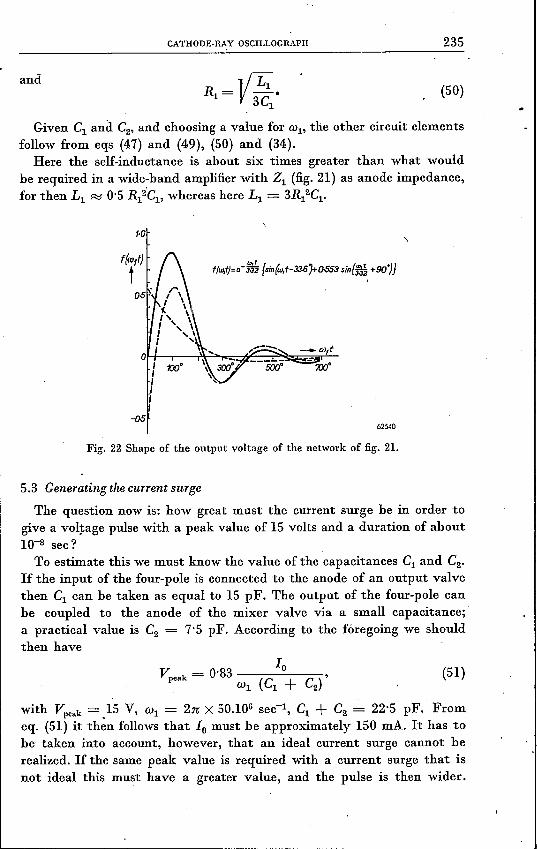
Fig. 27 Photograph of the experimental oscillograph.
6.4. Conclusion
Tests carried out with the experimental oscillograph show that themethod is practicable up to about 100 Mc/s. Synchronization proves tobe quite possible up to that frequency, whilst also the frequency charac-teristic of the conversion satisfies reasonable requirements, as appearsfrom fig. 18 b.
To realize the possibilities presented by this method its further develop-ment will have to be directed mainly towards an improvement of the inputcircuit (widening of the frequency band) and of the modulator stage(larger sweep).
1) E. L. Ginston, W. R. Hawlett, J. H. Jasberg, and J. D. Noe, Distributedamplification, Proc. Inst. Radio Engrs 36, 956-969, 1948.
2) H. B. R. Boosman and E. H. Hugcnholtz, Frequency control in transmitters,Communication News 9, 21-32, 1947.
3) Edouard Labin, Théorie de la synchronisation par contröle de phase, Philips Res.Rep. 4, 291-315, 194·9.
1) J. Haantjes and B. D. H. Tellegen, The diode as converter and as detector,Philips Res. Rep. 2, 4.01-419, 1947.
5) M. J. O. Strutt, Ultra- and extreme short wave reception, New York, 1947, p.251;J. Deketh, Fundamentals of radio valve technique, Eindhoven, 1949, sec. 125 (b),pp. 294·299.