a case study of estuarine pulse eutrophication
TRANSCRIPT
Estuarine, Coastal and Shelf Science 60 (2004) 23e35
www.elsevier.com/locate/ECSS
Ascendency as an ecological indicator: a casestudy of estuarine pulse eutrophication
J. Patrıcioa,), R. Ulanowiczb, M.A. Pardala, J.C. Marquesa
aIMAR-Institute of Marine Research, c/o Department of Zoology, Faculty of Sciences and Technology,
University of Coimbra, 3004-517 Coimbra, PortugalbChesapeake Biological Laboratory, Center for Environmental and Estuarine Studies, University of Maryland,
Solomons, MD 20688-0038, USA
Received 6 May 2003; accepted 28 November 2003
Abstract
Increasingly, management agencies require that the remediation of eutrophic waters be addressed at the level of the wholeecosystem. One whole-system approach to quantify ecosystems is called ecological network analysis. Ascendency theory, the branchof the field that deals with the quantification of whole-system status, specifically addresses the definition of eutrophication. This
definition has been applied to data taken over a gradient of eutrophication. Three separate areas were observed: a non-eutrophicarea (with Zostera noltii meadows), an intermediate eutrophic area (Z. noltii absent and macroalgae abundant at times) anda strongly eutrophic area (where Enteromorpha spp. blooms occur with regularity). Pulse eutrophication was considered as the major
driving force behind a gradual shift in primary producers from a community dominated by rooted macrophytes (Z. noltii) toa community dominated by green macroalgae. The measures associated with the intermediate eutrophic region turned out not to beintermediate to those at the gradient extremes. The most likely explanation appears to be the highly unstable nature of this area.
Conditions along the spatial gradient are discussed as representing various stages in the temporal evolution of the system, andanalysed in the framework of the Intermediate Disturbance Hypothesis, Bifurcation, Chaos, and Catastrophe theories.� 2004 Elsevier Ltd. All rights reserved.
Keywords: ascendency; estuary; eutrophication; network analysis
1. Introduction
Most European and North American estuaries areaffected to some degree by organic pollution and nutrientdischarges, often to an extent that gives rise to eutrophi-cation with linked effects upon resident biota (Diaz andRosenberg, 1995; Norkko and Bonsdorff, 1996; Flindtet al., 1997; Marques et al., 1997; Weaver et al., 1997;Rafaelli et al., 1998; Cloern, 2001). It has been observedthat benthic eutrophication in estuaries and coastallagoons can induce a shift from rooted plant commu-nities, dominated by slow-growing species, like theeelgrass Zostera, towards free-floating (or partially free-floating), faster-growing macroalgae, like Enteromorpha
) Corresponding author.
E-mail address: [email protected] (J. Patrıcio).
0272-7714/$ - see front matter � 2004 Elsevier Ltd. All rights reserved.
doi:10.1016/j.ecss.2003.11.017
or Ulva (Hartog, 1994; Duarte, 1995; Borum, 1996;Marques et al., 1997; Lillebø et al., 1999; Pardal et al.,2000; Cardoso et al., 2002).
During the past two decades, the emphasis in ecologyhas shifted somewhat toward a vision of the ecosystemas a system of interactions (Fasham, 1984; Frontier andPichod-Viale, 1995). That is, the center of interest hasbecome less the state of the biomass of the differentgroups of organisms, than the status of the interactionsbetween them, as quantified by flows of matter or energy(Niquil et al., 1999). In particular, there have been at-tempts to define quantitatively the process of eutrophi-cation (Cloern, 2001). Any index used in such attemptsmust combine the attributes of system activity level andcommunity structure. One such measure derives fromthe analysis of networks of trophic exchanges and iscalled the system ‘‘ascendency’’. Ulanowicz (1980)defines ascendency as an index that quantifies both the
24 J. Patrıcio et al. / Estuarine, Coastal and Shelf Science 60 (2004) 23e35
level of system activity and the degree of its organizationwhereby it processes material in autocatalytic fashion.
Ascendency is a rather abstract concept that revealsmanifold attributes when viewed from a variety ofaspects. This richness makes the measure useful in anumber of practical circumstances. Ascendency wasoriginally created to quantify the developmental statusof an ecosystem. If the manager suspects that a partic-ular disturbance has negatively impacted his/her eco-system, ascendency can be invoked to test thathypothesis quantitatively, provided sufficient data areavailable to construct networks of exchanges before andafter the impact. Not only can before and aftercomparisons be made, but the developmental stages ofdisparate ecosystems can also be compared with oneanother (e.g. Ulanowicz and Wulff, 1991).
Using ascendency, it is possible to determine quan-titatively whether a system has grown or shrunk,developed or regressed. Furthermore, particular pat-terns of changes in the information variables can be usedto identify processes that hitherto had been describedonly verbally (Ulanowicz, 2000). The process of eutro-phication, for example, can be described in terms ofnetwork attributes as any increase in system ascendency(due to a nutrient enrichment) that causes a rise in totalsystem throughput that more than compensates for aconcomitant fall in the mutual information (Ulanowicz,1986). This particular combination of changes in var-iables allows one to distinguish between instances of sim-ple enrichment and cases of undesirable eutrophication.
The aim of this study, therefore, is to test whether thenetwork formulation of eutrophication properly trackschanges in community structure along a known gradientof eutrophication in the south arm of Mondego estuary(Portugal), a well described small temperate intertidalestuary (e.g. Marques et al., 1997; Pardal et al., 2000;Cardoso et al., 2002).
2. Material and methods
2.1. Study area
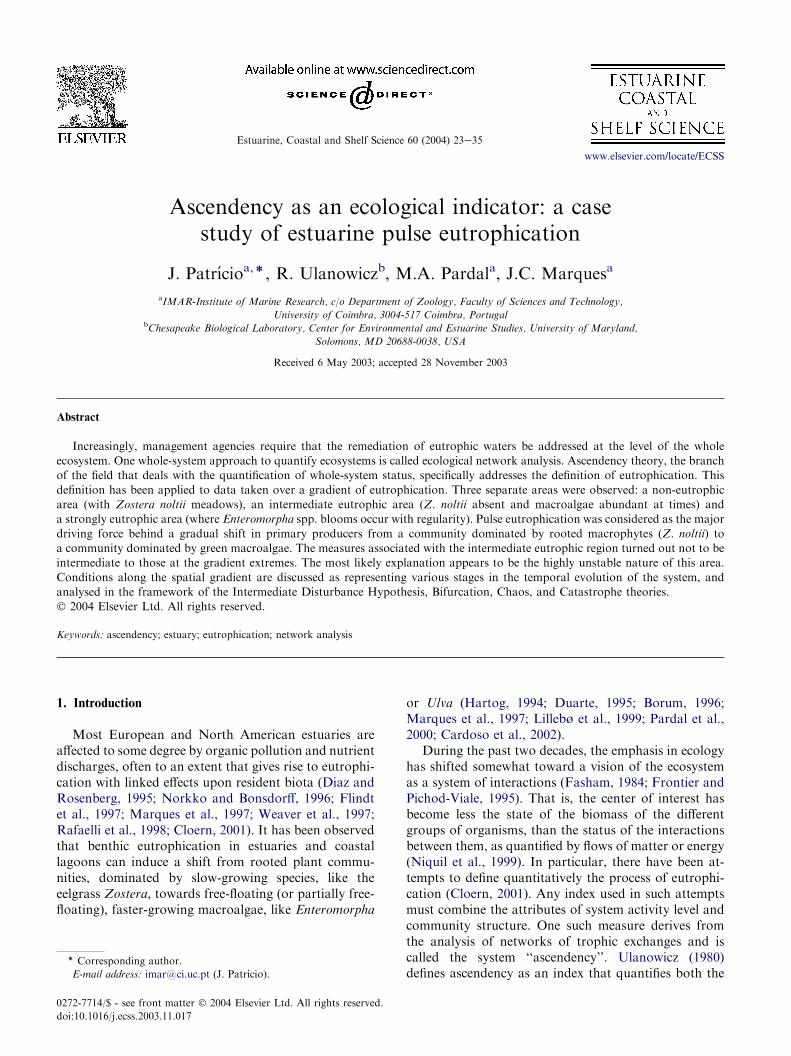
The Mondego estuary, western coast of Portugal(Fig. 1), consists of two arms, north and south, with verydifferent hydrological characteristics. The northern armis deeper, while the southern arm is silted up, especiallyin upstream areas, which causes most of the freshwaterdischarge to flow through the northern arm. Conse-quently, the water circulation in the southern arm isdependent mainly on tidal activity and on the (usuallysmall) freshwater input of a tributary, the Pranto river,which is controlled by a sluice.
Although, a large part of the southern arm intertidalarea remains relatively unimpacted, consisting of sand/mud bottoms covered by Spartina maritimamarshes and
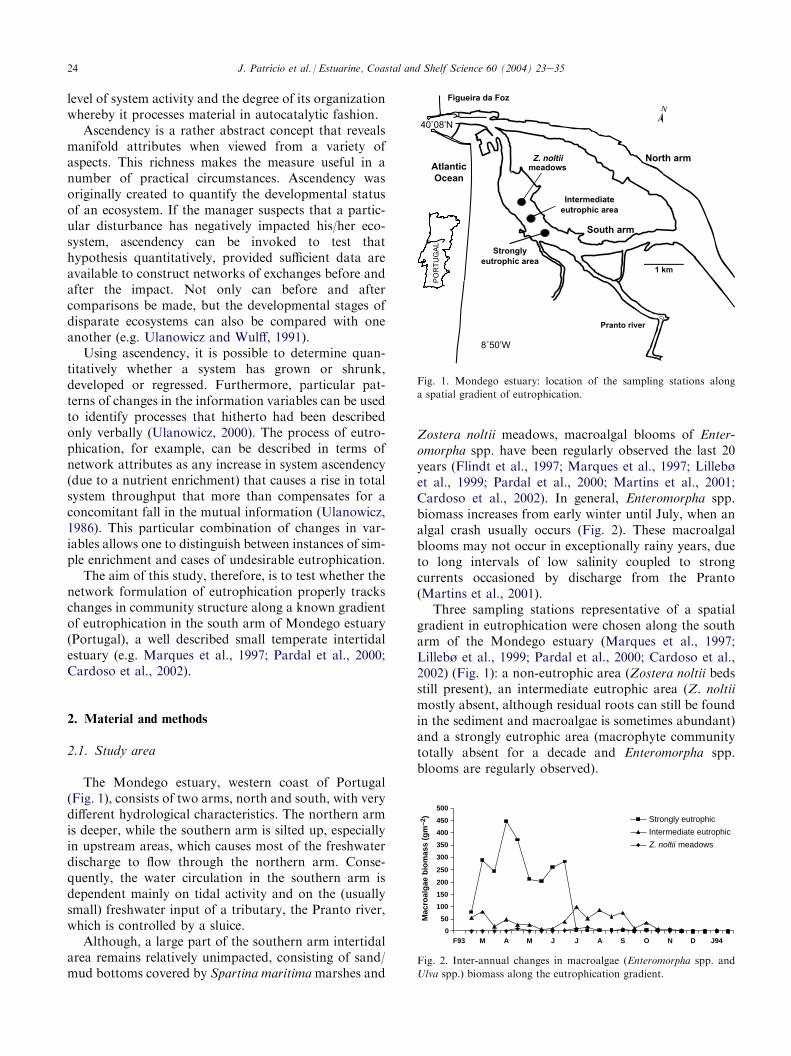
Zostera noltii meadows, macroalgal blooms of Enter-omorpha spp. have been regularly observed the last 20years (Flindt et al., 1997; Marques et al., 1997; Lillebøet al., 1999; Pardal et al., 2000; Martins et al., 2001;Cardoso et al., 2002). In general, Enteromorpha spp.biomass increases from early winter until July, when analgal crash usually occurs (Fig. 2). These macroalgalblooms may not occur in exceptionally rainy years, dueto long intervals of low salinity coupled to strongcurrents occasioned by discharge from the Pranto(Martins et al., 2001).
Three sampling stations representative of a spatialgradient in eutrophication were chosen along the southarm of the Mondego estuary (Marques et al., 1997;Lillebø et al., 1999; Pardal et al., 2000; Cardoso et al.,2002) (Fig. 1): a non-eutrophic area (Zostera noltii bedsstill present), an intermediate eutrophic area (Z. noltiimostly absent, although residual roots can still be foundin the sediment and macroalgae is sometimes abundant)and a strongly eutrophic area (macrophyte communitytotally absent for a decade and Enteromorpha spp.blooms are regularly observed).
POR
TUG
AL
1 km
North arm
Pranto river
Figueira da Foz
South arm
Atlantic�Ocean
meadows
Intermediate�eutrophic area
Strongly�eutrophic area
40˚08’N
8˚50’W
N
Fig. 1. Mondego estuary: location of the sampling stations along
a spatial gradient of eutrophication.
0
50
100
150
200
250
300
350
400
450
500
F93 M A M J J A S O N D J94
Strongly eutrophic
Intermediate eutrophic
Z. noltii meadows
Mac
roal
gae
bio
mas
s (g
m–2
)
Fig. 2. Inter-annual changes in macroalgae (Enteromorpha spp. and
Ulva spp.) biomass along the eutrophication gradient.

25J. Patrıcio et al. / Estuarine, Coastal and Shelf Science 60 (2004) 23e35
2.2. Methods
Estuarine food webs were constructed at the threesites and these quantified food webs were examinedusing network analysis, which quantifies inputeoutputrelationships (Leontief, 1951), cycling (Finn, 1976),through-flows, storage, information-theoretic indices ofwhole-system status (Ulanowicz, 1986) and indirect dietrelationships.
In order to estimate the magnitudes of the links in thenetwork (the trophic exchanges), an estimate of thebiomass of each component (living and non-living) isneeded. Information on the diets of all feeding species isalso required, as are some estimates of the physiologicalrequirements of each compartment (consumption:bio-mass, respiration:biomass, excretion:biomass, etc.) andof the intensities of flows between compartments andtheir external surroundings. These data for each of thethree networks were collected from different sources(e.g. Marques et al., 1997; Pardal et al., 2000, 2002;Cardoso et al., 2002).
A complete network analysis requires estimates of therates of export from the system, including the harvestsof economically important species. In the south arm ofthe Mondego estuary the harvest of Scrobicularia planaand Nereis diversicolor was considered so small as to benegligible.
The annual average biomass of each compartmentwas reported in g AFDWm�2 and fluxes were ing AFDWm�2 y�1. Energy budgets for each of the threestations were developed using ‘‘Ecopath with Ecosim’’software (http://www.ecopath.org), which calculates abalanced budget for each trophic group, accordingto the linear equation Ci ¼ PiCRiCEi, where Ci ¼consumption, Pi ¼ production, Ri ¼ respiration, andEi ¼ egestion by i. Estimates of consumption, production
and respiration generated by Ecopath with Ecosimwere imported into NETWRK 4.2a software (Ulano-wicz, 1999) to calculate annual AFDW budgets foreach heterotrophic compartment during one year. Thestructures of trophic levels and cycling for each net-work were analyzed and the system properties werecalculated using algorithms described by Ulanowicz(1986), Kay et al. (1989) and Monaco and Ulanowicz(1997).
2.2.1. Whole system indices2.2.1.1. Total system throughput (TST). The differ-ences in system activity are gauged by the relativevalues of the TST (Table 1). The total systemthroughput is simply the sum of all transfer processesoccurring in the system. That is TST ¼
Pp;q Tpq for all
possible transfers Tpq, where p and q can represent eitheran arbitrary system component or the environment.
2.2.1.2. Ascendency. This is a key property of a networkof flows that quantifies both the level of system activityand the degree of organization (constraint) with whichthe material is being processed in autocatalytic systemssuch as ecosystems. The ascendency, A, expressed interms of trophic exchanges, Tij, from taxon i to taxon j iscalculated as,
A ¼Xi
Xj
Tij logTijT��
T�jTi�
� �
where a dot as a subscript indicates summation over thatindex.
2.2.1.3. Development capacity. This index is a surrogatefor the complexity of the food web (Monaco and
Table 1
Network analysis ecosystem indices for the three areas
Information indices Non-eutrophic area Intermediate eutrophic area Strongly eutrophic area
Total system throughput (g AFDWm�2 y�1) 10 852 1155 2612
Development capacity (g AFDWm�2 y�1; bits) 39 126 5695 10 831
Ascendency (%) 42.3 30.4 36.7
Overhead on imports (%) 12.3 8.2 6.2
Overhead on exports (%) 1.3 1.5 2.5
Dissipative overhead (%) 17.7 22.1 19.9
Redundancy (%) 26.4 37.8 34.6
Average mutual information (bits) 1.52 1.50 1.52
F=TST 2.08 3.43 2.62
Connectance indices
Overall connectance 1.67 2.43 2.1
Intercompartmental connectance 2.41 3.57 2.63
Finn cycling index 5.75E�02 0.2045 0.1946
Total number of cycles 74 517 15 009 9164

26 J. Patrıcio et al. / Estuarine, Coastal and Shelf Science 60 (2004) 23e35
Ulanowicz, 1997). In other words, it is the diversity ofthe system flows scaled by the total system throughput.Quantitatively, it takes the form
C ¼Xi;j
Tij logTij
T��
� �
2.2.1.4. Average mutual information (AMI). This mea-sures the average amount of constraint exerted upon anarbitrary quantum of currency as it is channelled fromany one compartment to the next (Ulanowicz, 1997). Itis the unscaled form of the ascendency and is written as
AMI ¼Xi;j
Tij
T��log
TijT��
Ti�T�j
� �
2.2.1.5. Redundancy. This is the degree to which path-ways parallel each other in a network. It can becalculated in an isolated system as the (non-negative)difference by which the system capacity exceeds theascendency. In terms of flows it is
R ¼ �Xn
i;j¼0
Tij
T��log
Tij2
Ti�T�j
� �
where n is the number of components in the system (formore details see Ulanowicz and Norden, 1990; Ulano-wicz and Wulff, 1991).
2.2.1.6. Specific overhead of the system (F/TST). Itmeasures the total flexibility of the system on a per-unit-flow basis. The overhead of a system is the amount
by which the capacity of a non-isolated system exceedsthe ascendency. It consists mostly of redundancy, but inopen systems it is also augmented by multiplicities in theexternal inputs and outputs. In terms of the flows itresembles the redundancy, only it also includes thetransfers with the external world,
F=TST ¼ �Xnþ2
i;j¼0
Tij
T��log
Tij2
Ti�T�j
� �
where the index ðnC1Þ signifies an import and ðnC2Þ anexport or dissipation.
2.2.2. Trophic analysisFood webs that are qualitatively very different can be
mapped into a standard straight-chain network topol-ogy. This standard form allows comparison of corre-sponding trophic efficiencies between different estuaries(Baird et al., 1991). The trophic efficiency between anytwo levels is defined as the amount a given level passeson to the next one, divided by how much it receivedfrom the previous level (Ulanowicz and Wulff, 1991).The energy flow networks pertaining to the non-eutrophic and the strongly eutrophic areas were aggre-gated into their canonical trophic forms (Fig. 3), calledthe ‘‘Lindeman spine’’ (Ulanowicz, 1997). The connec-tance indices (Table 1) are estimates of the effectivenumber of links both into and out of each compartmentof a weighted network.
2.2.3. Cycle analysisThe Finn Cycling Index (FCI) reveals the proportion
of total system throughput that is devoted to the re-cycling of carbon (Finn, 1976). Thus, FCI ¼ Tc=TST,
4030
VIIIVII0.08%
VI0.35%
V2.15%
IV5.84%
III9.93%
II3.67%
I+D47.2%
501 18.4 1.82 0.107 0.29E-03 0.80E-05 0.67E-08
0.974E-090.112E-050.292E-030.523E-020.0465170
0.589E-080.692E-050.194E-02
0.0320.5
12208391
243
274 4.68
1.26 0.077
0.635E-03 0.21E-05 0.18E-08
782
278
(b)
341
0.129E-10
0.21E-10
.666E-10
IXVIII0.083%
VII0.34%
VI0.96%
V1.16%
IV4.19%
III9.54%
II6.58%
I+D14.8%
648 42.7 4.07 0.17 0.27E-02 0.26E-04 0.89E-07 0.74E-10
0.152E-070.4E-050.335E-030.0170.1591710
0.792E-070.223E-040.223E-02
0.0521.25
27.22782010
1750
328 11.6
2.81 0.13
0.822E-03 0.754E-05 0.255E-07
341
(a)
Fig. 3. Linear food chains: (a) Zostera meadows and (b) strongly eutrophic area. Flows out of compartment boxes represent exports
(g AFDWm�2 y�1), flows arriving to compartment boxes represent outside system inputs (g AFDWm�2 y�1) and flows out of the bottom represent
respiration (g AFDWm�2 y�1). Level ICD corresponds to the association of autotrophs (level I) and Detritus (non-living compartment). The
heterotrophic compartments are divided into levels IIeIX (in a) or levels IIeVIII (in b), according to their diet.

27J. Patrıcio et al. / Estuarine, Coastal and Shelf Science 60 (2004) 23e35
where Tc is the amount of system activity involved incycling.
3. Results
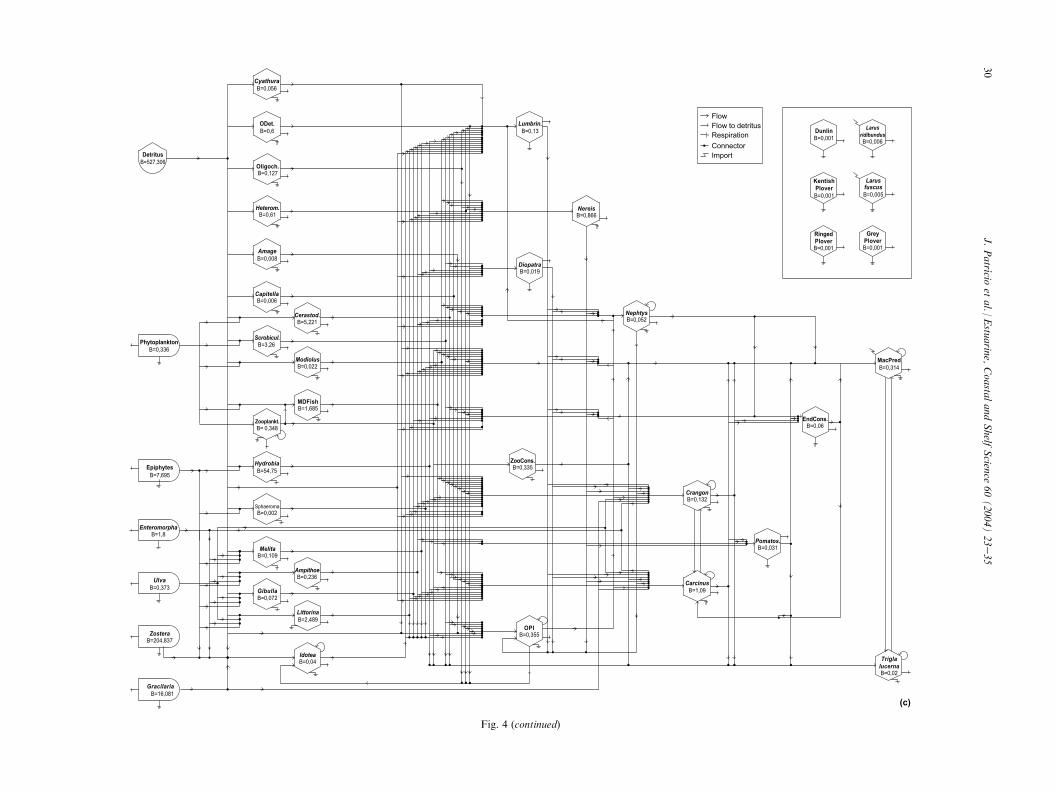
The energy flow networks of each community aredepicted in Fig. 4. Taken together with Table 1 and Fig. 3these provide the measures that were used to characterizethe trophic status of the three estuarine ecosystems. Fig. 5characterizes the magnitude and structure of carboncycling at the two endpoints of the eutrophicationgradient.
Following Monaco and Ulanowicz (1997), no test ofstatistical significance was applied to the differencesbetween the values of the indices pertaining to thedifferent areas, due to the complexity of comparinginformation-theoretic combinations. When the results ofnetwork trophic structure and estuarine ecosystem pro-perties were ordered according to magnitude, definitivepatterns emerged, providing insights into the trophicstructures, complexities and relative stresses exhibitedby each community (Monaco and Ulanowicz, 1997).
3.1. Whole system indices
The current study was designed to test how thenetwork formulation of eutrophication could be appliedto the differences in trophic status among the trophicstructures of three neighbouring communities along aneutrophication gradient. Although the three habitats areclearly distinct in physical appearance, network analysesrevealed both differences and similarities among theirtrophic structures that had not been apparent at firstglance.
It was possible to observe (Table 1) that the Zostera-dominated community had the highest total systemthroughput, followed (unexpectedly) by the stronglyeutrophic system and finally by the intermediate eutro-phic area. The development capacity was highest in theZostera beds and lowest in the intermediate eutrophicarea. The index differed significantly among the threeareas. Due to the logarithmic nature of this index, smalldifferences can represent appreciable disparities in struc-ture. The average mutual information was slightly higherin the non-eutrophic area, followed closely by theeutrophic area and was lowest in the intermediate eu-trophic area. Concerning ascendency, it increased inorder from the intermediate eutrophic to the heavilyeutrophic zone to the Zostera meadows. Regardingredundancy, the intermediate eutrophic community hadthe highest value, followed by strongly eutrophic areaand was least in the Zostera beds. The rankings in F/TST mirrored those in redundancy, which comprises thelargest component of F/TST.
3.2. Trophic analysis
The Lindeman spine for the non-eutrophic areapossesses an additional trophic level beyond thoseapparent in the strongly eutrophic chain (Fig. 3).Although both areas exhibited their highest transferefficiencies at the first trophic level (Zostera beds with14.8% and the strongly eutrophic with 47.2%), theintermediate eutrophic area was most effective in trans-ferring material (8.9%) at the second trophic level.
In theMondego system, connectance indices (Table 1)are relatively low, being modest in the intermediateeutrophic area, and decreasing yet further in the stronglyeutrophic and Zostera community.
3.3. Cycle analysis
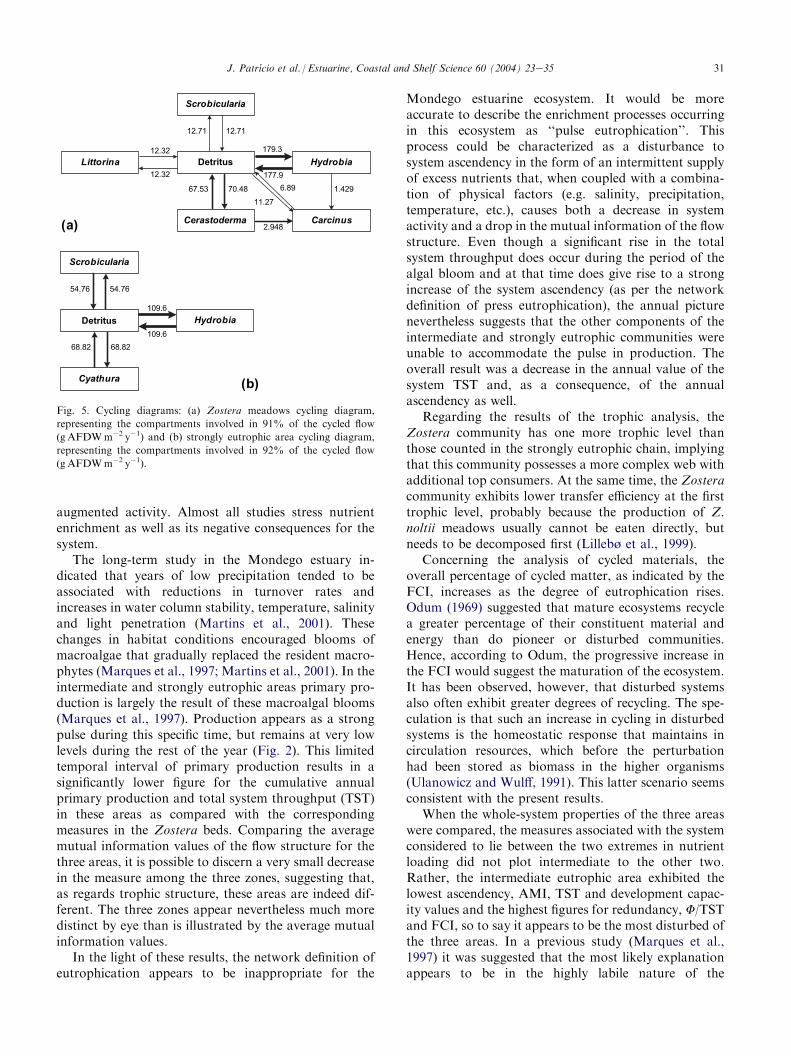
The Finn Cycling Index percentage (Table 1) wasgreatest in the intermediate eutrophic area (20.45%),decreased in the strongly eutrophic zone (19.46%) andthen markedly in theZostera-dominated system (5.75%).This would seem to indicate that the overall percentageof cycled matter increases as the degree of eutrophica-tion rises. The structure of cycling changes dramaticallybetween the pristine and eutrophic systems, however.The total number of cycles (Table 1) is highest in theZostera beds (74 517), followed by the intermediateeutrophic area (15 009) and the fewest are counted in thestrongly eutrophic community (9164). This is due to thefact that a larger number of cycles tend to be foundamong systems with more compartments at highertrophic levels. The preponderance of cycling occurs inboth systems over cycles of length 2, and the majorroutes for recycle are shown in Fig. 5. From this figure itis evident that less material is flowing over the morecomplicated web of cycles in the Zostera community(Fig. 5a), while far more medium cycles flow over fewerpathways in the strongly eutrophic system (Fig. 5b).This is a common signature of a stressed ecosystem(Ulanowicz, 1986).
4. Discussion
Eutrophication as a state of an ecosystem is difficultto define quantitatively and little consensus has beenreached (Christian et al., 1996; Cloern, 2001). Neverthe-less, there are points upon which most investigatorsagree. The process of eutrophication, for example, iscommonly considered to be an increase in the rate ofsupply of organic matter to an ecosystem (Nixon, 1995).The dystrophy attendant to over-enrichment is usuallymanifested as the loss of important species along withthe system functions they help to maintain. That is,although nutrients tend to stimulate a system’s growth,the organization of the system is degraded, despite its

CyathuraB=7,268
Crangon�B=0,28
Carcinus�B=0,419
EndCons.�B=0,06
MacPred�B=0,136
Dunlin�B=0,005
LarusridibundusB=0,006
KentishPlover�
B=0,001
LarusfuscusB=0,006
RingedPlover
B=0,001
GreyPlover
B=0,002
Flow
(a)
FDWm�2 and flows in g AFDWm�2 y�1.
28
J.Patrıcio
etal./
Estu
arin
e,Coasta
landShelf
Scien
ce60(2004)23e
35
DetritusB=309,8
Phytoplankton�B=0,17
Oligoch.�B=0,005
ODet.�B=0,16
Heterom.B=0,192
AmageB=0,114
MDFish�B=1,1
Zooplankt.�B= 0,234
MelitaB=0,099
HydrobiaB=9,745
AmpithoeB=0,145
Echinog.B=0,002
CapitellaB=0,038
Cerastod.B=0,216
Scrobicul.B=11,347
IdoteaB=0,02
EnteromorphaB=96,784
UlvaB=7,658
FucusB=0,203
GracilariaB=2,322
NereisB=0,428
ZooCons.�B=0,063
OPI�B=0,01
Flow to detritus
ConnectorRespiration
Import
Fig. 4. Energy flow diagrams: (a) Zostera meadows, (b) intermediate eutrophic area and (c) strongly eutrophic area. Biomass is given in g A

CyathuraB=0,343
CrangonB=0,317
CarcinusB=0,580
EndCons.B=0,06
MacPredB=0,140
DunlinB=0,005
LarusridibundusB=0,006
KentishPlover�
B=0,001
LarusfuscusB=0,006
RingedPlover�
B=0,001
GreyPlover�
B=0,002
Flow to detritusFlow
Respiration
(b)
29
J.Patrıcio
etal./
Estu
arin
e,Coasta
landShelf
Scien
ce60(2004)23e
35
DetritusB=518,761
PhytoplanktonB=0,324
Oligoch.B=0,031
ODet.B=0,893
Heterom.B=0,186
AmageB=0,022
MDFishB=0,894
Zooplankt.�B= 0,278
MelitaB=0,181
HydrobiaB=4,666
LittorinaB=0,525
AmpithoeB=0,179
Coroph.B=0,002
CapitellaB=0,062
Cerastod.B=0,088
Scrobicul.B=7,762
IdoteaB=0,027
EnteromorphaB=26,975
UlvaB=2,504
FucusB=0,084
GracilariaB=2,054
NereisB=0,505
NephtysB=0,055
ZooCons.B=0,102
OPIB=0,052
ConnectorImport
Fig. 4 (continued)
CyathuraB=0,056
ODet. Lumbrin.
Pomatos.B=0,031
EndCons.B=0,06
MacPredB=0,314
TriglalucernaB=0,02
DunlinB=0,001 B=0,006
KentishPloverB=0,001
LarusfuscusB=0,005
RingedPloverB=0,001
GreyPloverB=0,001
Flow to detritusFlow
(c)
30
J.Patrıcio
etal./
Estu
arin
e,Coasta
landShelf
Scien
ce60(2004)23e
35
DetritusB=527,306
PhytoplanktonB=0,336
Oligoch.B=0,127
B=0,6
Heterom.B=0,61
AmageB=0,008
MDFishB=1,685
Zooplankt.B= 0,348
MelitaB=0,109
HydrobiaB=54,75
B=0,002
AmpithoeB=0,236
GibullaB=0,072
LittorinaB=2,489
CapitellaB=0,006
Cerastod.B=5,221
Scrobicul.B=3,26
ModiolusB=0,022
IdoteaB=0,04
EnteromorphaB=1,8
UlvaB=0,373
ZosteraB=204,837
GracilariaB=16,081
EpiphytesB=7,695
B=0,13
NereisB=0,866
NephtysB=0,052
ZooCons.B=0,335
OPIB=0,355
CrangonB=0,132
CarcinusB=1,09
DiopatraB=0,019
ConnectorRespiration
Import
Fig. 4 (continued)
31J. Patrıcio et al. / Estuarine, Coastal and Shelf Science 60 (2004) 23e35
augmented activity. Almost all studies stress nutrientenrichment as well as its negative consequences for thesystem.
The long-term study in the Mondego estuary in-dicated that years of low precipitation tended to beassociated with reductions in turnover rates andincreases in water column stability, temperature, salinityand light penetration (Martins et al., 2001). Thesechanges in habitat conditions encouraged blooms ofmacroalgae that gradually replaced the resident macro-phytes (Marques et al., 1997; Martins et al., 2001). In theintermediate and strongly eutrophic areas primary pro-duction is largely the result of these macroalgal blooms(Marques et al., 1997). Production appears as a strongpulse during this specific time, but remains at very lowlevels during the rest of the year (Fig. 2). This limitedtemporal interval of primary production results in asignificantly lower figure for the cumulative annualprimary production and total system throughput (TST)in these areas as compared with the correspondingmeasures in the Zostera beds. Comparing the averagemutual information values of the flow structure for thethree areas, it is possible to discern a very small decreasein the measure among the three zones, suggesting that,as regards trophic structure, these areas are indeed dif-ferent. The three zones appear nevertheless much moredistinct by eye than is illustrated by the average mutualinformation values.
In the light of these results, the network definition ofeutrophication appears to be inappropriate for the
1.429
Scrobicularia
Carcinus
Littorina HydrobiaDetritus
Cerastoderma
12.7112.71
179.3
177.9
12.32
12.32
67.53 70.48
2.948
6.89
11.27
(a)
Scrobicularia
54.76
109.6
109.668.82 68.82
(b)
54.76
Cyathura
HydrobiaDetritus
Fig. 5. Cycling diagrams: (a) Zostera meadows cycling diagram,
representing the compartments involved in 91% of the cycled flow
(g AFDWm�2 y�1) and (b) strongly eutrophic area cycling diagram,
representing the compartments involved in 92% of the cycled flow
(g AFDWm�2 y�1).
Mondego estuarine ecosystem. It would be moreaccurate to describe the enrichment processes occurringin this ecosystem as ‘‘pulse eutrophication’’. Thisprocess could be characterized as a disturbance tosystem ascendency in the form of an intermittent supplyof excess nutrients that, when coupled with a combina-tion of physical factors (e.g. salinity, precipitation,temperature, etc.), causes both a decrease in systemactivity and a drop in the mutual information of the flowstructure. Even though a significant rise in the totalsystem throughput does occur during the period of thealgal bloom and at that time does give rise to a strongincrease of the system ascendency (as per the networkdefinition of press eutrophication), the annual picturenevertheless suggests that the other components of theintermediate and strongly eutrophic communities wereunable to accommodate the pulse in production. Theoverall result was a decrease in the annual value of thesystem TST and, as a consequence, of the annualascendency as well.
Regarding the results of the trophic analysis, theZostera community has one more trophic level thanthose counted in the strongly eutrophic chain, implyingthat this community possesses a more complex web withadditional top consumers. At the same time, the Zosteracommunity exhibits lower transfer efficiency at the firsttrophic level, probably because the production of Z.noltii meadows usually cannot be eaten directly, butneeds to be decomposed first (Lillebø et al., 1999).
Concerning the analysis of cycled materials, theoverall percentage of cycled matter, as indicated by theFCI, increases as the degree of eutrophication rises.Odum (1969) suggested that mature ecosystems recyclea greater percentage of their constituent material andenergy than do pioneer or disturbed communities.Hence, according to Odum, the progressive increase inthe FCI would suggest the maturation of the ecosystem.It has been observed, however, that disturbed systemsalso often exhibit greater degrees of recycling. The spe-culation is that such an increase in cycling in disturbedsystems is the homeostatic response that maintains incirculation resources, which before the perturbationhad been stored as biomass in the higher organisms(Ulanowicz and Wulff, 1991). This latter scenario seemsconsistent with the present results.
When the whole-system properties of the three areaswere compared, the measures associated with the systemconsidered to lie between the two extremes in nutrientloading did not plot intermediate to the other two.Rather, the intermediate eutrophic area exhibited thelowest ascendency, AMI, TST and development capac-ity values and the highest figures for redundancy, F/TSTand FCI, so to say it appears to be the most disturbed ofthe three areas. In a previous study (Marques et al.,1997) it was suggested that the most likely explanationappears to be in the highly labile nature of the
32 J. Patrıcio et al. / Estuarine, Coastal and Shelf Science 60 (2004) 23e35
intermediate system. In fact, observations using otherecological indicators have indicated that the communi-ties built around both the Zostera and Enteromorphapopulations represent more stabilised communities atthe ends of the eutrophication gradient. Regarding theintermediate eutrophic area, since it always exhibited thelowest values of total biomass and the highest speciesheterogeneity (as measured by the ShannoneWienerindex), a preliminary interpretation of the results sug-gested that the Intermediate Disturbance Hypothesis(IDH) (Connel, 1978) was applicable to explain the ob-servations (Marques et al., 1997). Nevertheless, the samedatabase was also utilised to test other ecologicalindicators (the Exergy index and Specific Exergy, ther-modynamically oriented), which allowed the conclusionthat: (a) both indicators were consistently higher in thenon-eutrophic area, followed by the most eutrophic andintermediate eutrophic areas; (b) their range of variationthrough time was smaller in the non-eutrophic area,expressing a more stable situation, while the magnitudeof the variations was stronger in the other two areas, butespecially in the intermediate eutrophic area (Marqueset al., 2003). As a whole, by contrast with the other twoareas, the intermediate eutrophic one clearly appearedtoo disturbed to allow for the establishment of a co-herent community built around either mode of primaryproduction.
Observations on the intermediate eutrophic area werenot satisfactorily consistent with the IDH, which isthought to be realised in systems with a certain capacityto absorb changing environmental conditions at a largertime scale. The story would be not so simple had thesystem already lost or exploited most of the possibilitiesto react properly, either due to natural succession orlong-term stress.
Qualitative observations carried out in the Mondegoestuary since the early 1980s (Marques et al., 1984)provide a general idea regarding how the system was atthe time. Since then, the most evident feature has beenthe increase of eutrophication symptoms and its impacton the biological communities, of which the most visibleeffect was the occurrence of green macroalgae bloomsand a concomitant decrease of the area occupied byZostera noltii beds. Twenty years ago, Z. noltii bedscovered a large part of the intertidal area, extending tothe upstream section of the south arm. Moreover, itsdisappearance first took place in the inner areas of thesouth arm of the estuary, what is now the mosteutrophic area, and went forward to the downstreamsection, where it is presently restricted. In the inter-mediate eutrophic area, although Z. noltii disappearedsome time ago, it is still possible to find the remains ofits rhizomes in the sediment.
The way macroalgae extended from upstream todownstream sections in the south arm of the estuary,competing with Zostera noltii and the way this process
influenced faunal assemblages have been fully describedin the previous works, illustrating how a shift in primaryproducers may determine changes at other trophic levels(Marques et al., 1997; Marques et al., 2003). Addition-ally, a tentative interpretation of the recent biologicalchanges in the system has been proposed (Marqueset al., 2003), starting from a basic assumption: SinceZ. noltii’s disappearance in the south arm of the estuarycommenced in the inner areas and progressed down-stream, spatial changes in the system may be takenas representing temporal changes. The non-eutrophicarea, with Z. noltii beds, may thus represent what thesystem was two decades ago, the intermediate eutrophicarea may represent the changing areas during theprocess, and the most eutrophic area may representthe most advanced stage in the observed shift of pri-mary producers, where macroalgae have totally oustedmacrophytes.
Once this assumption is accepted, the recent modifi-cation in primary producers and its related food webmay be seen as a dynamic shift in the ecosystem networkstructure, of the catastrophic type, described for instanceby Scheffer et al. (2001). In the prevailing conditions twodecades ago, rooted macrophytes, Zostera noltii andrelated epiphytic grazers dominated by Hydrobia ulvaewere selected, and an important detrital food web wasalso present. As eutrophication affected an increasingarea of the estuary, green macroalgae, like Enter-omorpha spp. and Ulva spp. replaced the rooted macro-phytes. As a consequence, the high turnover of thesemacroalgae, and the alternation between periods dom-inated by the occurrence of extensive algal mats andperiods with bare bottom organically enriched sedi-ments caused an increasing importance of the detritalpathway (Marques et al., 2003). How can this shift betheoretically understood?
The possible long-term development and modifica-tion, of an ecosystem exposed to various degrees ofdisturbances, natural as well as those caused by humans,may be illustrated by Fig. 6a. On the left part of thecurve, at a relatively low level of stress corresponding tonormal fluctuations in environmental conditions, a nor-mal succession towards an increase and finally stabili-zation of the biomass and complexity of the system isrepresented. During this period, the system will followtraditional developmental patterns (see for instance the24 principles of E.P. Odum) such as development fromr- to K-strategists, increased cycling, and importance ofthe network, etc. (Odum, 1971).
For a given increase in stress, literature exists thatreports an additional stimulation of biomass anddiversity, illustrated by a ‘‘hump’’ on the curve (Fig. 6a),what is usually referred to as the IDH (Connel, 1978).Nevertheless, this developmental pattern is only thoughtto be realised in systems that possess a cache in diversitythat enable them to react, buffering the disturbances at

33J. Patrıcio et al. / Estuarine, Coastal and Shelf Science 60 (2004) 23e35
a larger time scale, which is not always the case. If asystem has lost or exploited most of its overhead already,either due to natural succession or long-term stress, suchcapability may be limited or not exist at all. If this is thecase, higher stress forces will lead to ‘‘real’’ macroscopicmodification, which takes place through other mecha-nisms. First of all, continuous adaptation and fine-tuning of parameters lead to a system of highly fittedand specialised organisms, which in turn will reduce anorganism’s adaptability in relation to changes inenvironmental conditions. As a result, it is believed thatthe system as a whole becomes very unstable and brittle(Jørgensen and Johnsen, 1989). This phase may beexpected to correspond to large short-term fluctuationsof the ecological indicators we may use to capture thestate of the system (Fig. 6a), which corresponds to theobservations by Marques et al. (2003). Second, adapta-tion of the network leads to a development where theecosystem has decreased as much as possible its condi-tional entropy, or overhead in the sense of Ulanowicz(1986, 1997), i.e. maximizing the utilisation of theavailable resources (energy) through a more and morespecialised (efficient) species composition. Such special-isation also means a decrease in the possibility of thesystem to cope with environmental changes, whicheventually leads to change through a type of Hollingcycle (Holling, 1986; Ulanowicz, 1997).
Fig. 6. Ecosystem development as a function of succession and
environmental stress: (a) relation between possible ways of ecosystem
development and concepts from ecological theory and (b) possible
interpretation of changes on going in the Mondego estuary in the
frame of ecological theories.
Moreover, the modification of systems is non-linear,and as time passes instability gives rise to a bifurcationto new stability points (Glansdorf and Prigogine, 1971)(Fig. 6a,b). In other words, the instability of the systemwill thus lead it to a breakdownda catastrophedwithpossibilities of new organisms and combinations to takeover and be selected because the new constellation isbetter able to meet the prevailing conditions. Catastro-phe is not necessarily used here in its narrow mathe-matical sense and may also not be mathematically assuch (Zeeman, 1976). Beyond the point of bifurcation,whatever interpretation is preferred, several possibilitiesare allowed: (a) a total recovery of the system to analmost identical state can take place, which wouldcorrespond to a ‘‘normal’’ understanding and interpre-tation of the Holling cycle. This of course provided thatthe perturbation somehow has been stopped, andsufficient biodiversity has been conserved during thestress period to allow the system to return to a quasi-original state; (b) in case these conditions are notfulfilled, the system will evolve to one or more stabilitypoints, or maybe even continuous instability. The shiftto other stability points may also be viewed as if thesystem is leaving one Holling cycle (Holling, 1986) andentering into another.
Plausibly, several of these ‘‘states’’ of developmentcan be identified in time and space along the south armof the Mondego estuary. The following descriptionsallow an understanding of the present state of eachstudied area along the south arm and interpret thesituation in accordance with a broader theoreticalframe, as previously suggested by Marques et al. (2003):
(a) The Zostera noltii beds may be considered ascorresponding to the more or less original state ofthe system, identical to the climax society (Fig. 6b).Meanwhile, these areas are in regression, showingthat they are highly vulnerable to the presentconditions.
(b) The most eutrophic area has undergone a transitionand, through a bifurcation, found another stabilitypoint (Fig. 6b).
(c) In the intermediate eutrophic area changes exceedthe natural variation to a degree where the system isnever able to find a new stability point, and thescenario may be described as a chaotic regime(Fig. 6b), which will be followed by a catastrophicshift (Zeeman, 1976; Scheffer et al., 2001).
This interpretation is consistent with the fact that,through time, even in the short run, the highestvariations of the ecological indicators estimated arefound in this area (Marques et al., 2003). As a whole, thepresent results and conclusions appear to suggest thata possible recovery of the system should occur atdifferent critical conditions than the shift to the scenarioof macroalgal dominance, which is known as hysteresis
34 J. Patrıcio et al. / Estuarine, Coastal and Shelf Science 60 (2004) 23e35
(Scheffer et al., 2001), but at the present stage the datado not allow elucidation of this point and further workwill be necessary.
Ecology thus deals with some of the most complexphenomena encountered in modern science. Ecosystemanalyses must encompass several disciplines in a coordi-nated fashion to answer specific questions concerninghow large, multidimensional systems work (Livingstonet al., 2000; Jørgensen and Marques, 2001). Such re-search entails the integration of diverse studies, usuallyover a significant spatial area for intervals of time longenough to account for both seasonal and inter-annualvariability of basic physicalechemical and biologicalfactors. Such difficulties notwithstanding, network anal-ysis appears to provide a systematic approach to under-standing what is happening at the whole-system level.The current study on the Mondego estuarine ecosystemseems to have provided an example of how the measurescoming out of network analysis can lead to an improvedunderstanding of eutrophication process itself. Despitethe considerable time and labour needed to collect allthe data necessary to perform network analysis, theinsights the method provided seem to demonstrate itspromise as a very useful tool for ecosystem theory.
Acknowledgements
The present study was carried out in the scope of theresearch project DYNAMOD (POCTI/M6S137431/2001) and supported by FCT (Portuguese NationalBoard of Scientific Research) through a grant SFRH/BD/820/2000, by the Chesapeake Biological Laboratory,University of Maryland Center of Environmental Sci-ence, through a grant from the National ScienceFoundation’s Biocomplexity Program (Contract No.DEB-9981328), and by the IMAR-Institute of MarineResearch/FLAD Grants Programme. Special thanks goto S. Nors-Nielsen from Royal Danish School of Phar-macy,Denmark and J. J.Heymans fromFisheriesCentre,University of British Columbia, Vancouver, Canada.
References
Baird, D., MacGlade, J.M., Ulanowicz, R.E., 1991. The comparative
ecology of six marine ecosystems. Philosophical Transactions of the
Royal Society of London 333, 15e29.
Borum, J., 1996. Shallow waters and land/sea boundaries. In:
Jørgensen, B.B., Richardson, K. (Eds.), Eutrophication in Coastal
Marine Ecosystems. American Geophysical Union, Washington
DC, pp. 179e301.
Cardoso, P.G., Lillebø, A.I., Pardal, M.A., Ferreira, S.M., Marques,
J.C., 2002. The effect of different primary producers on Hydrobia
ulvae population dynamics: a case study in a temperate intertidal
estuary. Journal of Experimental Marine Biology and Ecology 277,
173e195.
Christian, R.R., Fores, E., Comin, F., Viaroli, P., Naldi, M., Ferrari,
I., 1996. Nitrogen cycling networks of coastal ecosystems: influence
of trophic status and primary producer form. Ecological Modelling
87, 111e129.Cloern, J.E., 2001. Our evolving conceptual model of the coastal
eutrophication problem. Marine Ecology and Progress Series 210,
223e253.
Connel, J., 1978. Diversity in tropical rain forests and coral reefs.
Science 199, 1304e1310.
Diaz, R.J., Rosenberg, R., 1995. Marine benthic hypoxia: a review of
its ecological effects and the behavioural responses of benthic
macrofauna. Oceanography and Marine Biology: an Annual
Review 33, 245e303.
Duarte, C., 1995. Submerged aquatic vegetation in relation to different
nutrient regimes. Ophelia 41, 87e112.Fasham, M.J.R., 1984. Flows of Energy and Materials in Marine
Ecosystems: Theory and Practice. NATO Conference Series IV.
Marine Science, Plenum, New York, 733 pp.
Finn, J.T., 1976. Measures of ecosystem structure and function derived
from analyses of flows. Journal of Theoretical Biology 41,
535e546.
Flindt, M.R., Kamp-Nielsen, L., Marques, J.C., Pardal, M.A., Bocci,
M., Bendoricho, G., Nielsen, S.N., Jorgensen, S.E., 1997. De-
scription of the three shallow estuaries: Mondego River (Portugal),
Roskilde Fjord (Denmark) and the Lagoon of Venice (Italy).
Ecological Modelling 102, 17e31.
Frontier, S., Pichod-Viale, D., 1995. Ecosystemes: structure, fonc-
tionnement, evolution, second ed. Masson, Paris, 447 pp.
Glansdorf, P., Prigogine, I., 1971. Thermodynamic Theory of
Structure, Stability and Fluctuations. John Wiley & Sons, London,
306 pp.
Hartog, C., 1994. Suffocation of a littoral Zostera bed by Enter-
omorpha radiata. Aquatic Botany 47, 21e28.
Holling, C.S., 1986. The resilience of terrestrial ecosystems: local
surprise and global change. In: Clark, S.C., Munn, R.E. (Eds.),
Sustainable Development of the Biosphere. IIASA, Cambridge
University Press, Cambridge, pp. 292e317.
Jørgensen, S.E., Johnsen, I., 1989. Principles of Environmental Science
and Technology. Elsevier, Amsterdam, 627 pp.
Jørgensen, S.E., Marques, J.C., 2001. Thermodynamics and ecosystem
theory, case studies from hydrobiology. Hydrobiologia 445, 1e10.Kay, J.J., Graham, L.A., Ulanowicz, R.E., 1989. A detailed guide to
network analysis. In: Wulff, F., Field, J.G., Mann, K.H. (Eds.),
Network Analysis in Marine Ecosystems: Methods and Applica-
tions. Springer-Verlag, Heidelberg, pp. 15e61.Lillebø, A.I., Flindt, M., Pardal, M.A., Marques, J.C., 1999. The effect
of macrofauna, meiofauna and microfauna on the degradation of
Spartina maritima detritus from a salt marsh area. Acta Oecologica
20, 249e258.Leontief, W.W., 1951. The Structure of American Economy
1919e1939. Oxford University Press, New York, 257 pp.
Livingston, R.J., Lewis III., F.G., Woodsum, G.C., Niu, X., Galperin,
B., Huang, W., Christensen, J.D., Monaco, M.E., Battista, T.A.,
Klein, C.J., Howell IV., R.L., Ray, G.L., 2000. Use of coupled
physical and biological models: response of oyster population
dynamics to freshwater input. Estuarine and Coastal Shelf Science
50, 655e672.
Marques, J.C., Andre, J., Girao, R., Goncxalves, F., Guilhermin, L.,
Mortagua, A., 1984. Estudo bionomico dos povoamentos bento-
nicos do estuario do Mondego (Portugal). Resultados preliminares.
Actas do 4( Simposio Iberico de Estudos de Benthos Marinho,
Lisboa, 21e25 Maio, vol. I, pp. 147e157.
Marques, J.C., Pardal, M.A., Nielsen, S.N., Jorgensen, S.E., 1997.
Analysis of the properties of exergy and biodiversity along an
estuarine gradient of eutrophication. Ecological Modelling 62,
155e167.
35J. Patrıcio et al. / Estuarine, Coastal and Shelf Science 60 (2004) 23e35
Marques, J.C., Nielsen, S.N., Pardal, M.A., Jørgensen, S.E., 2003.
Impact of eutrophication and river management within a frame-
work of ecosystem theories. Ecological Modelling 166 (1e2),
147e168.
Martins, I., Pardal, M.A., Lillebø, A.I., Flindt, M.R., Marques, J.C.,
2001. Hydrodynamics as a major factor controlling the occurrence
of green macroalgal blooms in a eutrophic estuary. A case study on
the influence of precipitation and river management. Estuarine and
Coastal Shelf Science 52, 165e177.
Monaco, M.E., Ulanowicz, R.E., 1997. Comparative ecosystem
trophic structure of three U.S. mid-Atlantic estuaries. Marine
Ecology and Progress Series 161, 239e254.Niquil, N., Arias-Gonzalez, J.E., Delesalle, B., Ulanowicz, R.E., 1999.
Characterization of the planktonic food web of Takapoto Atoll
lagoon, using network analysis. Oecologia 118, 232e241.
Nixon, S.W., 1995. Coastal marine eutrophication: a definition, social
causes and future concerns. Ophelia 41, 199e219.
Norkko, A., Bonsdorff, E., 1996. Population responses of coastal
zoobenthos to stress induced by drifting algal mats. Ecology
Progress Series 140, 141e151.
Odum, H.T., 1969. The strategy of ecosystem development. Science
164, 262e270.
Odum, E.P., 1971. Fundamentals of Ecology, third ed. Saunders,
Philadelphia, 588 pp.
Pardal, M.A., Marques, J.C., Metelo, I., Lillebø, A.I., Flindt, M.R.,
2000. Impact of eutrophication on the life cycle, population
dynamics and production of Ampithoe valida (Amphipoda) along
an estuarine spatial gradient (Mondego estuary, Portugal). Marine
Ecology and Progress Series 196, 207e219.
Pardal, M.A., Marques, J.C., Gracxa, M.A., 2002. Aquatic Ecology of
the Mondego River Basin. Global Importance of Local Experience,
Imprensa da Universidade de Coimbra, Coimbra, 576 pp.
Rafaelli, D., Raven, J., Poole, L., 1998. Ecological impact of green
macroalgae blooms. Oceanography and Marine Biology: an
Annual Review 36, 97e125.
Scheffer, M., Carpenter, S., Foley, J.A., Folke, C., Walker, B., 2001.
Catastrophic shifts in ecosystems. Nature 413, 591e596.
Ulanowicz, R.E., 1980. An hypothesis on the development of natural
communities. Journal of Theoretical Biology 85, 223e245.
Ulanowicz, R.E., 1986. A phenomenological perspective of ecological
development. In: Poston, T.M., Purdy, R. (Eds.), Aquatic Toxicol-
ogy and Environmental Fate. ASTM STP 921, vol. 9. American
Society for Testing and Materials, Philadelphia, USA. pp. 73e81.
Ulanowicz, R.E., 1997. Ecology, the Ascendent Perspective. Columbia
University Press, New York, 201 pp.
Ulanowicz, R.E., 1999. NETWRK 4.2a: A Package of Computer
Algorithms to Analyse Ecological Flow Networks. Solomons, MD,
USA.
Ulanowicz, R.E., 2000. Ascendency: a measure of ecosystem perfor-
mance. In: Jorgensen, S.E., Muller, F. (Eds.), Handbook of
Ecosystem Theories and Management. Lewis Publishers, Boca
Raton, pp. 303e315.
Ulanowicz, R.E., Norden, J.S., 1990. Symmetrical overhead in flow
and networks. International Journal of Systems Science 21 (2),
429e437.
Ulanowicz, R.E., Wulff, F., 1991. Comparing ecosystem structures: the
Chesapeake Bay and the Baltic Sea. In: Cole, J., Lovett, G., Findlay,
S. (Eds.), Comparative Analyses of Ecosystems: Patterns, Mecha-
nisms and Theories. Springer-Verlag, New York, pp. 140e166.Weaver, M.J., Magnuson, J.J., Clayton, M.K., 1997. Distribution of
littoral fishes in structurally complex macrophytes. Canadian
Journal of Fisheries and Aquatic Sciences 54, 2277e2289.Zeeman, E.C., 1976. Catastrophe theory. Scientific American 234,
65e83.