a case study in continuous monitoring - rutgers...
TRANSCRIPT
© 2009 Protiviti Inc. An Equal Opportunity Employer.0
Talecris Biotherapeutics: Talecris Biotherapeutics: A Case Study in Continuous MonitoringA Case Study in Continuous Monitoring
Anthony Chalker, CPA, CFF, CIA, CISAManaging Director Protiviti

© 2009 Protiviti Inc. An Equal Opportunity Employer.1
AgendaAgenda
• Background
• Business Challenge
• Business Environment
• Management System Overview
• Audit Needs
• Solution: Center Audit Scorecard
• How did we get to the final product – the “scorecard”?
• From Raw Data to Scorecard
• Value to Client

© 2009 Protiviti Inc. An Equal Opportunity Employer.2
Rutgers: Case Study with TalecrisRutgers: Case Study with Talecris
• Talecris Biotherapeutics implemented controls monitoring of financial transactions
• Mitigate control, error and fraud
• Rutgers Business School conducted study of Talecris implementation
• Report available at www.acl.com/rutgersstudy

© 2009 Protiviti Inc. An Equal Opportunity Employer.3
BackgroundBackground
Industry: Bio-Pharmaceutical and Manufacturing
Global company that utilizes human plasma to create products that treat life-threatening disorders in a variety of therapeutic areas.
A wholly owned subsidiary – a network of 60+ plasma collection centers.
Every day, approximately 7,000 donors flow through the centers.
Compensation for plasma donations is entirely cash- based, with over $2.5 million disbursed weekly.
Critical component of the Company’s overall success strategy. The Company can secure a safe and reliable supply of plasma for their products.
Subsidiary: A Number of Donor Centers

© 2009 Protiviti Inc. An Equal Opportunity Employer.4
Business ChallengesBusiness Challenges
• Rapidly growing business unit with 60+ center locations spread throughout a large geography.
• To assess internal controls at the centers, Internal Audit has to conduct “surprise” cash audits at all the centers nationwide.
• Internal Audit needs to effectively cover all of the locations in a proactive and timely manner while managing costs.
• System reports are not cash-focused; mainly focused on operations and marketing activities.
• Data not readily available and not well-linked in the database to provide quick reporting or data mining capabilities for audit purposes.
• Surprise cash audits done in silos. Internal Audit teams had visibility only to the centers they visited.

© 2009 Protiviti Inc. An Equal Opportunity Employer.5
Business EnvironmentBusiness Environment
• Heavily dependent in the past on manual processes for donor processing and donor payment.
• Outdated cash processes at the centers.
– Center Financial Workbooks are not up-to-date to reflect standardization of payment types and donor payment processing.
• Weak controls over cash management causing fraud activities.
– Clerks could alter the amount paid to the donor.
• Internal Audit needs to leverage the new management system to maximize its coverage while controlling its costs.

© 2009 Protiviti Inc. An Equal Opportunity Employer.6
Management System Overview Management System Overview
• Transition from a manual-based donor management process at all centers to a system-based process utilizing a management system.
• Automation of donor processing and donor payment.
• ATM-linked – use of cash is no longer needed unless ATM malfunctions.
• Donor-focused, not cash focused.
• Concerns: – Lack of system controls around handling of cash processes.
– Ability to modify system-generated amount to be paid to donors based on their donation activity.
– Ability to issue additional payments (bonus, inconvenience fees, etc.) to donors without additional approval controls.
– No standardized payment plans with minimum and maximum payment limits.

© 2009 Protiviti Inc. An Equal Opportunity Employer.7
Audit NeedsAudit Needs
• An independent internal assessment, improvement, and reporting tool.
• Define key metrics focused on cash management to assess control effectiveness and the centers.
• Prioritize “surprise” cash audits based on center’s risk level.
• Ability to drill down on the center’s cash activity.
– Use of Cash vs. ATM while ATM runs at 100% up time.
– Use of excessive bonus and inconvenience payments.
– Clerk’s misuse of payment plans.
– Trends on clerk’s usage of payment plans.
• Better method to measure and assess centers’ remediation and improvements based on prior audit findings.

© 2009 Protiviti Inc. An Equal Opportunity Employer.8
Solution: Center Audit ScorecardSolution: Center Audit Scorecard
Purpose:
To help establish a risk-based audit plan for the center audits. The scorecard allows Internal Audit to assess centers based on key metrics and to assist in the prioritization of centers for upcoming “surprise” audits.
Overview:
Identified 14 different risk metrics for the Scorecard, which are primarily directed at cash processes within the donor center.
•The Scorecard provides a risk rank for each individual metric by center.
•The Scorecard provides an overall risk value for all metrics relative to its ranking among all centers.

© 2009 Protiviti Inc. An Equal Opportunity Employer.9
Solution: Center Audit ScorecardSolution: Center Audit Scorecard
Key Features:• ACL is utilized to import and analyze raw financial transactional data
from the management system.• A custom-developed ACL script is run to calculate values for the 14
predetermined metrics. An output table is produced by the ACL script and imported into the Scorecard.
• The Scorecard incorporates and summarizes six months of data at a time.
• Centers are evaluated as high, moderate, or low risk – a classification which is user-defined according to the center’s risk ranking.
• Results can be viewed by metric, center, division, or region. • The Center Snapshot provides a specific month’s results at the
selected center; shows trends at the center over a six month time frame; and compares the center’s performance to other centers, division, and region.
• Data, summarized on the results of each center, is produced by the ACL script and available for further inquiry or investigations.

© 2009 Protiviti Inc. An Equal Opportunity Employer.10
Center SnapshotCenter Snapshot
Summary of metrics for a selected center
By selecting the Center name in the Center Snapshot tab of the Scorecard, users can view a high-level summary of the center’s performance for the period.
The Division and Region of the center are displayed dynamically based on the entries in the Center Setup.
Metrics are organized by category, and thus users can assess the center’s overall performance in a certain category. The lower risk rank, the higher risk level the center will be.

© 2009 Protiviti Inc. An Equal Opportunity Employer.11
Centers Comparison Centers Comparison
For an overall, aggregate center risk ranking, a center can be compared to another Center, to Period Average, Division Average, and Region Average. All comparisons are based on user selection from the drop- down list.

© 2009 Protiviti Inc. An Equal Opportunity Employer.12
How did we get to the final “product” – the
SCORECARD?

© 2009 Protiviti Inc. An Equal Opportunity Employer.13
Developing the ScorecardDeveloping the Scorecard……
• Understood the description of the problem from the Client
• Determined client functions and departments in scope
• Determined timeline and milestone expectations
• Discussed proposed approach and scope with the Client
• Obtained management buy-in
• Assessed client problem
• Understood “as-is” state and envisioned the end state
• Drilled down the problems / risks
• Submitted data requests to client personnel
• Review the data and process mapping to analyze the data
• Identified root causes
• Identified potential solution options
• Obtained management buy- in
• Prioritized and selected solution
• Prepared detailed design and recommendations
• Prepare road map for implementation
• Obtained management buy-in
• Implement solution
• Test and refine
• Validate results
• Train users / knowledge transfer
• Monitor solution
• Continuous improvement program
• Support client with new thinking / ideas

© 2009 Protiviti Inc. An Equal Opportunity Employer.14
Scorecard Data FlowScorecard Data Flow
In a nutshell, the data flows from the original source—the management system—into the Scorecard as follows.
Data Acquisition Data Validation & Analysis Results & Reporting
© 2009 Protiviti Inc. An Equal Opportunity Employer.15
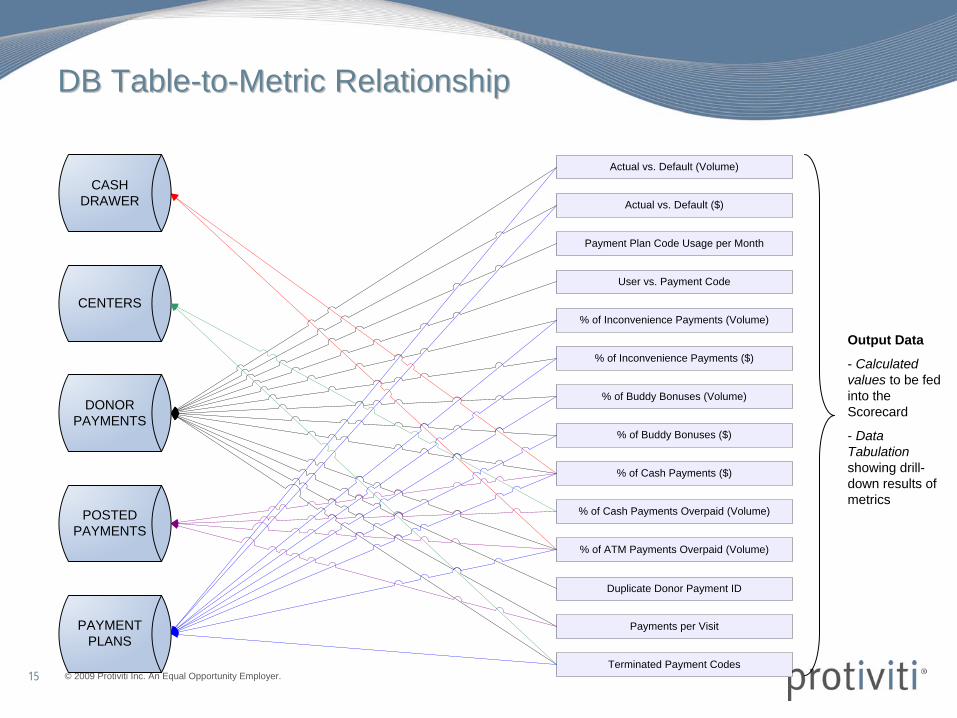
DB TableDB Table--toto--Metric RelationshipMetric Relationship
Actual vs. Default (Volume)
% of Cash Payments ($)
% of Inconvenience Payments ($)
User vs. Payment Code
Payment Plan Code Usage per Month
Actual vs. Default ($)
% of Inconvenience Payments (Volume)
% of Buddy Bonuses (Volume)
% of Buddy Bonuses ($)
% of ATM Payments Overpaid (Volume)
Duplicate Donor Payment ID
Terminated Payment Codes
Payments per Visit
CASH DRAWER
DONOR PAYMENTS
POSTED PAYMENTS
CENTERS
PAYMENT PLANS
% of Cash Payments Overpaid (Volume)
Output Data
- Calculated values to be fed into the Scorecard
- Data Tabulation showing drill- down results of metrics

© 2009 Protiviti Inc. An Equal Opportunity Employer.16
Value to ClientValue to Client
Automated Audit Scorecard with 14 metrics, evaluating centers by risk level.
-- Directing Internal Audit resources to the highest impact areas while continually monitoring the trending across all locations.-- Utilizing ACL to save audit costs while increasing focus and visibility across a rapidly growing business unit. Solution!
-- Quicker follow-up with the centers and their regional management.-- Reducing business disruption to the centers. Auditors showed up at the door of the center before it opened for the “surprise” cash audits. -- Ability to drill down to details on areas of high risk per center.
-- Monthly monitoring of cash activities based on the identified metrics.-- Broad visibility of all centers – allowing core teams to be able to identify not only issues and inconsistencies between centers, but potential best practices that should be shared with other centers.
© 2009 Protiviti Inc. An Equal Opportunity Employer.17
Anthony ChalkerManaging Director3343 Peachtree Rd.Suite 600Atlanta, GA 30326
Office: [email protected]